Article

Leaf Habit and Stem Hydraulic Traits Determine Functional Segregation of Multiple Oak Species along a Water Availability Gradient

1
Posgrado en Ciencias Biológicas, Unidad de Posgrado, Universidad Nacional Autónoma de México, Ciudad Universitaria, Coyoacán CDMX CP 04510, Mexico
2
Escuela Nacional de Estudios Superiores (ENES) Unidad Morelia, Universidad Nacional Autónoma de México, Antigua Carretera a Pátzcuaro 8701, Morelia, Michoacán CP 58190, Mexico
3
Instituto de Investigaciones en Ecosistemas y Sustentabilidad, Universidad Nacional Autónoma de México, Antigua Carretera a Pátzcuaro 8701, Morelia, Michoacán CP 58190, Mexico
4
Instituto de Biología, Universidad Nacional Autónoma de México, Ciudad Universitaria, Coyoacán CDMX CP 04510, Mexico
*
Author to whom correspondence should be addressed.
Forests 2020, 11(8), 894; https://doi.org/10.3390/f11080894
Submission received: 14 July 2020 / Revised: 7 August 2020 / Accepted: 13 August 2020 / Published: 18 August 2020
(This article belongs to the Special Issue The Physiology of Tree Response to Drought)

Abstract

:
Oaks are a dominant woody plant genus in the northern hemisphere that occupy a wide range of habitats and are ecologically diverse. We implemented a functional trait approach that included nine functional traits related to leaves and stems in order to explain the species coexistence of 21 oak species along a water availability gradient in a temperate forest in Mexico. This particular forest is characterized as a biodiversity hotspot, with many oak species including some endemics. Our main aim was to investigate whether the different oak species had specific trait associations that allow them to coexist along an environmental gradient at regional scale. First, we explored trait covariation and determined the main functional dimensions in which oaks were segregated. Second, we explored how environmental variation has selected for restricted functional dimensions that shape oak distributions along the gradient, regardless of their leaf life span or phylogeny (section level). Third, we quantified the niche overlap between the oak functional spaces at different levels. The analyzed species showed three functional dimensions of trait variation: a primary axis related to the leaf economic spectrum, which corresponds to the segregation of the species according to leaf habit; a second axis that reflects the stem hydraulic properties and corresponds to species segregation followed by phylogenetic segregation, reflecting some degree of trait conservatism, and a third axis, represented mainly by leaf area and plant height, that corresponds to species segregation. Finally, our findings indicated that the functional space measured with leaf traits and stem traits such as hydraulic capacity was integrally linked to niche differentiation. This linkage suggests that the earliest mechanism of species segregation was related to habitat suitability and that the stem hydraulic trade-off reflects differences between phylogenetic sections; these traits may promote coexistence between distantly related oak species.

1. Introduction

The habitat adaptation and distribution of plants are mainly conditioned by environmental filters, which determine successful plant establishment along resource gradients [1,2]. A functional trait-based approach is a key tool for delineating plant responses to environmental filters, since traits can be related to habitat suitability and resource availability gradients [3,4]. Plants species have leaf, stem and root functional traits that are directly involved in resource acquisition, use and conservation strategies (i.e., water, nutrients, light) [4]. Studies based on functional traits have demonstrated that niche partitioning can facilitate coexistence and segregation among plant species along resource gradients [5,6,7].
Water availability is one of the essential resources that determines the distribution of plant species [8,9]. Water availability determines whether the ecological strategies of plants are drought-tolerant or drought-avoidant, affecting the establishment and survival of species in a given community [10,11,12]. The capacity to act as a drought-tolerant or drought-avoidant species involves coordination among multiple organs and traits under different levels of water availability [9,13]. The stem plays a central role in mechanical support, water transport (movement) and nutrient supply [14,15,16]. Species with a drought-tolerant strategy have xylem traits, such as high wood density and narrow vessels, that allow them to operate under a water deficit; these traits create restrictions for water transport but provide greater hydraulic safety. In contrast, species with a drought-avoidant strategy have wide vessels that confer a greater capacity for water conduction and therefore provide a high water supply to the leaves but have low resistance to cavitation [17,18].
Drought resistance strategies may be aligned with the leaf economic spectrum (LES) [13,19], but some controversy still exists about LES among species [20,21]. The LES is defined by six leaf traits: leaf life span, leaf mass per area, photosynthesis and respiration rates and nitrogen and phosphorus concentrations [22,23]. Generally, the covariation of these leaf traits along the LES is interpreted to be driven by leaf physiological dependencies and trade-offs between resource acquisition and storage strategies in plants [22,23]. For instance, highly resource-acquisitive strategies have been inferred to require low investment and result in a high foliar concentration of nutrients but short leaf life spans (i.e., deciduous trees), while resource-conservative strategies with high investment have lower foliar nutrient concentrations but support leaves that last for much longer (i.e., evergreen trees) [24,25]. Central to LES theory are trade-offs between resource acquisition and storage strategies, which are often based on species that belong to phenotypically divergent clades for which the diversification process has taken place over hundreds of millions of years [26]; this is not necessarily the case for trait evolution among closely related species [26,27].
Oaks (Quercus L., Fagaceae) are a woody plant genus that occupy a wide range of habitats and are ecologically diverse [28,29]. Oaks possess high rates of speciation and high ecological diversification [30,31], and several factors, such as the emergence of deciduous leaf habits in the genus, seem to drive their successful spatial radiation [32]. The predominantly American oak lineages, comprising mostly species from the Lobatae (red oaks) and Quercus (white oaks) sections, represent a high proportion of the aboveground live biomass and biodiversity in forests [30,33].
In the mountainous areas of Mexico, oaks inhabit several ecosystems from deciduous to cloud forests [34,35,36]. More than 20 transitions have been identified in the evolution of deciduous to evergreen oak habits in the last 20 Myr [36]. Within Quercus, there are contrasting patterns of distribution between red and white oaks, and differentiation in their drought-tolerance capacity has been suggested; specifically, white oak species seem to be more drought-tolerant [8,37,38], but see Aguilar-Romero et al. [39] for contrasting results. Thus, habitat partitioning by oak species may be restricted by environmental adaptations and by phylogenetic relatedness given their conserved adaptations [39,40,41]. In this regard, the oak clade is considered a good model for analyzing functional and niche partitioning among species due to the wide range of habitats where they are present and their variation in key functional features in the community assembly process [30,40]. In this study, our main aim was to investigate whether the different oak species have specific trait associations that allow them to coexist along an environmental gradient at regional scale. For this, we implemented a functional trait approach, considering leaf and stem traits in 21 oak species distributed along a water availability gradient in a temperate forest in Mexico. We analyzed the leaf and stem trait variation that allows us to identify different ecological strategies. We hypothesized that environmental filters drive trait variation along the gradient, reflecting trade-offs between functional traits. We quantified the functional traits associated with the phylogenetic section and with leaf habits to determine whether oak species may be restricted by the environmental factors or by phylogenetic relatedness given their conserved traits. Additionally, we measured the variance in each functional dimension to explore whether the functional differentiation was related to the environmental gradient, the phylogenetic section, the leaf life span or the intraspecific variability. Finally, we calculated the functional space based on the leaf and stem traits for the phylogenetic section, the leaf habits and the species level to quantify the functional overlap, assuming that the differences in the functional space would reflect the different ecological strategies associated with coexistence and niche partitioning.

2. Materials and Methods

2.1. Study Site

This study was conducted in the floristic province of the Serranías Meridionales of Jalisco, in Western Mexico, which comprises the “El Tuito–El Cuale–Talpa de Allende” sierras (20°20.885′–20°9.008′ N, and 105°19.162′–104°40.106′ W). These mountain complexes are located within Cabo Corrientes and Talpa de Allende counties in Jalisco state, within the boundary limits of the biogeographic provinces of the Sierra Madre del Sur and the Trans Mexican Volcanic Belt, with an elevational gradient that ranges from 650 to 2738 m. The dominant groups of soil type are Cambisol and Regosol. The mean annual temperature ranges from 28.5 to 30.6 °C; the annual precipitation ranges from 1500 to 1800 mm, with 80% of the rainfall concentrated between June and October [42]. The main vegetation types are tropical deciduous forest at low elevations, passing through oak forest, pine-oak forest, montane cloud forest in glens and fir forest at high elevations [33,43]. The Serranías Meridionales of Jalisco is a biodiversity hotspot, with many tree species, including several endemic species of Quercus and Pinus, among others [44,45], and this could be one of the regions with the highest oak species richness in the world, reaching up to 30 oak species [33,46].

2.2. Leaf and Stem Trait Measurements

Based on previous woody tree plot surveys across the region (33 rectangular plots, 0.1 ha; [33]), we were able to locate 21 oak species along the study area and we proceeded to measure functional traits on them. In each plot, we quantified the leaf and stem traits associated with resource uptake and water-use strategy between five and 15 adult individuals of each oak species, sampling a total of 275 individuals belonging to the 21 oak species (Table 1). We selected trees with stem diameter >20 cm, and we measured the height (m), took a wood sample at 1.30 DBH, and ten mature sun-exposed leaves with no visible damage were collected per individual. The collection of material and the measurements of foliar functional traits were performed according to the protocol recommended by Pérez-Harguindeguy et al. [47]. The leaf features measured were leaf area (LA, total leaf area; cm2), specific leaf area (SLA; leaf area per unit of dry leaf weight; cm2 g−1), leaf dry matter content (LDMC; dry weight per unit of fresh water saturated weight; mg g−1), nitrogen concentration (N; mg g−1) and phosphorus concentration (P; mg g−1) (Table 2) (see Appendix A for leaf chemical analysis). To obtain the leaf area, the fully extended leaf with the petiole was scanned with an HP brand scanner at a resolution of 300 dpi and the leaf areas were estimated using ImageJ software (http://rsbweb.nih.gov/ij/ accessed on December 2017).
For stem traits, we sampled wood slides less than 5 cm in width at around 1.3 m trunk height. The wood density was determined by the water-displacement method in the laboratory [47], and other portions of the wood samples were fixed in glycerin–ethanol–water (1:1:1). In addition, transverse sections were cut 20 µm thick with a sliding microtome (Leica 2000 R, Westlar, Germany). The sections were double-stained with safranin-fast green and mounted with synthetic resin. For the vessel diameter (VD), a tangential vessel diameter of 50 vessels per individual was considered, using the image analyzer Image-Pro v.7.1 connected to an Olympus BX50 light microscope. The vessel frequency (VF) was calculated in one mm2, considering all the vessels within two of the widest rays in 25 optical microscopic fields. For VD and VF, the average for each of the 275 individuals was calculated for the analyses.

2.3. Leaf Life Span

We recorded the leaf life span of each species in the study area as an indicator of the water-use strategy in six to ten individual mature trees per species. We counted the number of leaves present in three sun-exposed terminal twigs, and we quantified the percentage of the total canopy cover every 30 days for one year (February 2017 to January 2018). We assigned the category of leaf habit based on the code proposed by Cavender-Bares et al. [8] for canopy foliation (see Appendix B).

2.4. Climatic Variables

Nineteen climatic variables were extracted for each plot. The climatic variables for the study site were obtained using the climatic surfaces reported by Cuervo-Robayo et al. [48] and interpolated using the thin plate smoothing splines algorithm implemented in ANUSPLIN 4.36 [49], using a digital elevation model at 60 m2 resolution. The aridity index proposed by the United Nations Environment Programme (UNEP) was calculated as a reflection of the water availability gradient in the region [50] (see Appendix C for the calculations) and ranged from subhumid (0.78 at low elevations) to humid (1.83 at high elevations).
To avoid multicollinearity among the environmental variables, we selected variables with biological significance and less correlation. The variables selected were (1) UNEP aridity index, (2) maximum temperature of the warmest month (mtwm), (3) minimum temperature of the coldest month (mtcm), (4) precipitation in the warmest quarter (pwq) and (5) precipitation in the coldest quarter (pcq).

2.5. Soil Characterization

Composite soil samples were collected during the rainy season (August and November 2016) in each plot. The samples were stored in hermetically sealed plastic bags and placed in darkness at 4 °C until laboratory analysis. A subsample of all the samples by plot was oven-dried at 70 °C for 72 h to a constant weight for moisture determination by the gravimetric method and water content adjustment to express the nutrient concentration on a dry soil mass basis. For the fresh soil samples, the pH was measured in deionized water (soil/solution ratio, 1:2 w/v and litter/solution ratio 1:5 w/v) with a pH meter equipped with a glass electrode (Corning). The total carbon (C) was determined with a total carbon analyzer UIC model CM5012 (Chicago, IL, USA) by combustion and coulometric detection [51]. The total nitrogen (TN) and total phosphorus (TP) were analyzed colorimetrically and were determined following acid digestion in a mixture of concentrated H2SO4 and K2SO4 plus CuSO4, the latter as a catalyst; TN was determined by the micro-Kjeldahl method [52], and TP was determined by the molybdate colorimetric method following ascorbic acid reduction [53]. The available inorganic nitrogen (NH4+ and NO3) was extracted from 10 g fresh soil subsamples with 2 M KCl, followed by filtration through a Whatman No. 1 paper filter, and it was then determined colorimetrically by the phenol-hypochlorite method [54]. Later, the soil sample weight was corrected for moisture content.

2.6. Data Analysis

For the statistical analyses, the oak species were sorted into different groups according to section—Quercus or Lobatae—and leaf habit—evergreen, deciduous or brevi-deciduous. A principal component analysis (PCA) was performed with the whole set of leaf and stem traits for 275 oak individuals. To determine the sources of variation in the PCA, we partitioned the total variance of each PC according to the variance explained by differences among factors analyzed as phylogenetic sections, leaf habits, traits among and within species and habitat measured as the variation among plots. We followed the nested random effects model proposed by Michelaki et al. [55], using the following syntax: PC ~ (1|section/leaf habit/species/habitat) + (1|habitat). Then, to understand whether the variance explained by the main explicative factor (e.g., leaf habit) is due to the differences between levels of this factor (i.e., if the variation observed in the previous analysis is due to differences among deciduous, brevi-deciduous and evergreen habits) or to the intrinsic variation within each level of this factor (i.e., if the variation observed in the previous analysis is due to the differences within deciduous, within brevi-deciduous or within evergreen groups), we ran a test to assess whether the interspecific variability depends on the leaf habits and phylogenetic section by partitioning the total variance in each PC axis among levels (e.g., leaf habits and species within leaf habits; [56]). This analysis between levels of factors was performed for PC1 and PC2 by the main explicative factor in the nested random effects models.
To determine whether oak species may be restricted by the environmental factors, we used generalized linear mixed models (GLMM) (considering species as a random variable) to assess whether the PCA scores of the first three components differed among all possible combinations of the following fixed explanatory factors: climatic and soil variables. We first tested the models for each explanatory factor and function independently. Secondly, to avoid the overestimation of the models with spurious parameters that had very poor weights on the models [57], we only fitted two-factor models using those environmental factors that had an effect on the different functional parameters when evaluated independently. We tried alternative models in which the second environmental factor was added either additively or multiplicatively. Then, we made a comparison of the candidate model containing a term of interest to the corresponding “null” model lacking that term, which assumes no effect of any factor [58]. The best models were selected using their Akaike information criterion corrected for small sample sizes (AICc) between the null model and the candidate models [59]. Finally, we measured the proportion of explained variance in the best models by the Nakagawa and Schielzeth [60] method, which returns two complementary R2 values: the marginal R2 encompassing variance explained by only the fixed effects and the conditional R2 comprising variance explained by the whole model (fixed and random effects). To fulfil the assumptions of normality and homoscedasticity, climatic and soil variables were transformed with log10(x) or log10(x + 1) if the values were low or close to zero.
The functional space of the oaks was calculated through an n-dimensional hypervolume approach [61] based on Hutchinson’s multidimensional niche concept [62]. The hypervolumes constructed from the functional traits represent axes of plant strategy variation, characterized by the phenotypic space occupied by a set of species [63]. This approach allows us to quantify functional spaces by assessing the functional trait space occupied by a set of species from different phylogenetic sections or leaf habits [6,61].
We used the first three PC axes (previously calculated) to reduce the number of dimensions in order to calculate the hypervolume for each section, leaf habit category and oak species level using a multidimensional kernel density estimation procedure [61]. We calculated the overlap between the hypervolume of each section, for each leaf habit and for each oak species, with a correlation analysis of the “hypervolume” package, which compares the similarity between different hypervolumes using the Sørensen functional similarity index. The Sørensen similarity index estimates the intersection between two hypervolumes (given two hypervolumes A and B, S(A,B) = 2*|A ∩ B|/(|A| + |B|) ranging from 0 (both input hypervolumes are fully disjunct) to 1 (both input hypervolumes are identical) [61,64]. We compared the environmental characteristics of each pair of oak species to distinguish between zero functional space overlap due to functional space segregation of the same environmental characteristics or due to a significantly different environmental characteristic. We first performed a PCA with the five environmental variables by plot. Then, we subjected the first two component scores to a one-way multiple analysis of variance (MANOVA) for each pair of oak species in their respective plots in search of environmental differences. The MANOVA values for environmental characteristics for species pairs were considered significant at (p < 0.05). Finally, a canonical correspondence analysis (CCA) was conducted to relate the oak community composition to the environmental variables. We performed 999 permutations to evaluate the significance of the CCA model.
Analyses were calculated with the packages “vegan” ver. 2.5 [65], “ade4” ver. 1.7 [66], “nlme” ver. 3.1 [67], “lme4” ver. 1.1 [68], “MuMIn” ver 1.43.6 [69] and “hypervolume” ver. 3.4.3 [61,70] in R software ver. 3.5 [71].

3. Results

The first three components of the PCA performed on the whole set of leaf and stem traits explained 56.1% of the total variance (Figure 1). The first axis (PC1, which explained 27.6% of the variance) was related to the trade-off between specific leaf area (SLA) and leaf dry matter content (LDMC). This reflects the leaf economic spectrum (LES), which refers to the trade-off (negative relationship) between resource acquisition and storage strategies in plants. The second axis (PC2, which explained 16.3 % of the total variance) was mainly explained by the stem hydraulic properties with the vessel diameter and vessel frequency; this stem hydraulic trade-off means that mechanical support will be negatively related to storage or conduction. Finally, the third axis (PC3, which explained 12.7% of the total variance) was represented mainly by variations in leaf area (LA) and plant height (see variable scores in Appendix D).

3.1. Variance Partitioning of Functional Traits

The results for the functional trait space variation based on the variance explained by the differences between factors (phylogenetic sections, leaf habits, among and within species and habitat) showed that each PC had different sources of variation. Most of the variance explained in PC1 was attributed to differences among leaf habits (58% of the total variation), followed by interspecific variability (32%). For PC2, most of the variation depended on differences among species (40%), followed by differences between sections (28%). For the PC3, most of the variation was due to the higher effect of the differences among species (50%) than of differences between sections (14%). The percentage of the variance explained by the intraspecific variability and the habitat was low (Table 3). In addition, the variance within factors showed contrasting patterns among the PC1 and PC2 (Figure 2); the variation in PC1 was mostly attributable to the differences among deciduous, brevi-deciduous and evergreen trees (76%), while the differences in PC2 were mostly related to the variation within each level of the factor. Thus, most of the variation was related to species variations within the Lobatae (51%) and Quercus (33%) sections.

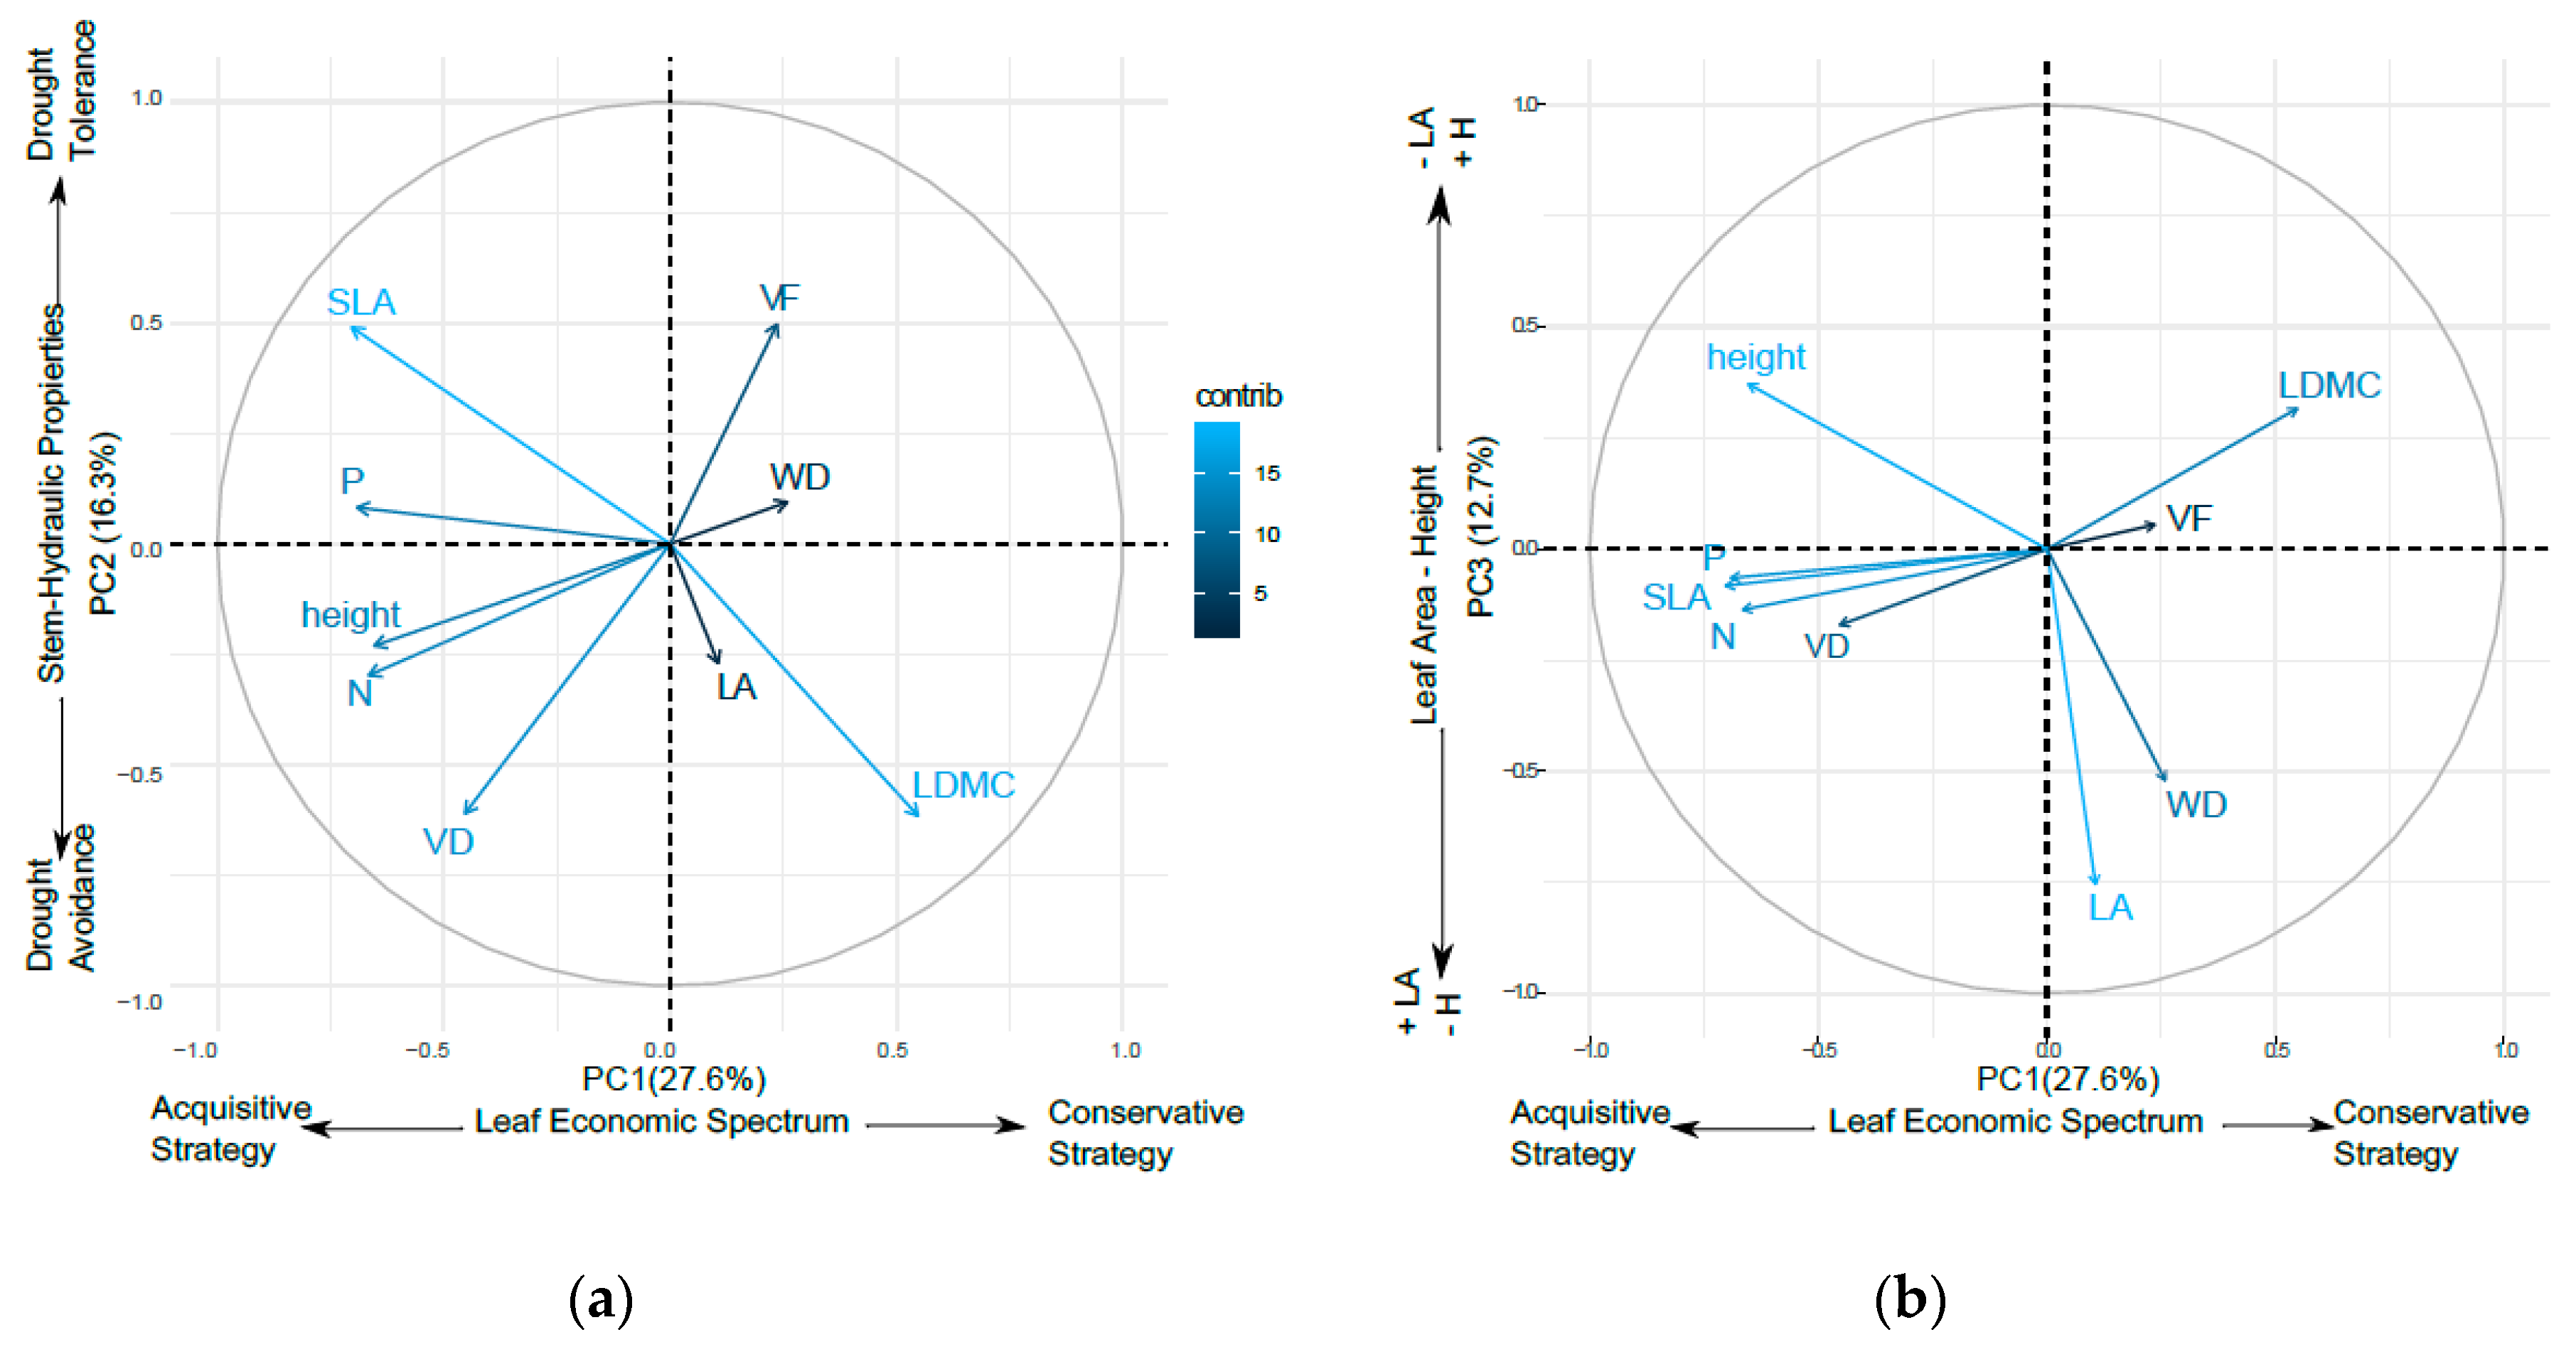
3.2. Oak Functional Strategies

The GLMMs showed that the functional trait structure of the oak species studied was mostly determined by the UNEP aridity index, and a secondary influence was exerted by the seasonal conditions of precipitation and temperature (Table 4). The PC1 (LES) showed a positive relationship with the UNEP aridity index and with the precipitation in the warmest quarter (R2m = 0.09; R2c = 0.30). PC2 (stem hydraulic traits) had a positive relationship with the UNEP aridity index and with the maximum temperature of the warmest month (R2m = 0.05; R2c = 0.23). PC3 (leaf area-height; LA-H) had a positive relationship with the aridity index and with the precipitation in the coldest quarter (R2m = 0.16; R2c = 0.40). Oak species reflect a continuous range of leaf and stem hydraulic strategies along the water availability gradient, where precipitation and temperature of the warmest months are extremely relevant because they determine the highest level of drought stress. Additionally, sites with high values of precipitation in winter showed higher values of plant size (i.e., height) and a reduced leaf area; in contrast, drier conditions promote the presence of oak species with lower sizes and higher leaf area values.

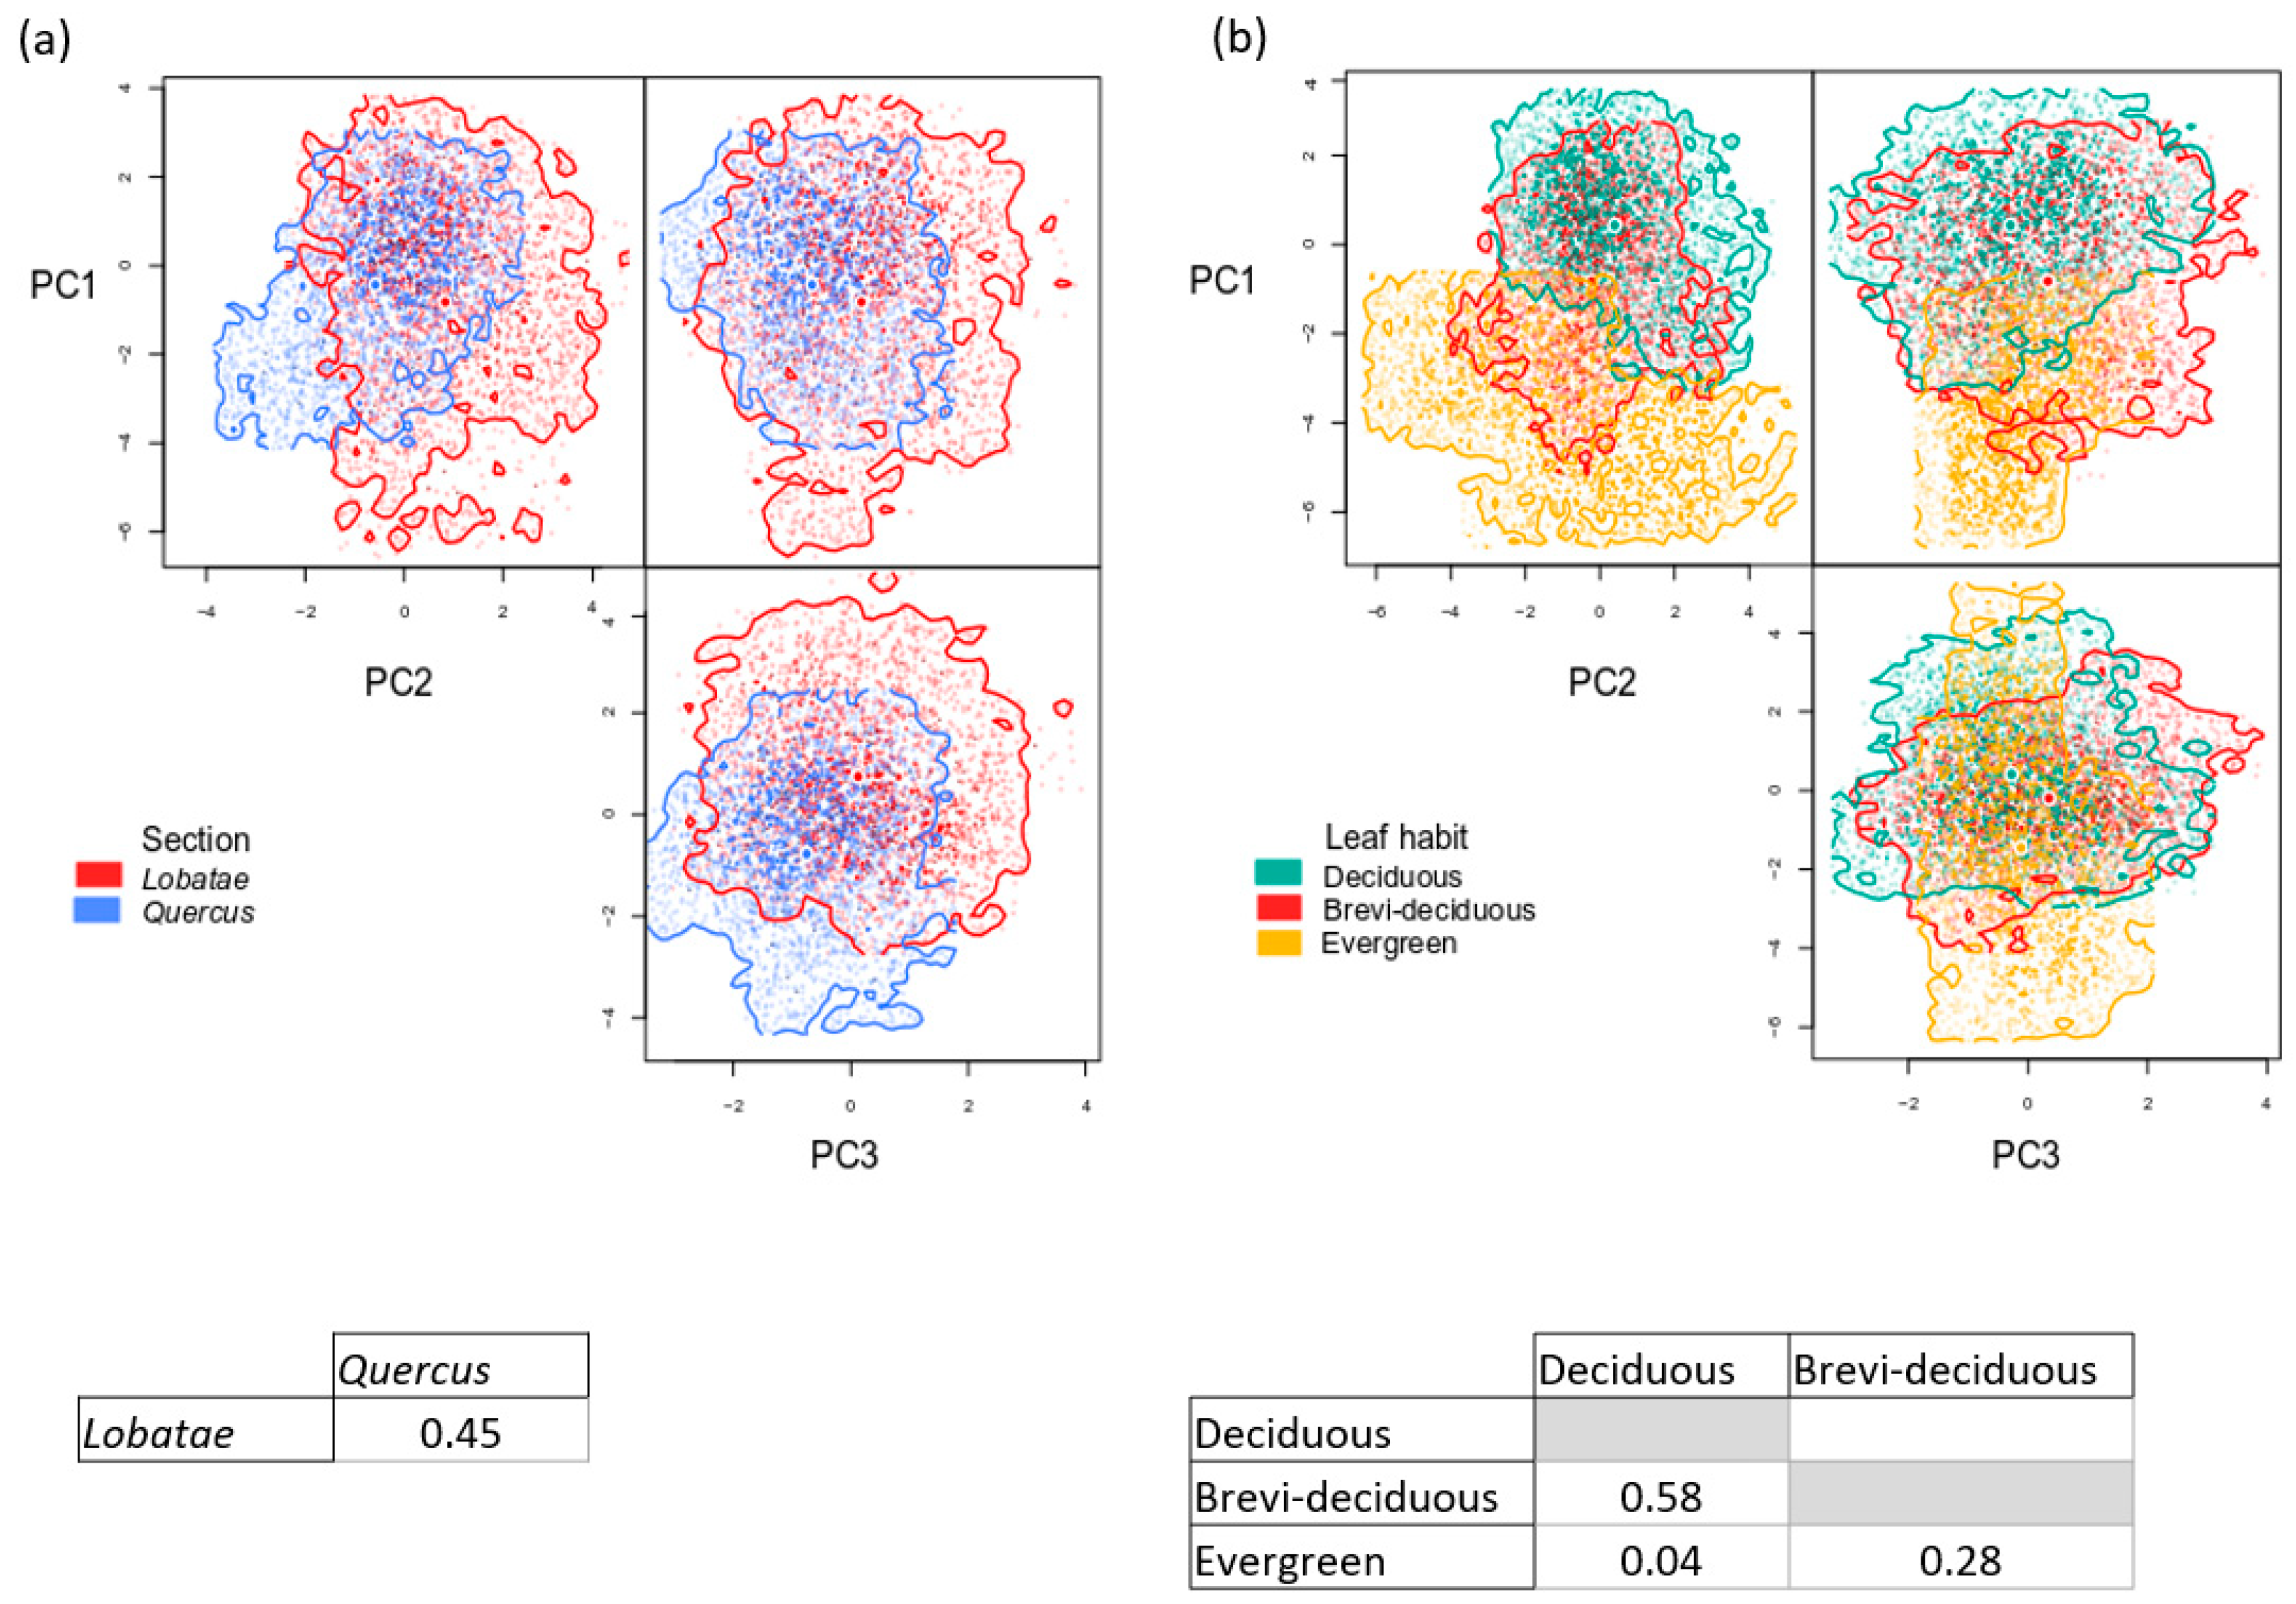
3.3. Functional Space and Overlap

The results of the hypervolume analysis showed that the overlap between Lobatae and Quercus sections was 45% (Figure 3a), which suggests functional trait segregation between both sections. The functional space assessed by leaf habit showed that brevi-deciduous species had the largest functional space, with an overlap of 58% with the deciduous species and a smaller overlap (28%) with the evergreen species. Finally, the deciduous species had low overlap with the evergreen species, of 4% (Figure 3b). The degree of hypervolume overlap among sections and leaf habit ranged between 4% and 58%, which indicates that oak trait space occupation is very variable.
At the species level, to measure the functional overlap, we calculated 210 species pairs. Of these, 62 species pairs (32%) showed zero functional overlap, and these pairs differed significantly in their environmental characteristics (see Appendix E for Sørensen similarity index among oak species pairs, Figure A1). Deciduous red oak species showed a between-species functional overlap ranging from 3% to 31% (Figure 4) and showed larger overlap with the deciduous white oaks (from 12% to 45%), followed by the brevi-deciduous red (1% to 42%) and white (6% to 36%) oaks, in species pairs that did not differ significantly in their environmental characteristics. Deciduous white oak species showed a between-species functional overlap that ranged from 3% to 49%, with a smaller overlap with the brevi-deciduous red oaks (from 2% to 39%) in similar environments. However, in sites that were significantly different in their environmental characteristics, they showed a larger overlap (from 2% to 58%).
The brevi-deciduous red oaks showed a between-species functional overlap ranging from 0% to 63%. When the environmental characteristics did not differ significantly, the brevi-deciduous red oaks showed a smaller functional overlap with the brevi-deciduous white oaks (1% to 37%) and with the evergreen oaks (1 to 5%). The two brevi-deciduous white oaks (Q. glaucescens and Q. obtusata) showed a functional overlap of 47%, although their environmental characteristics were significantly different. These brevi-deciduous white oaks showed a smaller overlap with the evergreen species (2% to 12%). Finally, the two evergreen species, Q. aff. uxoris (red oak) and Q. martinezii (white oak), showed low functional overlap and similar environmental characteristics.
The results of the canonical correspondence analysis of the first two axes of the CCA explained 0.29 of the total variation (CCA1 = 0.82, p < 0.001; CCA2 = 0.63, p < 0.001). The first axis was dominated by the UNEP aridity index and the second axis was dominated by the precipitation of the warmest quarter (Figure 4).

4. Discussion

4.1. Oaks Functional Strategies for Water Use

Oak species present a wide range of morphological and physiological responses to different environmental conditions [38,40] such as water availability [9,72,73]. We identified trait covariation from the PCA analysis in leaf and wood traits that responded to the water availability gradient in combination with the seasonal regimens of temperature and precipitation.

4.1.1. Leaf Economic Spectrum and Leaf Life Span Strategies

The LES theory is mostly related to the trade-off between high resource acquisition and resource conservation [23]. The first axis (PC1) was defined by the negative correlation between SLA and LDMC in the resource acquisition strategies defined by the LES; thus, at one end of the axis, we found oak species with high SLA (such as Quercus tuitensis), while at the opposite end were the species with the highest LDMC (such as Q. mexiae). The partition variance analysis on the LES axis showed that the leaf habit explains most of the variation and indicates that, within each foliar habit, there is a great variation in responses. In addition, the role of interspecific variability is greater than intraspecific variability. This one may differ among traits, species, or among the biogeographical selected range [74]. Previous studies within oak populations and among oak species [9,31,75] have found leaf trait variation along aridity/precipitation gradients, according to the LES expectations.
In our study, the LES in oak species is determined by the aridity index and the interaction of the precipitation in the warmest quarter, which determine the level of drought stress to which plants are exposed. For instance, the spring precipitation in combination with the spring maximum temperatures will determine the highest level of drought stress and, as consequence, will determine the ecological strategy for resource acquisition and storage, such as deciduousness [11,76]. Deciduous and brevi-deciduous species drop their leaves during dry seasons or freezing temperatures to reduce water loss and costs via transpiration, maximizing their carbon uptake and nutrient use when water availability is not limited [19,24]. In contrast, a shorter dry season and less severe drought in ecosystems usually promote species with longer leaf life spans that retain their leaves throughout the dry season [1,11,76]; other studies found that soil depth and rooting depth can favor evergreen species in seasonally affected areas [24,36].
This convergence of ecological strategies along resource and elevation gradients has been reported previously in tree species [25,77]. The high temperatures in the Serranías Meridionales of Jalisco in spring and the reduced amount of precipitation along the gradient could lead to trait convergence to acquisitive strategies such as deciduousness in oak species. At the driest part of the gradient, we found deciduous and brevi-deciduous species that show resource-acquisitive leaf traits, such as Q. liebmannii, Q. tuitensis, and Q. glaucescens, which are the characteristic species of the transition zone between tropical deciduous forest and oak forest [78]. On the other side of the gradient, brevi-deciduous and evergreen oak species located in humid areas of the gradient show a more conservative strategy, such as Q. martinezii and Q. laurina, which are typical species confined to high elevations and montane cloud forest [33,78].

4.1.2. Stem Hydraulic Strategies

The stem hydraulic properties in this study are explained by a negative correlation between the vessel diameter (VD) and the vessel frequency (VF). This stem hydraulic trade-off has been shown in previous studies and means that mechanical support will be negatively related to storage or conduction along the water availability gradient [15,16,79]. However, it is important to incorporate data on the fraction of fibers and axial and radial parenchyma to support this hypothesis, as well as to incorporate data from other species to understand the xylem variation and how species invest differently in support and transport in different environmental conditions [80,81]. Vessel diameter is one of the most important wood anatomical characteristics that determines the adaptation of plants to drought [79,82]. It is considered a characteristic with a strong phylogenetic conservatism for oaks [8] and other species [82,83]. We found strong species segregation in the variance, which was attributed to interspecific differences, followed by differences in phylogenetic sections. The section Lobatae contained most of the variation, reflecting that the VD/VF relationship can lead to various drought strategies, from a drought-tolerance strategy with narrow vessels (98 µm/10 per mm2; Q. jonessi) to a drought-avoidance strategy with wide vessels (241 µm/5 mm2; Q. laurina). In the section Quercus, the VD/VF relationship ranged from 152 µm/8 mm2 (Q. magnoliifolia) to 284 µm/6 mm2 (Q. martinezii).
In agreement with several studies in angiosperms, narrow vessels with a high frequency lead to greater hydraulic safety because of the lower risk of vessel implosion and cavitation related to the redundancy of vessels [16,84]. The narrower xylem vessels indicate that oak species are more drought and embolism resistant [40], as we found in red oaks in drier sites. This supports the idea that red oaks possess drought tolerant strategies, as shown by Aguilar-Romero et al. [39]. White oak species showed wider vessels with less variation than red oaks. Lobo et al. [40] found that Quercus petraea (white oak) has wider vessels with no variation along an aridity gradient, suggesting that other anatomical features could provide drought tolerance in this species.
Vulnerability to embolism depends on several anatomical traits in addition to vessel size, such as vessel frequency [85], the presence of more fiber cells between adjacent vessels [86], and the thickness of the pit membranes between two adjoining vessels [87]. Wide vessels in dry habitats are efficient water conductors but are mechanically weaker than narrower vessels. Therefore, one evolutionary strategy involves generating a mixture of wide and narrow vessels or vasicentric tracheids in the wood [84]. Vasicentric tracheids are wood anatomical features that provide support around the vessels under water stress, maintaining a minimally conductive stream [88]. It has been suggested that the presence of these tracheids in the Fagaceae family could provide them with the ability to spread readily from wet tropical forests into temperate areas that have a dry season [15]. This anatomical feature has been reported in oaks and other dry-habitat species [88], suggesting that it is an important trait that allows plants, especially oaks, to survive during drought conditions [89]. However, more research on this anatomical feature is needed.
Functionally, drought-tolerant and drought-avoidant strategies of water use should be coordinated between leaf and wood tissues [2,4,18]. Vessel diameters and wood tissues show a mixture of genetic control and plasticity depending on the environment [83]; it has been reported that the leaf habit (e.g., retaining leaves) can influence plasticity levels in some xylem characteristics [82]. We found that some deciduous species possess wide vessels and higher content of water in the stem tissue, which is typically due to an elevated proportion of parenchyma for storing reserves. This reflects that some leaf traits (in this case, LES) can act in a way that is not coordinated with the wood traits [20], as demonstrated in other studies of particular taxa [90,91].

4.1.3. Leaf Area and Plant Height

Variations in leaf area and plant height made up the third axis of variation, in which the interspecific differences explained most of the proportion of variance. Plant height is a major determinant of a plant’s ability to compete for light; it determines how leaf microenvironments regulate various leaf morphological and physiological traits [92,93].
Leaf area has important consequences for leaf energy and water balance; leaves of different sizes growing in the same habitat are expected to have distinct thermal regulation abilities, which influence leaf water loss and heat shedding [2,23]. Despite the considerable interspecific variation in leaf area and plant height that exists along the gradient, we observed a relationship with the precipitation in the coldest quarter: taller oak species with long elliptic-lanceolate leaves had medium leaf area values, such as Q. laurina (LAMEAN = 21.6), while in contrast, smaller trees with wide obovate and concave leaves had high leaf area values, such as Q. jonesii (LAMEAN = 97.7). Oak species have high levels of plasticity at the leaf level and show high morphological and leaf area variation [30,73]. Several factors, such as ontogeny, genotype, and environmental interaction, affect leaf traits; these factors are also important to consider at the individual level in order to understand the plasticity of the species [94]. Additionally, it has been shown that the variations in tree height and leaf area were largely independent of the variations in traits represented in the LES [95].

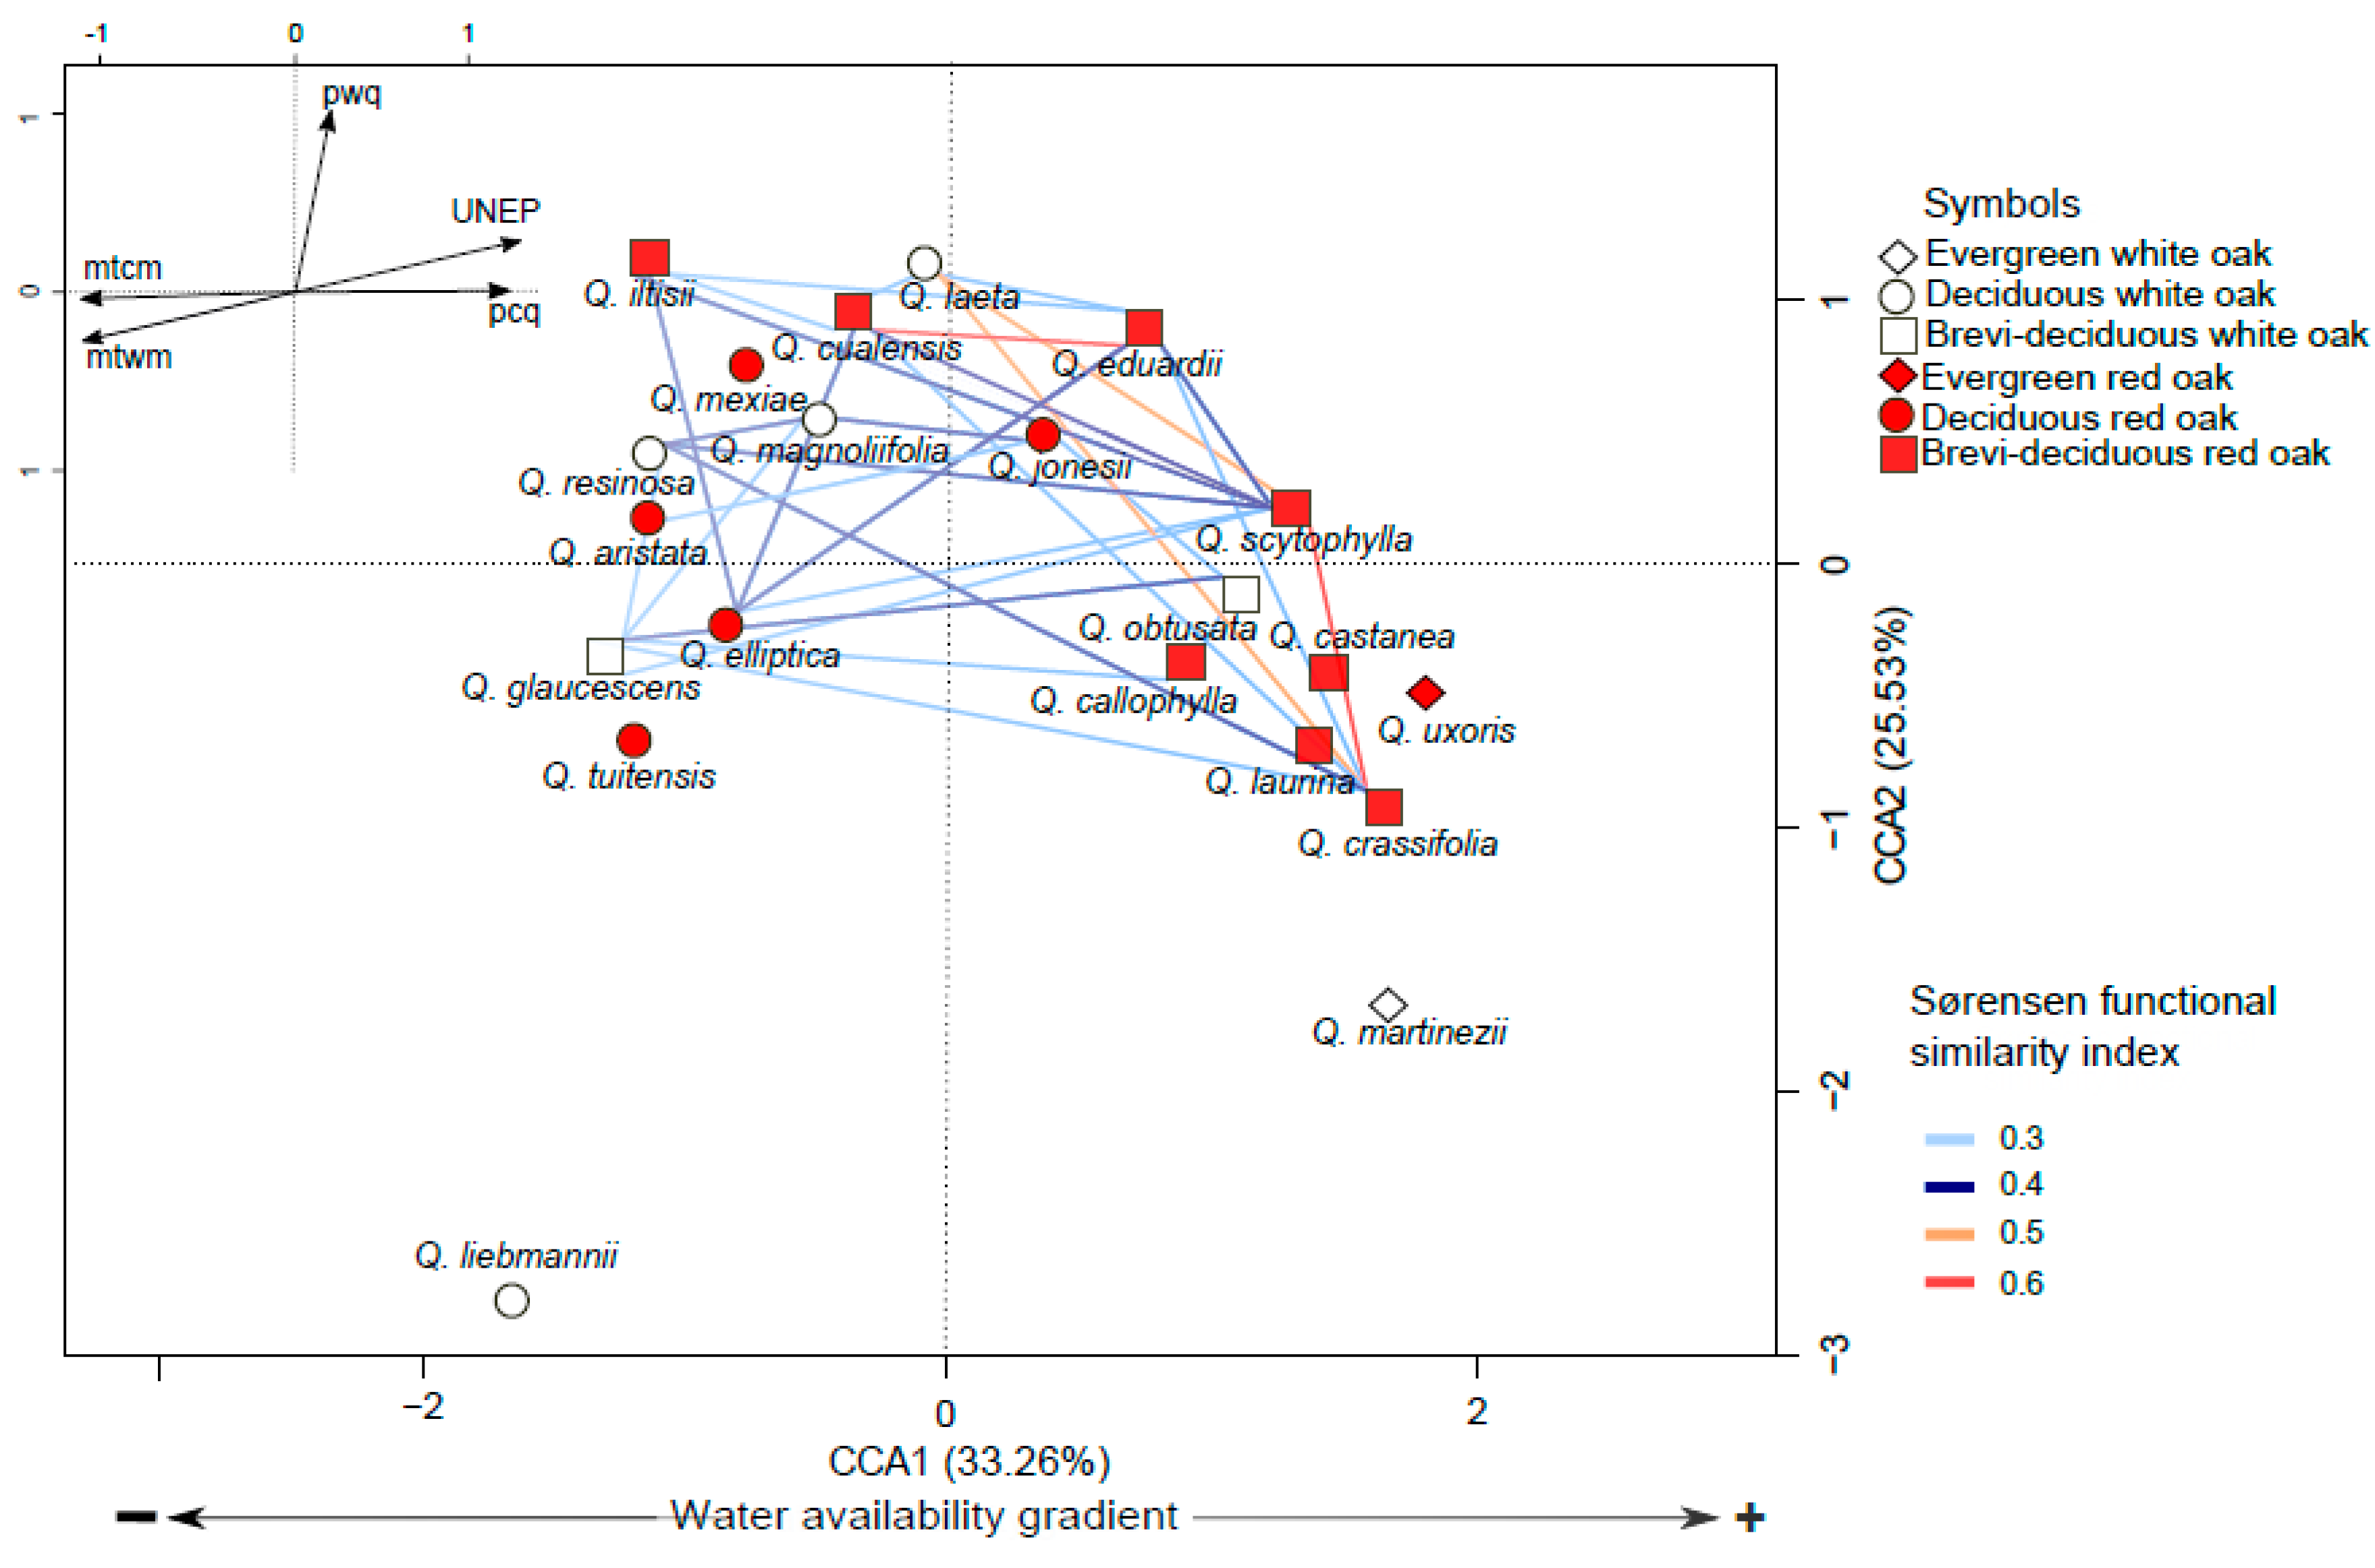
4.2. Variation in Functional Traits and Niche Segregation

Functional traits determine the main components of individual performance, as well as being useful to detect interactions between plants [2,3]. Traditionally, some traits have been used to support resource partitioning and niche segregation, but none associated with the niche differences that stabilize species coexistence [7,96]. However, this differentiation has been only detected when considering multiple axes of trait variation together (i.e., phenology, seed size, height, SLA, wood density, specific root length), suggesting that the maintenance of species diversity has a multidimensional nature [7,97]. We documented the variation in the functional space of oak species at different levels (section, leaf habit, and species), in agreement with several studies demonstrating that niche partitioning can facilitate coexistence among species (i.e., [1,6,7]). We also documented that the variation in leaf traits and the stem hydraulic structures play a central role in functional differentiation among oaks. The differences in leaf life span may facilitate the coexistence of oaks in their functional spaces, as shown by the functional overlap among leaf habits and species level. The functional space overlap between deciduous and evergreen species is exceptionally low, which suggests that the first strong mechanism of species segregation was related to environmental characteristics and habitat suitability [6]. In this sense, deciduous and brevi-deciduous oaks are characteristic of temperate ecosystems in tropical regions [36], where deciduousness could be considered a facultative strategy that allows them to be effective competitors by fully or partly shedding their leaves during the dry or winter season to reduce water loss [25].
The functional space overlap of deciduous and brevi-deciduous oak species is high. Despite this finding, some environmental and functional segregation exists that allows them to reduce the competitive pressure for resources. For example, Q. laeta (white deciduous) and Q. cualensis (red brevi-deciduous) coexist in the pine-oak forest in the Serranías Meridionales of Jalisco at an elevational range of 1800–2300 m [33,46] and showed a functional overlap of 39%. Quercus cualensis and Q. iltisii (red brevi-deciduous) showed a functional overlap of 30% but have significantly different environmental characteristics. Quercus iltisii is a lowland species (1000–1500 m) that is mainly distributed in tropical subdeciduous forests and the oak-pine forest ecotone. These findings demonstrate environmental and elevational characteristics and segregation in the study site [33,46].
Seasonal temperature and precipitation regimes are important environmental filters that determine the viability of ecological drought strategies in plants [40,98] and explain the adaptive differentiation of populations within oak species [9,36]. In oaks, within the red section, divergent leaf trait evolution has been shown to be independent of phylogenetic relationships that could provide functional complementarity among some red oak species [8].
Cavender-Bares et al. [99] stated that the diversity of oak species in a region depends on the rate of evolution of different traits, and labile traits are critical for lineages to switch between available habitats and community types, while conserved traits are those that facilitate coexistence. Here, we documented that leaf traits reflect the LES across a wide range of variation as a reflection of habitat suitability among several species and that wood traits showed a stem hydraulic trade-off in vessel diameter and frequency that reflects phylogenetic section differences; these traits may promote coexistence between distantly related oak species. We propose that these traits contribute to explaining the coexistence of the high number of Quercus species with high endemism existing in the hotspot of Serranías Meridionales of Jalisco in Mexico [33,44].

5. Conclusions

Oak species in the Serranías Meridionales of Jalisco showed three functional dimensions: a primary dimension that reflects the LES that corresponds to the leaf habit; a second dimension that includes the stem hydraulic properties that show a phylogenetic component, in which red oaks are able to share resources with distantly related species (white oaks species), and the third dimension was represented mainly by leaf area and plant height. Our findings indicate that the functional space, measured with leaf and stem traits such as hydraulic capacity, is linked to this niche segregation. Incorporating the variation in functional traits caused by phenotypic plasticity in a region can provide a better estimate of the functional space for different species by localizing the range of trait values. It is important to remember that trait plasticity promotes species coexistence across environmental gradients by enhancing and stabilizing niche differences and by generating competitive trade-offs between species. However, a trait-based approach to the quantification of species niche parameters remains challenging because of the difficulty of selecting traits that are specifically related to biotic versus abiotic filtering processes [100]. Finally, it is necessary to incorporate more studies under controlled conditions to understand the different variation strategies of the genus Quercus in order to understand the differential variation in the traits of co-occurring species.

Author Contributions

Conceptualization, M.A.-N., A.T.-M., and K.O.; methodology, M.A.-N., F.G.-O., and T.T.; supervision, F.G.-O. and K.O.; funding acquisition, K.O.; M.A.-N. wrote the first draft of manuscript. All authors contributed to the discussion, revision, and improvement of the manuscript. All authors have read and agreed to the published version of the manuscript.

Funding

This research was funded by CONACYT CVU/grant number 440679/271063 to M.A.-N.; DGAPA PAPIIT IV, 201016 to K.O., and IA208218 to A.T.M.

Acknowledgments

We thank to R. Velázquez-Durán for leaf and soil nutrient analyses. We also thank R. Aguilar-Romero, A. Pérez-Pedraza, C. Ortega-Martínez, J. Reyes-Galvez, J. Piña-Torres, D. Castillejos, H. Arenas-Navarro, and G. López-Segoviano for assistance with the field work. We thank S. Valencia-Á. for species identification. We thank social service students from Biogeography Conservation and Climate Change laboratory at ENES-Morelia for assistance. We especially thank the people of the Ejido Provincia, El Cuale, La Cumbre and county of Talpa de Allende for access to facilities and the study site. This paper constitutes a partial fulfillment of the Graduate Program in Biological Sciences of the National Autonomous University of Mexico (UNAM) for M.A.-N.

Conflicts of Interest

The authors declare no conflict of interest.

Appendix A. Leaf Chemical Analysis

Chemical composition was determined for a mixture of dry leaves from five different individuals per species per plot. Nitrogen (N) and phosphorus (P) forms were analyzed colorimetrically using a Bran-Luebbe Auto Analyzer 3 (Norderstedt, Germany). N and P were determined following acid digestion in a mixture of concentrate H2SO4 and K2SO4 plus CuSO4, the latter as a catalyst; N was determined by the micro-Kjeldahl method [52] and P by the molybdate colorimetric method following ascorbic acid reduction [53].

Appendix B. Leaf Habit Category

The category of leaf habit based on the code proposed by Cavender-Bares et al. [8] for canopy foliation was averaged for six to ten individuals per species over one year. The period was calculated as the number of days per year that a tree maintained 50% or more of its relative maximum foliage. Species were coded as deciduous when leaves drop synchronously at the onset of drought or freezing temperatures and leaves are absent for a significant portion of each year (<300 days); brevi-deciduous when leaves are generally present year round or with a brief period of leaflessness (≥300 days), and evergreen with a leaf life span >1 year, with leaves present year round (365 days).

Appendix C. Potential Evapotranspiration and Aridity Index Calculations

Potential evapotranspiration was calculated with the Hargreaves and Samani [101] method, based on the following equation:
ET0 = Ci (Tmed + 17.78) ∗ Evap eq ∗ (Tmax − Tmin)0.5
  • ET0 = potential evapotranspiration by mm/day
  • Ci = constant 0.0023
  • Tmed = average temperature in °C
  • Tmax = maximum temperature in °C
  • Tmin = minimum temperature in °C
  • Evap eq = equivalent evaporation in mm/day
Evap eq = Rs ∗ 1/λ
  • Rs = Solar extraterrestrial radiation based on latitude and longitude in M Jules/m2/day [102].
  • 1/λ = inverse of the latent heat of vaporization (0.408) [103].
The aridity index proposed by the United Nations Environment Programme (UNEP) expresses the relationship between average annual precipitation (Pa) and potential evapotranspiration (Evpot) in a given area [50], which was calculated as I = Pa/Evpot.

Appendix D

PCA performed with the whole set of leaf and stem traits for 275 individuals. Acronyms: LA (leaf area), SLA (specific leaf area), LDMC (leaf dry matter content), N (nitrogen concentration), P (phosphorus concentration), VF (vessel frequency), VD (vessel diameter), WD (wood density).
Table A1. Variable Scores for the Principal Components Analysis (PCA).
PC1PC2PC3
LDMC0.347−0.5070.296
SLA−0.4460.404−0.077
LA0.067−0.222−0.706
N−0.422−0.245−0.127
P−0.4380.067−0.060
WD0.1640.078−0.487
VD−0.287−0.503−0.159
VF0.1490.4100.051
Height−0.414−0.1900.348

Appendix E

Hypervolumes for each plant dimension were based on each of the first three PCA axes at species level (see Figure A1). The MANOVA results for environmental characteristics for species pairs were coded as ND = no significant differences. Symbol “*” (p < 0.05) indicates significant differences in environmental conditions among species pairs.
Figure A1. Sørensen Similarity Index among Oak Species Pairs.
Forests 11 00894 g0a1

References

  1. Markesteijn, L.; Poorter, L.; Bongers, F.; Paz, H.; Sack, L. Hydraulics and life history of tropical dry forest tree species: Coordination of species’ drought and shade tolerance. New Phytol. 2011, 191, 480–495. [Google Scholar] [CrossRef]
  2. Díaz, S.; Kattge, J.; Cornelissen, J.H.C.; Wright, I.J.; Lavorel, S.; Dray, S.; Reu, B.; Kleyer, M.; Wirth, C.; Colin Prentice, I.; et al. The global spectrum of plant form and function. Nature 2016, 529, 167–171. [Google Scholar] [CrossRef] [PubMed]
  3. Garnier, E.; Navas, M.-L. A trait-based approach to comparative functional plant ecology: Concepts, methods and applications for agroecology. A review. Agron. Sustain. Dev. 2012, 32, 365–399. [Google Scholar] [CrossRef] [Green Version]
  4. Reich, P.B. The world-wide “fast-slow” plant economics spectrum: A traits manifesto. J. Ecol. 2014, 102, 275–301. [Google Scholar] [CrossRef]
  5. Sterck, F.; Markesteijn, L.; Schieving, F.; Poorter, L. Functional traits determine trade-offs and niches in a tropical forest community. Proc. Natl. Acad. Sci. USA 2011, 108, 20627–20632. [Google Scholar] [CrossRef] [PubMed] [Green Version]
  6. de la Riva, E.G.; Marañón, T.; Violle, C.; Villar, R.; Pérez-Ramos, I.M. Biogeochemical and Ecomorphological Niche Segregation of Mediterranean Woody Species along a Local Gradient. Front. Plant Sci. 2017, 8, 1242. [Google Scholar] [CrossRef] [PubMed]
  7. Pérez-Ramos, I.M.; Matías, L.; Gómez-Aparicio, L.; Godoy, Ó. Functional traits and phenotypic plasticity modulate species coexistence across contrasting climatic conditions. Nat. Commun. 2019, 10, 1–11. [Google Scholar] [CrossRef] [PubMed]
  8. Cavender-Bares, J.; Kitajima, K.; Bazzaz, F.A. Multiple trait associations in relation to habitat differentiation among 17 Floridian oak species. Ecol. Monogr. 2004, 74, 635–662. [Google Scholar] [CrossRef]
  9. Ramírez-Valiente, J.A.; Cavender-Bares, J. Evolutionary trade-offs between drought resistance mechanisms across a precipitation gradient in a seasonally dry tropical oak (Quercus oleoides). Tree Physiol. 2017, 37, 889–901. [Google Scholar] [CrossRef] [Green Version]
  10. Van Ommen Kloeke, A.E.E.; Douma, J.C.; Ordoñez, J.C.; Reich, P.B.; Van Bodegom, P.M. Global quantification of contrasting leaf life span strategies for deciduous and evergreen species in response to environmental conditions. Glob. Ecol. Biogeogr. 2012, 21, 224–235. [Google Scholar] [CrossRef]
  11. Lusk, C.H.; Jimenez-Castillo, M.; Aragón, R.; Easdale, T.A.; Poorter, L.; Hinojosa, L.F.; Mason, N.W.H. Testing for functional convergence of temperate rainforest tree assemblages in Chile and New Zealand. N. Z. J. Bot. 2016, 54, 175–203. [Google Scholar] [CrossRef]
  12. Wang, T.; Wang, Z.; Xia, F.; Su, Y. Local adaptation to temperature and precipitation in naturally fragmented populations of Cephalotaxus oliveri, an endangered conifer endemic to China. Sci. Rep. 2016, 6, 1–12. [Google Scholar] [CrossRef] [PubMed] [Green Version]
  13. Querejeta, J.I.; Prieto, I.; Torres, P.; Campoy, M.; Alguacil, M.M.; Roldán, A. Water-spender strategy is linked to higher leaf nutrient concentrations across plant species colonizing a dry and nutrient-poor epiphytic habitat. Environ. Exp. Bot. 2018, 153, 302–310. [Google Scholar] [CrossRef]
  14. Sperry, J.S.; Meinzer, F.C.; McCulloh, K.A. Safety and efficiency conflicts in hydraulic architecture: Scaling from tissues to trees. Plant Cell Environ. 2008, 31, 632–645. [Google Scholar] [CrossRef] [PubMed]
  15. Carlquist, S. Comparative Wood Anatomy, 2nd ed.; Springer: Berlin, Germany, 2001. [Google Scholar]
  16. Poorter, L.; McDonald, I.; Alarcón, A.; Fichtler, E.; Licona, J.C.; Peña-Claros, M.; Sterck, F.; Villegas, Z.; Sass-Klaassen, U. The importance of wood traits and hydraulic conductance for the performance and life history strategies of 42 rainforest tree species. New Phytol. 2010, 185, 481–492. [Google Scholar] [CrossRef] [PubMed]
  17. Meinzer, F.C.; Johnson, D.M.; Lachenbruch, B.; McCulloh, K.A.; Woodruff, D.R. Xylem hydraulic safety margins in woody plants: Coordination of stomatal control of xylem tension with hydraulic capacitance. Funct. Ecol. 2009, 23, 922–930. [Google Scholar] [CrossRef]
  18. Méndez-Alonzo, R.; Paz, H.; Zuluaga, R.C.; Rosell, J.A.; Olson, M.E. Coordinated evolution of leaf and stem economics in tropical dry forest trees. Ecology 2012, 93, 2397–2406. [Google Scholar] [CrossRef]
  19. Poorter, L.; Markesteijn, L. Seedling Traits Determine Drought Tolerance of Tropical Tree Species. Biotropica 2008, 40, 321–331. [Google Scholar] [CrossRef]
  20. Baraloto, C.; Paine, C.E.T.; Poorter, L.; Beauchene, J.; Bonal, D.; Domenach, A.M.; Hérault, B.; Patiño, S.; Roggy, J.C.; Chave, J. Decoupled leaf and stem economics in rain forest trees. Ecol. Lett. 2010, 13, 1338–1347. [Google Scholar] [CrossRef]
  21. Li, L.; McCormack, M.L.; Ma, C.; Kong, D.; Zhang, Q.; Chen, X.; Zeng, H.; Niinemets, Ü.; Guo, D. Leaf economics and hydraulic traits are decoupled in five species-rich tropical-subtropical forests. Ecol. Lett. 2015, 18, 899–906. [Google Scholar] [CrossRef]
  22. Reich, P.B.; Ellsworth, D.S.; Walters, M.B.; Vose, J.M.; Gresham, C.; Volin, J.C.; Bowman, W.D. Generality of leaf trait relationships: A test across six biomes. Ecology 1999, 80, 1955–1969. [Google Scholar] [CrossRef]
  23. Wright, I.J.; Reich, P.B.; Westoby, M.; Ackerly, D.D.; Baruch, Z.; Bongers, F.; Cavender-Bares, J.; Chapin, T.; Cornellssen, J.H.C.; Diemer, M.; et al. The worldwide leaf economics spectrum. Nature 2004, 428, 821–827. [Google Scholar] [CrossRef] [PubMed]
  24. Givnish, T.J. Adaptive significance of evergreen vs. deciduous leaves: Solving the triple paradox. Silva Fenn. 2002, 36, 703–743. [Google Scholar] [CrossRef]
  25. Bai, K.; He, C.; Wan, X.; Jiang, D. Leaf economics of evergreen and deciduous tree species along an elevational gradient in a subtropical mountain. AoB Plants 2015, 7, 1–15. [Google Scholar] [CrossRef] [PubMed] [Green Version]
  26. Mason, C.; Donovan, L. Evolution of the leaf economics spectrum in herbs: Evidence from environmental divergences in leaf physiology across Helianthus (Asteraceae). Evolution 2015, 69. [Google Scholar] [CrossRef] [PubMed]
  27. Edwards, E.J.; Chatelet, D.S.; Sack, L.; Donoghue, M.J. Leaf life span and the leaf economic spectrum in the context of whole plant architecture. J. Ecol. 2014, 102, 328–336. [Google Scholar] [CrossRef] [Green Version]
  28. Manos, P.S.; Doyle, J.J.; Nixon, K.C. Phylogeny, biogeography, and processes of molecular differentiation in Quercus subgenus Quercus (Fagaceae). Mol. Phylogenet. Evol. 1999, 12, 333–349. [Google Scholar] [CrossRef] [Green Version]
  29. Deng, M.; Jiang, X.-L.; Hipp, A.L.; Manos, P.S.; Hahn, M. Phylogeny and biogeography of East Asian evergreen oaks (Quercus section Cyclobalanopsis; Fagaceae): Insights into the Cenozoic history of evergreen broad-leaved forests in subtropical Asia. Mol. Phylogenet. Evol. 2018, 119, 170–181. [Google Scholar] [CrossRef]
  30. Cavender-Bares, J. Diversification, adaptation, and community assembly of the American oaks (Quercus), a model clade for integrating ecology and evolution. New Phytol. 2018, 221, 669–692. [Google Scholar] [CrossRef] [Green Version]
  31. de la Riva, E.G.; Arenas Navarro, M.; Villar Montero, R.; García Oliva, F.; Oyama, K. El papel de la evapotranspiración en la distribución funcional foliar de 28 especies del género Quercus de España y México. Ecosistemas 2019, 28, 199–207. [Google Scholar] [CrossRef]
  32. Bouchenak-Khelladi, Y.; Onstein, R.E.; Xing, Y.; Schwery, O.; Linder, H.P. On the complexity of triggering evolutionary radiations. New Phytol. 2015, 207, 313–326. [Google Scholar] [CrossRef] [PubMed]
  33. Arenas-Navarro, M.; García-Oliva, F.; Torres-Miranda, A.; Téllez-Valdés, O.; Oyama, K. Environmental filters determine the distribution of tree species in a threatened biodiversity hotspot in western Mexico. Bot. Sci. 2020, 98, 219–237. [Google Scholar] [CrossRef]
  34. Valencia-A, S. Diversidad del género Quercus (Fagaceae) en México. Bol. Soc. Bot. Méx. 2004, 75, 33–53. [Google Scholar]
  35. Nixon, K.C. Global Neotropical distribution and diversity of oak (genus Quercus) and oak forest. In Ecology and Conservation of Neotropical Montane Oak Forests; Kappelle, M., Ed.; Springer: Berlin, Germany, 2006; pp. 3–13. ISBN 978-3-540-28909-8. [Google Scholar]
  36. Hipp, A.L.; Manos, P.S.; González-Rodríguez, A.; Hahn, M.; Kaproth, M.; McVay, J.D.; Valencia-Ávalos, S.; Cavender-Bares, J. Sympatric parallel diversification of major oak clades in the Americas and the origins of Mexican species diversity. New Phytol. 2018, 217, 439–452. [Google Scholar] [CrossRef] [PubMed] [Green Version]
  37. Nixon, K.C. Infrageneric classification of Quercus (Fagaceae) and typification of sectional names. Ann. des Sci. For. 1993, 50, 25–34. [Google Scholar] [CrossRef] [Green Version]
  38. Renninger, H.J.; Carlo, N.; Clark, K.L.; Schafer, K.V.R. Physiological strategies of co-occurring oaks in a water- and nutrient-limited ecosystem. Tree Physiol. 2014, 34, 159–173. [Google Scholar] [CrossRef] [Green Version]
  39. Aguilar-Romero, R.; Pineda-Garcia, F.; Paz, H.; González-Rodríguez, A.; Oyama, K. Differentiation in the water-use strategies among oak species from central Mexico. Tree Physiol. 2017, 37, 915–925. [Google Scholar] [CrossRef]
  40. Lobo, A.; Torres-Ruiz, J.M.; Burlett, R.; Lemaire, C.; Parise, C.; Francioni, C.; Truffaut, L.; Tomášková, I.; Hansen, J.K.; Kjær, E.D.; et al. Assessing inter- and intraspecific variability of xylem vulnerability to embolism in oaks. For. Ecol. Manag. 2018, 424, 53–61. [Google Scholar] [CrossRef]
  41. Torres-Ruiz, J.M.; Kremer, A.; Carins Murphy, M.R.; Brodribb, T.; Lamarque, L.J.; Truffaut, L.; Bonne, F.; Ducousso, A.; Delzon, S. Genetic differentiation in functional traits among European sessile oak populations. Tree Physiol. 2019. [Google Scholar] [CrossRef]
  42. Servicio Meteorológico Nacional Normales Climatológicas por Estado. Available online: https://smn.conagua.gob.mx/es/informacion-climatologica-por-estado?estado=jal (accessed on 5 December 2017).
  43. Velázquez-Ruiz, A.; Martínez, L.M.; Carrillo, F.M. Caracterización climática para la región de Bahia de Banderas mediante el sistema de Köppen, modificado por García, y técnicas de sistemas de información geográfica. Invest. Geogr. 2012, 79, 7–19. [Google Scholar] [CrossRef]
  44. Torres-Miranda, A.; Luna-Vega, I.; Oyama, K. New approaches to the biogeography and areas of endemism of red oaks (Quercus L., Section Lobatae). Syst. Biol. 2013, 62, 555–573. [Google Scholar] [CrossRef] [PubMed] [Green Version]
  45. Vargas-Rodriguez, Y.L.; Urbatsch, E.; Karaman-Castro, V.; Figueroa-Rangel, B.L. Acer binzayedii (Sapindaceae), a new maple species from Mexico. Brittonia 2017, 69, 249–252. [Google Scholar] [CrossRef]
  46. González-Villarreal, L.M. Two new species of oak (Fagaceae, Quercus sect. Lobatae) from the Sierra Madre del Sur, Mexico. Brittonia 2003, 55, 49–60. [Google Scholar] [CrossRef]
  47. Pérez-Harguindeguy, N.; Diaz, S.; Garnier, E.; Lavorel, S.; Poorter, H.; Jaureguiberry, P.; Bret-Harte, M.S.; Cornwell, W.; Craine, J.; Gurvich, D.; et al. New handbook for standardise measurement of plant functional traits worldwide. Aust. J. Bot. 2013, 61, 167–234. [Google Scholar] [CrossRef]
  48. Cuervo-Robayo, A.P.; Téllez-Valdés, O.; Gómez-Albores, M.A.; Venegas-Barrera, C.S.; Manjarrez, J.; Martínez-Meyer, E. An update of high-resolution monthly climate surfaces for Mexico. Int. J. Climatol. 2014, 34, 2427–2437. [Google Scholar] [CrossRef]
  49. Hutchinson, M.F. Anusplin Version 4.36 User Guide; Centre for Resource and Environmental Studies. The Australian National University: Canberra, Australia, 2006. [Google Scholar]
  50. United Nations Environment Programme. World Atlas of Desertification, 2nd ed.; Middleton, N., Thomas, D.S.G., Eds.; United Nations Environment Programme/Edward Arnold: London, UK, 1997; ISBN 0340555122. [Google Scholar]
  51. Huffman, E.W., Jr. Performance of a new automatic carbon dioxide coulometer. Microchem. J. 1977, 22, 567–573. [Google Scholar] [CrossRef]
  52. Bremmer, J.M. Nitrogen-total. In Methods of Soil Analysis Part 3: Chemical Analysis; Sparks, D., Page, A.L., Helmke, P.A., Loerppert, R.G.H., Soltanpour, P.N., Tabatabai, M.A., Jhonson, C.T., Sumner, M.E., Eds.; Soil Science Society of American and American Society of Agronomy: Madison, WI, USA, 1996; pp. 1085–1121. [Google Scholar]
  53. Murphy, J.; Riley, J.P. A modified single solution method for the determination of phosphate in natural waters. Anal. Chim. Acta 1962, 27, 31–36. [Google Scholar] [CrossRef]
  54. Robertson, P.G.; Coleman, D.C.; Bledsoe, C.S.; Sollins, P. Standard Soil Methods for Long-Term Ecological Research (LTER); Oxford University Press: Oxford, UK, 1999. [Google Scholar]
  55. Michelaki, C.; Fyllas, N.M.; Galanidis, A.; Aloupi, M.; Evangelou, E.; Arianoutsou, M.; Dimitrakopoulos, P.G. An integrated phenotypic trait-network in thermo-Mediterranean vegetation describing alternative, coexisting resource-use strategies. Sci. Total Environ. 2019, 672, 583–592. [Google Scholar] [CrossRef]
  56. de Bello, F.; Lavorel, S.; Albert, C.H.; Thuiller, W.; Grigulis, K.; Dolezal, J.; Janeček, Š.; Lepš, J. Quantifying the relevance of intraspecific trait variability for functional diversity. Methods Ecol. Evol. 2011, 2, 163–174. [Google Scholar] [CrossRef]
  57. Grueber, C.E.; Nakagawa, S.; Laws, R.J.; Jamieson, I.G. Multimodel inference in ecology and evolution: Challenges and solutions. J. Evol. Biol. 2011, 24, 699–711. [Google Scholar] [CrossRef]
  58. Harrison, X.A.; Donaldson, L.; Correa-Cano, M.E.; Evans, J.; Fisher, D.N.; Goodwin, C.E.D.; Robinson, B.S.; Hodgson, D.J.; Inger, R. A brief introduction to mixed effects modelling and multi-model inference in ecology. PeerJ 2018, 2018, e4794. [Google Scholar] [CrossRef] [PubMed] [Green Version]
  59. Burnham, K.P.; Anderson, D.R. Model Selection and Multimodel Inference: A Practical Information-Theoretic Approach; Springer: New York, NY, USA, 2002. [Google Scholar]
  60. Nakagawa, S.; Schielzeth, H. A general and simple method for obtaining R2 from generalized linear mixed-effects models. Methods Ecol. Evol. 2013, 4, 133–142. [Google Scholar] [CrossRef]
  61. Blonder, B.; Morrow, C.B.; Maitner, B.; Harris, D.J.; Lamanna, C.; Violle, C.; Enquist, B.J.; Kerkhoff, A.J. New approaches for delineating n-dimensional hypervolumes. Methods Ecol. Evol. 2018, 9, 305–319. [Google Scholar] [CrossRef] [Green Version]
  62. Hutchinson, G.E. Concluding remarks. Cold Spring Harb. Symp. Quant. Biol. 1957, 22, 415–427. [Google Scholar] [CrossRef]
  63. Lamanna, C.; Blonder, B.; Violle, C.; Kraft, N.; Sandel, B.; Šímová, I.; Donoghue, J.; Svenning, J.-C.; Mcgill, B.; Boyle, B.; et al. Functional trait space and the latitudinal diversity gradient. Proc. Natl. Acad. Sci. USA 2014, 111, 13745–13750. [Google Scholar] [CrossRef] [Green Version]
  64. Mammola, S. Assessing similarity of n- dimensional hypervolumes: Which metric to use? J. Biogeogr. 2019, 46, 2012–2023. [Google Scholar] [CrossRef]
  65. Oksanen, J.; Blanchet, F.G.; Friendly, M.; Kindt, R.; Legendre, P.; Mcglinn, D.; Minchin, P.; B. O’Hara, R.; Simpson, G.; Solymos, P. Vegan: Community Ecology Package. Ordination Methods, Diversity Analysis and Other Functions for Community and Vegetation Ecologists. Version 2.4-0. Available online: https://CRAN.R-project.org/package=vegan (accessed on 24 April 2016).
  66. Bougeard, S.; Dray, S. Supervised multiblock analysis in R with the ade4 Package. J. Stat. Softw. 2018, 86, 1–17. [Google Scholar] [CrossRef] [Green Version]
  67. Pinheiro, J.; Bates, D.; DebRoy, S.; Sarkar, D. nlme: Linear and Nonlinear Mixed Effects Models; R Package Version 3.1-121. Available online: https://cran.r-project.org/web/packages/nlme (accessed on 1 April 2019).
  68. Bates, D.; Mächler, M.; Bolker, B.; Walker, S. Fitting linear mixed-effects models using lme4. J. Stat. Softw. 2015, 67, 1–48. [Google Scholar] [CrossRef]
  69. Bartoń, K. MuMIn: Multi-Model Inference; R Packag. version 1.43.17. Available online: https://cran.r-project.org/web/packages/MuMIn (accessed on 15 February 2020).
  70. Blonder, B.; Lamanna, C.; Violle, C.; Enquist, B.J. The n-dimensional hypervolume. Glob. Ecol. Biogeogr. 2014, 23, 595–609. [Google Scholar] [CrossRef]
  71. R Core Team. R: A Language and Environment for Statistical Computing. Available online: https://cran.r-project.org (accessed on 26 October 2017).
  72. Uribe-Salas, D.; Sáenz-Romero, C.; González-Rodríguez, A.; Téllez-Valdéz, O.; Oyama, K. Foliar morphological variation in the white oak Quercus rugosa Née (Fagaceae) along a latitudinal gradient in Mexico: Potential implications for management and conservation. For. Ecol. Manag. 2008, 256, 2121–2126. [Google Scholar] [CrossRef]
  73. Lara-De La Cruz, L.I.; García-Oliva, F.; Oyama, K.; Rodríguez, A.G. Association of functional trait variation of Quercus castanea with temperature and water availability gradients at the landscape level. Bot. Sci. 2020, 98. [Google Scholar] [CrossRef] [Green Version]
  74. de la Riva, E.G.; Pérez-Ramos, I.M.; Tosto, A.; Navarro-Fernández, C.M.; Olmo, M.; Marañón, T.; Villar, R. Disentangling the relative importance of species occurrence, abundance and intraspecific variability in community assembly: A trait-based approach at the whole-plant level in Mediterranean forests. Oikos 2016, 125, 354–363. [Google Scholar] [CrossRef] [Green Version]
  75. Ramirez-Valiente, J.A.; Sanchez-Gomez, D.; Aranda, I.; Valladares, F. Phenotypic plasticity and local adaptation in leaf ecophysiological traits of 13 contrasting cork oak populations under different water availabilities. Tree Physiol. 2010, 30, 618–627. [Google Scholar] [CrossRef] [PubMed] [Green Version]
  76. Borchert, R.; Robertson, K.; Schwartz, M.D.; Williams-Linera, G. Phenology of temperate trees in tropical climates. Int. J. Biometeorol. 2005, 50, 57–65. [Google Scholar] [CrossRef] [PubMed]
  77. Read, Q.D.; Moorhead, L.C.; Swenson, N.G.; Bailey, J.K.; Sanders, N.J. Convergent effects of elevation on functional leaf traits within and among species. Funct. Ecol. 2014, 28, 37–45. [Google Scholar] [CrossRef]
  78. González Villarreal, L.M.; Universidad de Guadalajara, Instituto de Botánica. Contribuciόn al Conocimiento del Género Quercus (Fagaceae) en el Estado de Jalisco; Instituto de Botánica, Universidad de Guadalajara: Guadalajara, Mexico, 1986; ISBN 9688950270. [Google Scholar]
  79. Zanne, A.E.; Westoby, M.; Falster, D.S.; Ackerly, D.D.; Loarie, S.R.; Arnold, S.E.J.; Coomes, D.A. Angiosperm wood structure: Global patterns in vessel anatomy and their relation to wood density and potential conductivity. Am. J. Bot. 2010, 97, 207–215. [Google Scholar] [CrossRef] [Green Version]
  80. Ziemińska, K.; Westoby, M.; Wright, I.J. Broad Anatomical variation within a narrow wood density range—A study of twig wood across 69 Australian angiosperms. PLoS ONE 2015, 10, e0124892. [Google Scholar] [CrossRef] [Green Version]
  81. Fortunel, C.; Ruelle, J.; Beauchêne, J.; Fine, P.V.A.; Baraloto, C. Wood specific gravity and anatomy of branches and roots in 113 Amazonian rainforest tree species across environmental gradients. New Phytol. 2014, 202, 79–94. [Google Scholar] [CrossRef]
  82. Scholz, A.; Stein, A.; Choat, B.; Jansen, S. How drought and deciduousness shape xylem plasticity in three Costa Rican woody plant species. IAWA J. 2014, 35, 337–355. [Google Scholar] [CrossRef]
  83. Fisher, J.B.; Goldstein, G.; Jones, T.J.; Cordell, S. Wood vessel diameter is related to elevation and genotype in the Hawaiian tree Metrosideros polymorpha (Myrtaceae). Am. J. Bot. 2007, 94, 709–715. [Google Scholar] [CrossRef]
  84. Tyree, M.T.; Davis, S.D.; Cochard, H. Biophysical perspectives of xylem evolution: Is there a tradeoff of hydraulic efficiency for vulnerability to dysfunction? IAWA J. 1994, 15, 335–360. [Google Scholar] [CrossRef] [Green Version]
  85. Jacobsen, A.L.; Ewers, F.W.; Pratt, R.B.; Paddock, W.A.; Davis, S.D. Do xylem fibers affect vessel cavitation resistance? Plant Physiol. 2005, 139, 546–556. [Google Scholar] [CrossRef] [PubMed] [Green Version]
  86. Cai, J.; Li, S.; Zhang, H.; Zhang, S.; Tyree, M.T. Recalcitrant vulnerability curves: Methods of analysis and the concept of fibre bridges for enhanced cavitation resistance. Plant. Cell Environ. 2014, 37, 35–44. [Google Scholar] [CrossRef] [PubMed]
  87. Li, S.; Lens, F.; Espino, S.; Karimi, Z.; Klepsch, M.; Schenk, H.J.; Schmitt, M.; Schuldt, B.; Jansen, S. Intervessel pit membrane thickness as a key determinant of embolism resistance in angiosperm xylem. IAWA J. 2016, 37, 152–171. [Google Scholar] [CrossRef] [Green Version]
  88. Carlquist, S. Vasicentric tracheids as a drought survival mechanism in the woody flora of southern California and similar regions; review of vasicentric tracheids. Aliso 1985, 11, 37–68. [Google Scholar]
  89. Fontes, C.G.; Cavender-Bares, J. Toward an integrated view of the ‘elephant’: Unlocking the mysteries of water transport and xylem vulnerability in oaks. Tree Physiol. 2019, 40, 1–4. [Google Scholar] [CrossRef]
  90. Martin, R.E.; Asner, G.P.; Sack, L. Genetic variation in leaf pigment, optical and photosynthetic function among diverse phenotypes of Metrosideros polymorpha grown in a common garden. Oecologia 2007, 151, 387–400. [Google Scholar] [CrossRef]
  91. Dunbar-Co, S.; Sporck, M.J.; Sack, L. Leaf trait diversification and design in seven rare taxa of the Hawaiian Plantago radiation. Int. J. Plant Sci. 2009, 170, 61–75. [Google Scholar] [CrossRef] [Green Version]
  92. Moles, A.; Warton, D.; Warman, L.; Swenson, N.; Laffan, S.; Zanne, A.; Pitman, A.; Hemmings, F.; Leishman, M. Global patterns in plant height. J. Ecol. 2009, 97, 923–932. [Google Scholar] [CrossRef]
  93. Laughlin, D.C. The intrinsic dimensionality of plant traits and its relevance to community assembly. J. Ecol. 2014, 102, 186–193. [Google Scholar] [CrossRef]
  94. Russo, S.E.; Kitajima, K. The Ecophysiology of leaf lifespan in tropical forests: Adaptive and plastic responses to environmental heterogeneity. In Tropical Tree Physiology; Goldstein, G., Santiago, L., Eds.; Springer: Cham, Germany, 2016; pp. 357–383. ISBN 978-3-319-27422-5. [Google Scholar]
  95. Bruelheide, H.; Dengler, J.; Purschke, O.; Lenoir, J.; Jiménez-Alfaro, B.; Hennekens, S.M.; Botta-Dukát, Z.; Chytrý, M.; Field, R.; Jansen, F.; et al. Global trait–environment relationships of plant communities. Nat. Ecol. Evol. 2018, 2, 1906–1917. [Google Scholar] [CrossRef] [PubMed]
  96. Chesson, P. Mechanisms of maintenance of species diversity. Annu. Rev. Ecol. Syst. 2000, 31, 343–366. [Google Scholar] [CrossRef] [Green Version]
  97. Kraft, N.J.B.; Godoy, O.; Levine, J.M. Plant functional traits and the multidimensional nature of species coexistence. Proc. Natl. Acad. Sci. USA 2015, 112, 797–802. [Google Scholar] [CrossRef] [PubMed] [Green Version]
  98. Gleason, S.M.; Butler, D.W.; Waryszak, P. Shifts in leaf and stem hydraulic traits across aridity gradients in Eastern Australia. Int. J. Plant Sci. 2013, 174, 1292–1301. [Google Scholar] [CrossRef] [Green Version]
  99. Cavender-Bares, J.; Ackerly, D.D.; Baum, D.A.; Bazzaz, F.A. Phylogenetic overdispersion in Floridian oak communities. Am. Nat. 2004, 163, 823–843. [Google Scholar] [CrossRef]
  100. Violle, C.; Jiang, L. Towards a trait-based quantification of species niche. J. Plant Ecol. 2009, 2, 87–93. [Google Scholar] [CrossRef] [Green Version]
  101. Hargreaves, G.H.; Samani, Z.A. Reference crop evapotranspiration from temperature. Appl. Eng. Agric. 1985, 1, 96–99. [Google Scholar] [CrossRef]
  102. NASA National Aeronautics and Space Administration. Available online: https://power.larc.nasa.gov/data-access-viewer/ (accessed on 25 December 2017).
  103. Allen, R.G. Evapotranspiración del Cultivo: Guías Para la Determinación de los Requerimientos de Agua de los Cultivos; Food & Agriculture Org.: Roma, Italy, 2006; Volume 56. [Google Scholar]
Figure 1. Principal components analysis (PCA) for the 9 leaf and stem for 21 oak species along the first three principal components (PC). (a) PC1 and PC2; (b) PC1 and PC3. Colors indicate the contribution of each trait along the axes. LA (leaf area), SLA (specific leaf area), LDMC (leaf dry matter content), N (nitrogen concentration), P (phosphorus concentration), VF (vessel frequency), VD (vessel diameter), WD (wood density).
Forests 11 00894 g001
Figure 2. Variance explained by the main factor in PC1 and PC2 axis on the nested random effect models. The main explicative factor in PC1 was leaf habit and in PC2 was carried by sections.
Forests 11 00894 g002
Figure 3. Functional hypervolumes and Sørensen functional similarity index among hypervolumes. (a) Section (Quercus and Lobatae), (b) Leaf habit (deciduous, brevi-deciduous, evergreen). Each functional axis was based on the first three PCA axes (see Figure 1). The colored points with contour for each section and for each leaf habit are the graphical representations of the hypervolumes, showing all possible pairwise overlaps in each PC axis.
Forests 11 00894 g003
Figure 4. Sample ordination produced by canonical correspondence analysis. The vectors indicate the environmental variables. UNEP (United Nations Environment Programme) aridity index; mtwm (maximum temperature of warmest month); mtcm (maximum temperature of coldest month); pcq (precipitation of coldest quarter), and pwq (precipitation of warmest quarter). Lines indicate Sørensen functional similarity overlap ≥ 0.3 among oak species pairs.
Forests 11 00894 g004
Table 1. List of oak species in the study with the phylogenetic section and leaf habit category.
SpeciesSectionLeaf Habit
Quercus aristata Hook. & Arn.Lobataedeciduous
Quercus calophylla Schltdl. & Cham.Lobataebrevi-deciduous
Quercus castanea NéeLobataebrevi-deciduous
Quercus crassifolia Bonpl.Lobataebrevi-deciduous
Quercus cualensis L.M. GonzálezLobataebrevi-deciduous
Quercus eduardii Trel.Lobataebrevi-deciduous
Quercus elliptica NéeLobataedeciduous
Quercus glaucescens Bonpl.Quercusbrevi-deciduous
Quercus iltisii L.M. GonzálezLobataebrevi-deciduous
Quercus jonesii Trel.Lobataedeciduous
Quercus laeta Liebm.Quercusdeciduous
Quercus laurina Bonpl.Lobataebrevi-deciduous
Quercus liebmannii Oerst. ex Trel.Quercusdeciduous
Quercus magnoliifolia NéeQuercusdeciduous
Quercus martinezii C.H. Mull.Quercusevergreen
Quercus mexiae L.M. GonzálezLobataedeciduous
Quercus obtusata Bonpl.Quercusbrevi-deciduous
Quercus resinosa Liebm.Quercusdeciduous
Quercus scytophylla Liebm.Lobataebrevi-deciduous
Quercus tuitensis L.M. GonzálezLobataedeciduous
Quercus aff. uxoris McVaughLobataeevergreen
Table 2. Leaf and stem functional traits with mean standard and range of 9 functional traits of 275 oak individuals.
TraitsAbbreviationUnit Mean Range
Leaf traits
Leaf areaLA cm247.355.01–270.62
Specific leaf areaSLAcm2 g−171.2522.52–174.52
Leaf dry matter contentLDMC mg g−10.4360.20–0.64
Nitrogen concentrationNmg g−110.596.74–16.63
Phosphorus concentrationPmg g−11.030.39–2.5
Stem traits
Vessel frequencyVF mm25.993.0–14.0
Vessel diameterVD µm189.7598.40–284.4
Wood densityWD g/cm30.660.36–0.89
HeightH m9.853.40–28.00
Table 3. Variance partitioning of the first three principal components (PC). Variance partitioning for each PC among components expressing variation between species (Species), leaf habits (Leaf habit), sections (Sections), plots (Habitat) and species (Intraspecific).
Source of VarianceProportion of Variance
PC1PC2PC3
Species0.320.400.50
Sections-0.280.14
Leaf habit0.580.07-
Intraspecific0.080.020.1
Habitat-0.050.05
Table 4. Best fit of the generalized linear mixed models (GLMM) analyzing PCs in response to environmental factors. UNEP (United Nations Environment Programme) aridity index; pwq (precipitation of warmest quarter); mtwm (maximum temperature of warmest month), and pcq (precipitation of coldest quarter). Bold numbers are Akaike information criterion corrected for small sample sizes (AICc) from null models and non-bold numbers are the best supported model. The asterisk symbol (*) means the multiplication of factors.
ModelR2 MarginalR2 ConditionalAICc
Leaf economic spectrumPC1logUNEP * log (pwq)0.090.30597.00
618.00
Hydraulic stem traitsPC2logUNEP * log (mtwm)0.050.23642.71
648.43
Leaf area and heightPC3logUNEP * log (pcq)0.160.40562.10
574.16

