Abstract
Research Highlights: To demonstrate the effectiveness of configuration modes and tree types in regulating local microclimate. Background and Objectives: Urban trees play an essential role in reducing the city’s heat load. However, the influence of urban trees with different configurations on the urban thermal environment has not received enough attention. Herein we show how spatial arrangement and foliage longevity, deciduous versus evergreen, affect transpiration and the urban microclimate. Materials and Methods: We analyzed the differences between physiological parameters (transpiration rate, stomatal conductance) and meteorological parameters (air temperature, relative humidity, vapor pressure deficit) of 10 different species of urban trees (five evergreen and five deciduous tree species), each of which had been planted in three configuration modes in a park and the campus green space in Xi’an. By manipulating physiological parameters, crown morphology, and plant configurations, we explored how local urban microclimate could be altered. Results: (1) Microclimate regulation capacity: group planting (GP) > linear planting (LP) > individual planting (IP). (2) Deciduous trees (DT) regulated microclimate better than evergreen trees (ET). Significant differences between all planting configurations during 8 to 16 h were noted for evergreen trees whereas for deciduous trees, all measurement times were significantly different. (3) Transpiration characteristics: GP > LP > IP. The transpiration rate (E) and stomatal conductance (Gs) of GP were the highest. Total daily transpiration was ranked as group planting of deciduous (DGP) > linear planting of deciduous (DLP) > group planting of evergreen (EGP) > linear planting of evergreen (ELP) > isolated planting of deciduous (DIP) > isolated planting of evergreen (EIP). (4) The microclimate effects of different tree species and configuration modes were positively correlated with E, Gs, and three dimensional green quantity (3DGQ), but weakly correlated with vapor pressure deficit (VpdL). (5) A microclimate regulation capability model of urban trees was developed. E, Gs, and 3DGQ could explain 93% variation of cooling effect, while E, Gs, VpdL, and 3DGQ could explain 85% variation of humidifying effect. Conclusions: This study demonstrated that the urban heat island could be mitigated by selecting deciduous broadleaf tree species and planting them in groups.
1. Introduction
Because of the ability of trees and their foliage to reflect short-wave radiation, to re-radiate long-wave radiation, to shade, and to cool via transpiration, trees in an urban environment have the potential to alter the microclimate of that environment [1,2,3,4,5]. The urban heat island is a well-known phenomenon, which not only reduces the comfort level of the urban population, endangers their health, but also reduces urban biodiversity [6]. It is predicted that urbanization will continue to increase globally [7]. At the same time, climate change has already meant increasing air temperatures with the prediction of still further increases [8]. Health metrics show that for every 1 °C increase in daily maximum (or average) temperature above 32 °C in urban environments there will be increased morbidity and mortality of 1%–3% [9]. For example, there was an estimated 52,000 excess deaths between June and August from heat stress during the 2003 record hot summer in Western Europe [10]. Facing the problems caused by urban heat island, the way of increasing the vegetation seems to be an important strategy to alleviate UHI [11].
Previous studies have shown that green infrastructure in urban environments is critical for mental and physical health [12] and for moderation and mitigation of the urban heat island effect [13,14]. Different locations and variation in tree configuration offer different impacts on microclimate [15], and a well-organized planting layout can improve microclimate [16]. Studies suggest that less dense plantings of trees provide better summer-time microclimate regulation than dense plantings [17]. Wang et al. [18] explored the impact of crown size and density on cooling by shading and observed that maximum cooling (4 °C decrease) occurred at the point of crown closure. Thus, it remains to be explored what planting configurations best reduce the thermal load in urban areas.
Water lost by plant foliage or transpiration cools the foliage further reducing nearby air temperatures, improving the urban microclimate, and providing an important ecosystem service [19,20]. The previous studies showed that crown density, foliage longevity, and physiological properties of trees all may influence the ability of individual and groups of trees to modify microclimate [21,22,23,24]. 3DGQ (three dimensional green quantity) is the spatial volume occupied by vegetation stems and leaves, and the “3DGQ” equation of tree species is obtained from the volume equation of solid geometry similar to its canopy [25]. Some studies use remote sensing to estimate 2-D crown coverage [26], however these studies do not capture the 3-D aspects of green scapes [27]. Finally, none of these studies have specifically addressed the role of foliage longevity, 3DGQ, and tree species types on the extent of microclimate mitigation.
In cities with diverse climatic conditions, the cooling effect of the spatial configuration of trees (individual trees and different spacing or combinations) is significantly different [28]. Although there have been studies on the microclimate effects of urban tree species in temperate regions [29], few similar studies have been conducted in the humid subtropical cities. In this study, Xi’an, a representative city in the humid subtropical region, was taken as an example. We investigate how 10 different tree species with three different planting configuration modes affect local microclimates. In particular, the primary objectives of this study were to: (1) explore the influence of different tree species types and configuration modes on the microclimate effects and transpiration characteristics of trees; (2) investigate the relationship between the regulating of microclimate effect, and transpiration characteristics, and 3DGQ of urban trees with different tree species types and configuration modes; (3) determine the action mechanism of microclimate regulation capacity of urban tree species. This serves as a theoretical basis and practical method for the overall urban green space planning and tree planting design optimization both in Xi’an and elsewhere of a similar climate.
2. Materials and Methods
2.1. Study Site and Climatic Conditions
The study was conducted in Xi’an, China (coordinates: 34°15′44′′ N, 118°5′18′′ E, altitude: 450 m). According to Köppen–Geiger climate classification, Xi’an is located at the junction of semi-arid and subtropical humid climate zones, with a mild climate and four distinct seasons, high temperature and rainy in summer and cold and dry in winter [30]. The average annual minimum temperature in January was −4 °C. The average annual maximum temperature in July was 32 °C. The yearly mean relative humidity ranged between 53.11% and 73.83%, and the average yearly rainfall was 572 mm.
2.2. Experiment Design
Field trials were carried out on the campus of Northwest Agriculture and Forestry University and the Yangling arboretum park covering an area of about 6 Ha, 1.4 km away from each other (Figure 1). The experimental objects were 10 different species of common urban trees planted in three different configuration modes (Individual planting, linear planting, group planting), five species were deciduous broadleaf and five were evergreen broadleaf, with similar tree ages, no diseases and insect pests, and good growth vitality (Table 1). The test plots were all covered with grass. There were no trees taller than 1 m within the 2 m distance from the crown projected area around the individual planting samples. The sample plots with the same tree species, fixed plant row spacing, five tree species, non-overlapping crown, and single row planting arrangement were selected. Test samples with an enclosing area of 15 m × 15 m of the same tree species were chosen for group planting, all tree species of group planting were planted irregularly and the crowns did not overlap with each other, allowing users to enter freely (Figure 2). There were no tall trees above the selected sites, and all of them were far away from water, which excludes the influence of water on the microclimate effect of the measuring points. Meanwhile, we selected 30 hard open fields as control sites, which were no vegetation coverage and located within our study area and no more than 50 m away from each test sample.

Figure 1.
Site locations.

Table 1.
Species characteristics of the ten species.
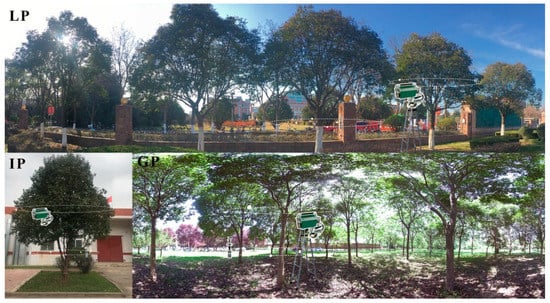
Figure 2.
A live view of three configuration modes (take Ligustrum lucidum as an example). IP-Isolated Planting; LP-Linear Planting; GP-Group Planting.
2.3. Microclimate Measurements
Measurements were performed on July 12th, 13th, and 20th, 2019. Since wind speed has a significant influence on the cooling effect of trees [31], so sunny days, less cloud cover, and no wind (wind speed ≤ 2 m/s) were selected. Ph-II hand-held weather station (Wuhan Xinpuhui Technology Co., Ltd., Wuhan, China) was used to determine the air temperature (Ta0) and relative humidity (RH0) in the 30 test sample sites. Trials took place from 8 to 18 h each day, and records were done every 2 h. In order to calculate the intensity of cooling and humidification of the sample plot, air temperature (Ta) and relative humidity (RH) at the center of the control sites were measured simultaneously (Table 2). The maximum temperature during the experiment was about 37.5 °C and the vapor pressure deficit (VPD) was about 2.5 Kpa. All instruments were installed at 1.5 m above the ground, which is the average height of human respiration. Each sample plot was continuously monitored for at least 10 min one time and the relative statistics were recorded every other minute.

Table 2.
Technical details of meteorological equipment.
Measuring Points
The eight measuring points of individual planting plots were arranged in a “meter” shape with a radius of 1 m from the central point of the canopy. The measuring points of linear planting plots were set under each tree in the directions of east, south, west, and north, all of which were 1 m away from the central point of canopy, and set a measuring point between every two trees. There were altogether 17 measuring points in each group planting plot, one of the points were arranged in the center and the rest 16 points which were averagely distributed in four directions of east, south, west, and north were arranged every 2 m along the central axis of the test sample (Figure 3). The average value of all measuring points is the air temperature and relative humidity of the sample plot. The average daily cooling and humidifying effects of each measurement point were calculated as follows:
Ta and RH are the air temperature (°C) and relative humidity (%) of the control point, respectively.
Cooling effect = Ta − Ta0
Humidifying effect = RH0 − RH
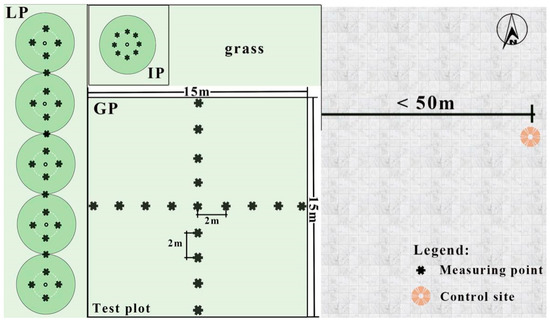
Figure 3.
Schematic diagram of measuring points in three configuration modes. IP: individual planting; LP: linear planting; GP: group planting.
2.4. Transpiration Measurements
Physiological sampling was carried out simultaneously with measures of microclimatology. The test was performed on sunny days and vapor pressure deficit (VPD) was about 2.5 Kpa. Li-6400xt system (LI-COR, Lincoln, NE, USA) with the 2 × 3 cm chamber and red/blue light source was used to measure leaf level transpiration every 2 h from 8 to 18 h. The third, fourth, and fifth leaves from the tip leaf along the branch axis from the mid-canopy of each species were each measured three times. For trees planted in a linear configuration, the first, middle, and last trees were measured. Whereas for the group configuration, four trees within the sample plot were randomly selected and measured. Transpiration rate (E, mmolH2O/m2s) and stomatal conductance (Gs, molH2O/m2s) were measured; simultaneously, leaf temperature (T) and relative humidity (RH) were measured and vapor pressure deficit was calculated as shown in Equation (3) [32]:
T is the blade temperature (°C), RH is the relative air humidity (%), a, b, and C are constants. a = 0.611, b = 17.502, C = 240.97.
Daily transpiration of plant unit leaf area (EL):
ei and ei+1 are respectively the instantaneous transpiration rates of the initial measurement point and the next measurement point, and the unit is mmol/m2s. ti and ti+1 are respectively the instantaneous time of the initial measurement point and the next measurement point, and the unit is h. N is the number of tests, 3600 s per hour, 1 mol = 1000 mmol.
2.5. Statistical Analyses
SPSS22.0 (IBM® SPSS® Statistics, Armonk, NY, USA) software was used to conduct a single sample K-S test for all independent variables and dependent variables to verify whether the data met the normal distribution. In order to compare the differences of average daily air temperature and average daily relative humidity between each measuring point and the control point, paired-samples t-test was used. One-way analysis of variance (ANOVA) was used to compare the average daily cooling effect and average daily humidifying effect of the three configuration modes of urban trees, and then Duncan test was conducted. Two-way analysis of variance (ANOVA) was used to compare the differences in the microclimate regulation capabilities of the three configurations of evergreen and deciduous tree species. Correlation analysis was employed to explore the relationship between the microclimate effect of urban trees with three different configuration modes and E, Gs, VpdL, and 3DGQ, and the studied parameters for the microclimate effect of urban trees were determined through stepwise regression. To explore the extent to which each parameter explains the microclimate effect, Amos 24.0 software (IBM, Armonk, NY, USA) was utilized to create the structural equation model (SEM). In all the comparisons, p < 0.05 was considered statistically significant. All diagrams were drawn using Simaplot14.0 (Systat Software, Inc., San Jose, CA, USA) and Origin2019 (Origin Lab Corp, Northampton, MA, USA).
3. Results
3.1. Diurnal Variations in Air Temperature and Relative Humidity of Urban Trees in Different Configuration Modes
Figure 4 depicts the diurnal variations of air temperature and relative humidity of the three configuration modes and the control sites. Air temperature of the three configuration modes and the control sites continuously rose from 8 to 14 h, reached a single peak at 14 h and then decreased between 14 and 18 h. Humidity declined and recovered in an inverted pattern. During the test, the diurnal variations of air temperature and relative humidity in the three configuration modes and the control sites all showed the shape of “U”. In general, although the air temperature and relative humidity variation trends of individual planting (IP), linear planting (LP), and group planting (GP) were similar, air temperature and relative humidity were not statistically significant, but were both numerically greater for the IP versus LP versus for the GP configurations.
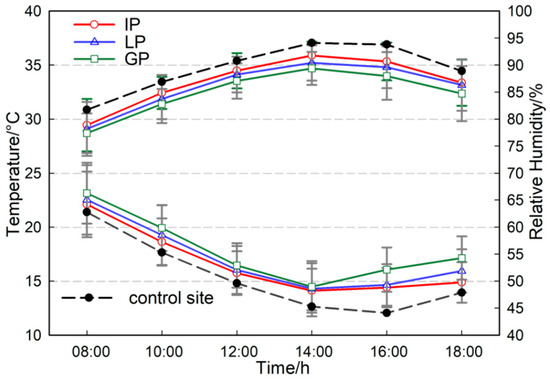
Figure 4.
Diurnal variations of air temperature and relative humidity during the experimental period. IP: individual planting; LP: linear planting; GP: group planting.
3.2. Microclimate Regulation Capabilities of Urban Trees in Different Types and Different Configuration Modes
We undertook a statistical analysis of the microclimate regulation capabilities of the three configuration modes (Tables S1 and S2). The results demonstrated that the average cooling effects of IP, LP, and GP were 1.02 ± 0.78 °C, 1.37 ± 0.96 °C, and 2.05 ± 0.97 °C, respectively (Table S1). The average humidifying effects of IP, LP, and GP were 2.10% ± 1.8%, 2.75% ± 2.08%, and 3.45% ± 2.15%, respectively (Table S2). In order to compare the microclimate regulation capabilities of the three configuration modes, post hoc tests were performed, and the results showed that there were significant differences in cooling and humidifying effects between IP, LP, and GP (p < 0.01), all of which indicate that GP had the most robust microclimate regulation capability, LP came second, and IP had the weakest microclimate regulation capability.
The daily variation trend of the air temperature of individual planting of evergreen (EIP), linear planting of evergreen (ELP), group planting of evergreen (EGP), individual planting of deciduous (DIP), linear planting of deciduous (DLP), group planting of deciduous (DGP), and the control sites all showed a daily trend of first rising and then falling, the maximum temperature for the day was reached at 14 h (Figure 5a). The air temperatures at all measuring points were always lower than those at the control sites. The cooling effects of EGP and DGP were significantly different from 8 to 14 h (p < 0.05), likewise between the cooling effects of ELP and DLP at 12 h and 14 h (p < 0.05), and the cooling effects of EIP and DIP were significantly different at 12 h and 18 h (p < 0.05). The cooling effects of DGP and DLP were not significantly different at 8 h (p > 0.05), but significantly different (p < 0.05) at other time points. The cooling effect of EGP, ELP, and EIP were significantly different from 8 to 16 h (p < 0.05).
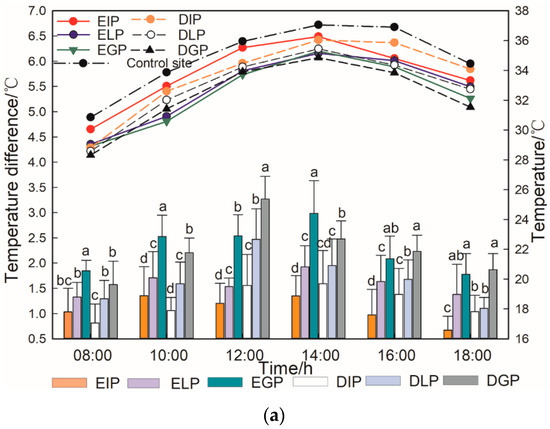
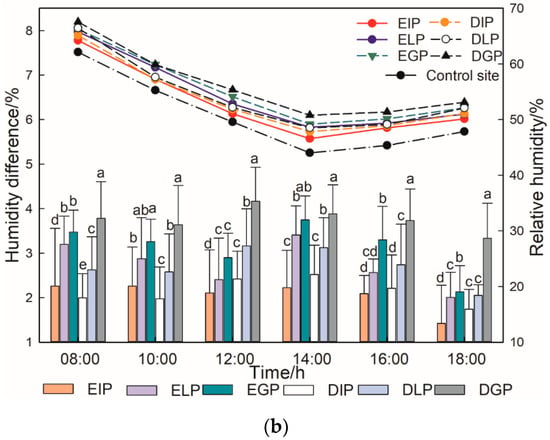
Figure 5.
Meteorological parameters and microclimate regulation capabilities of evergreen tree species (ET) and deciduous tree species (DT).The significant differences between the cooling and humidifying effects of ET and DT in different configuration modes are indicated by different lowercase letters (p < 0.05), two way ANOVA. (a) Daily changes in air temperature, the cooling effect of three configuration modes of evergreen and deciduous tree species at each time point. (b) Daily changes in relative humidity, the humidifying effect of three configuration modes of evergreen and deciduous tree species at each time point. Individual planting of evergreen (EIP); linear planting of evergreen (ELP); group planting of evergreen (EGP); individual planting of deciduous (DIP); linear planting of deciduous (DLP); group planting of deciduous (DGP). Bars represent the means ± standard errors.
Figure 5b shows that the daily variation trend of relative humidity in the three configuration modes and the control sites were similar, the relative humidity at all measuring points were always lower than that at the control sites. Moreover, the actual vapor content of the air stayed the same and the humidity changed because the temperature changed. As for the humidifying effects at each measuring point, DGP and DLP were not significantly different at 10 h and 14 h (p > 0.05), likewise between ELP and DLP from 14 to 18 h (p > 0.05). There was a significant difference between EIP and DIP from 8 to 12 h (p < 0.05), and the humidifying effects of DGP, DLP, and DIP were significantly different at each measurement point (p < 0.05).
3.3. Transpiration Characteristics of Urban Trees with Different Tree Types and Configuration Modes
It can be observed in Figure 6a that the transpiration rates of IP, LP, and GP of ET all showed the same diurnal variation trend, reaching the peak at 12 h. The daily variation trend of Gs of IP, LP, and GP of ET were roughly the same, and the average stomatal conductance ranking at each time point was ranked as GP > LP > IP. With the increase of air temperature in the samples, VpdL also increased and reached a peak at 14 h. With the decrease of air temperature and the increase of relative humidity, VpdL declined, and the value of VpdL at 18 h was more significant than that at 8 h, indicating that the air temperature in the samples in the afternoon is higher than that in the early morning.
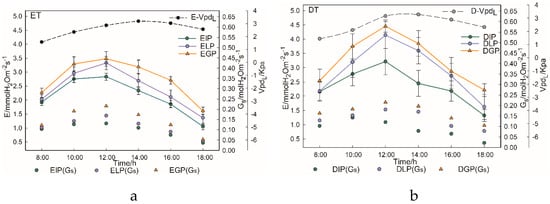
Figure 6.
Daily variations of E, Gs, and VpdL of evergreen tree species (ET) and deciduous tree species (DT) in three configuration modes. Transpiration rate (E); stomatal conductance (Gs); vapor pressure deficit (VpdL); individual planting of evergreen (EIP); linear planting of evergreen (ELP); group planting of evergreen (EGP); individual planting of deciduous (DIP); linear planting of deciduous (DLP); group planting of deciduous (DGP). (a) Diurnal variations of E, Gs, and VpdL of ET in three configuration modes; (b) Diurnal variations of E, Gs, and VpdL of DT in three configuration modes.
Figure 6b indicates that E and Gs of DT with the three configuration modes showed the same diurnal variation trend. The peak value of VpdL in deciduous tree species was at 14 h, and the value at this time was 2.4 times of 8 h. E and Gs of the measured time point were the highest in GP, followed by LP and the lowest in IP. This indicates that there are differences in transpiration between different configuration modes, and the tree species of GP configuration have the most robust transpiration characteristics.
A detailed examination and comparison of the distribution of E and Gs values for the three different planting configurations, followed by a comparison of evergreen versus deciduous species in the three different planting configurations (data not shown, see Figures S1 and S2) resulted in statistically significant differences. For E, critical for cooling and humidifying the air, and the mean value was ranked as GP > LP > IP. In addition, E in deciduous species was statistically greater than E in evergreen species. The average daily transpiration (EL) of ET and DT in three different configuration modes was significantly different (F = 9.107, p < 0.001). The value of DGP was the highest, followed by DLP, EGP, ELP, DIP, and the value of EIP was the lowest (Figure 7). Among them, the total transpiration value of all experimental species from 12 to 14 h was the highest, and EL was ranked as GP > LP > IP.
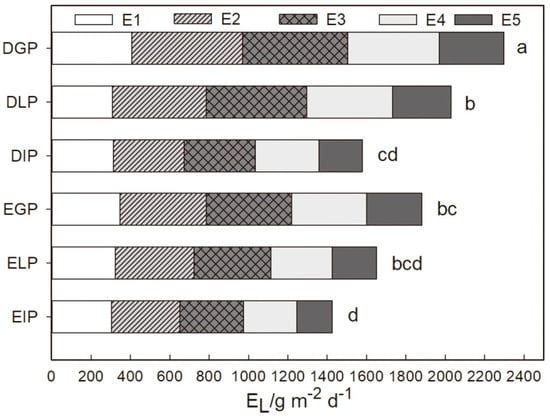
Figure 7.
Total daily transpiration (EL) of evergreen tree species (ET) and deciduous tree species (DT) in three configuration modes. EL = E1 + E2 + E3 + E4 + E5. E1: 8–10 h, E2: 10–12 h, E3: 12–14 h, E4: 14–16 h, E5: 16–18 h; Group planting of deciduous (DGP); linear planting of deciduous (DLP); individual planting of deciduous (DIP); group planting of evergreen (EGP); linear planting of evergreen (ELP); individual planting of evergreen (EIP). Different letters on the bars indicate significant differences at the 5% which are Duncan’s multiple comparison test groups for one dimensional ANOVA.
3.4. Correlation between Microclimate Regulation Ability and Influencing Factors of Urban Trees with Different Configuration Modes
In order to explore the relative contributions of meteorological parameters, transpiration characteristics and 3DGQ to the microclimate regulation ability of urban trees with different configuration modes, Spearman correlation analysis was conducted on the transpiration characteristics of the three configuration modes and their cooling and humidifying effects (Table 3). The cooling and humidifying effects of the three configuration modes all had strong positive correlation with E, Gs, and 3DGQ (p < 0.01), while there was a weak positive correlation with VpdL. However, the cooling and humidifying effects of the three configuration modes were independent of air temperature and relative humidity, and there was a strong positive correlation between the cooling and humidifying effects (p < 0.01).

Table 3.
Spearman correlation analysis of influence factors and cooling and humidifying effects.
There were significant differences between slope and intercept of response of 3DGQ of IP, LP, and GP to the cooling and humidifying effect, which also indicated that the cooling and humidifying effect increases with the increase of 3DGQ (Figure 8a,b). 3DGQ is also an important parameter to measure the microclimate regulation ability of urban trees. When 3DGQ < 5 m3, the microclimate effects of trees were very weak. Besides, the humidifying effect of GP and 3DGQ’s linear model had the highest fitting coefficient among all models.
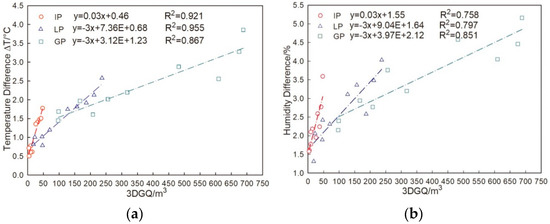
Figure 8.
Correlation and fitting function model of 3DGQ of urban trees with different configuration modes. (a) 3DGQ and cooling effect; (b) 3DGQ and humidifying effect. IP: individual planting; LP: linear planting; GP: group planting; 3DGQ: three dimensional green quantity.
The transpiration rates (E) of IP, LP, and GP are significantly different from each other in the slope and intercept of the response to cooling and humidifying effects (Figure S3a,d). This indicates that the cooling and humidifying effects of urban trees in the three configuration modes are enhanced with the increase of E.
The stomatal conductance (Gs) of IP, LP, and GP showed significant differences in the slope and intercept of the response to cooling and humidifying effects, and the microclimate effects of the three configuration modes of urban tree species increased with the increase of Gs (Figure S3b,e). It is implied that E and Gs are essential parameters to be considered when measuring the microclimate regulation capacity of urban trees.
It is observed from Table 3 that the correlation coefficient between the cooling effect of IP and its VpdL was 0.330, which was a weak correlation (p < 0.05) so that it was impossible to establish a functional model (R2 = 0.078, p = 0.031), and the correlation coefficient between humidifying effect and VpdL was 0.352, also proving impossible to establish a functional model (R2 = 0.093, p = 0.015). However, the vapor pressure deficit (VpdL) of LP and GP had built a linear relationship model with the cooling effect and humidifying effect respectively (Figure S3c,f). In general, the influence of configuration mode on the correlation between microclimate effects of urban tree species and VpdL was less than that between the above transpiration characteristic and microclimate effects.
3.5. Correlation between Microclimate Regulation and Influencing Factors of ET and DT
The correlation coefficients between the cooling effects of evergreen and deciduous trees and their E were 0.892 and 0.854, and the correlation coefficients of humidifying effects and their E were 0.908 and 0.884, respectively, which were extremely significant (p < 0.01; Table 4). The microclimate effects of ET and DT were fitted with E as a linear model (Figure S4a,d). Moreover, the fitting coefficient of the linear model of DT was higher than that of ET.

Table 4.
Spearman correlation analysis of each parameter and cooling and humidifying effects.
Correlation coefficients between the cooling effects of ET and DT and their Gs were 0.770 and 0.757, and the correlation coefficients between the humidifying effect and their Gs were 0.819 and 0.753, respectively (Table 4). The linear model of ET had a higher fitting coefficient than DT (Figure S4b,e).
The microclimate effects of ET and DT were weakly correlated with VpdL (Table 4). The function models of ET and DT fitting with VpdL were both linear models (Figure S4c,f).
As shown in Table 4, the correlation coefficient between the microclimate effects of ET and DT and 3DGQ were very significant (p < 0.01). We found that when 3DGQ < 250 m3 and 3DGQ > 650 m3, the microclimate regulation capability of DT were most robust than that of ET, while when the 250 m3 < 3DGQ < 650 m3, the microclimate regulation ability of ET were more potent than that of DT (Figure 9a,b).
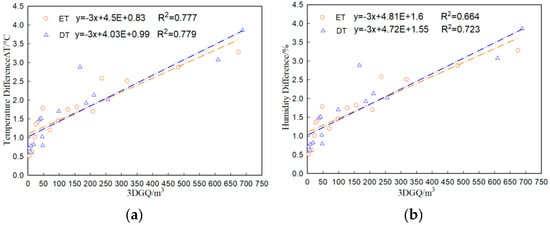
Figure 9.
Correlation and fitting function model of 3DGQ of ET and DT. (a) 3DGQ and cooling effect; (b) 3DGQ and humidifying effect. ET: evergreen tree species; DT: deciduous tree species; 3DGQ: three dimensional green quantity.
3.6. Structural Equation Model of Microclimate Regulation Ability of Urban Trees
In order to explore the influencing factors that affect the microclimate regulation capacity of urban trees, a structural equation model (SEM) was constructed (Figure 10). The results showed that E, Gs, VpdL, and 3DGQ were critical parameters to measure the microclimate regulation capacity of urban trees. Among them, E was significantly positively correlated with Gs and 3DGQ, while E was weakly correlated with VpdL and VpdL was weakly correlated with 3DGQ. It was surprising that Gs did not correlate with VPD, as it did in most studies (Figure 10). The cooling and humidifying effects of E on urban trees displayed 52% and 41% variation respectively. The cooling and humidifying effects of Gs on trees accounted for 12% and 16% of the variation, respectively; VpdL could not explain the cooling effect but could explain 13% variation of humidification effect. The cooling and humidifying effects of 3DGQ on trees could explain 38% and 36% of the variation, respectively. Figure 10 indicates that E, Gs, and 3DGQ can explain 93% variation in the cooling effect of trees, while E, Gs, VpdL, and 3DGQ can explain 85% variation in the humidifying effect of trees. This also indicates that the microclimate regulation ability of urban trees is the result of the comprehensive action of multiple index parameters.
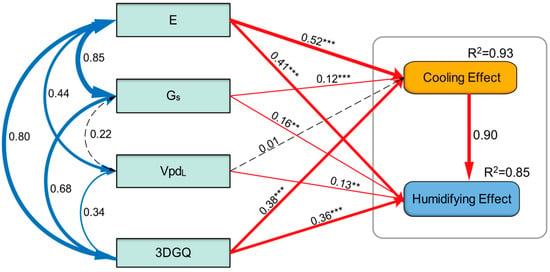
Figure 10.
The structural equation model (SEM) shows the direct and indirect effects of various factors on the microclimate regulation ability of urban trees. The value of the arrow is the normalized path coefficient, indicating the degree of influence of the correlation. The red solid arrow indicates the important relationships in the model, the blue solid arrow indicates the positive correlation, and the black virtual arrow indicates that there is no significant correlation. The R2 value represents the ratio of the explanatory variance. The path coefficient is estimated by maximum likelihood and the fitness of the chi-square test model is tested. Significance level: * p < 0.01, ** p < 0.001. E: transpiration rate; Gs: stomatal conductance; 3DGQ: three dimensional green quantity; VpdL: vapor pressure deficit.
4. Discussion
4.1. Differences of Microclimate Regulation Ability of Urban Trees with Different Tree Species Types and Configuration Modes
Urban trees can improve urban microclimate by reducing summer temperature [33]. Different planting and arrangement of trees may have diverse effects on air temperature modification [6,34]. We conducted a study on the regulating microclimate effect of 10 urban tree species of three configuration modes in Xi’an. Our results revealed that among the three planting configurations of the same tree species, GP showed superior capability in regulating microclimate, and the maximum temperature difference between GP and the control site could reach 5.32 °C. The canopy overlap of trees might explained this planted adjacent to each other increases the cooling and humidifying effects [35]. Similarly, previous researchers also found that the air temperature under solitary tree planting decreased by 1 °C [21] and 1.6 °C [36]. The grove (a small group of trees) has positive effects on the thermal and air quality component of the urban climate [37,38,39]. This indicates that the more complex the configuration mode is, the larger the three-dimensional green quantity of the samples will be, and the stronger microclimate regulation capability will be, which is consistent with the findings of Hamada [40] in discussing the relationship between urban air temperature and vegetation coverage. GP has high vegetation coverage rate and large amount of greening, indicating higher microclimate regulation ability. This could explain why configuration modes of trees have different effects on intercepting short-wave radiation and reducing sensible heat [41]. This finding also implies that LP had higher microclimate regulation ability compared to IP. However, it is inconsistent with the findings of Wang and others [38], a possible explanation for this might be that the underlying surface of the samples selected in this study is grassland, while their underlying surface was hard scape, which can offset part of the cooling effect [38], and the transpiration of the trees growing in turf surface are ten times higher than that in the asphalt pavement [42]. Moreover, not just the trees, the underlying grass also transpires. The combination of trees and underlying grass increases total transpiration and thus cooling. Compared with open grassland, the surface temperature of grass under the canopy reduced by 8 °C, indicating the importance of the shading provided by tree crowns [43]. Hence, in order to determine the influence of different configuration methods on the microclimate effect of urban trees, the surface temperatures would be a valuable addition to future research analyzing urban tree effects on the microclimate. When possible, the planting design in this district should focus on increasing the proportion of GP in tree plantings.
Different tree species have unique microclimate regulation potentials [44]. Zhao and his colleagues [34] demonstrated that two foliar longevity species (evergreen and deciduous) might be important in microclimate regulation. Moreover, deciduous tree species had a greater ability to reduce air temperature than evergreen tree species [45]. Rahman et al. [42] and Bowden and Bauerle [46] have observed that differences in leaf and crown morphology may result in species differences in urban microclimatic modification. It is clear from our data that there are significant differences between evergreen and deciduous species and between different planting configurations. In addition, crown volume is a critical driver of increased temperature and humidity modification.
4.2. Differences in Transpiration Characteristics of Urban Trees with Different Tree Types and Configuration Modes
We concluded that urban trees in the three configuration modes had different E and Gs, which is consistent with the findings of Rahman [47]. This might be due to the interaction and superposition between the canopy of the group planting and the canopy of the trees blocks the direct sunlight penetration, so that the stomata of the leaves do not closed due to excessive-high temperature, and the transpiration rate and stomatal conductance value are not affected. Previous studies have focused on describing the diurnal transpiration of a single tree species, but there has been little quantitative research on the transpiration of urban trees based on different configuration modes of experimental data. Thus, the above conclusions will contribute to a better understanding of the physiological processes of trees.
For the diurnal variation in the transpiration of evergreen and deciduous trees with the three configurations, the transpiration reached a peak at 12 h and declined after 12 h because of the high air temperature at noon, and plants temporarily closed or reduced the stomatal opening and closing degree in order to preserve water, thus vegetation transpiration reached the peak [47]. Meanwhile, as the temperature continues to rise, intense solar radiation will affect the air relative humidity, and water stress may lead to a decrease in the transpiration rate of trees [24]. Therefore, if the trees were irrigated properly, their transpiration rate will rise, which could reduce the heat load of the city. However, transpiration rates of test trees were different from [48], the explanation for this inconsistency might be the specific climate and soil conditions, making it challenging to compare transpiration rates around the world. The effects of urban trees on microclimate through transpiration are highly heterogeneous, for instance, T. cordata has a transpiration rate three times that of R. pseudoacacia [49]. Surprisingly, E and Gs of IP were not significantly different, while the differences between LP and GP were significant. This difference may be due to leaf thickness is inversely proportional to transpiration rate in different tree types and configuration modes [42]. Meanwhile, E is greatly influenced by plant characteristics [50]. Based on the above results, the correct selection of trees with excellent transpiration characteristics plays a critical role in reducing the urban heat island effect.
Different tree type is a major factor affecting the total transpiration of tree species in midsummer [51]. The average daily transpiration (EL) of deciduous trees was higher than that of evergreen trees. Evergreen tree leaves are thick and waxy, which reduce stomatal openness and enhance stomatal resistance so that it helps to reduce the transpiration rate and reduce the transpiration water consumption, such physiological characteristics are conducive to avoid excessive moisture loss [52]. Meanwhile, GP had the highest EL, followed by LP, and IP. Consequently, the transpiration characteristics of urban trees will be affected by the configuration mode and tree types.
4.3. Relationship between Microclimate Effect and Transpiration of Trees
Transpiration of urban trees plays a vital role in regulating the canopy thermal environment [53]. In our research, we emphasized the importance of tree transpiration, and the microclimate effects of different tree configurations showed a significant correlation with E and GS. The higher the transpiration rate was, the colder and wetter the surrounding will be, which is consistent with Lindén [54]. Tree species with high transpiration intensity had more heat consumption, and the cooling effect on the surrounding air was obviously better than the area without vegetation [42]. In addition, the transpiration rate not only determines the amount of water vapor evaporated by plants, but also determines the microclimate regulation capacity of plants, which indicate that the transpiration cooling effect of tree species leads to the difference in temperature and humidity in configuration modes. Configurations, and tree species with intense transpiration should be selected to reduce the urban heat island effect, which means more latent heat can be emitted [55].
The increase of air temperature and VpdL will affect the transpiration of vegetation [56]. We uncovered that the microclimate effect of urban trees with different configurations was weakly correlated with VpdL, indicating that VpdL could not explain the cooling effect of experimental trees, which seems to be consistent with the results of Zhou [28]. In hot summer regions, vegetation is vulnerable to temperature and water stress [19], the increase in the air temperature leads to the stomatal opening but the decrease of relative humidity normally leads to stomatal closure, thus enhancing transpiration. However, excessive heat and increased VpdL between leaves and air would significantly lead to reducing transpiration, which is also the self-protection mechanism of plants against water loss [57]. Hence, the microclimate regulation capacity of urban trees may be affected by transpiration. Based on ensuring pretty appearance and reducing urban heat load, choose tree species with excellent transpiration characteristics for planting design.
4.4. Relationship between Microclimate Regulation Ability and Tree Structure Factors
Our results suggest that transpiration is not the only factor affecting the microclimate regulation capacity of urban trees but also depends on the structural factors of trees such as 3DGQ. The current study shows that there is a strong correlation between microclimate regulation capability of trees and 3DGQ. These results support evidence from previous observations [47], which suggested to select species with a high transpiration rate and high value of 3DGQ and planted in clusters designed to improve residents’ thermal experience. In our study, the same trees can exert more significant cooling and humidifying potential under the planting mode of GP, which is consistent with the findings of Morakinyo [58]. With the increase of 3DGQ, their canopy coverage rate also increases, and the microclimate regulation ability of trees also becomes more robust [58]. Therefore, 3DGQ could be an index to evaluate the microclimate effects of urban trees.
4.5. Limitations and Future Research
Several constraints of this study should be acknowledged. Firstly, this experiment was conducted in the humid subtropical region. The physiological parameters of trees may be different in different cities, and the results cannot be applied to cities with other climatic characteristics. Secondly, this research focuses on the hot summer, which allows long-term monitoring of physiological processes and microclimate effects of urban trees. Thirdly, data were also restricted to sunny days with low wind speeds. Nevertheless, this study provides a reference for designers and managers of campus green space and green park space in the future plant planting design. Landscape architects use the arrangement of group planting with combine shrubs or herbs under the trees, which is beneficial to maximize the cold island effect of urban green space. At the same time, the application proportion of deciduous broadleaf trees should be appropriately increased on both sides of the road or in recreational places to give full play to its cooling and humidifying potential.
5. Conclusions
In this study, 10 different species of urban trees with three configuration modes were selected. By monitoring the physiological and meteorological parameters of trees, the differences of physiological and meteorological parameters of urban trees with three configuration modes were revealed, as well as the influence of physiological parameters and 3DGQ on the microclimate regulation ability of trees. The principal conclusions could be drawn as follows:
- (1)
- Urban trees with three different configuration modes all have specific improving effects on the surrounding environment, among which GP had the most robust microclimate regulation capability, followed by LP and IP.
- (2)
- DT had better microclimate regulation ability than ET. The microclimate regulation capability of deciduous trees in GP was always more robust than that of LP and IP.
- (3)
- Transpiration characteristics of trees were affected by configuration modes. GP had the best transpiration characteristics, followed by LP and IP.
- (4)
- The microclimate regulation capabilities of urban tree species with different configuration modes were affected by E, Gs, and 3DGQ, and have a weak relationship with VpdL.
- (5)
- The physiological parameters and 3DGQ of urban trees could explain 93% of the cooling effect and 85% of the humidifying effect. The transpiration characteristics and microclimate effects of urban trees depended primarily on the species and configuration mode of the tree. The microclimate regulation capability of urban trees is the result of multiple parameters.
To sum up, urban trees can significantly improve the urban climate and mitigate the effects of climate change. The arrangement of trees affects their physiological parameters and microclimate regulation, and the cooling and humidifying effects depend more on tree species type and planting design. The results are helpful in selecting a suitable planting layout and tree species to reduce the urban heat island effect. Moreover, the relationship between leaf function traits (leaf thickness, leaf area, leaf anatomical structure) of urban trees and their microclimate regulation ability can be considered in the future studies. Finally, given the above research, more theoretical support can be provided for landscape designers in future planting design to reduce the negative impact of the urban heat island effect.
Supplementary Materials
The following are available online at https://www.mdpi.com/1999-4907/11/8/825/s1, Table S1: Average cooling effect of the three configuration modes. IP: individual planting; LP: linear planting; GP: group planting. Table S2: Average humidifying effect of the three configuration modes. IP: individual planting; LP: linear planting; GP: group planting. Figure S1: Differences in transpiration characteristics among the three configuration modes. (a) E; (b) Gs. Significant differences between configuration modes are indicated by different letters (p < 0.05). E: transpiration rate; Gs: stomatal conductance. The filled area represents data distribution. Figure S2: Transpiration characteristics of evergreen and deciduous tree species. (a) E; (b) Gs. ns: no significant; *represents a significant level (p < 0.05). E: transpiration rate; Gs: stomatal conductance; ET: evergreen tree species; DT: deciduous tree species. Figure S3: Correlation and fitting function model of microclimate regulation and transpiration characteristics of urban trees with different configuration modes. (a) E and cooling effect; (b) Gs and cooling effect; (c) VpdL and cooling effect; (d) E and humidifying effect; (e) Gs and humidifying effect; (f) VpdL and humidifying effect. IP: individual planting; LP: linear planting; GP: group planting; E: transpiration rate; Gs: stomatal conductance. Figure S4: Microclimate regulation and transpiration characteristics of ET and DT. (a) E and cooling effect; (b) Gs and cooling effect; (c) VpdL and cooling effect; (d) E and humidifying effect; (e) Gs and humidifying effect; (f) VpdL and humidifying effect. ET: evergreen tree species; DT: deciduous tree species; E: transpiration rate; Gs: stomatal conductance; VpdL: vapor pressure deficit.
Author Contributions
Conceptualization, W.J.; methodology, W.J. and D.Z.; validation, W.J. and D.Z.; formal analysis, D.Z. and Q.L.; investigation, D.Z. and Q.L. and Y.S.; data curation, D.Z. and M.W. and S.C. and K.S.; writing—original draft preparation, D.Z.; writing—review and editing, W.J.; visualization, D.Z.; funding acquisition, W.J. All authors have read and agreed to the published version of the manuscript.
Funding
This research was funded by the Major Forestry Research Project of Shaanxi Province, grant numbers SHLY-2018-02.
Acknowledgments
We would especially like to thank Kaiyuan Li, Qian Rao, Manru Wang, Jiayu Song and Shuang Cao for helping us to prepare for the experiment. We appreciate the invaluable comments from anonymous reviewers for improving the manuscript.
Conflicts of Interest
The authors declare no conflict of interest.
References
- Stratópoulos, L.M.F.; Duthweiler, S.; Häberle, K.-H.; Pauleit, S. Effect of native habitat on the cooling ability of six nursery-grown tree species and cultivars for future roadside plantings. Urban For. Urban Green. 2018, 30, 37–45. [Google Scholar] [CrossRef]
- Zhang, Z.; Lv, Y.; Pan, H. Cooling and humidifying effect of plant communities in subtropical urban parks. Urban For. Urban Green. 2013, 12, 323–329. [Google Scholar] [CrossRef]
- Konarska, J.; Lindberg, F.; Larsson, A.; Thorsson, S.; Holmer, B. Transmissivity of solar radiation through crowns of single urban trees—Application for outdoor thermal comfort modelling. Theor. Appl. Climatol. 2013, 117, 363–376. [Google Scholar] [CrossRef]
- Myint, S.W.; Zheng, B.; Talen, E.; Fan, C.; Kaplan, S.; Middel, A.; Smith, M.; Huang, H.-P.; Brazel, A. Does the spatial arrangement of urban landscape matter? examples of urban warming and cooling in phoenix and las vegas. Ecosyst. Health Sustain. 2017, 1, 1–15. [Google Scholar] [CrossRef]
- Fan, C.; Myint, S.W.; Zheng, B. Measuring the spatial arrangement of urban vegetation and its impacts on seasonal surface temperatures. Prog. Phys. Geogr. 2015, 39, 199–219. [Google Scholar] [CrossRef]
- Sodoudi, S.; Zhang, H.; Chi, X.; Müller, F.; Li, H. The influence of spatial configuration of green areas on microclimate and thermal comfort. Urban For. Urban Green. 2018, 34, 85–96. [Google Scholar] [CrossRef]
- Amani-Beni, M.; Zhang, B.; Xie, G.; Xu, J. Impact of urban park’s tree, grass and waterbody on microclimate in hot summer days: A case study of Olympic Park in Beijing, China. Urban For. Urban Green. 2018, 32, 1–6. [Google Scholar] [CrossRef]
- Wang, Y.; Berardi, U.; Akbari, H. Comparing the effects of urban heat island mitigation strategies for Toronto, Canada. Energy Build. 2016, 114, 2–19. [Google Scholar] [CrossRef]
- Hajat, S.; Kosatky, T. Heat-related mortality: A review and exploration of heterogeneity. J. Epidemiol. Community Health 2010, 64, 753–760. [Google Scholar] [CrossRef]
- Battisti, D.S.; Naylor, R.L. Historical Warnings of Future Food Insecurity with Unprecedented Seasonal Heat. Science 2009, 323, 240–244. [Google Scholar] [CrossRef]
- Morakinyo, T.E.; Kong, L.; Lau, K.K.-L.; Yuan, C.; Ng, E. A study on the impact of shadow-cast and tree species on in-canyon and neighborhood’s thermal comfort. Build. Environ. 2017, 115, 1–17. [Google Scholar] [CrossRef]
- Bratman, G.N.; Anderson, C.B.; Berman, M.G.; Cochran, B.; de Vries, S.; Flanders, J.; Folke, C.; Frumkin, H.; Gross, J.J.; Hartig, T.; et al. Nature and mental health: An ecosystem service perspective. Sci. Adv. 2019, 5. [Google Scholar] [CrossRef] [PubMed]
- Duarte, D.H.S.; Shinzato, P.; Gusson, C.d.S.; Alves, C.A. The impact of vegetation on urban microclimate to counterbalance built density in a subtropical changing climate. Urban Clim. 2015, 14, 224–239. [Google Scholar] [CrossRef]
- Zölch, T.; Maderspacher, J.; Wamsler, C.; Pauleit, S. Using green infrastructure for urban climate-proofing: An evaluation of heat mitigation measures at the micro-scale. Urban For. Urban Green. 2016, 20, 305–316. [Google Scholar] [CrossRef]
- El-Bardisy, W.M.; Fahmy, M.; El-Gohary, G.F. Climatic Sensitive Landscape Design: Towards a Better Microclimate through Plantation in Public Schools, Cairo, Egypt. Procedia Soc. Behav. Sci. 2016, 216, 206–216. [Google Scholar] [CrossRef]
- Hami, A.; Abdi, B.; Zarehaghi, D.; Maulan, S.B. Assessing the thermal comfort effects of green spaces: A systematic review of methods, parameters, and plants’ attributes. Sustain. Cities Soc. 2019, 49. [Google Scholar] [CrossRef]
- Zhang, L.; Zhan, Q.; Lan, Y. Effects of the tree distribution and species on outdoor environment conditions in a hot summer and cold winter zone: A case study in Wuhan residential quarters. Build. Environ. 2018, 130, 27–39. [Google Scholar] [CrossRef]
- Wang, Y.; Akbari, H. The effects of street tree planting on Urban Heat Island mitigation in Montreal. Sustain. Cities Soc. 2016, 27, 122–128. [Google Scholar] [CrossRef]
- Connors, J.P.; Galletti, C.S.; Chow, W.T.L. Landscape configuration and urban heat island effects: Assessing the relationship between landscape characteristics and land surface temperature in Phoenix, Arizona. Landsc. Ecol. 2012, 28, 271–283. [Google Scholar] [CrossRef]
- Taha, H. Urban Climates and Heat Islands: Albedo, Evapotranspiration, and Anthropogenic Heat. Energy Build. 1997, 25, 99–103. [Google Scholar] [CrossRef]
- Rahman, M.A.; Moser, A.; Roetzer, T.; Pauleit, S. Within canopy temperature differences and cooling ability of Tilia cordata trees grown in urban conditions. Build. Environ. 2017, 114, 118–128. [Google Scholar] [CrossRef]
- Smithers, R.J.; Doick, K.J.; Burton, A.; Sibille, R.; Steinbach, D.; Harris, R.; Groves, L.; Blicharska, M. Comparing the relative abilities of tree species to cool the urban environment. Urban Ecosyst. 2018, 21, 851–862. [Google Scholar] [CrossRef]
- Jiao, M.; Zhou, W.; Zheng, Z.; Wang, J.; Qian, Y. Patch size of trees affects its cooling effectiveness: A perspective from shading and transpiration processes. Agric. For. Meteorol. 2017, 247, 293–299. [Google Scholar] [CrossRef]
- Ballinas, M.; Barradas, V.L. Transpiration and stomatal conductance as potential mechanisms to mitigate the heat load in Mexico City. Urban For. Urban Green. 2016, 20, 152–159. [Google Scholar] [CrossRef]
- Liang, H.; Li, W.; Zhang, Q.; Zhu, W.; Chen, D.; Liu, J.; Shu, T. Using unmanned aerial vehicle data to assess the three-dimension green quantity of urban green space: A case study in Shanghai, China. Landsc. Urban Plan. 2017, 164, 81–90. [Google Scholar] [CrossRef]
- Cheng, H.; Matteo, C.; Feng, Z.; Zhang, S.; Matteo, C. Using LiDAR Data to Measure the 3D Green Biomass of Beijing Urban Forest in China. PLoS ONE 2013, 8, e75920. [Google Scholar]
- Qiu, G.Y.; Zou, Z.; Li, X.; Li, H.; Guo, Q.; Yan, C.; Tan, S. Experimental studies on the effects of green space and evapotranspiration on urban heat island in a subtropical megacity in China. Habitat Int. 2017, 68, 30–42. [Google Scholar] [CrossRef]
- Zhou, W.; Wang, J.; Cadenasso, M.L. Effects of the spatial configuration of trees on urban heat mitigation: A comparative study. Remote Sens. Environ. 2017, 195, 1–12. [Google Scholar] [CrossRef]
- Wang, C.; Wang, Z.-H.; Wang, C.; Myint, S.W. Environmental cooling provided by urban trees under extreme heat and cold waves in U.S. cities. Remote Sens. Environ. 2019, 227, 28–43. [Google Scholar] [CrossRef]
- Peel, M.C.; Finlayson, B.L.; McMahon, T.A. Updated world map of the Köppen-Geiger climate classification. Hydrol. Earth Syst. Sci. 2007, 11, 1633–1644. [Google Scholar] [CrossRef]
- Yu, Z.; Xu, S.; Zhang, Y.; Jorgensen, G.; Vejre, H. Strong contributions of local background climate to the cooling effect of urban green vegetation. Sci. Rep. 2018, 8, 6798. [Google Scholar] [CrossRef] [PubMed]
- Gaylon, S.; Campbell, J.M.N. An Introduction to Environmental Biophysics; Springer: New York, NY, USA, 1998; pp. 75–80. [Google Scholar] [CrossRef]
- Dimoudi, A.; Nikolopoulou, M. Vegetation in the urban environment: Microclimatic analysis and benefits. Energy Build. 2003, 35, 69–76. [Google Scholar] [CrossRef]
- Zhao, Q.; Sailor, D.J.; Wentz, E.A. Impact of tree locations and arrangements on outdoor microclimates and human thermal comfort in an urban residential environment. Urban For. Urban Green. 2018, 32, 81–91. [Google Scholar] [CrossRef]
- Shashua-Bar, L.; Tsiros, I.X.; Hoffman, M.E. A modeling study for evaluating passive cooling scenarios in urban streets with trees. Case study: Athens, Greece. Build. Environ. 2010, 45, 2798–2807. [Google Scholar] [CrossRef]
- Hsieh, C.-M.; Li, J.-J.; Zhang, L.; Schwegler, B. Effects of tree shading and transpiration on building cooling energy use. Energy Build. 2018, 159, 382–397. [Google Scholar] [CrossRef]
- Tobias, S.; Angela, H.; Thomas, S. Cooling Effects and Regulating Ecosystem Services Provided by Urban Trees—Novel Analysis Approaches Using Urban Tree Cadastre Data. Sustainability 2018, 10, 712. [Google Scholar]
- Wang, Y.; Bakker, F.; de Groot, R.; Wortche, H.; Leemans, R. Effects of urban green infrastructure (UGI) on local outdoor microclimate during the growing season. Environ. Monit. Assess. 2015, 187, 732. [Google Scholar] [CrossRef]
- Dronova, I.; Friedman, M.; McRae, I.; Kong, F.; Yin, H. Spatio-temporal non-uniformity of urban park greenness and thermal characteristics in a semi-arid region. Urban For. Urban Green. 2018, 34, 44–54. [Google Scholar] [CrossRef]
- Hamada, S.; Ohta, T. Seasonal variations in the cooling effect of urban green areas on surrounding urban areas. Urban For. Urban Green. 2010, 9, 15–24. [Google Scholar] [CrossRef]
- Wu, Z.; Chen, L. Optimizing the spatial arrangement of trees in residential neighborhoods for better cooling effects: Integrating modeling with in-situ measurements. Landsc. Urban Plan. 2017, 167, 463–472. [Google Scholar] [CrossRef]
- Rahman, M.A.; Stratopoulos, L.M.F.; Moser-Reischl, A.; Zölch, T.; Häberle, K.-H.; Rötzer, T.; Pretzsch, H.; Pauleit, S. Traits of trees for cooling urban heat islands: A meta-analysis. Build. Environ. 2020, 170. [Google Scholar] [CrossRef]
- Lin, B.S.; Lin, Y.J. Cooling effect of shade trees with different characteristics in a subtropical urban park. Hortscience 2010, 45, 83–86. [Google Scholar] [CrossRef]
- Shashua-Bar, L.; Pearlmutter, D.; Erell, E. The influence of trees and grass on outdoor thermal comfort in a hot-arid environment. Int. J. Climatol. 2011, 31, 1498–1506. [Google Scholar] [CrossRef]
- Manickathan, L.; Defraeye, T.; Allegrini, J.; Derome, D.; Carmeliet, J. Parametric study of the influence of environmental factors and tree properties on the transpirative cooling effect of trees. Agric. For. Meteorol. 2018, 248, 259–274. [Google Scholar] [CrossRef]
- Bowden, J.D.; Bauerle, W.L. Measuring and modeling the variation in species-specific transpiration in temperate deciduous hardwoods. Tree Physiol. 2008, 28, 1675–1683. [Google Scholar] [CrossRef]
- Rahman, M.A.; Hartmann, C.; Moser-Reischl, A.; von Strachwitz, M.F.; Paeth, H.; Pretzsch, H.; Pauleit, S.; Rötzer, T. Tree cooling effects and human thermal comfort under contrasting species and sites. Agric. For. Meteorol. 2020, 287. [Google Scholar] [CrossRef]
- Moss, J.L.; Doick, K.J.; Smith, S.; Shahrestani, M. Influence of evaporative cooling by urban forests on cooling demand in cities. Urban For. Urban Green. 2019, 37, 65–73. [Google Scholar] [CrossRef]
- Rahman, M.A.; Moser, A.; Rötzer, T.; Pauleit, S. Comparing the transpirational and shading effects of two contrasting urban tree species. Urban Ecosyst. 2019, 22, 683–697. [Google Scholar] [CrossRef]
- JL, H. Stomata of trees growing in CO2-enriched air show reduced sensitivity to vapour pressure deficit and drought. Plant Cell Environ. 1998, 21, 1077–1088. [Google Scholar]
- Peters, E.B.; McFadden, J.P.; Montgomery, R.A. Biological and environmental controls on tree transpiration in a suburban landscape. J. Geophys. Res. 2010, 115. [Google Scholar] [CrossRef]
- Chen, X.; Zhao, P.; Hu, Y.; Ouyang, L.; Zhu, L.; Ni, G. Canopy transpiration and its cooling effect of three urban tree species in a subtropical city—Guangzhou, China. Urban For. Urban Green. 2019, 43. [Google Scholar] [CrossRef]
- Moser-Reischl, A.; Rahman, M.A.; Pauleit, S.; Pretzsch, H.; Rötzer, T. Growth patterns and effects of urban micro-climate on two physiologically contrasting urban tree species. Landsc. Urban Plan. 2019, 183, 88–99. [Google Scholar] [CrossRef]
- Lindén, J.; Fonti, P.; Esper, J. Temporal variations in microclimate cooling induced by urban trees in Mainz, Germany. Urban For. Urban Green. 2016, 20, 198–209. [Google Scholar] [CrossRef]
- Wang, X.; Wang, X.; Sun, X.; Berlyn, G.P.; Rehim, A. Effect of pavement and water deficit on biomass allocation and whole-tree transpiration in two contrasting urban tree species. Urban Ecosyst. 2020. [Google Scholar] [CrossRef]
- Eamus, D.; Boulain, N.; Cleverly, J.; Breshears, D.D. Global change-type drought-induced tree mortality: Vapor pressure deficit is more important than temperature per se in causing decline in tree health. Ecol. Evol. 2013, 3, 2711–2729. [Google Scholar] [CrossRef] [PubMed]
- Lee, S.W.; Hwang, S.J.; Lee, S.B.; Hwang, H.S.; Sung, H.C. Landscape ecological approach to the relationships of land use patterns in watersheds to water quality characteristics. Landsc. Urban Plan. 2009, 92, 80–89. [Google Scholar] [CrossRef]
- Morakinyo, T.E.; Lam, Y.F. Simulation study on the impact of tree-configuration, planting pattern and wind condition on street-canyon’s micro-climate and thermal comfort. Build. Environ. 2016, 103, 262–275. [Google Scholar] [CrossRef]
© 2020 by the authors. Licensee MDPI, Basel, Switzerland. This article is an open access article distributed under the terms and conditions of the Creative Commons Attribution (CC BY) license (http://creativecommons.org/licenses/by/4.0/).