1. Introduction
Wildfires have a high impact on the natural environment, which affects both the ecosystem itself and the residents’ quality of life [
1,
2,
3,
4,
5]. This leads to the need to design public policies aimed at reducing both the number of fires and the area affected, and thereby minimizing the impact on the population in terms of health and safety, but also economically, both in the short term (destruction of valuable timber) and in the long run (for example, due to soil erosion and air pollution, which reduces the agricultural and eco-touristic potential) [
6]. To achieve these objectives, two types of policies can be designed. Policies applied before the fires are called “ex ante” policies. These are focused on fire prevention, including cleaning and training activities, as well as disposition of firefighters, amongst others [
7,
8,
9,
10,
11]. Policies aimed at reducing the impact of fires once they have happened are classified as “ex post” policies. These focus on an efficient firefighting response, on measures to recover the natural environment, and on legal and economic liability imposition for the damage caused by the fire [
12].
Spain has traditionally been one of Europe’s countries with the highest incidence of wildfires. Spain has a framework regulation with regard to forests and their management [
13,
14,
15]. However, the responsibility to design and carry out actual forest management policies lies with the regional, provincial and local governments [
16,
17]. These have indeed developed numerous local regulations, forest cleaning programs and strategic plans [
18]. All these measures have a high economic impact on the taxpayer, and the public should therefore be entitled to expect cost-effectiveness optimization [
19].
A first observation in this respect is that wildfires do not affect all regions of Spain to the same extent [
20].
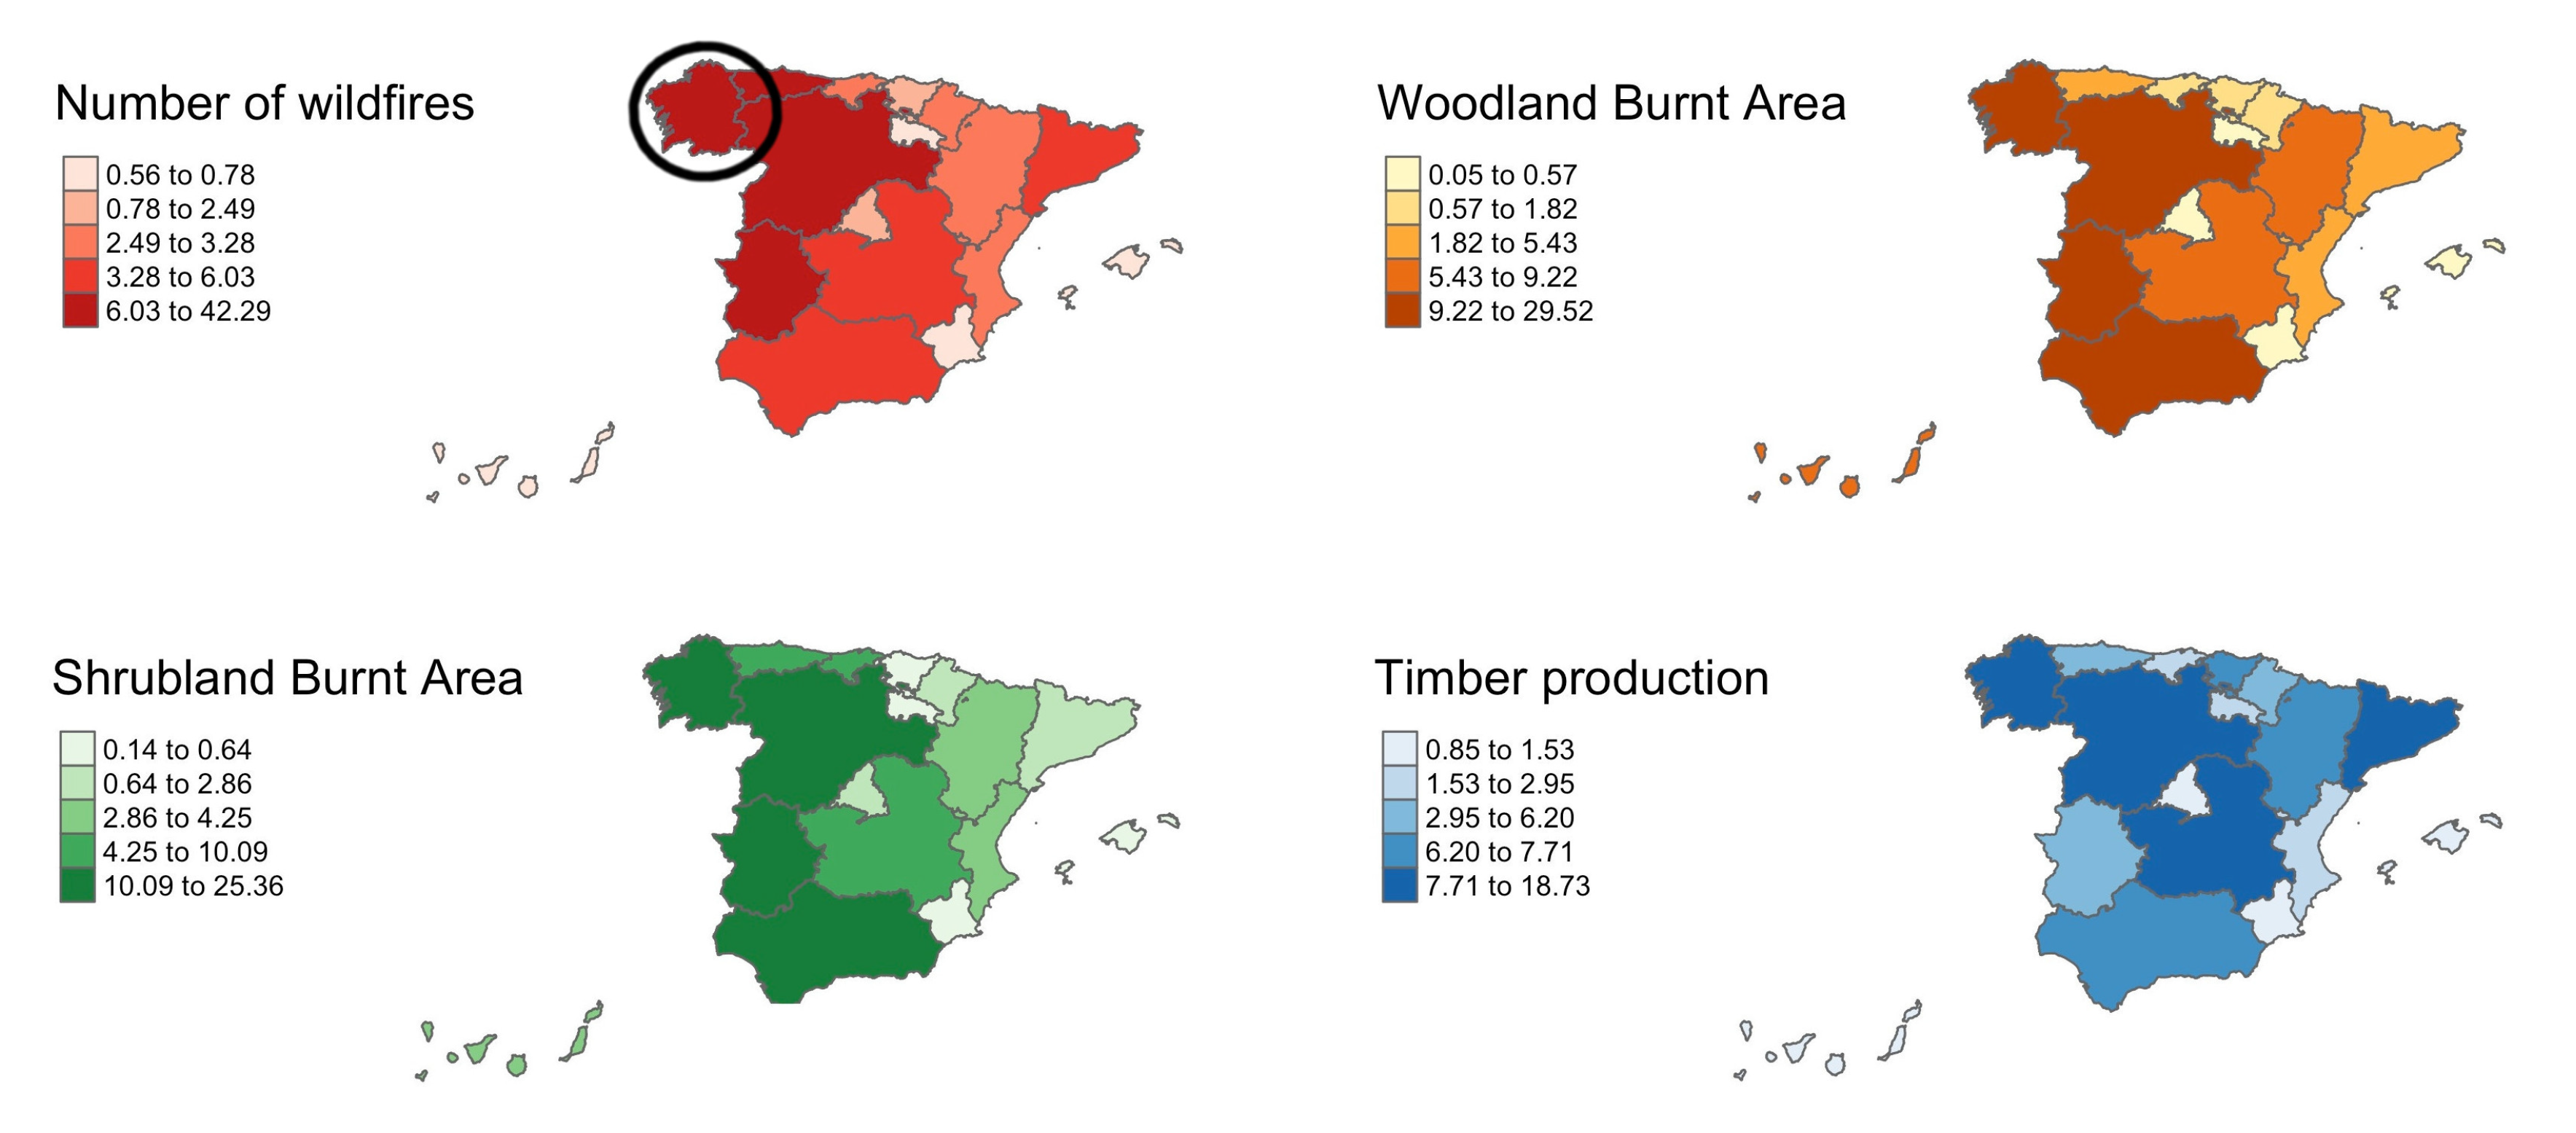
Figure 1 shows that the northwest is by far the part of Spain most affected by wildfires, both in absolute number of fires and in terms of affected area, while it is also the region where wood production is the most important.
More specifically, it can be seen from
Figure 1 that Galicia is the Spanish region most affected by wildfires, while at the same time having the largest share (18.73%) of total national timber production [
22]. Therefore, it is particularly important to protect forest resources in Galicia in order to guarantee the future of the timber sector. With this objective in mind, forest regulation in Galicia has designated 19 forest districts in order to implement public policies aimed at preventing fires [
23].
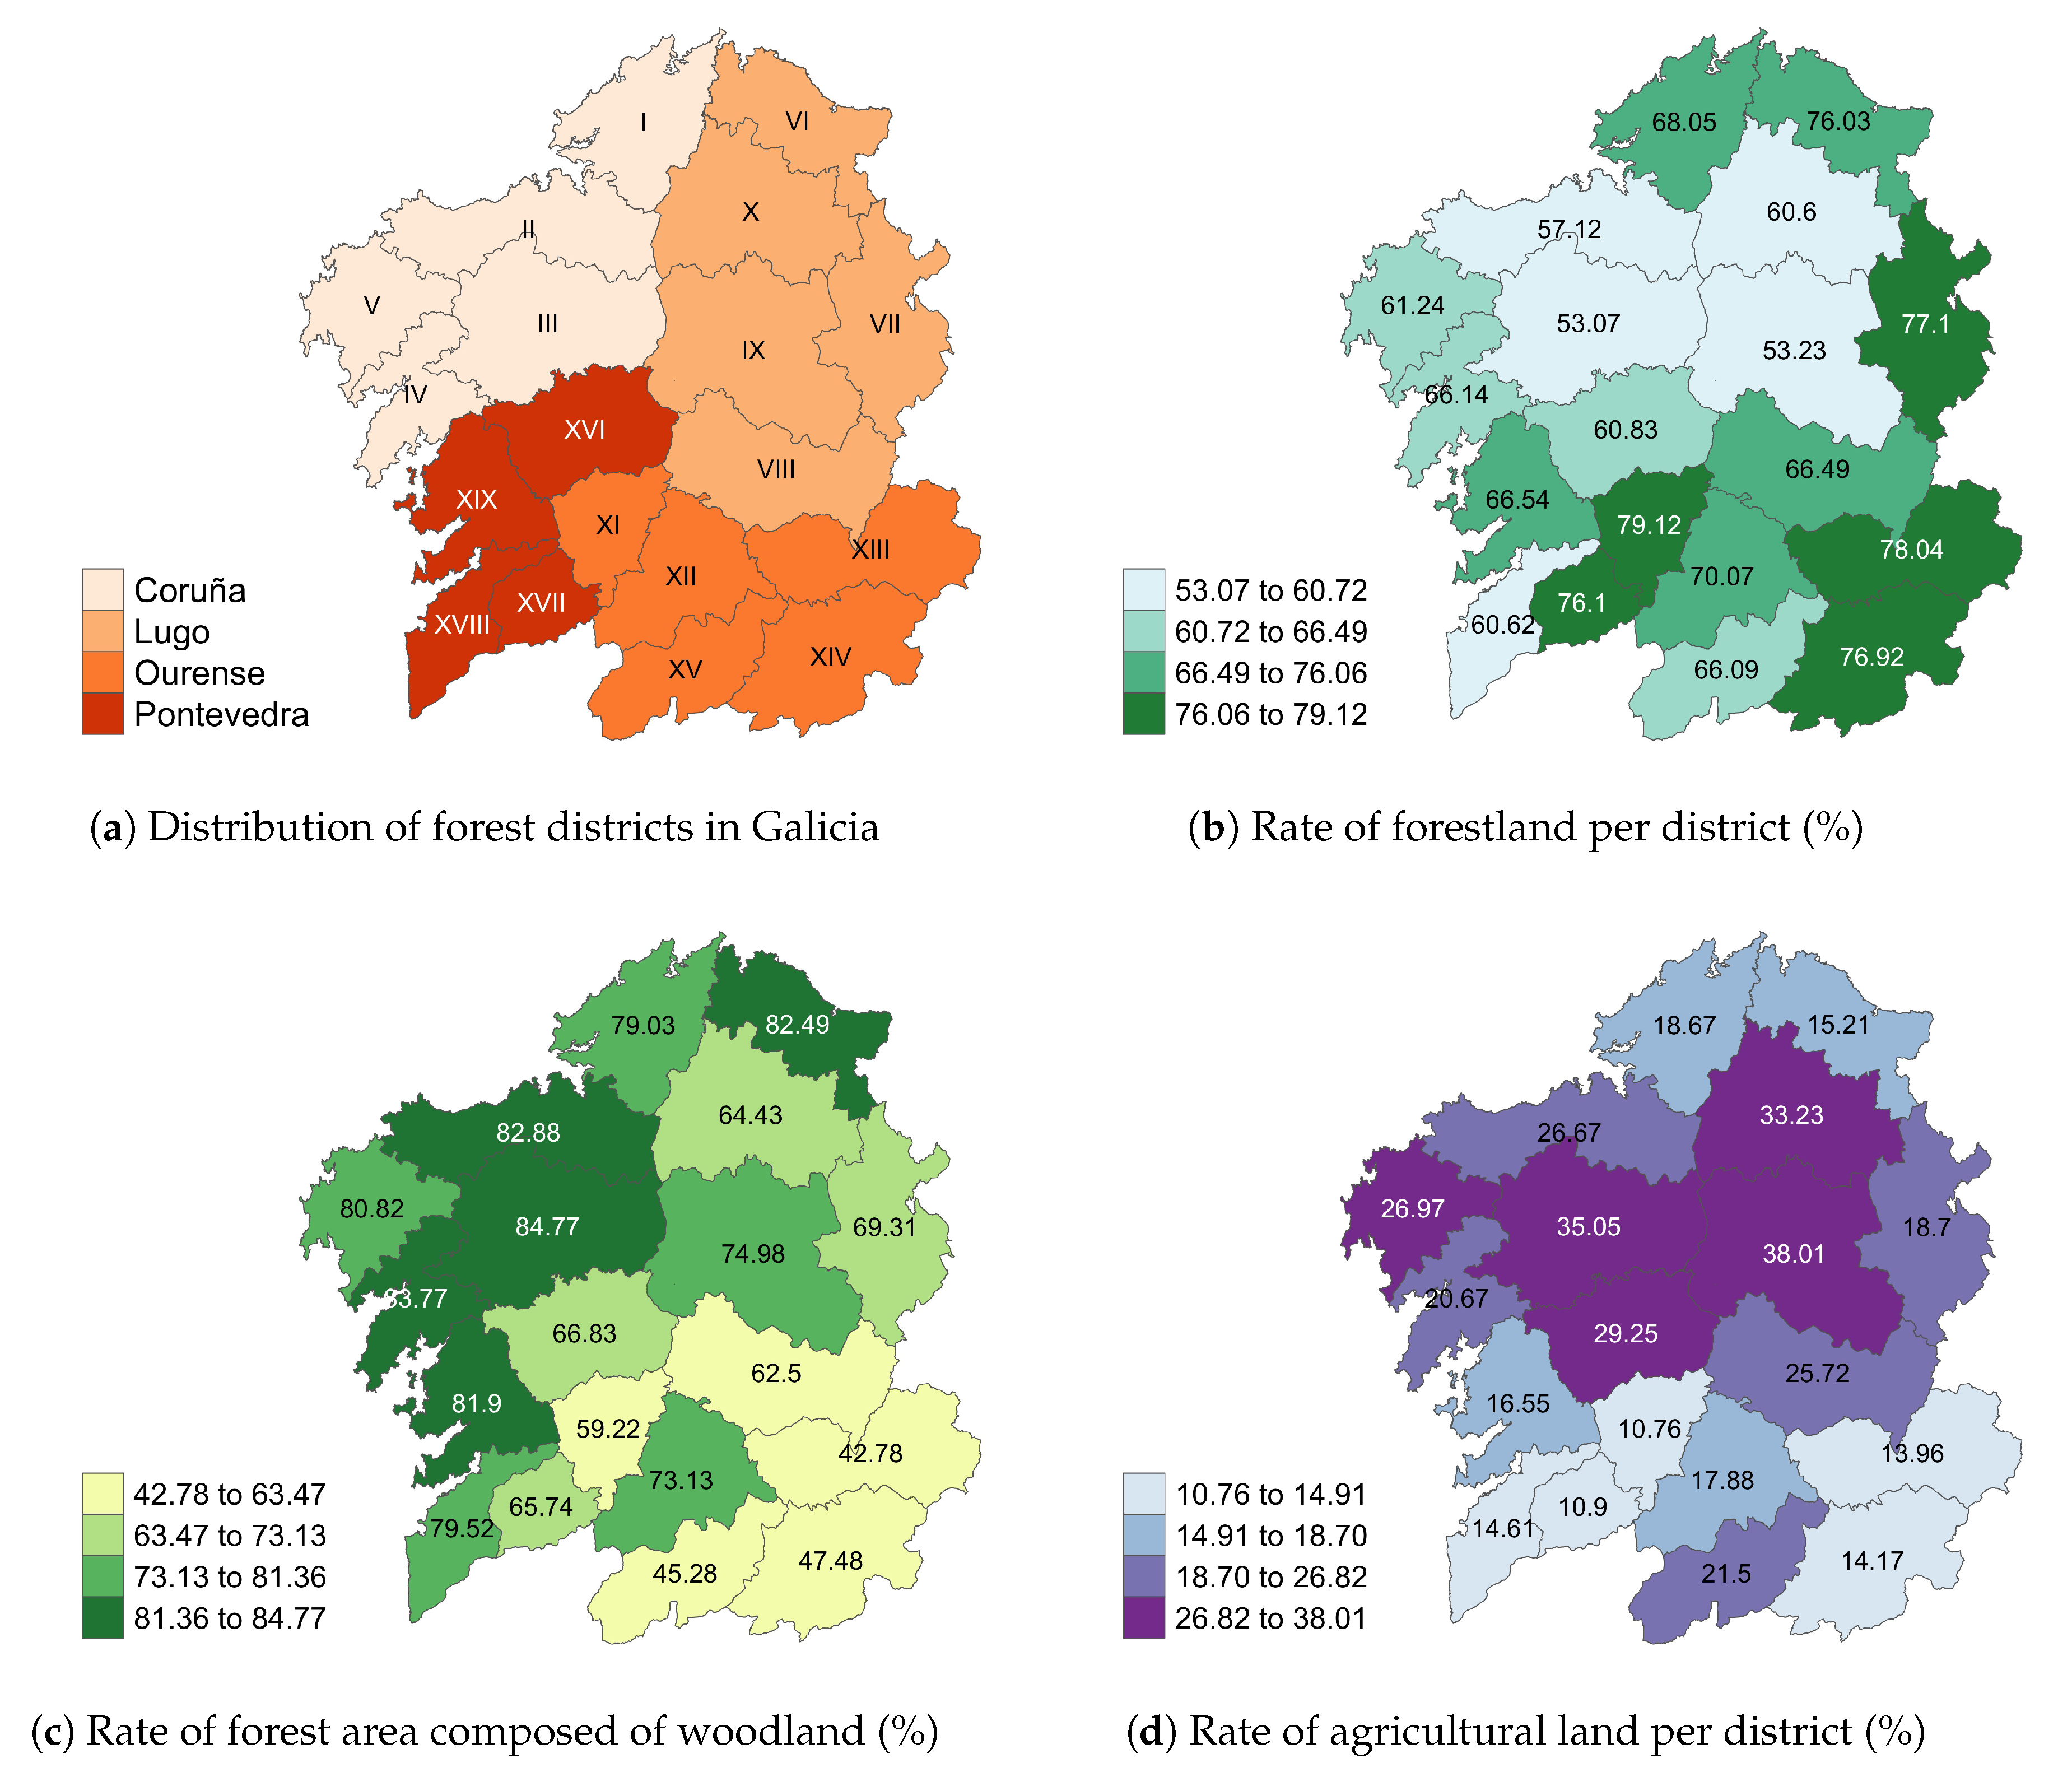
Figure 2a shows the distribution of forest districts among the provinces of Galicia. The remaining plots of
Figure 2 show some essential indicators about the land cover in these districts.
Figure 2b shows the percentage of each district’s area classified as forestland. This is highest in the east and southeast districts, and slightly lower in the northern interior districts. Forestland as such can be tree-covered woodland or shrubland.
Figure 2c therefore shows the percentage of the forestland area in each district composed of woodland. This percentage is higher in the coastal areas and decreases towards the interior. Finally, because of the importance of agriculture in Galicia’s economy,
Figure 2d shows the percentage of each district’s area composed by agricultural land.
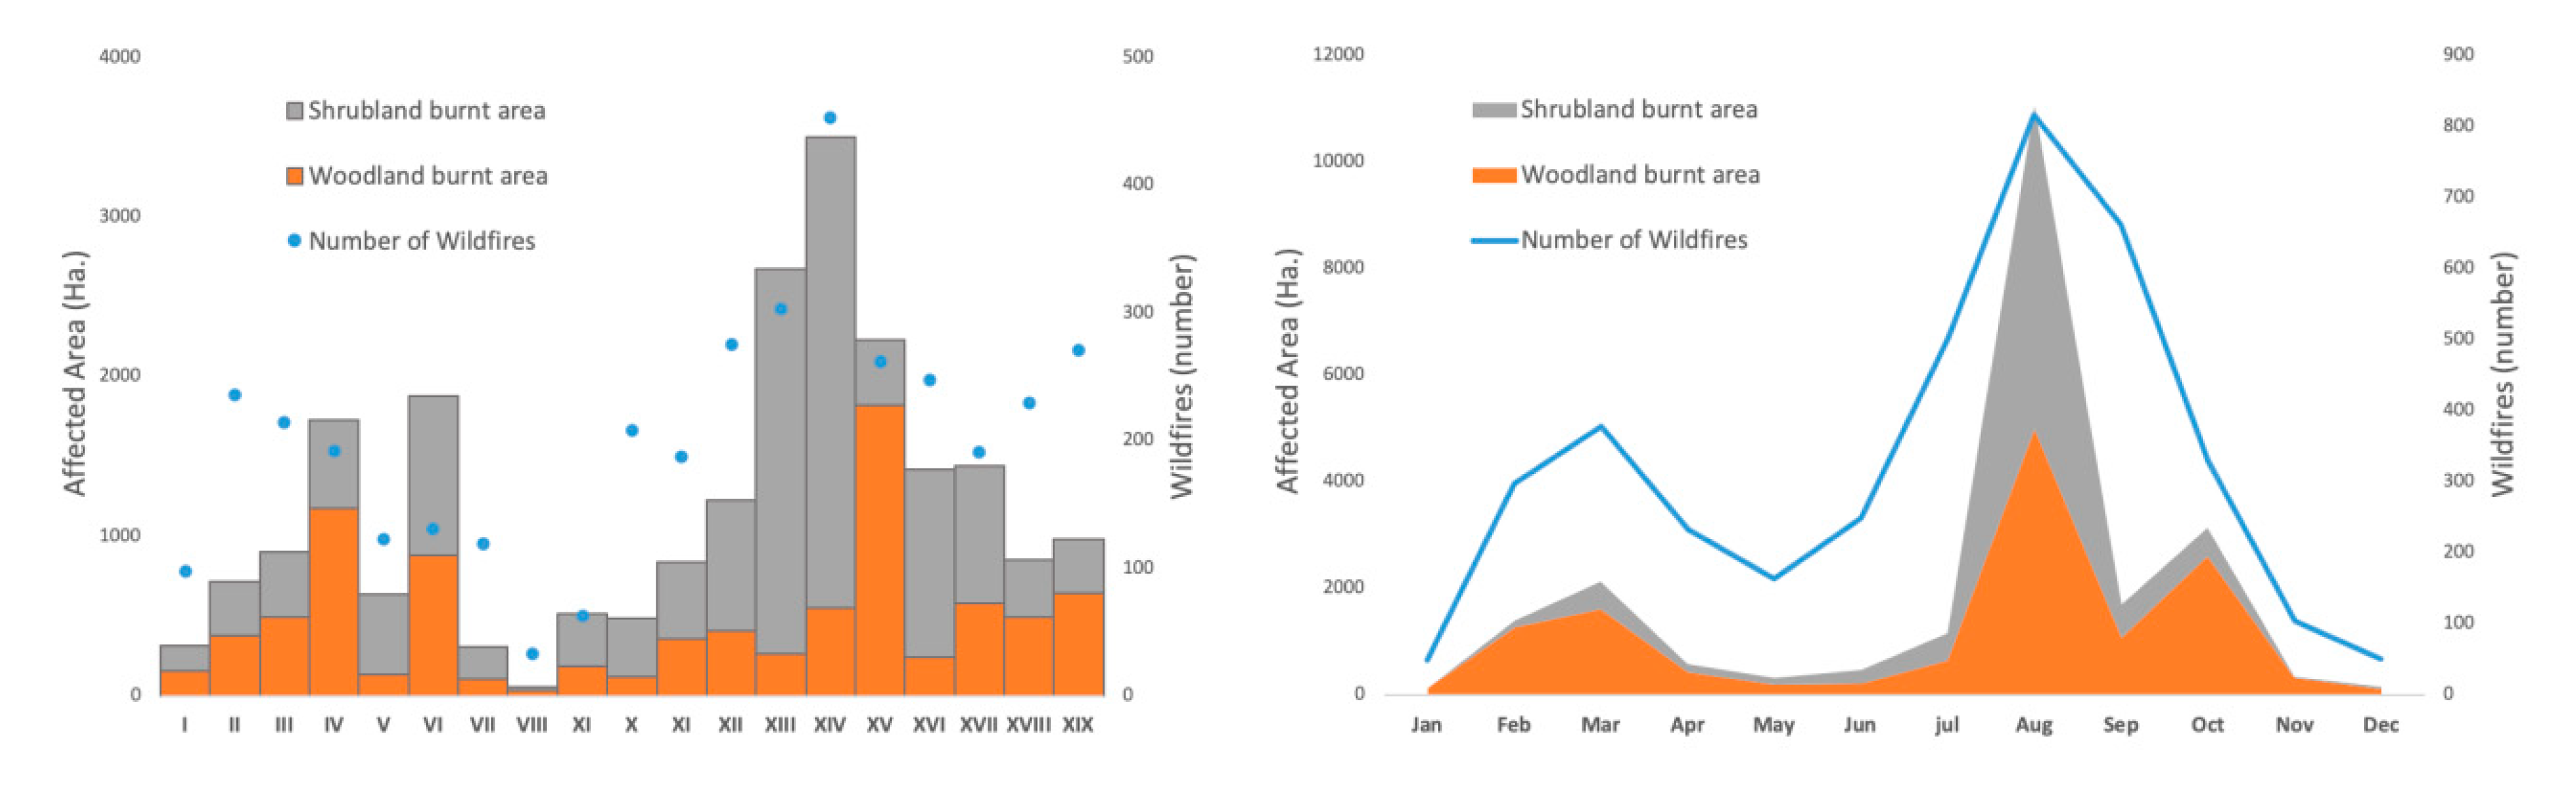
Within Galicia, wildfires also show both spatial and temporal heterogeneity.
Figure 3 describes the behavior of fires from 2006 to 2015 and it can be seen that this is strongly inhomogeneous, both spatially among the different forest districts as well as temporally throughout the months of the year. The behavior is consistent both for the number of fires as well as for the area affected.
These strong inhomogeneities in the concentration of wildfires in Galicia, apart from their intrinsic interest, should also be studied in detail in order to adapt forest policies and forest fire management. This is indeed the main point we wish to emphasize in this research: forest policy planning in Galicia (and, by extension, in all regions of risk) should be guided by a detailed study of the temporal and spatial inhomogeneity patterns recorded by the fires. The reason is that these inequalities present both challenges and opportunities, both from the point of view of fire prevention and firefighting itself, as from a socio-economic point of view.
This work therefore focuses on a quantitative method for identifying inhomogeneities in the temporal and spatial distribution of fires. Our intention is that these will ultimately help design more effective preventive forest policies. The temporal and spatial concentrations of wildfires, in absolute numbers, have been studied before, for Galicia [
25,
26,
27,
28,
29] as well as for other Spanish regions [
30,
31,
32,
33] or at the international level [
34,
35,
36,
37,
38]. However, an analysis of forest policy based on inequalities or inhomogeneities in these concentrations is innovative and provides a complementary point of view to the absolute numbers in themselves. Concentration or inequality models have been used in many other fields of study as a support tool for public policies. The literature on inequalities makes use of Gini, Atkinson or Theil indices, amongst others [
39,
40,
41]. The best known among these is the Gini index, which is widely used as a tool to measure inequalities in the fields of economy, and in particular, of wealth distribution [
42,
43]. It includes the option to decompose the analysis by different types of factors, for instance temporal or spatial [
44,
45,
46]. In the field of environmental studies, the Gini-index has been used, for example, to measure inequality of pollution levels between different countries or states [
47,
48] or to analyze land use or water management [
49,
50,
51]. However, there are few research works that use this index in forest science. A few exceptions that deserve to be highlighted are [
52], which uses the Gini index to compare the concentration of fires between different geographical regions of Catalonia; [
53], which uses it to evaluate the effectiveness of fire policies in different regions of the Mediterranean basin; or [
54,
55], which use it to measure the inequality between family units in relation to forest-related income. However, to the best of our knowledge, no research work has used this tool to analyze the spatio-temporal elasticity of wildfires, which is an indicator of how much the inhomogeneities in each region or month contribute to the overall figure, nor intended it as a tool to support the development of public policy planning in the area of forest policy.
To illustrate the importance of the inhomogeneities within the distribution of wildfires, let us first look at the temporal inhomogeneities. Two extreme positions in terms of temporal policies are the following. First, one can have a homogeneous policy throughout the whole year, without differentiating for the period. However, as we will study in detail, the wildfires themselves are not homogeneously distributed throughout the year. To reduce ecological impact, such a time-homogeneous policy would then have to be dimensioned (for example, in terms of available full-time firefighting personnel) at or close to the year-round maximum of wildfire incidents. However, this would be highly wasteful in economic terms, since during the wildfire low-season many firefighters would be idle most of the time. The other extreme is to eliminate all permanent firefighting staff and work only with voluntary and military emergency units. Again, it is clear that this would be desastrous, since during the wildfire high season the firefighting means would barely be sufficient for basic damage control. The economic impact of the wildfires themselves would therefore largely outweigh any benefit from saving on personnel. The optimum should therefore lie somewhere in the middle: the temporal peaks condition the number of required firefighters and the preventive wildfire programs. The fire department should most likely consist of a well-trained, year-round permanent staff, which can be dedicated partially to prevention and other activities during the lowest fire-occurrence season; increased with mobile volunteer and military emergency units during high season [
56]. Apart from a balance between the efficiency of the fire prevention and fighting on the one hand and its economic cost and impact on the other hand, there is also a social component that should be taken into account. Seasonal contracts tend to lead to dissatisfaction and psychological stress among the workforce, unhappiness about their labor conditions, and possibly even to firefighting personnel themselves deliberately starting fires to justify their employment. In any case, it should be clear that, in order to determine the optimum balance, a detailed knowledge of the temporal inhomogeneity patterns is essential.
A similar argument can be made for the spatial inhomogeneity patterns. It is clear that a firefighting corps homogeneously distributed across Galicia would make little sense. The spatial fire pattern should be studied closely, and the distribution of firefighting personnel should consist of, first, a bulk distribution roughly based on the existing fire pattern, in order to be closely located to the most common fire areas; and second, fast mobile intervention units that can intervene in the less frequent fire zones in a reasonable amount of time. This influences not only the personnel distribution, but obviously also the size and characteristics of the firefighting vehicles and apparatus. Note that considerations of cost-efficiency will likely have to be balanced with political issues. For example, each province, district or even locality might strive to increase its firefighting capacity even if this would lead to a globally less optimal cost-inefficiency. Again, a detailed knowledge of the spatial inhomogeneity patterns is essential to strike a correct balance.
The disposition of human and material resources has been studied from different perspectives and using different calculation techniques [
57,
58,
59,
60,
61,
62]. Most of these studies start from the concrete characteristics of the region studied, the particular circumstances of wildfires, their causes of ignition and propagation, as well as their local consequences. The methodology proposed here takes a complementary point of view. It makes an abstraction of the concrete causal factors, consequences or impact, and through a statistical coarse-graining allows to summarize the inhomogeneities into a single relevant indicator, the Gini index, which varies both in space and in time. This methodology is completely general, systematic, and easily quantifiable and transposable from one region to another. It thus allows understanding the evolution of the inhomogeneities in a specific region at a glance, through the historical evolution of this indicator, and also allows a classification and comparison of different wildfire-prone regions in the world. This would, for example, allow to extrapolate how firefighting disposition and resource allocation methods applied successfully in certain regions can or cannot be usefully transplanted to other regions based on their similarity in the Gini index pattern, regardless of whether they are of the same size, morphology, and vegetation type. In the current manuscript, we will focus on Galicia, and we will also show that, while the Gini index makes abstractions of many details of the wildfire trends, it also adds new layers of detail that could be of interest to wildfire policy, both preventive and reactive. We will illustrate this with some tentative recommendations with respect to the periodic allocation of firefighting resources in Galicia, building further on the considerations of the previous paragraphs.
The remainder of this work is structured as follows. In
Section 2, a detailed description of the statistical model is given, and the dataset is described to which this will be applied.
Section 3 describes the main results that were obtained for Galicia in the period 2006–2015. These results are discussed in detail in
Section 4, where some issues related to forest policy are also highlighted, before concluding in
Section 5.
2. Materials and Methods
A Gini index was used, first of all, to measure the contribution of each month to the overall yearly figures (number of fires and area affected, see
Table 1 and accompanying description below) in each of the 19 Forest Districts of Galicia. A second Gini index decomposition will be used to analyze the temporal concentration of fires throughout the 12 months for each of the geographical districts. The model used is based on the one developed in [
63], which is an expansion of the proposals [
64,
65]. This model considers a Gobal Gini index (G), which is broken down into three factors
as represented by Equation (
1). The subscript
i represents each month or each district depending on the optics of the study adopted. Thus, if the temporal concentration in each district is being studied then
covers the 12 months; on the other hand, if the spatial concentration is being studied in each month, then
runs over the different districts.
The Global Gini index is obtained by multiplying the three factors:
, the contribution of wildfires in (month or district) i with respect to the total registered;
, the inhomogeneity or inequality for each value of i;
, the correlation between a given i with respect to the overall (temporal or spatial) distribution of the factor,
and summing over all possible values of the index
i, to obtain:
A value of
would indicate a perfectly homogeneous distribution of wildfires, with growing inhomogeneity as G increases up to a maximum possible value of
. A similar interpretation is valid for the individual
factors. These are calculated according to the standard Gini index definition, see Equation (
2), namely half the relative mean absolute difference.
More concretely, the calculation of involves the average of the absolute difference between each pair of values of the variable for a given month or region i, divided (for normalization) by the global average for that particular month or district i. Thus, means that the fires are distributed homogeneouly in i. Intermediate values represent a growing degree of inequality in the distribution of fires, up to , which would correspond to all fires in district i occurring in the same month, or all fires in month i occurring in the same district.
, the contribution of month/district
i to the total amount is defined in Equation (
3).
The factor thus takes values between zero and one, with a value close to zero indicating a low contribution to the total (number of fires or affected area), which grows ever larger as increases, and would correspond to all fires coming from the single district i or taking place during the single month i.
Finally, the correlations
with the overall distribution range from
to 1. Zero represents total absence of correlation with respect to the cumulative distribution of the total factor, and one perfect correlation. To be precise, these correlations
are calculated using Equation (
4), i.e., as a normalization of the corresponding covariances.
where
and
are the cumulative distribution functions of the total value of the variable and of the value of the variable in month/district
i, respectively.
Apart from the Gini coefficients themselves, the elasticities are also important indicators. These elasticities depend on the marginal effects, and will allow to calculate how the global concentration varies as a function of changes in
i, while all other factors are kept constant [
66]. These elasticities are thus calculated according to Equation (
5), which is the partial derivative of Equation (
1) (i.e., of the global spatial or temporal Gini index) with respect to a small change
e in the variable (number of fires or affected area) in the concrete district or month
i, ceteris paribus.
The result can be interpreted as the effect on the global concentration produced by a 1% change in the variable of study in district/month
i, all other values held constant. It might be worth insisting on this interpretation. A positive (respectively, negative) elasticity for a given district/month
i means that an additional 1% of wildfires in district/month
i (distributed according to the existing pattern in that district/month) would increase (respectively, decrease) the global temporal/spatial Gini index, i.e., would increase (respectively, decrease) the overall temporal/spatial inhomogeneity of wildfires in Galicia. However, for the result to be adequately interpretable, the correlation needs to be sufficiently high [
45,
63]. In practice, the analysis can be taken to be valid if
. For smaller values of
, the correlation with the total of the variable must be considered too small for the analysis to be valid, or at least should be interpreted with caution.
For the methodological part of the statistical development of this study, Stata [
67] was used, while the results were graphed with RStudio [
68].
3. Results
3.1. Gini Analysis By Month
In this section, the Gini decomposition for each of the study variables based on the spatial concentration of wildfires per month will be presented.
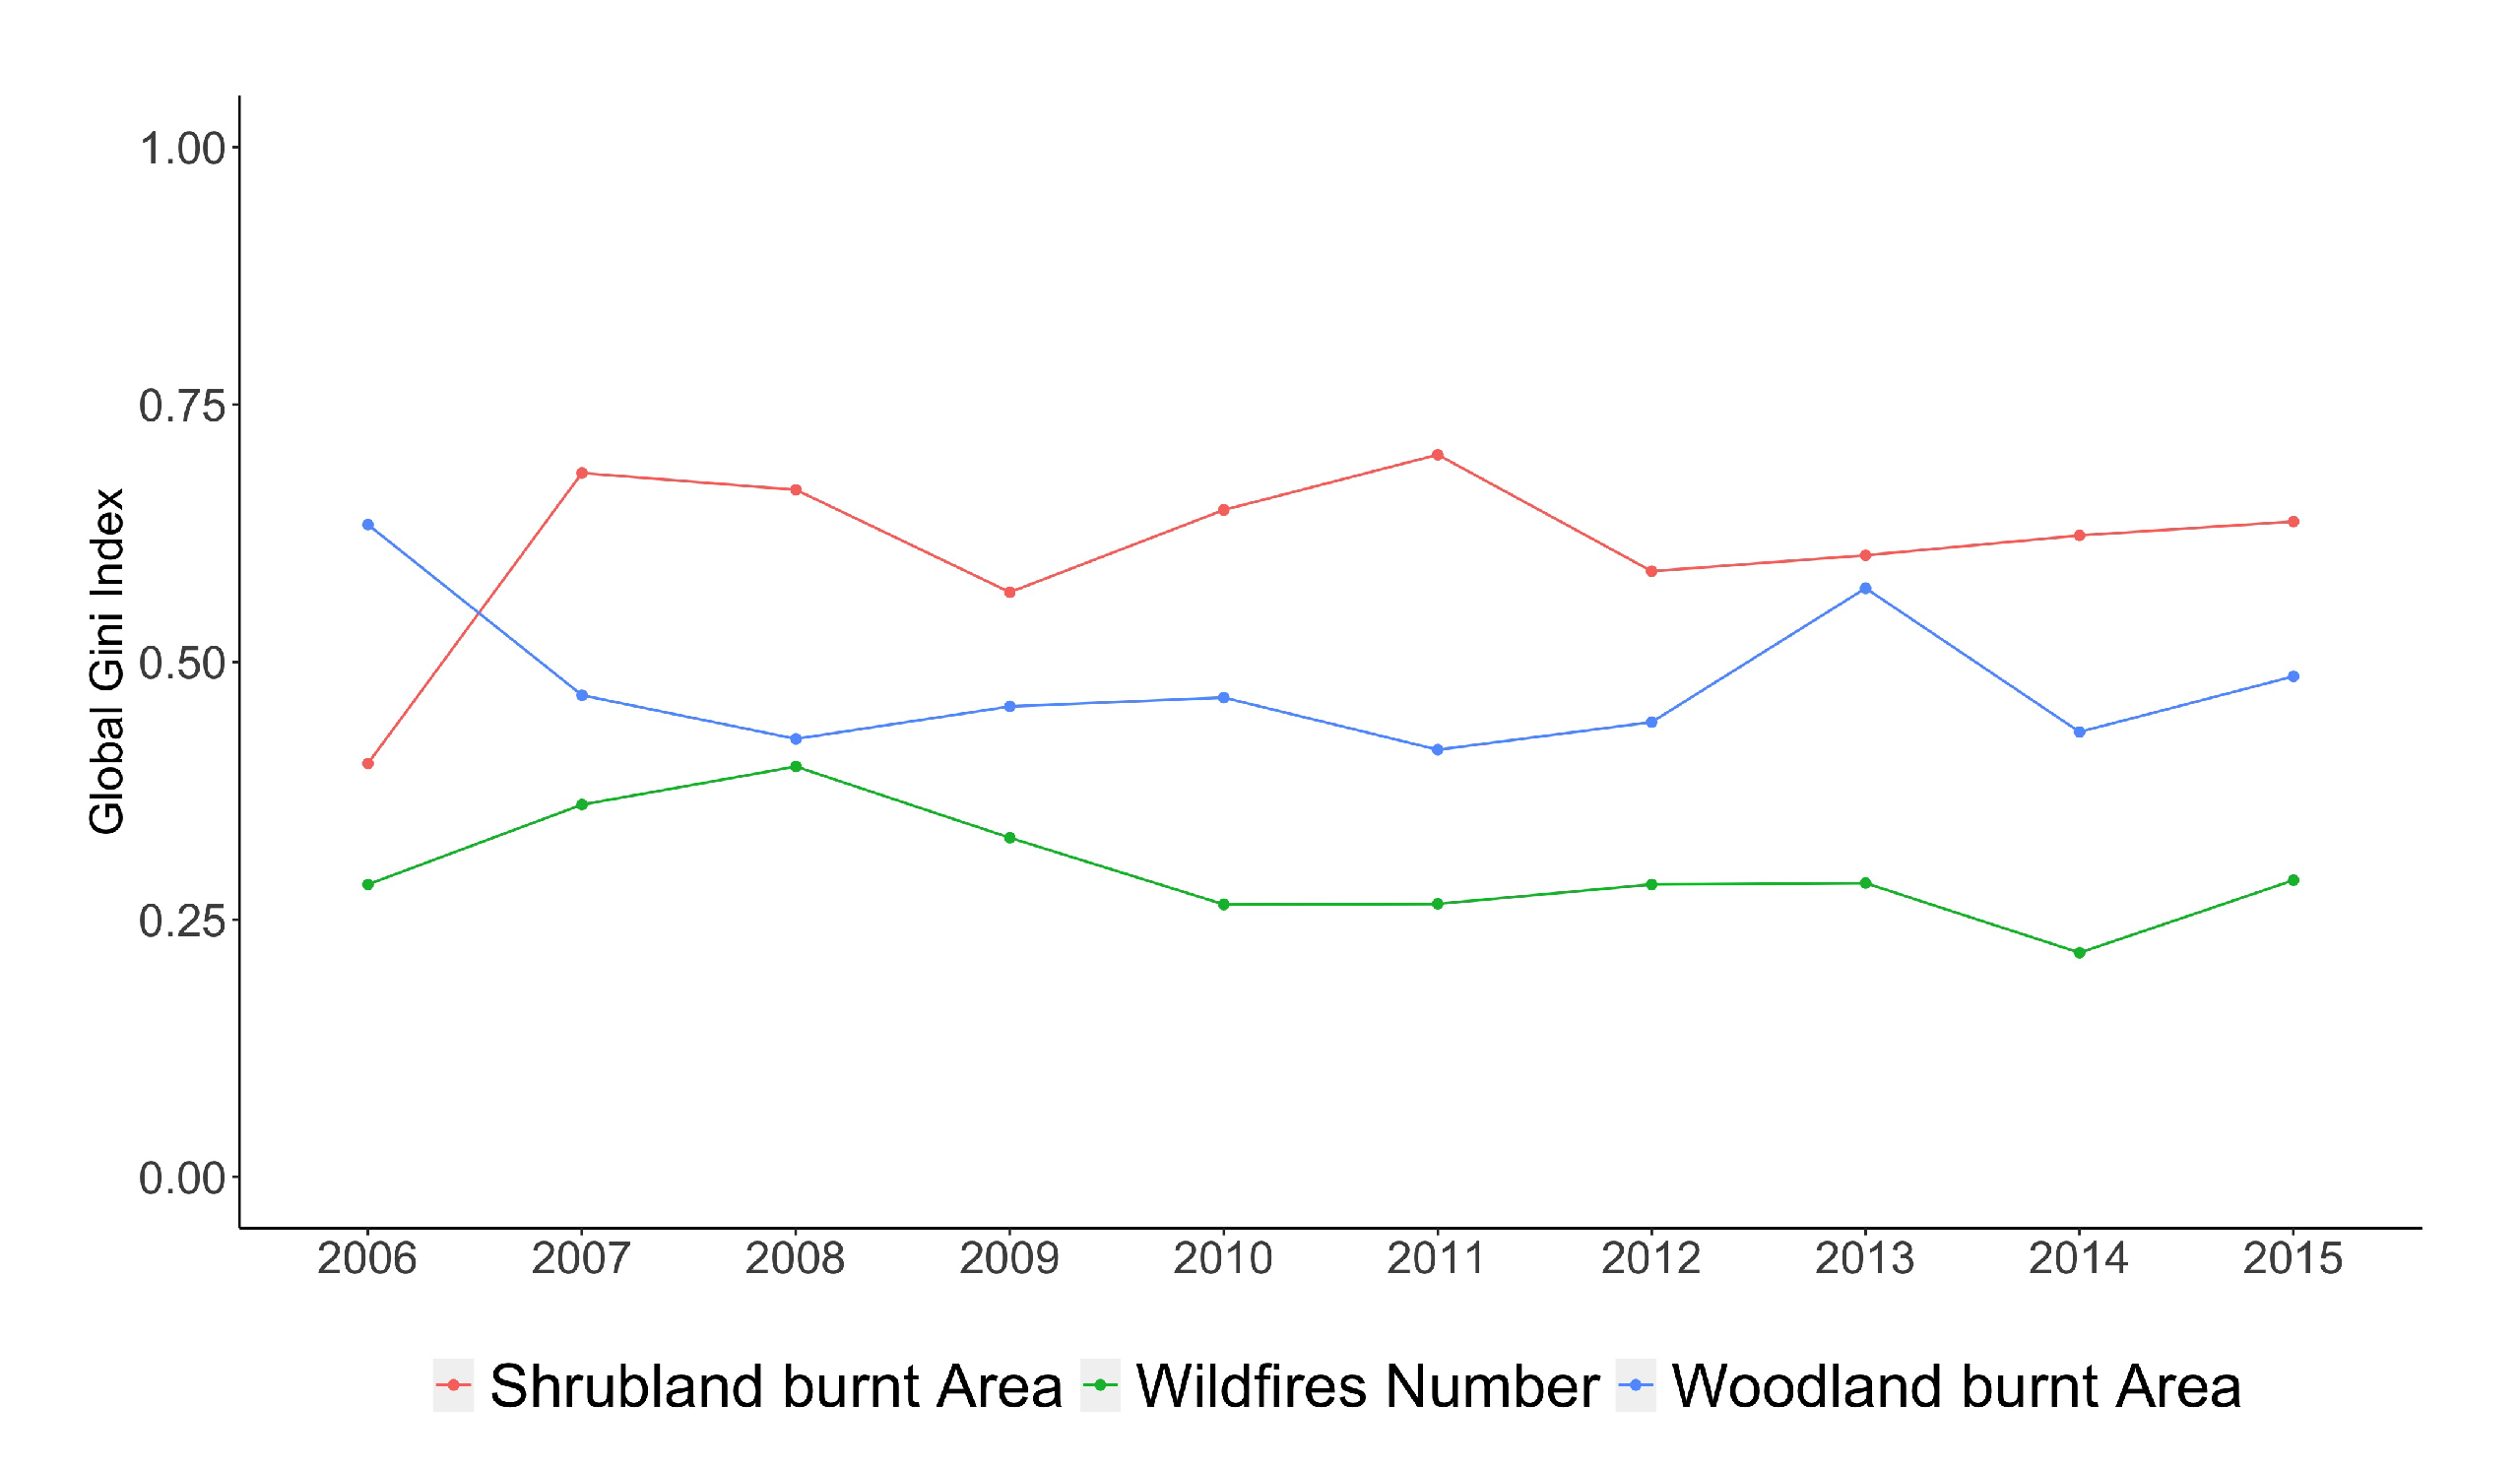
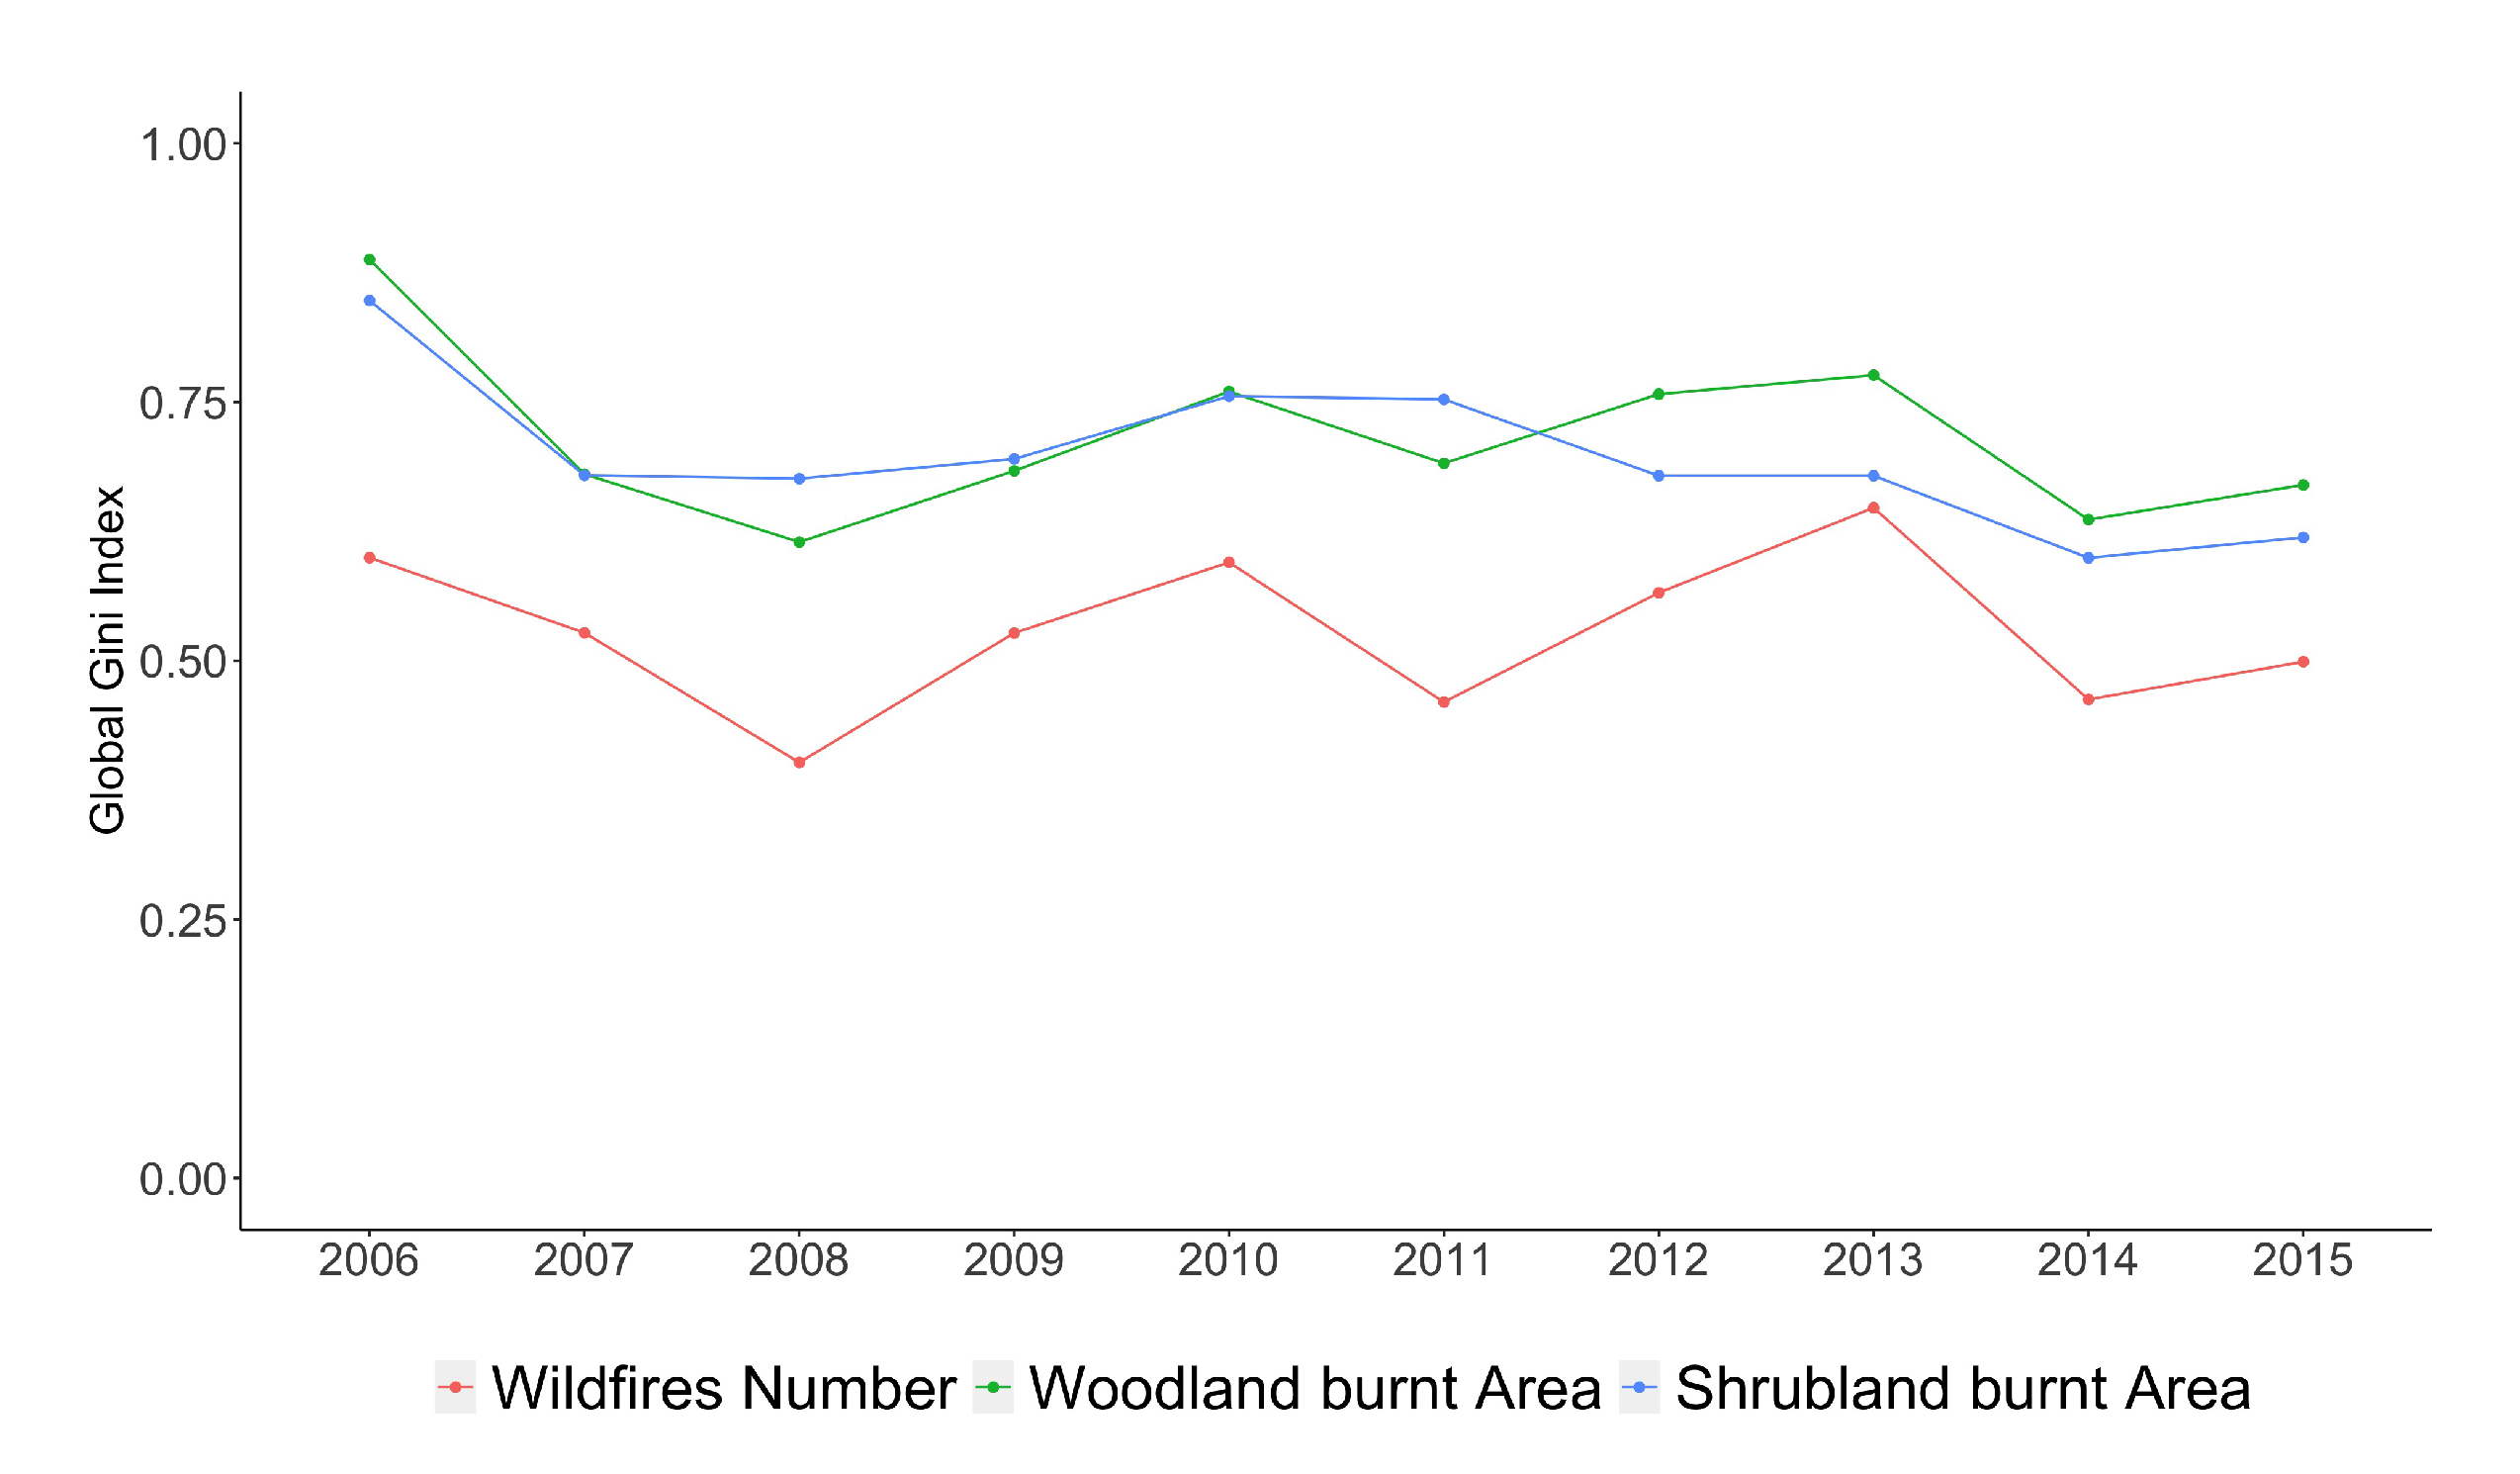
Figure 4 represents the Global spatial Gini index for the wildfires, regardless of the month in which they register. The number of fires presents lower concentration values than the rest of the variables. Within the affected forest area variables, it is observed that shrubland has a higher overall concentration than woodland. The spatial concentration of the number of fires is relatively low (
G between
and
), while the spatial concentration of the affected areas is slightly higher (
). Finally, although the concrete values oscillate from year to year, there is no clear (upward nor downward) trend over the period studied.
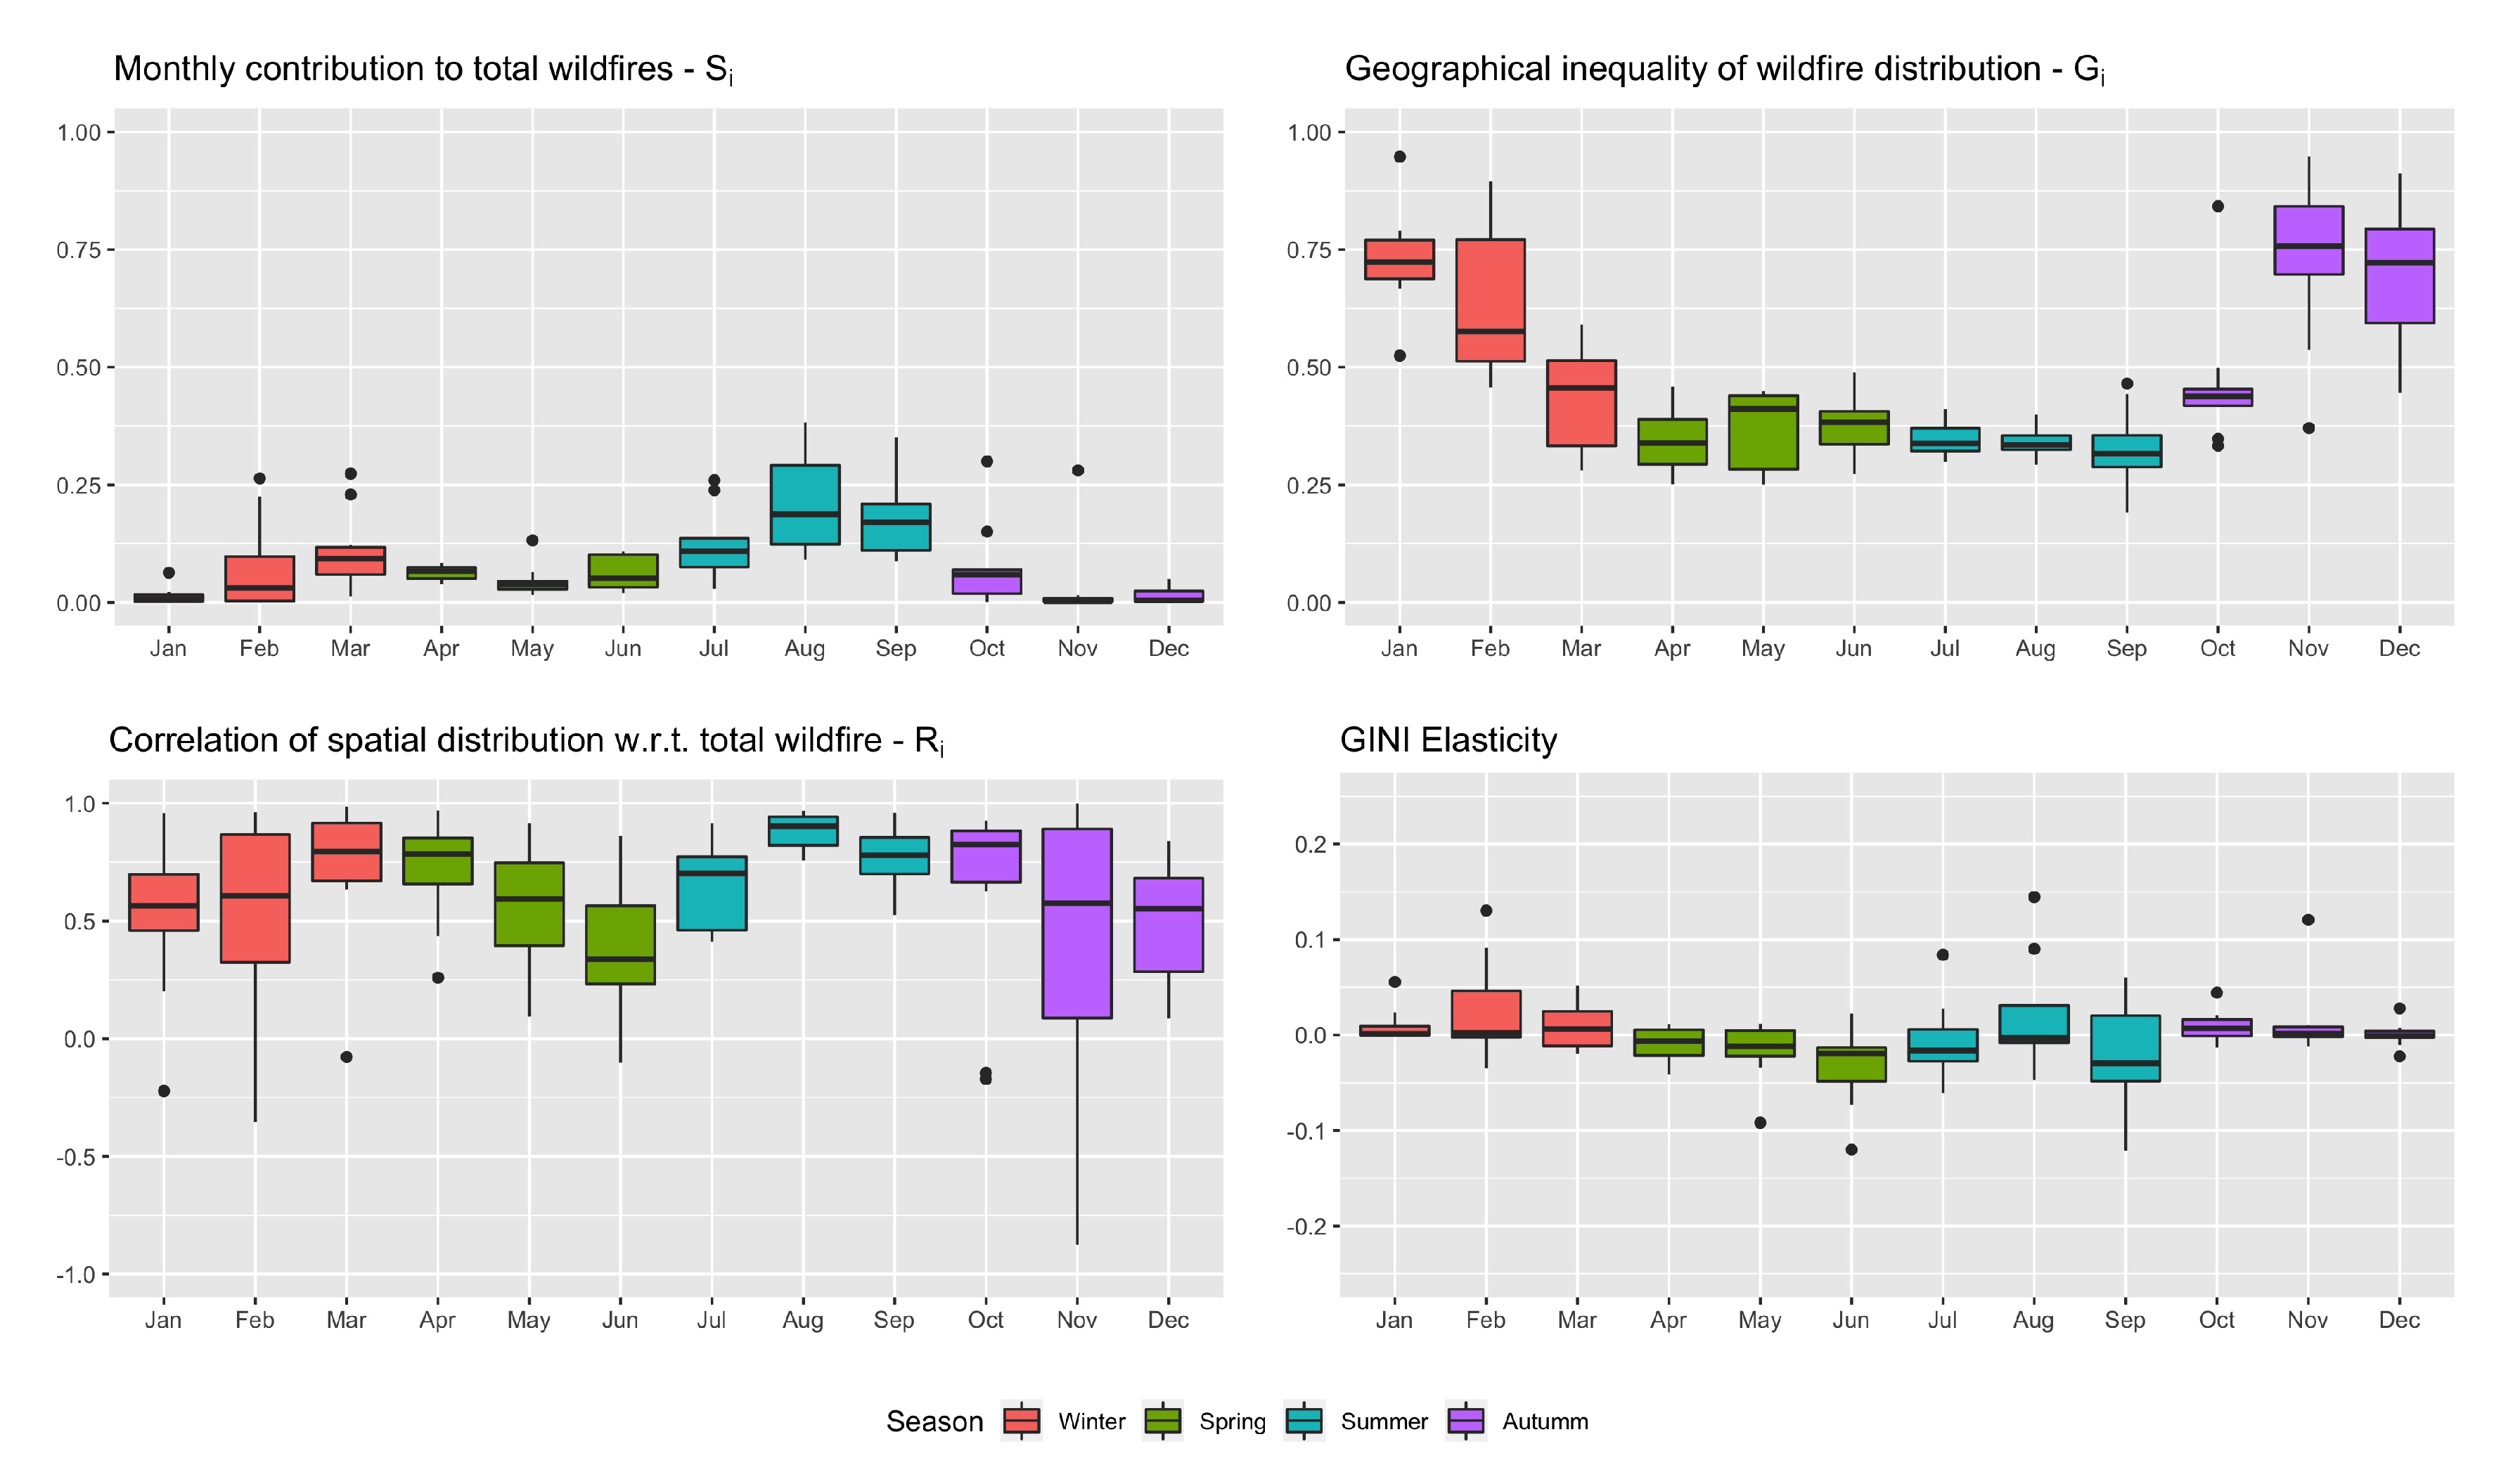
Figure 5 represents the spatial decomposition of the number of fires throughout the months of the year. The first box plot summarizes the values of
, i.e., the contribution of each month to the total number of fires throughout the year. It can be seen clearly that August and September are consistently the months with the greatest contribution to the yearly total number of wildfires. The outliers in the months of February, March, July, October and November indicate that, during certain years, these months have also had important contributions to the yearly total.
The top-right figure shows the values of , i.e., the geographical inequality per month. There is greater geographical inhomogeneity in late autumn and early winter, i.e., at the beginning and end of the year, whereas spring and summer present a much greater degree of homogeneity. Said in other words, from 2006 to 2015, the occurrence of fires presents a greater degree of spatial equidistribution among the Forest Districts of Galicia throughout the summer months, and is more concentrated geographically at the beginning and end of the year.
Considering now the correlation factors , except for a few outliers with weak negative correlation, these are always positive, indicating that the spatial distribution pattern most of the time goes in the same direction. In terms of strength, the correlation factors are very high in the months of August and September, as well as in March, April or October, although the latter show larger variability from year to year. Therefore, in these months with high correlation, the distribution of fires presents a spatial heterogeneity that strongly resembles the year-round heterogeneity pattern.
Finally, the elasticities are on average quite low for all months. However, the relatively large variability during the summer months, as well as in February and March, show that—at least during certain years—variations in the distribution of fires recorded during these months can have a relatively strong effect on the overall yearly concentration of the number of fires. The remaining months show low marginal effects, which, together with the low correlation factors described earlier, imply that they have low significance in the global analysis of the concentration of the number of fires.
Figure 6 represents the Gini decomposition for the affected woodland area in the different forest districts. For this variable, the months of March, August and September represent the periods with the greatest contribution to the total burned woodland area in Galicia. The large contribution of August and September is unsurprising, since these are also the months with the highest number of fires (see
Figure 5). The relatively high contribution of March and especially the low value for July are more surprising. It is also noteworthy that there are quite a few outliers, some of which are even higher than the August-September average values.
The inequality values per month show that there is high spatial inequality especially in November, December and January. In other words, the area affected in these three months is more inhomogeneously distributed throughout the forest districts, and slightly less so from April to September.
The correlation with respect to the global distribution is (as for the number of fires shown previously) always positive, except for a few negative outliers. It is high and stable in August, and much more variable throughout the rest of the year. So the marginal effects in August will be especially relevant. This is confirmed by the elasticity, which is high (although quite variable) and positive for the month of August. So, if the burned woodland area increases in the month of August, then the year-round inhomogeneity of the distribution of burned woodland area will also increase sharply. Although August is thus the main month to take into account, the months of March and September should also be considered. Indeed, at least in certain years, these have a combination of significant decomposition factors, leading also to significant elasticities, which is in fact negative for the month of September.
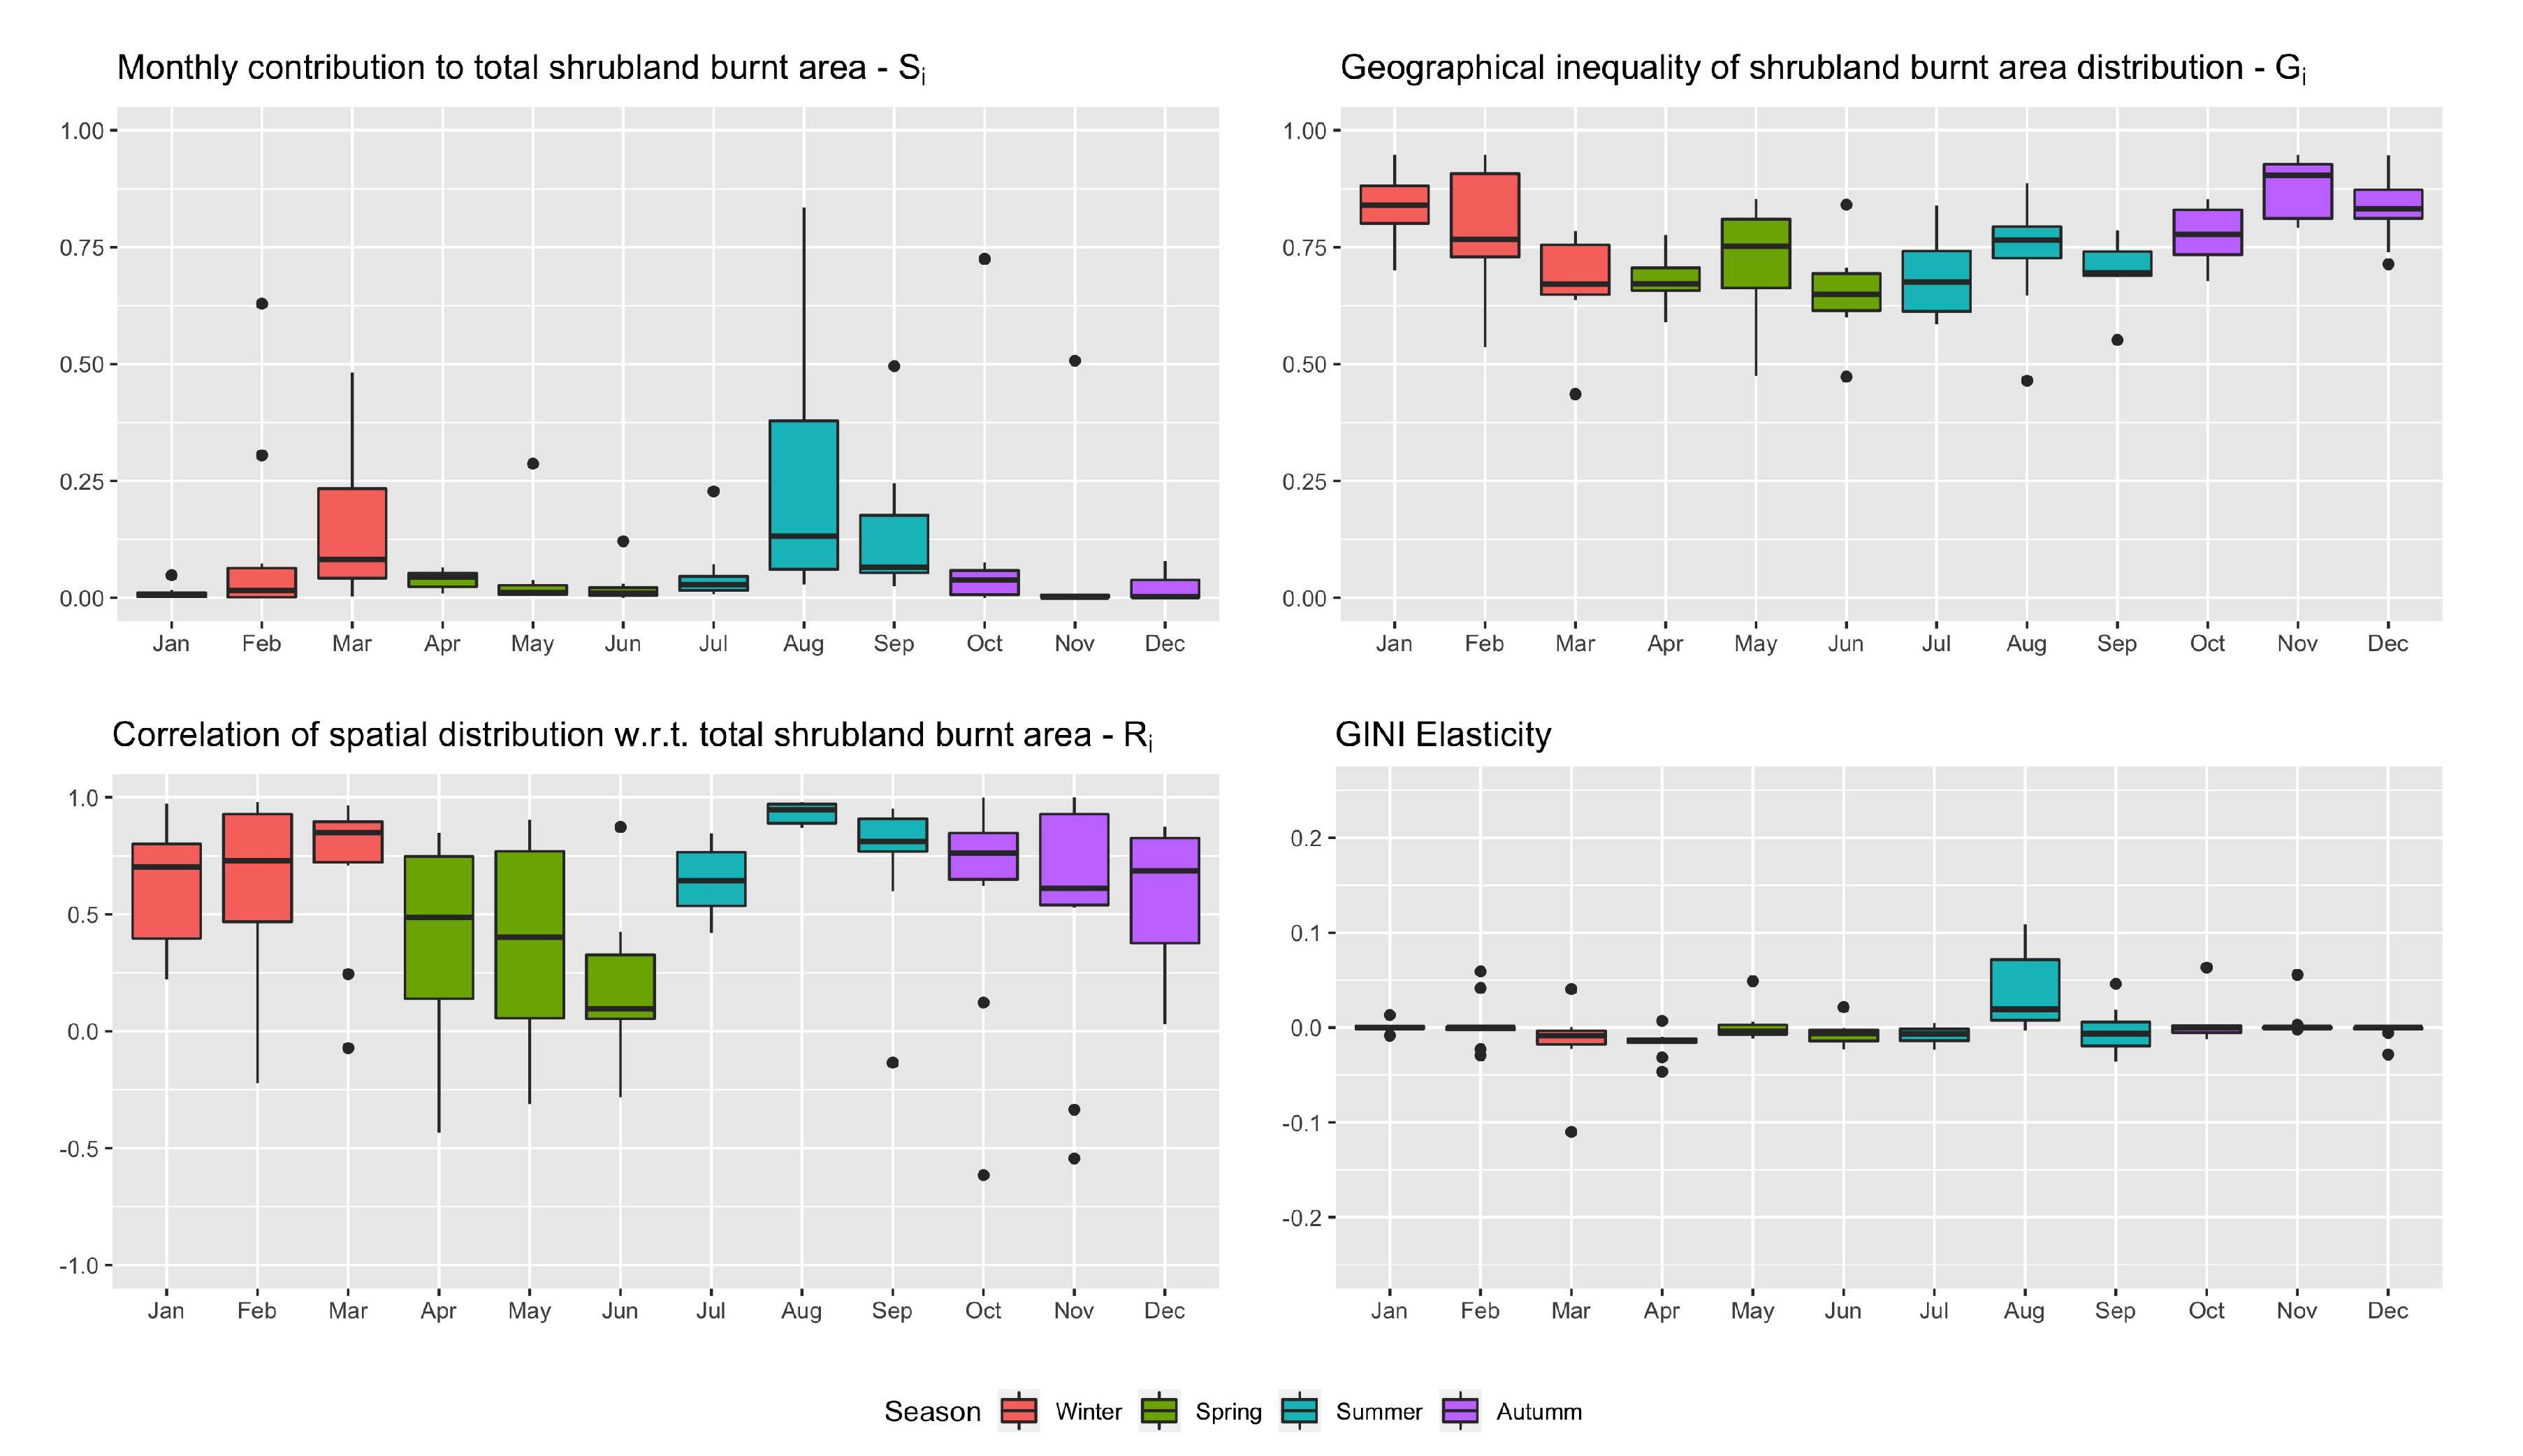
Finally, the results obtained for the burned shrubland area are found in
Figure 7. Similar results are obtained for the analysis of the woodland. March, August and September are again the dominant months in terms of contribution. Late autumn and early winter are the periods with the largest spatial inhomogeneity. Correlations are, on average, always positive, and high in August, as well as in March, September and October. The other months have lower average values, but with a relatively high variation. Finally, August is also the dominant month in terms of elasticity. The other months have low average elasticity, although with some significant outliers.
3.2. Gini Analysis by Forest District
After analyzing the spatial inequality patterns of the wildfires in Galicia, we will now study the temporal inhomogeneity throughout the months of the year. Thus,
Figure 8 represents the global temporal Gini index for the concentration of fires per month regardless of the district in which they occur. For all three variables, a higher inhomogeneity is observed than in the spatial case. In other words, wildfires in Galicia have a greater temporal than spatial concentration, both in terms of number of fires and in terms of affected area. Woodland and shrubland areas have very similar temporal inhomogeneity, although the latter have slightly decreased in recent years compared to the former. Both are higher than the inequality in the number of fires as such. Finally, the same remark as in the case of the global spatial Gini index applies, namely that there is some oscillation, but no clear (upward nor downward) trend over the period studied.
After this general analysis, the Gini decomposition for the three study variables will now be examined, see also
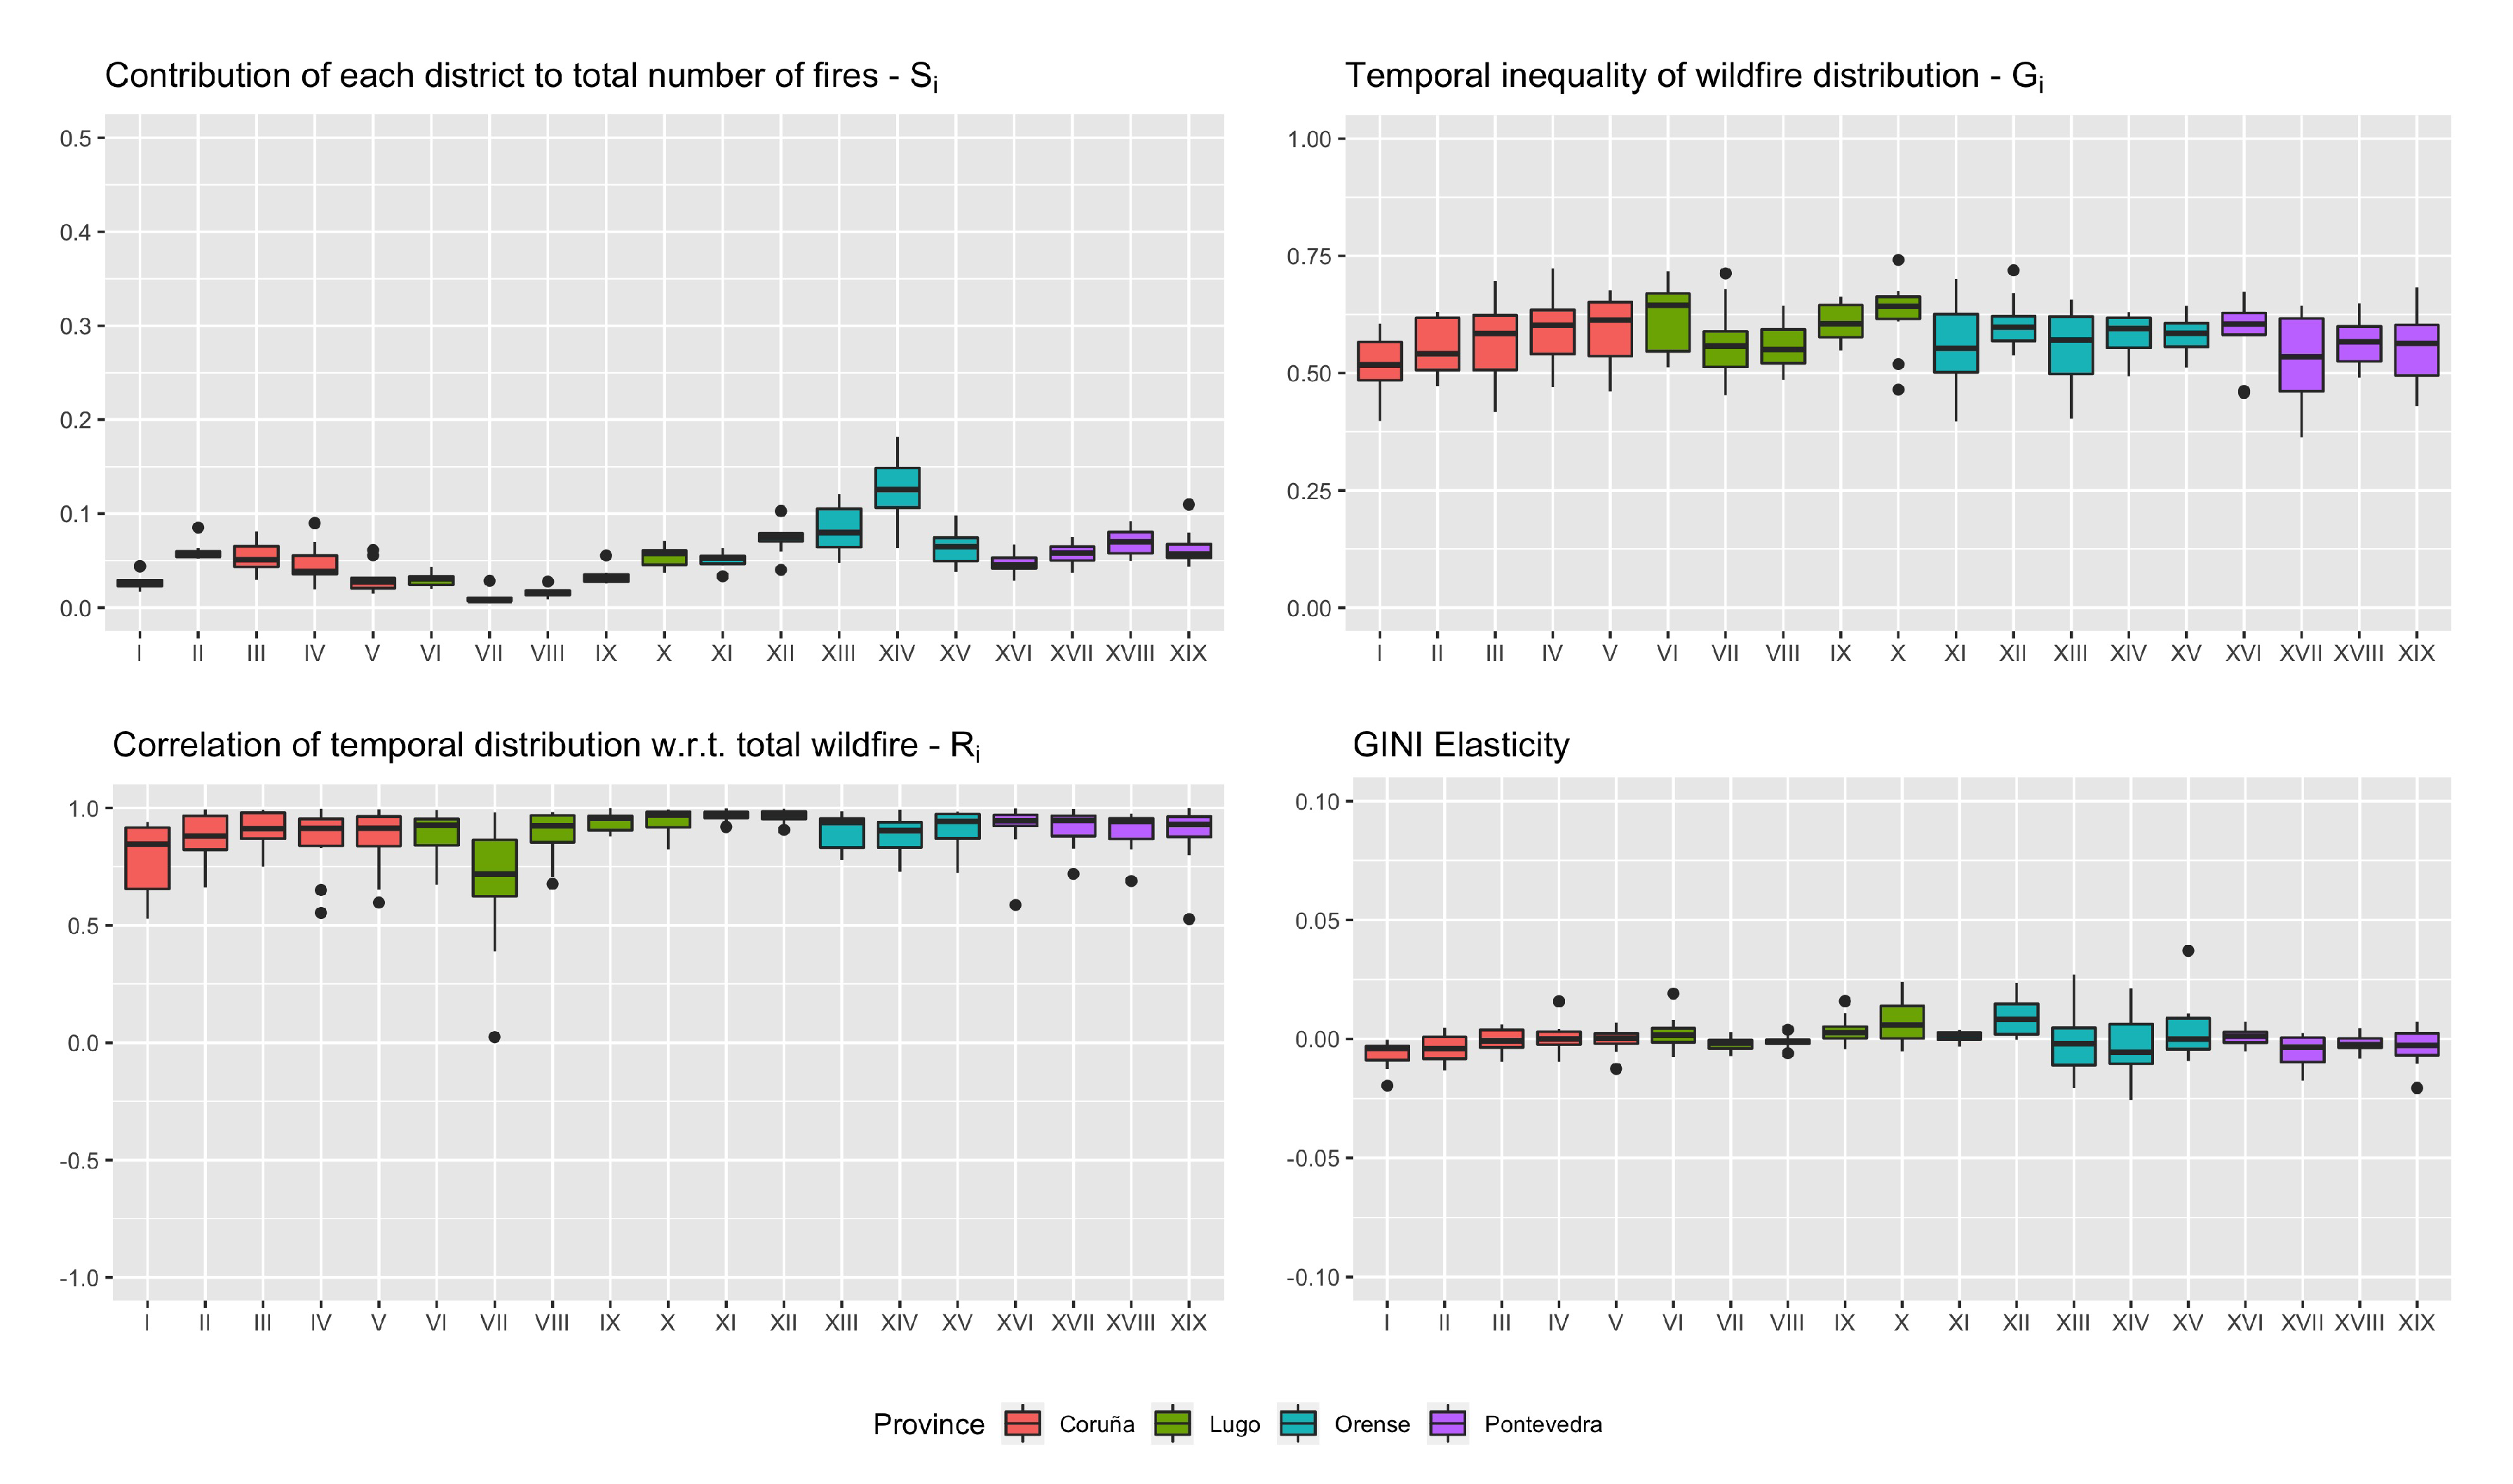
Section 4 for cartographic representations of some of the most relevant features. In
Figure 9, the temporal concentration of the number of fires is broken down according to the Galician Forest Districts. The districts are grouped by color according to the province to which they belong (Coruña, Lugo, Ourense and Pontevedra). From the first graph, it is seen that the districts of Ourense contribute slightly more to the total number of fires than the districts in other provinces. The monthly inequalities (upper right figure) are rather high for all districts (in the range 0.5–0.7, except for a few outliers). Districts X-XII-XV-XVI are the most stable (smallest variability), while the other districts have larger temporal variability. All the registered correlations are positive, and (in average terms) all of them are high. This indicates that the temporal inhomogeneity pattern is very similar to the overall pattern in the whole of Galicia, and that the study of elasticities is valid in most of these districts. This elasticity is low in absolute terms for all districts, but shows substantial variability in all Districts in Ourense (except XI), as well as in Districts X-XVII-XIX. The elasticity of these districts can take on different signs, and so they should be taken into account carefully to manage the concentration of fires.
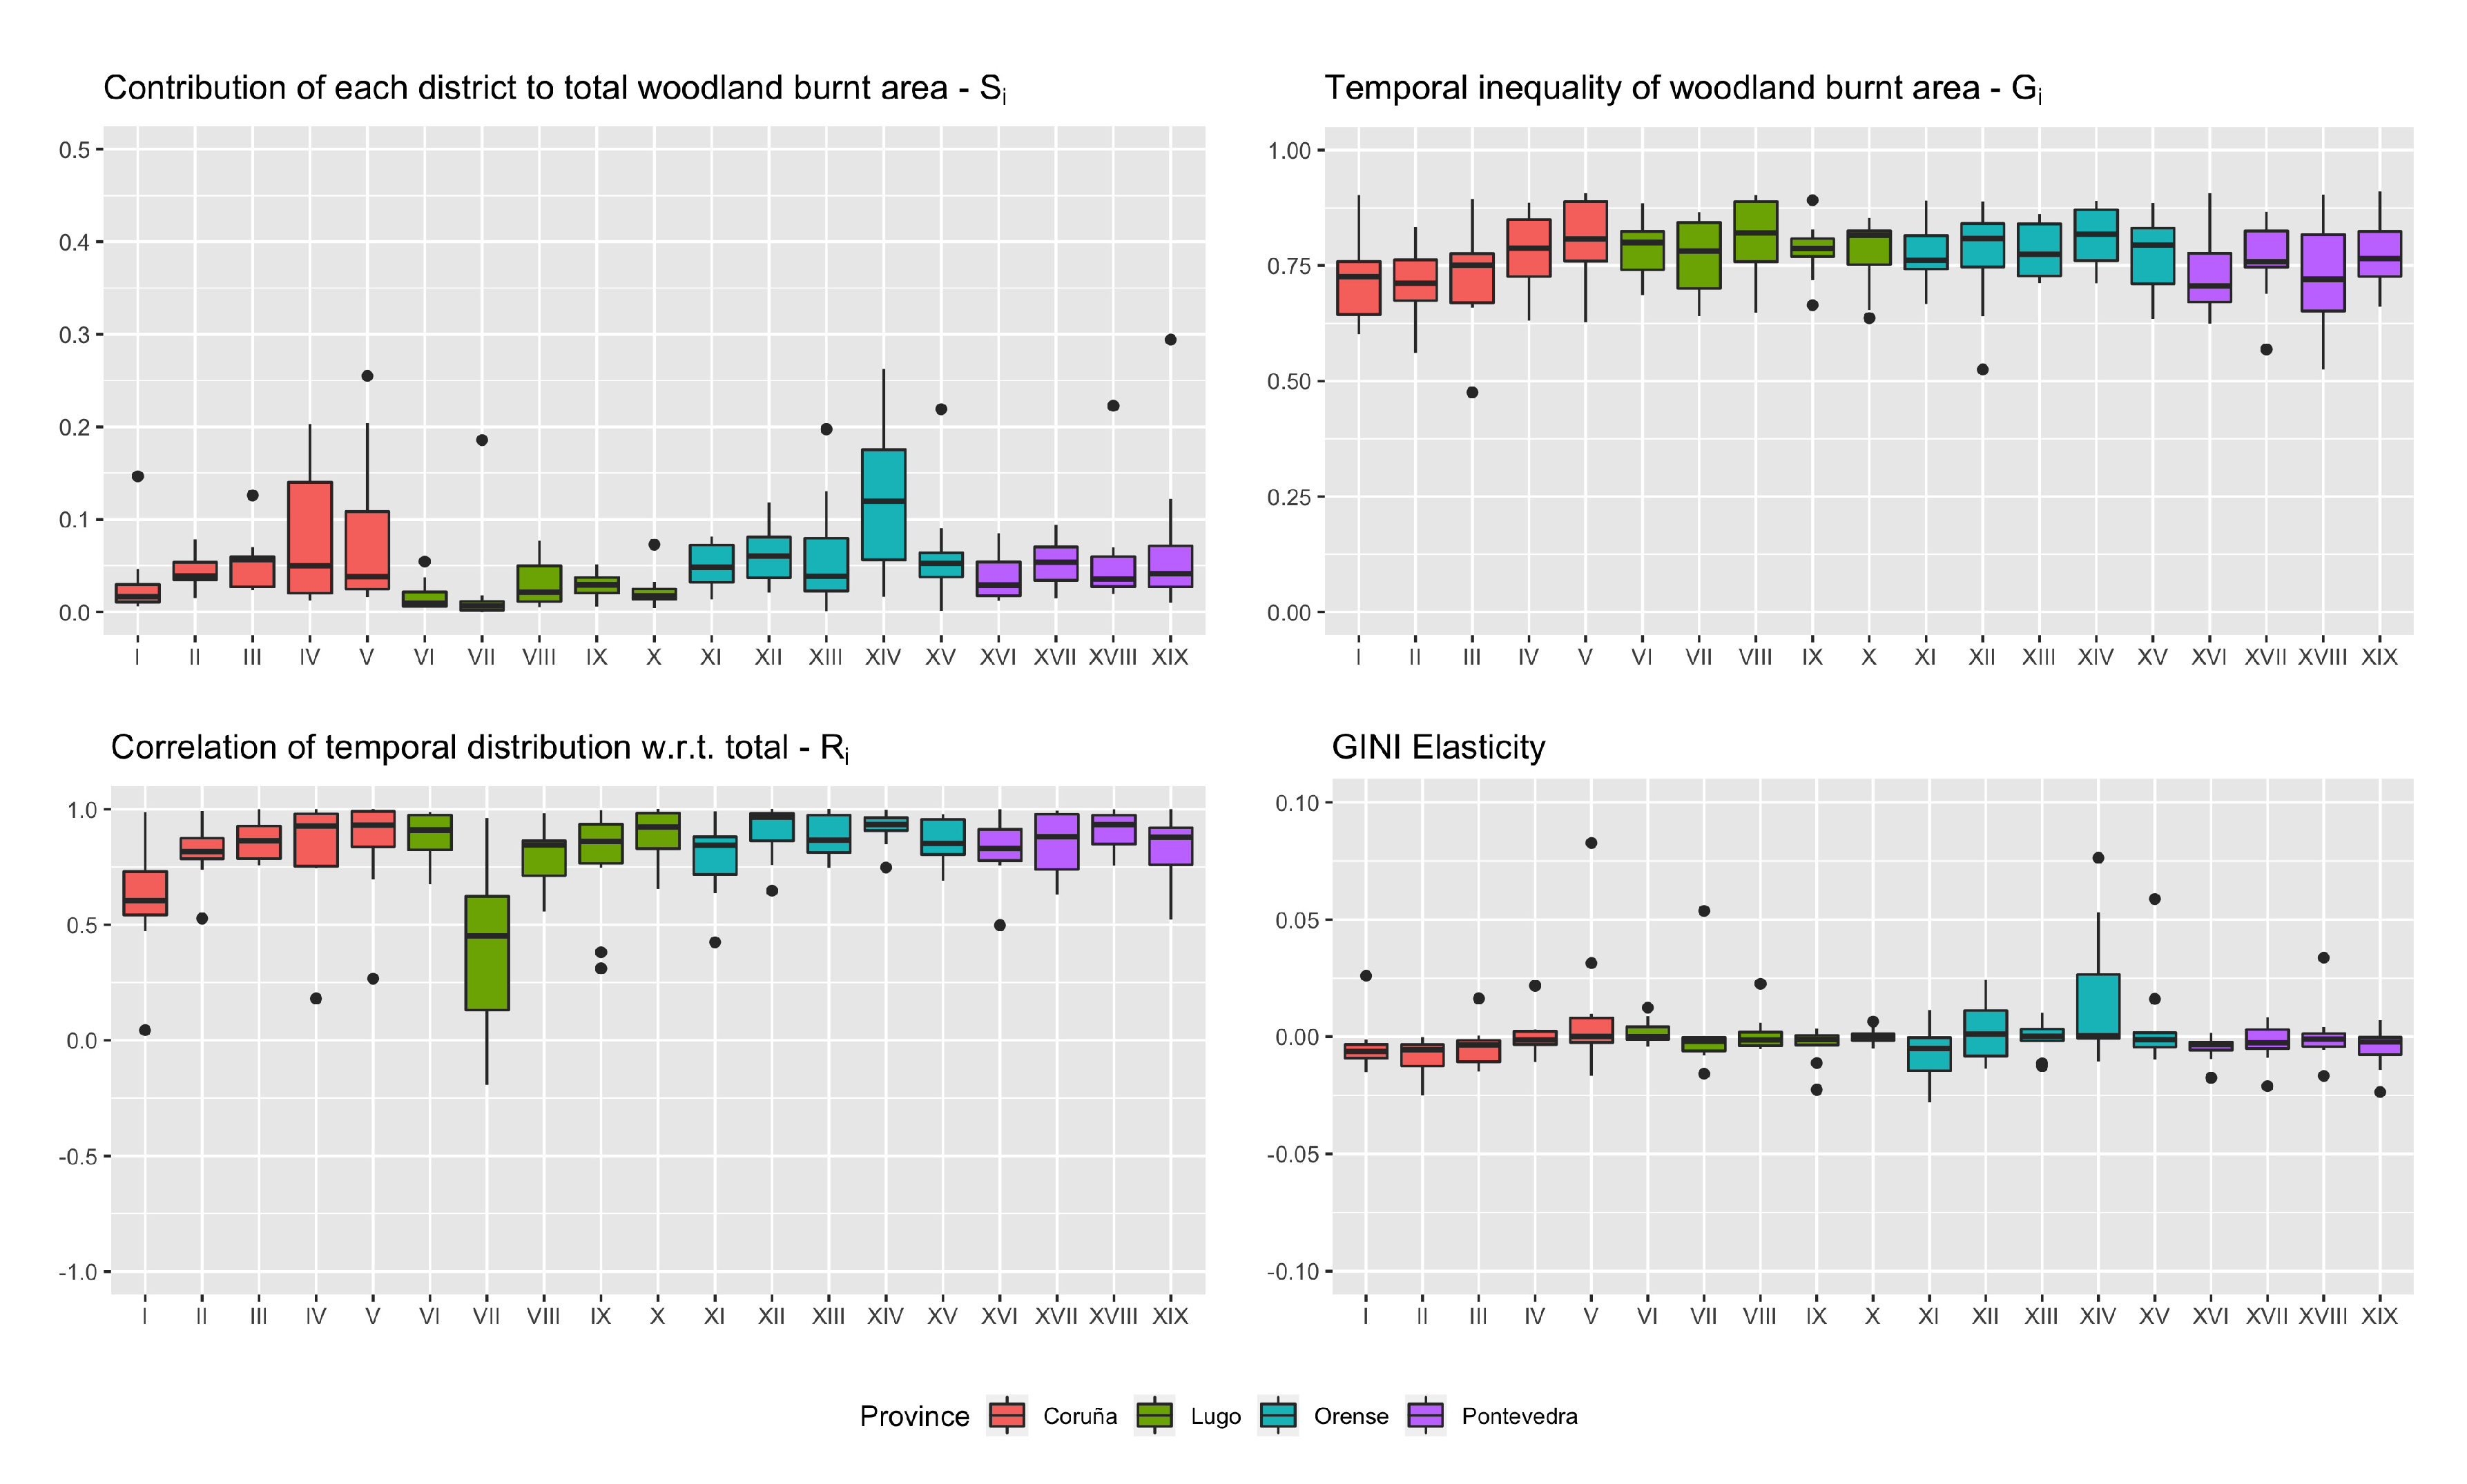
Figure 10 shows the Gini decomposition of the woodland area affected by fires. The districts of Ourense again show a contribution slightly higher than other areas in the period analyzed, and especially district XIV, which also has high variability. Districts IV and V also have high variability between years, in spite of their relatively low averages. Note, compared to
Figure 9, that the variability in general is much greater for the affected woodland area than for the number of fires.
In terms of temporal inhomogeneity, all districts have higher average values compared to the inhomogeneity of the number of fires. Districts VIII-X-XIV have a slightly higher average concentration than the other districts, while districts I-II-XVI-XVIII have lower average values. It is important to emphasize the overall high variability of these values.
All correlation factors are again positive and high (with a few low outliers), except for District I and District VII. For these two districts, the elasticity analysis should therefore be taken with caution. For the remaining districts, the average elasticities are all quite low, although the variability in the elasticities of the Ourense districts stands out, with positive as well as negative values. The average elasticity is negative for most districts of Coruña, which can be understood by the fact that these districts have lower-than-average temporal inequality.
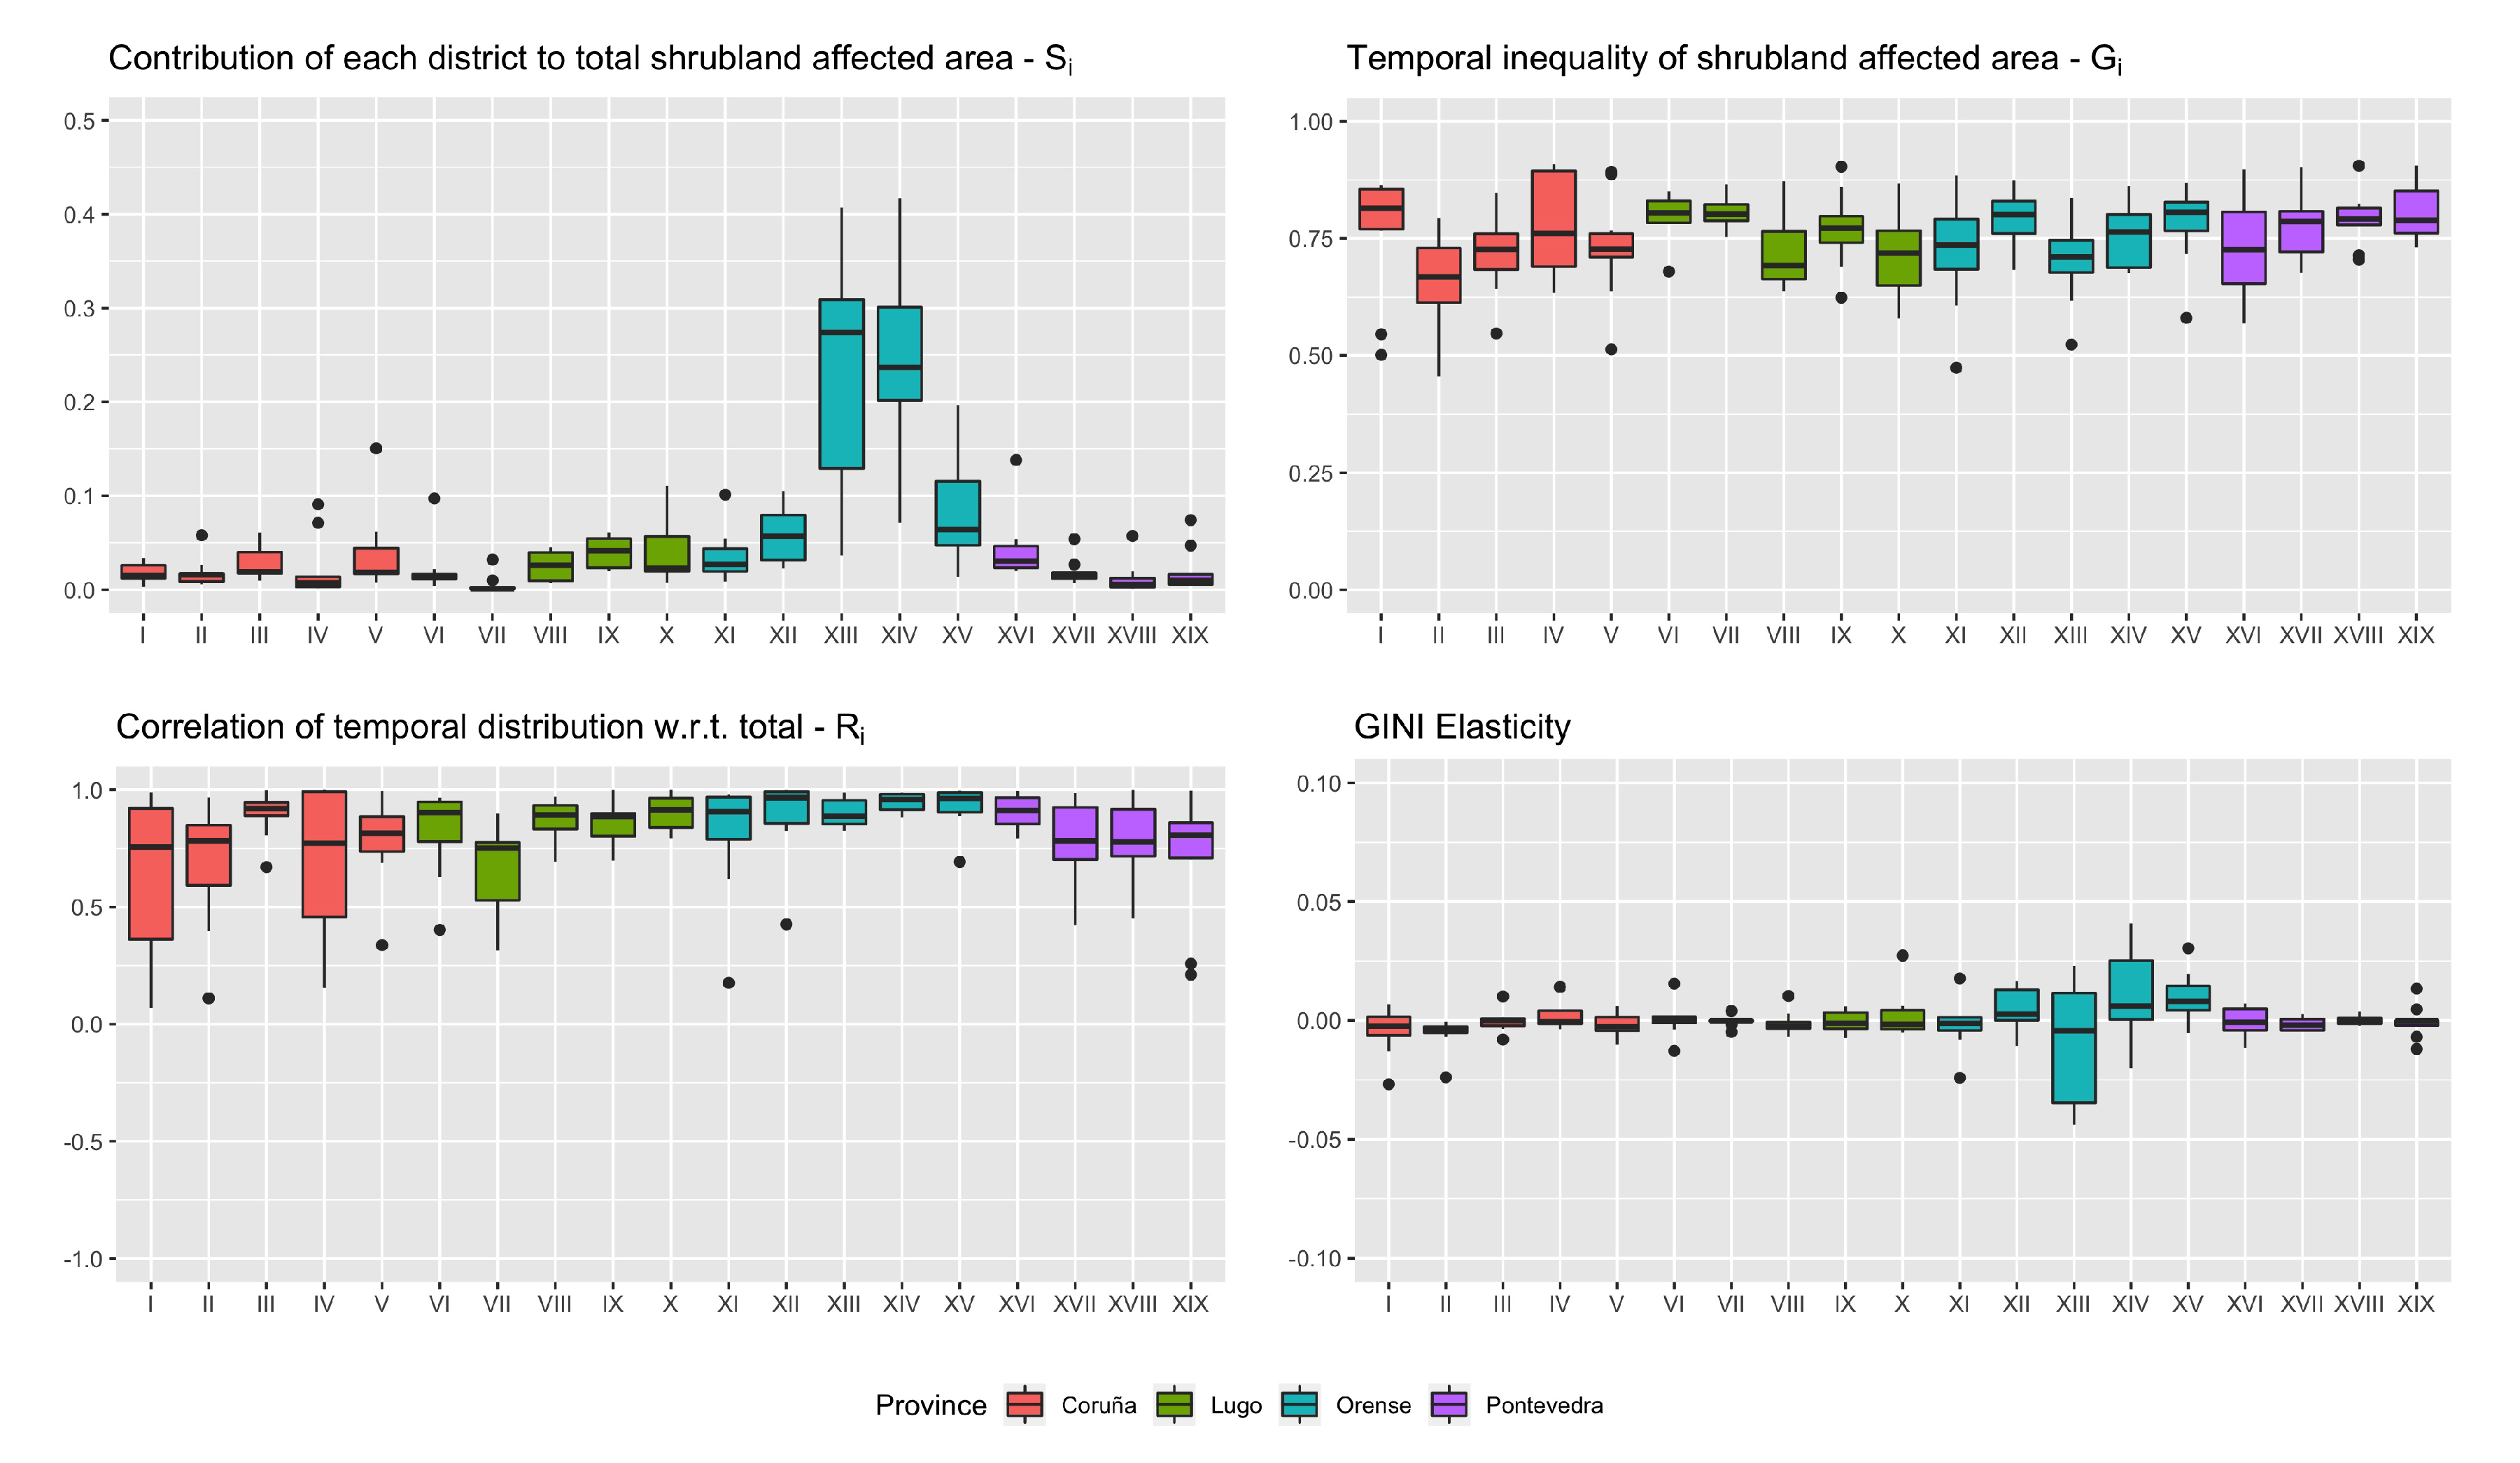
Finally, the Gini decomposition of the affected shrubland is represented in
Figure 11. The importance of the forest districts in the province of Ourense again stands out, even more strongly than in the previous cases.
In terms of temporal inhomogeneity, the values are roughly similar to those obtained for the burned woodland area, and higher than for the number of fires. Several districts (I, VI, VII, IX, XII and XVIII) present low variability with high averages during the study period.
The average correlations are, once more, all positive and relatively high, although some districts show substantial variability. However, on average, the elasticities are therefore relevant in all districts. Most of these elasticities have low values and low variability. Again, the exception is in the province of Ourense, where there is a relatively strong variability in the elasticities.
4. Discussion
The distribution of wildifires in Galicia presents important spatial and temporal inhomogeneities, which preventive wildfire policy should take into account. The importance of the spatial distribution of wildfires was stressed, for example, in [
28] or [
25], which examined the risk of wildfire across the different forest districts. The spatial patterns studied in the present work show important contributions with relatively low inhomogeneity during the summer months. The wildfire policy during summer should therefore be homogeneous across all Galician districts (and in particular: of maximum alert during the month of August), as is largely the case nowadays. This is true, although to a slightly less degree, for the adjacent months of June and October as well. Interestingly, the whole period starting from April also presents relatively low inhomogeneity and it could therefore be indicated to expand the global homogeneous policy (in the sense described in the Introduction) to the whole period from April to October. Note that the results for April are remarkable because it is a relatively cool and rainy month. The months of November, December, January and February show fewer wildfires, but with a high geographic dispersion. In these months, the firefighting policy should therefore lean towards a relatively small but highly mobile fire intervention force. Finally, the month of March is the most problematic from a policy point of view. Indeed, March marks the beginning of the wildfire season, with an above-average contribution, but with quite high geographical inequality. A hybrid approach would therefore be indicated in this month.
The effectiveness of the previous considerations will depend on the Gini elasticity. In particular, the low values of the spatial elasticities per month mean that the impact of the policy for any month separately on the global Gini index will be relatively low. The exception are the months of August and September, which record higher marginal values, and therefore more strongly condition the global Gini patterns. It is therefore essential that policymakers continuously evaluate and review the fire policies according to the recorded data in these months, as these will most strongly influence the overall pattern.
With respect to the temporal patterns detected in this work, these are in agreement with (but much more detailed than) previous research. Indeed, [
29] remarks that there are temporal effects in the Galician wildfire distribution, but without describing them in detail, while [
28] finds—apart from the well-known wildfire high season in summer—also a secondary peak in March.
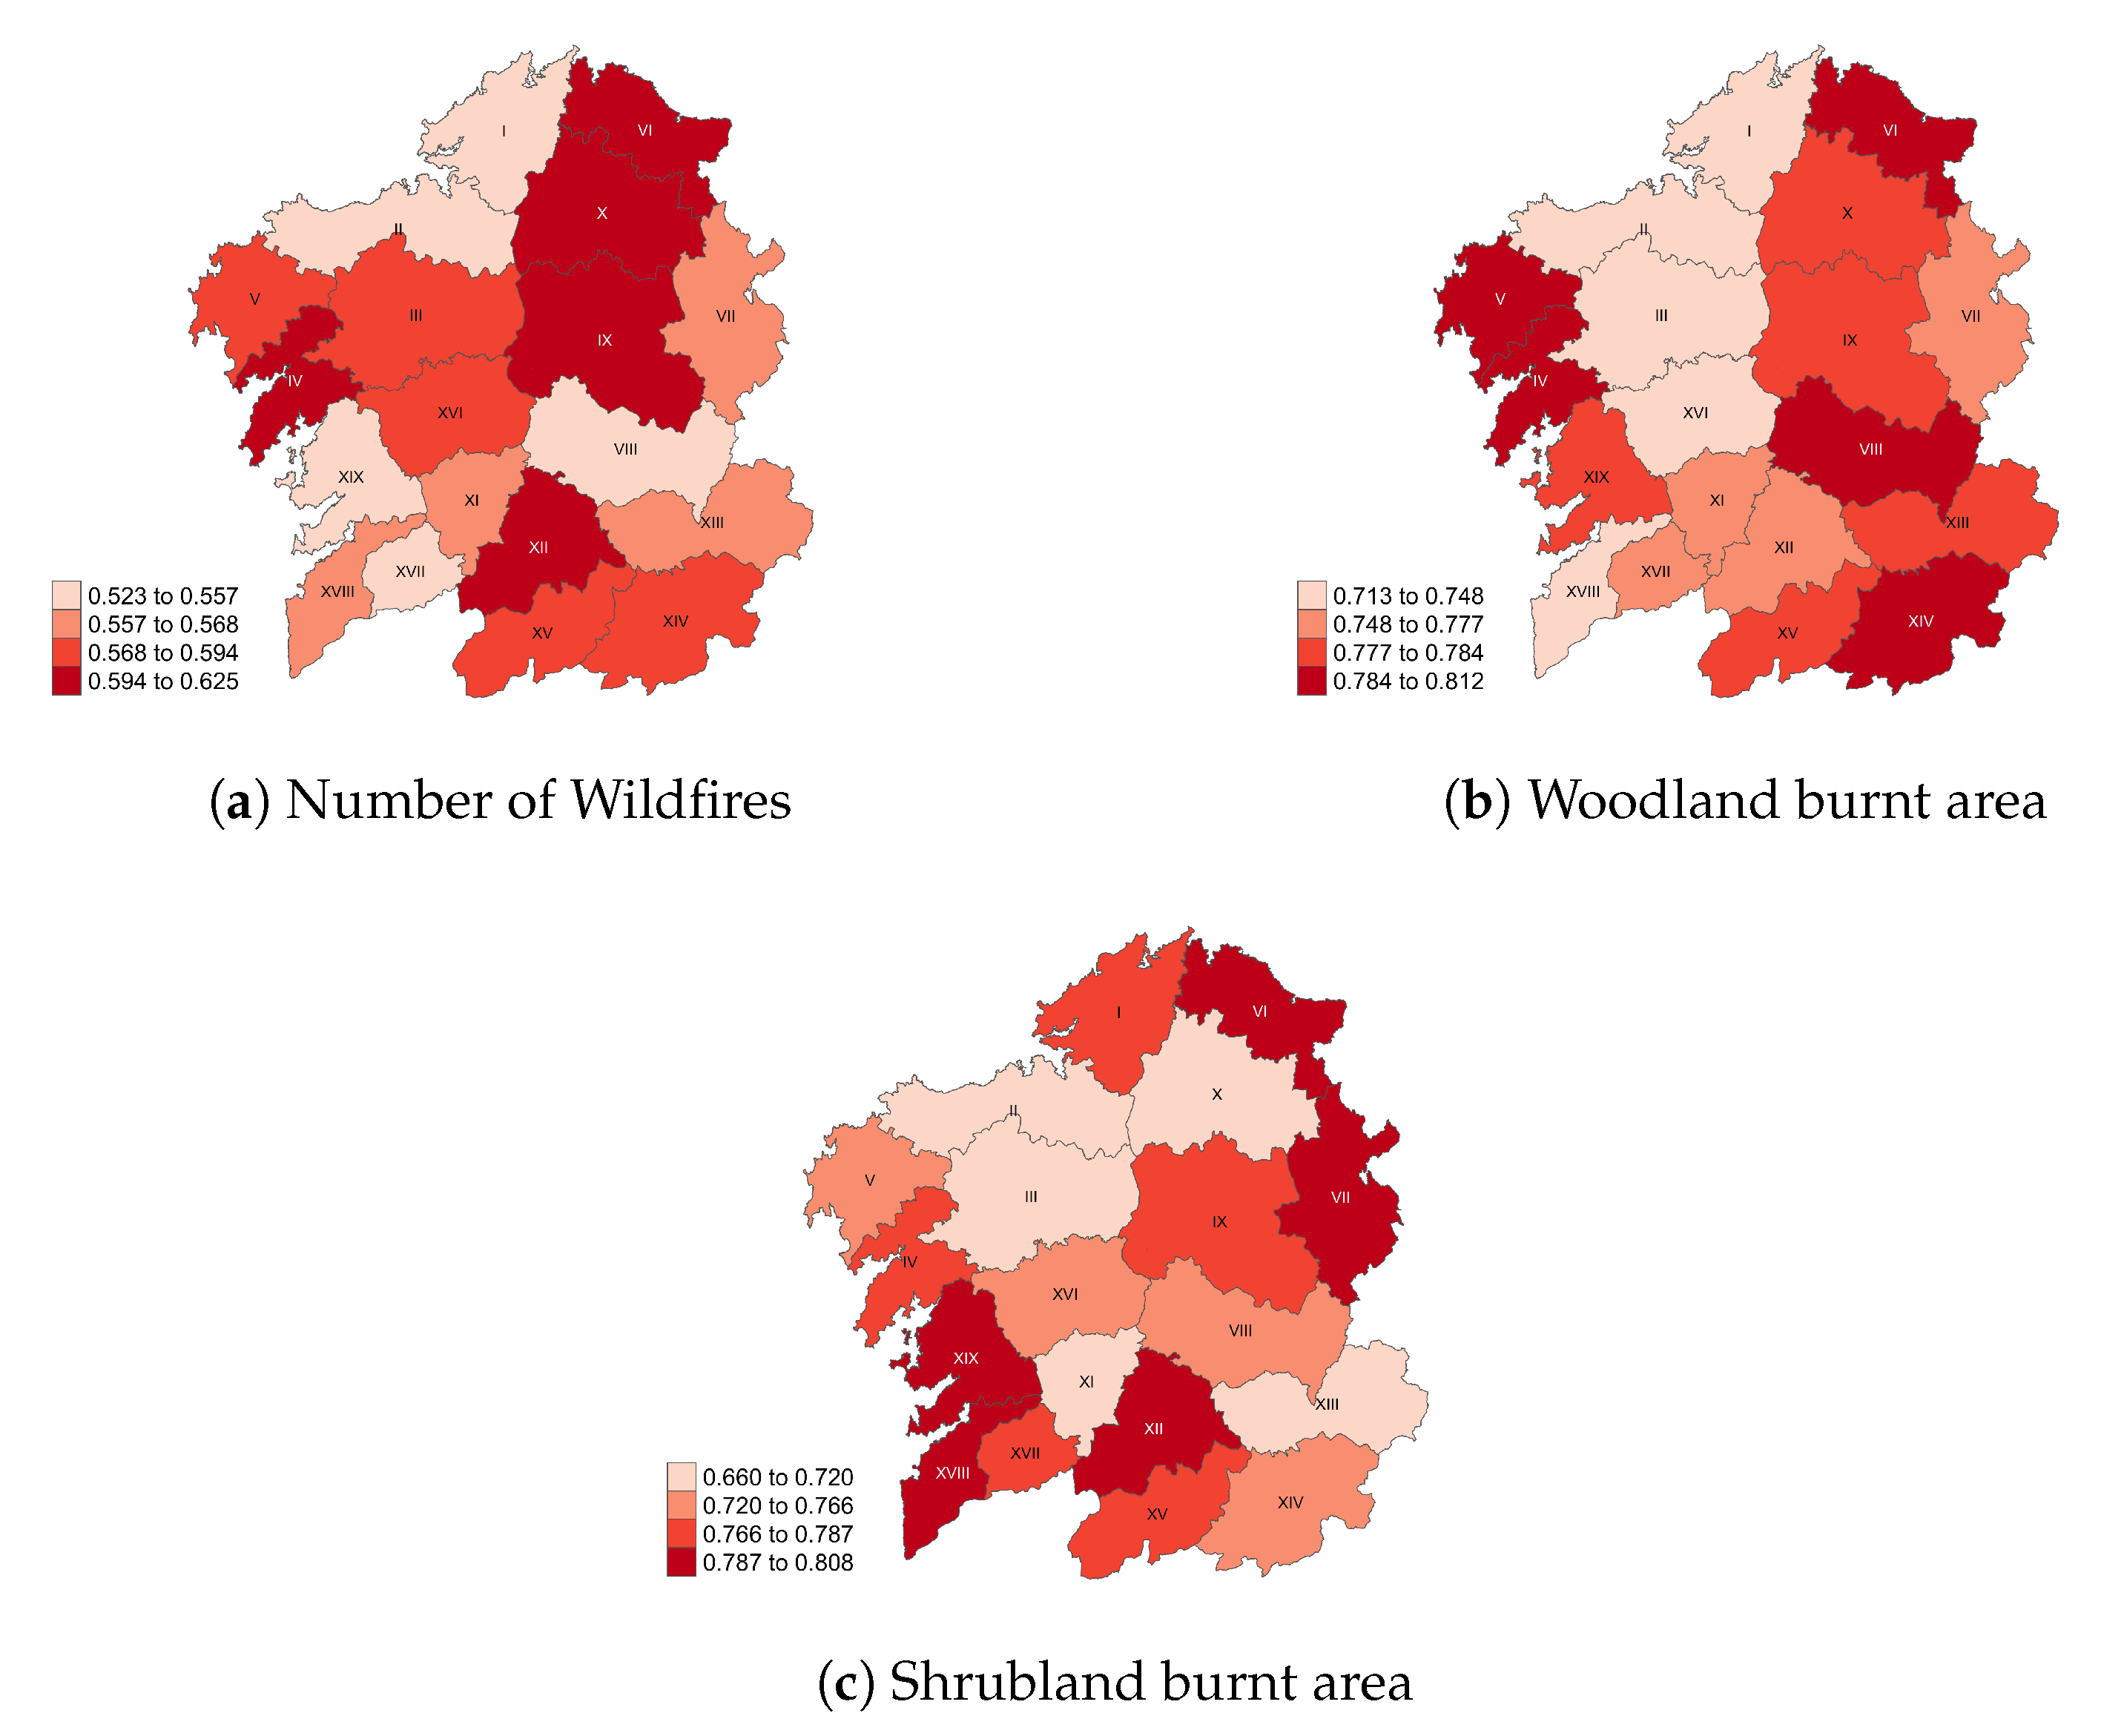
Figure 12 plots the temporal inhomogeneities in the 19 Galician forest districts, i.e., the average value of the index
. With respect to the number of wildfires, the strongest inhomogeneities are found in the vertical axis across the provinces of Lugo and Ourense, starting from district VI at the northern coast down to district XII as well as XV and XIV, with the exception of district VIII. Important inhomogeneities are also found in the center-west districts of Coruña (V, III and especially IV) and the contiguous district XVI of Pontevedra. A roughly similar pattern is found for the affected woodland area inhomogeneities, with again a vertical axis running across most of Lugo and Ourense, from the northern coast (district VI) down to the interior southeast (districts XIII, XIV and XV), with another block of important inhomogeneities on the west Atlantic coast (Lugo districts V and IV, and Pontevedra district XIX).
The inhomogeneity distribution for the burned shrubland area is quite different. Here, the two main blocks lie in the northeast (districts I, VI, VII and IX) and the southwest (IV, XIX, XVIII, XVII, XII and XV). These patterns have mainly a relative importance, in the sense that all districts present medium-to-high inequality indices in the same range (
for the number of wildfires, and
for the affected area). Nevertheless, the difference in the inhomogeneity patterns between the number of wildfires and affected woodland area on the one hand, and the affected shrubland area, on the other hand, is curious, and can probably be related to the influence of climate in the different parts of Galicia [
69,
70], and its impact on both the vegetation types and the wildfire distributions.
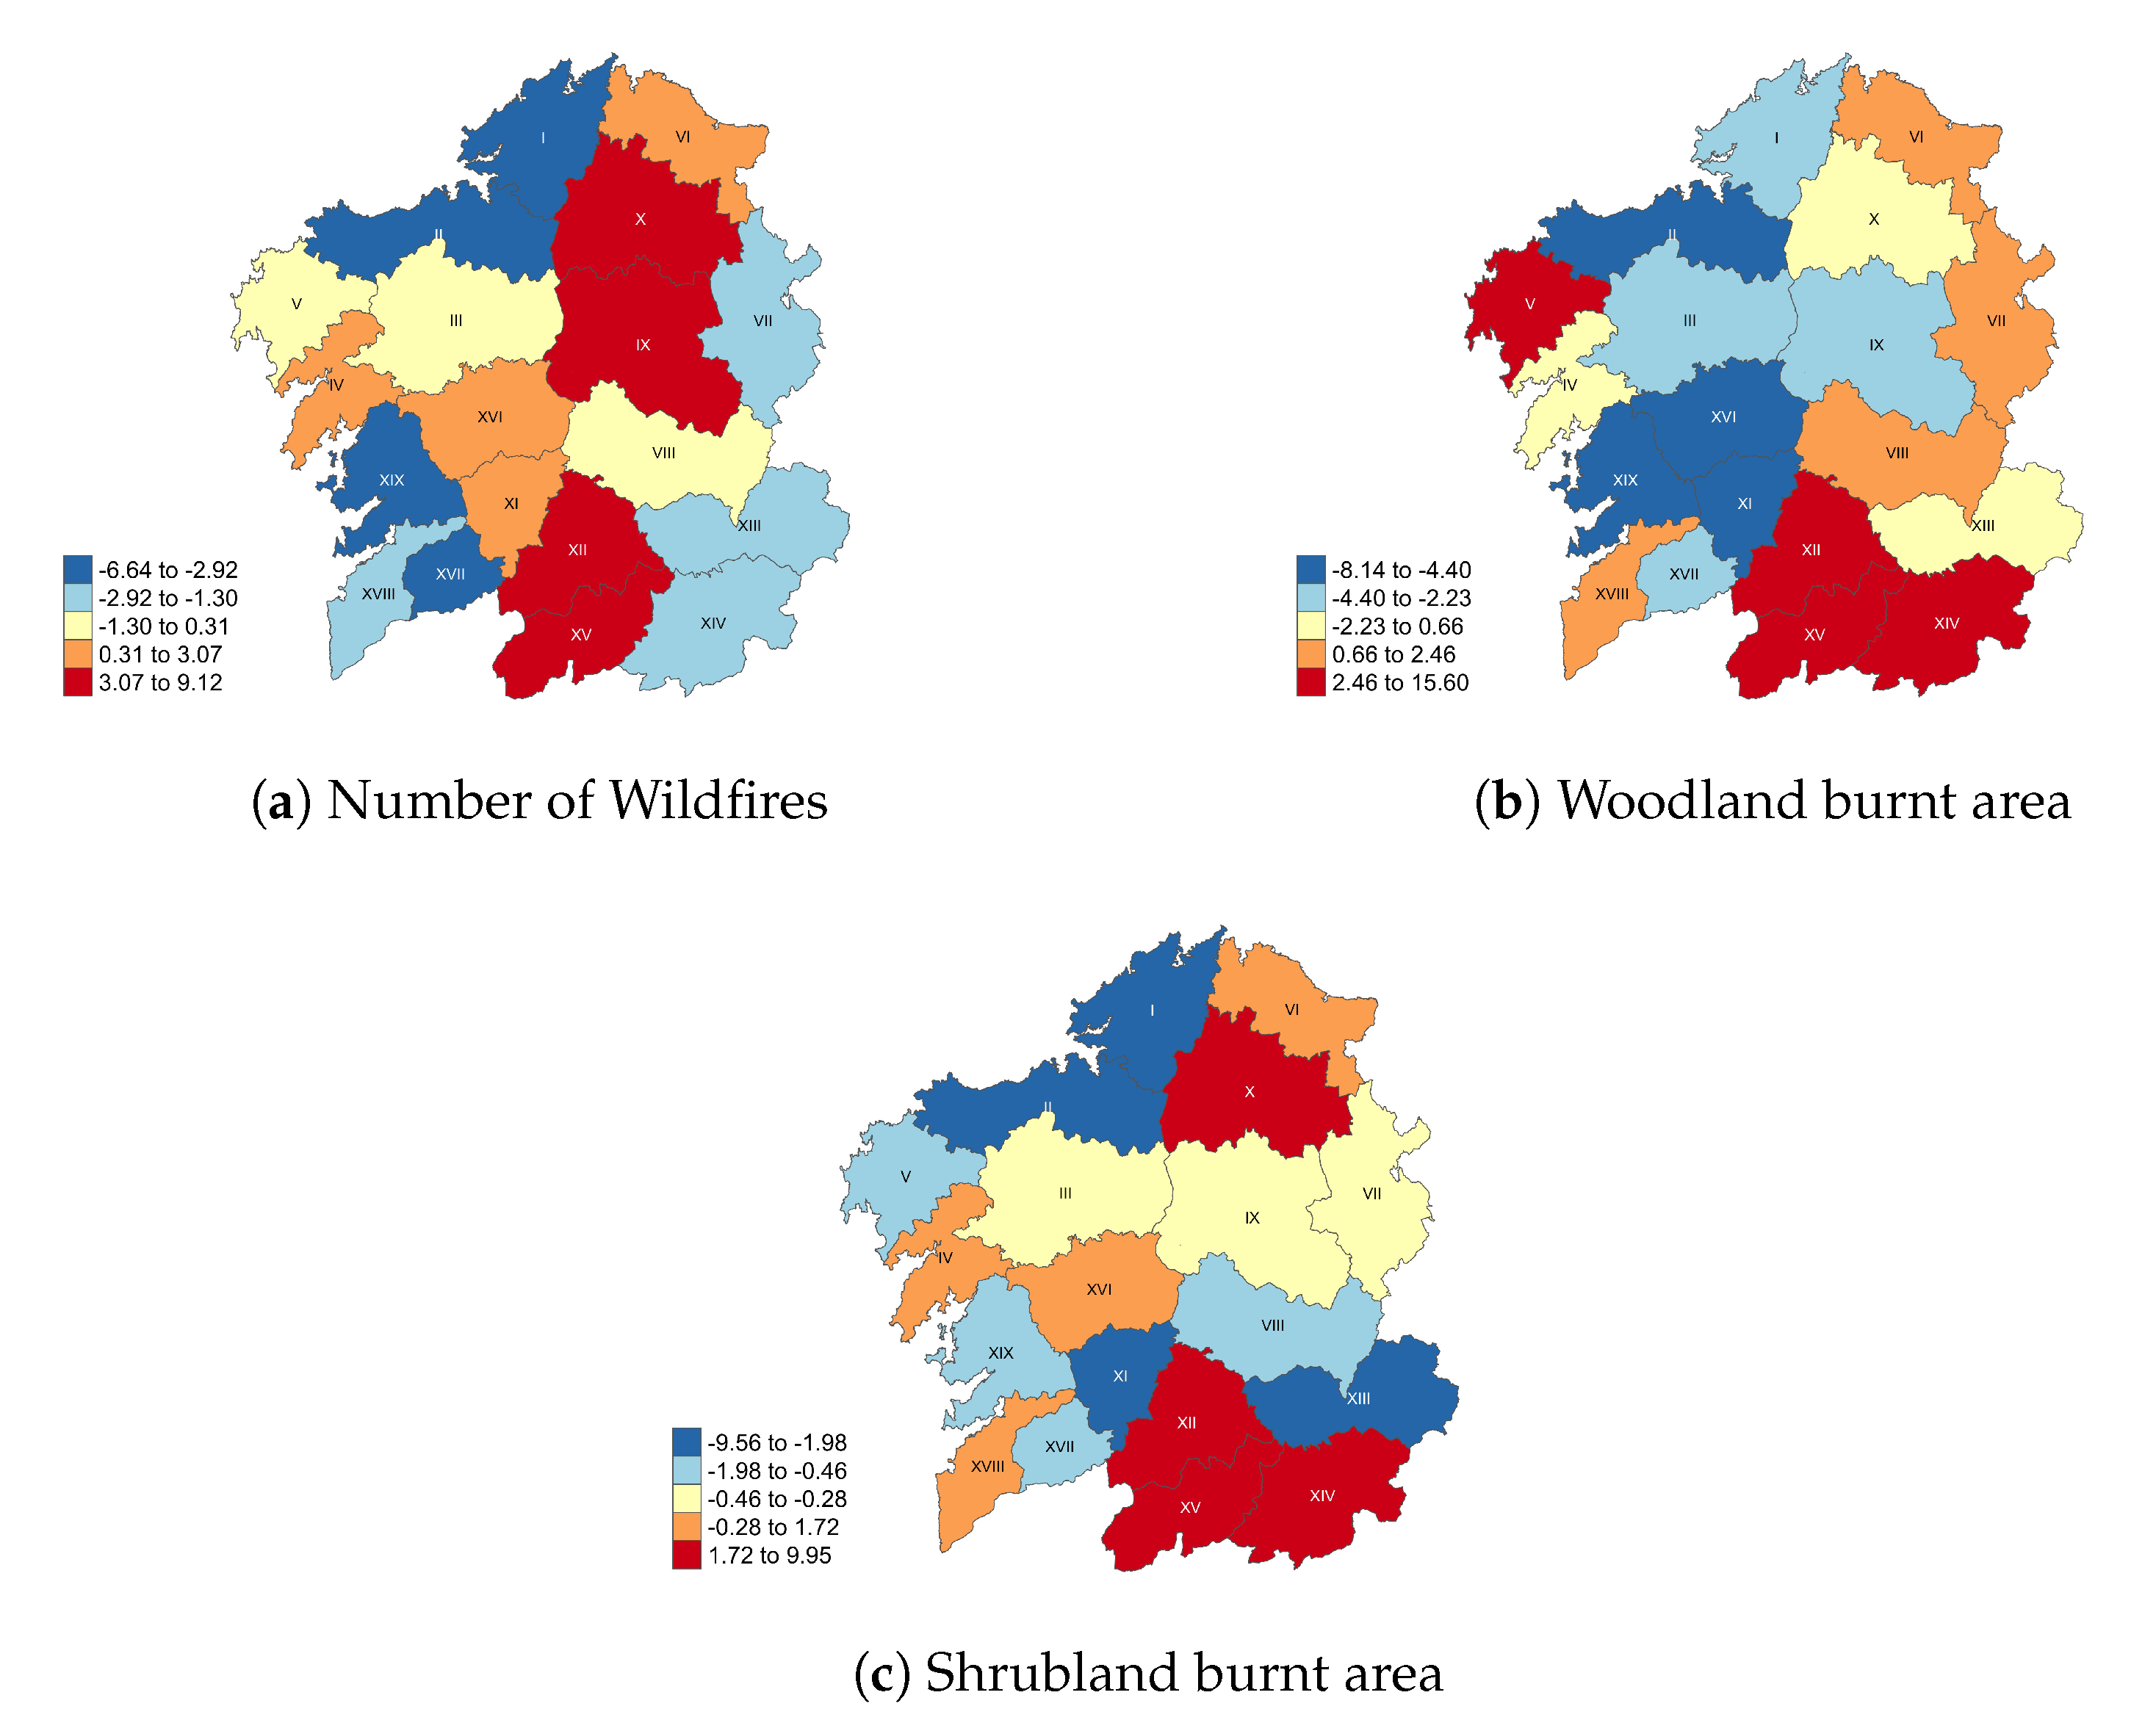
Since the average temporal elasticities of the wildfire data per district (see
Figure 9,
Figure 10 and
Figure 11) are very low, we have multiplied them by a factor 1000 and represented them in
Figure 13. These low values indicate that most districts have a weak potential for modifying the global Galician temporal distribution. Nevertheless, the relative differences between the districts show some interesting patterns. With respect to the number of wildfires, a north–south axis similar to the inequality pattern of
Figure 12a can be seen, with higher-than-average elasticities in districts X, IX, XIII and XV. The strongest negative elasticities are found in the northwest (districts I and II) and the southwest (districts XVII and XIX). The elasticities of the affected woodland and shrubland areas show certain similarities, with stronger-than-average positive elasticities in the southeast (the Ourense districts XII, XIV and XV), and negative ones in districts II and XI. However, there are also many differences, with some districts being strongly positive for woodland but not shrubland (V) or vice versa (X), and similar negative cases (XVI and XIX; and I and XIII, respectively). To sum up, the Ourense districts XII and XV in the southeast have strong positive elasticities with respect to all three variables studied, and district II likewise in a negative sense. These districts have the strongest potential to influence the global inhomogeneities in Galicia, and therefore merit special attention from policymakers. In particular, reducing the (number of and area affected by) wildfires in those districts will most strongly affect the overall inhomogeneity indicator. These districts should therefore be singled out for intense fire prevention policies, such as education of the local population, plantation selection, firebreak corridors, and prescribed fires [
71,
72,
73].
5. Conclusions
The occurrence of fires in Galicia presents both a spatial inequality throughout the different months of the year, and a temporal inequality along the different forest districts. In other words, the number of fires, the affected woodland area and the affected shrubland show both spatial and temporal inhomogeneity patterns. Public policies should be adapted to take into account these inhomogeneity patterns.
From a methodological point of view, the analysis presented here based on Gini indices has the advantage of allowing a detailed study both in time and in space of these inhomogeneities. It summarizes the inhomogeneities in two global indices (one temporal and one spatial), which permit a rapid evaluation of the degree of inhomogeneity of a region (or country), and could also be useful to compare different high-risk regions (for example, in the Mediterranean area), and cross-study regions with similar inhomogeneity levels. In this sense, forest studies applied to other regions that suffer from wildfires would benefit from the methodology introduced here.
For the concrete case of Galicia, the following observations deserve highlighting. With respect to the spatial concentration, the winter months contribute relatively little to the total number of fires and affected area, but have a high geographical concentration of fires. So specific plans should be designed for these months, taking into account the characteristics previously recorded in those fire patterns, in order to maximize the efficiency of the fire prevention and fighting, while optimizing the corresponding cost. For the summer months, on the contrary, it seems correct that a general public policy is applied, since these months have a low spatial inhomogeneity. In addition, it can be observed that the most sensitive month to determine the concentration in Galicia is the month of August, which shows the highest number of fires and affected area but with a low concentration. So that month should be emphasized as a month of maximum alert everywhere. The month of March was found to be important also. It is a month that is currently not a specific focus of fire policy in Galicia, however it has been shown here to have a relatively high contribution, with also a high geographical inequality, and so would require a carefully balanced approach.
The temporal analysis shows high concentrations, especially for the affected area. This is consistent with the previous comments, in the sense that there is a predominant number of fires and burned areas during the summer months, especially August, with also a relatively important contribution in March, and much lower numbers throughout the rest of the year. This means that, in all districts, the fire policy should be adapted throughout the year. Relatively speaking, the districts of Coruña have on average slightly lower concentrations, but with a large variability. This large variability means that fire patterns in these districts should be monitored and followed as precisely as possible, even more so than in other districts, in order to adapt the public policies in these districts to the circumstances of each year. By contrast, the districts of Ourense, which on average have the highest contribution to the overall number of fires and affected area, have even higher averages of inhomogeneity and greater elasticity, but they are more stable (smaller variance). Therefore, in these districts, public policy, although adaptive from month to month, can in principle be made relatively stable from year to year. However, since these districts have the highest impact on the global Galician wildfire (in)equality, it is still important to record in detail any possible changes and the policymaker should consider adaptive policies whenever necessary.
The above recommendations should obviously be balanced with other types of considerations before leading to detailed, concrete recommendations in terms of actual fire policy. For instance, while from a purely economic point of view it might make sense to hire many firefighters on temporary contracts during the summer months and release them in October once the main wildfire season is over, such a policy might lead to socio-professional discontent, which should be brought directly or indirectly into the balance.
As a more general shortcoming of the present study, it only considers the evolution of the fires themselves, in terms of numbers of wildfires and affected (woodland and shrubland) area. In future research, it would be interesting to study how environmental, climatic or socio-economic factors both condition the concentration of fires, and are affected by these concentration patterns. This would help to better understand both how to design preventive public policies as well as more rapid and better-planned fire fighting, and thus to increase the efficiency of the forest policy while at the same time optimizing its cost.
Additionally, in the current research, spatial and temporal issues were studied separately. Their cross-consistency has been verified. For example, the fact that the spatial data reveal high temporal inhomogeneities for all districts is consistent with the fact that the temporal pattern shows a strong peak during summer (and particularly in August). In the future it would be interesting to study joint space-time inhomogeneity indicators, as well as to apply a full-blown space-time econometric analysis, for example, through spatial panel data or Durbin models.
Finally, as indicated in the introduction, the Gini index could be used to classify and compare fire activity across different regions in the world. This would require full access to the relevant data for these different regions, and performing the same calculations explained in
Section 2. In order to classify and compare the regions, it is sufficient to calculate the overall (spatial and/or temporal) Gini index. Further information about the origin of the obtained value, the contributions from the different months or subregions, and how strongly modifications to each of these would affect the overall inhomogeneity indicator can be obtained by a more detailed space-time decomposition such as the one that we have here presented for Galicia.


