Article

Methyl Salicylate and Sesquiterpene Emissions Are Indicative for Aphid Infestation on Scots Pine

by
Minna Kivimäenpää
1,*,
Aishat B. Babalola
1,
Jorma Joutsensaari
2 and
Jarmo K. Holopainen
1
1
Department of Environmental and Biological Sciences, University of Eastern Finland, P.O. Box 1627, FI-70211 Kuopio, Finland
2
Department of Applied Physics, University of Eastern Finland, P.O. Box 1627, FI-70211 Kuopio, Finland
*
Author to whom correspondence should be addressed.
Forests 2020, 11(5), 573; https://doi.org/10.3390/f11050573
Submission received: 24 April 2020 / Revised: 15 May 2020 / Accepted: 17 May 2020 / Published: 20 May 2020
(This article belongs to the Section Forest Ecology and Management)

Abstract

:
Biotic stresses on forest trees are caused by various pest insects and plant pathogens. Attack by these parasites is known to induce the emissions of various biogenic volatile organic compounds (BVOCs), and the profile of these emissions often differs between infested and healthy plants. This difference in emission profile can be used for the non-destructive early-stage diagnosis of the stressor organism. We studied how phloem feeding by a large pine aphid (Cinara pinea Mordvilko) on the branch bark of Scots pine (Pinus sylvestris L.) affects BVOC emissions compared to those of healthy plants in two experiments. We found that in aphid-infested plants, methyl salicylate (MeSA) emissions significantly increased, and the emission rates were dependent on aphid density on the studied branch. Aphid infestation did not significantly affect total monoterpene emission, while the emissions of total sesquiterpenes were substantially higher in aphid-infested saplings than in uninfested plants. Sesquiterpene (E, E)-α-farnesene was emitted at increased rates in both experiments, and the aphid alarm pheromone sesquiterpene (E)-β-farnesene, only in the experiment with higher aphid pressure. We conclude that the rapid increase in MeSA emissions is the most reliable indicator of aphid infestation in pine trees together with (E, E)-α-farnesene.

1. Introduction

The non-destructive early-stage diagnosis of plant pathogen and insect pest infestations is important for successful plant protection in agriculture and horticulture [1,2]. Plant volatiles form the majority of the biogenic volatile organic compounds (BVOCs) emitted to the atmosphere, and their composition and ratio in the emission bouquet contain valuable information about the physiological and pathological status of the emitting plant [1,2,3,4]. Forests are one of the most significant sources of BVOCs [5,6,7,8], and the emissions are sensitive to abiotic and biotic stresses [9,10,11,12,13]. BVOCs emitted to the atmosphere from the forests have also an important role in secondary aerosol formation and in the control of atmospheric processes such as cloud formation [10,14].
In addition to traditional gas-chromatography mass-spectrometry (GC-MS) analysis and fast on-line proton-transfer-reaction mass spectrometry (PTR-MS) analysis with leaf and shoot enclosures [7,15], various portable [2] and aerial monitoring systems have been recently developed for the detection of BVOC emissions indicating plant stress [16,17]. For some BVOCs, the remote sensing of emissions from larger forested areas by satellite applications is under development [18]. A prerequisite for the use of BVOCs for diagnostic purposes is the proper knowledge of the volatile profiles induced by the attack of a specific insect species or plant pathogenic organism [1]. Furthermore, the effects of the progress of the attack on the BVOC profile needs to be analysed, because the emitted profile has distinctive variation based on the duration and age of the attack [19].
Aphids are a crucial part of functional forest ecosystems e.g., by providing aphid honeydew as an important carbohydrate source for many pollinators and for insects (e.g., ants) that are the natural enemies of defoliating insects [20,21,22,23,24,25]. Being phloem-sap feeders, aphids are extremely sensitive to variation in the nutrient content of the phloem sap; thus, aphid population growth easily responds to the various stresses affecting the nutritional status of the host plant [26,27,28,29,30,31]. Mass outbreaks of aphids lead to various responses in host trees including reduced photosynthesis [32], needle and leaf chlorosis and defoliation [33,34], and long-term aphid pressure can result in reduced timber yield [35]. However, in actively growing conifer forests, aphid–plant mutualism may improve tree growth when the ant communities maintained by aphid honeydew remove other, more serious insect defoliators from the foliage [36].
The induction of plant volatile emissions by aphids have been studied on crop plants, e.g., for diagnostic purposes [37], for the development of biological control for aphids [38,39,40] and for the control of aphid-transmitted plant viruses [41,42]. On deciduous trees, studies on aphid infection’s effects on BVOC emissions have indicated that methyl salicylate (MeSA) [43,44] and sesquiterpenes [43,45] are among the most inducible compounds during aphid infestation. The knowledge of aphid-induced volatile compounds for conifer trees is less, but some evidence of increased sesquiterpene and MeSA emissions from infected trees is available [12,46,47,48].
We wanted to know how the population growth and colonization of the large pine aphid Cinara pinea Mordvilko (Hemiptera: Aphididae), a common phloem-feeding stressor, on the branch bark of Scots pine (Pinus sylvestris) affect the BVOC emission profiles of current and previous year shoots. This species is a relatively large spider-like aphid species, commonly feeding on the bark of the current and previous year growth of Pinus spp. twigs, forming small colonies on elongating current year shoots and nymphs feeding close to the base of needles [49]. It is widely distributed in Europe and Asia, introduced to North America [49] and known to be relatively tolerant to the environmental stresses of the host tree [29,50]. C. pinea is a significant producer of honeydew (forest honey), actively attended by ants, and thus has an important role in the function of boreal conifer forest ecosystems [22,51,52]. Our aim was to find out how the bark-phloem sucking aphid C. pinea affects the BVOC bouquet of Scots pine. We performed two experiments in subsequent growing seasons. The aim of Experiment 1 was to monitor BVOC emission rates along with the change in the aphid population over time. The aim of Experiment 2 was to create higher aphid pressure than in Experiment 1 and confirm the results of Experiment 1. Our aim was also to provide information that could be used to develop BVOC-based tools as early-stage diagnostic indicators of aphid infestation in pine forest and forest tree nurseries.

2. Materials and Methods

2.1. Plant Material and Experimental Design

Experiment 1: Twelve seven-year old saplings were randomly selected from our outdoor stock of pine saplings with a seed origin of central Finland (produced by Taimityllilä Forest Nursery Oy, Mäntyharju, Finland) in 2015. Each of the saplings was repotted from 5 L plastic pots into 7.5 L plastic pots in a 1:1 mixture of garden soil (pH 6.2; Kekkilä Oy, Vantaa, Finland) and natural peat (pH 4.2; Kekkilä Oy, Vantaa, Finland). Prior to the experiment, the selected Scots pine saplings were screened for the proportion of Δ-3-carene in the BVOC emission blend (see Section 2.3 for the methods) to secure an even distribution of the common low and high Δ-3-carene chemotypes [53,54] to both treatments and to reduce chemotype-based variation in the BVOC data. Six saplings were grouped into control and aphid exposure treatments based on the proportion of Δ-3-carene in the BVOC emissions. This initiated collection of BVOCs from a designated branch tip (one randomly chosen branch tip from a randomly chosen branch in the second whorl from the top) of the saplings (see Section 2.3).
The saplings were fertilized with 0.5 L of 0.1% fertilizer (Turve-superex; N/P/K, 12:5:27; Kekkilä Oy, Vantaa, Finland) once a week for 8 weeks. They were nurtured under outdoor conditions with natural rainfall and watered when required.
Experiment 2: The same tree material (different saplings, now 8 years old) was used in another experiment in 2016. Four saplings were grouped to control and eight to aphid infestation treatment. A higher number of saplings was allocated to the infestation treatment in order to reduce the high variation in the BVOC emissions of the aphid-infested samples observed in Experiment 1. The maintenance of the seedlings was the same as in Experiment 1.

2.2. Insect Exposure

Experiment 1: Nymphs and mature fundatrix females (all hatched and developed from over-wintered eggs in early May) of the large pine aphid C. pinea were collected from naturally infested Scots pine trees on 24 May 2015 and reared on young Scots pine branches in insect cages until their parthenogenetic nymphs were used in the experiment.
Six Scots pine saplings were infested by nine aphids per sapling. Viviparous aphid nymphs represented late instar (3rd and 4th) and were transferred on 25 June 2015 on one experimental branch tip (with 2 needle generations and developing needles) per sapling. The branch tip with aphids was enclosed in mesh sleeves attached to the basal part of the branch tip. This was to ensure the aphids fed only on the designated branch tip. Similar branch tips of the control saplings were also enclosed in mesh sleeves to ensure that the studied branch tips of both the controls and infested saplings were exposed to the same condition of reduced sunlight. Aphids were counted seven times during the 40 day monitoring period by opening the mesh sleeves carefully, keeping escaping aphids inside the sleeves by gently sweeping with a small soft brush.
Experiment 2: In 2016, one branch tip per sapling was infested on 22 May using 15 late instar C. pinea nymphs. The nymphs were reared from over-wintering eggs on pine seedlings in growth chambers at 20 °C/12 °C (day/night), with a 18/6 (day/night) light rhythm simulating typical mid-May conditions in Finland. Aphids were also added to a few branch tips during two first weeks of the 5-week infestation period to replace dead aphids.

2.3. BVOC Sampling and Analysis

Experiment 1: BVOCs were collected eight times, once before aphid infestation and 7, 17, 19, 23, 26, 33 and 39 days after infestation. Before the collection of samples, polyethylene terephthalate (PET) bags (25 × 45 cm) (Look, Finland) were heated at +120 °C for 1 h to remove contaminants from the bags and cooled afterwards before use. The sampling from six saplings at a time was done in laboratory conditions at +20 °C and with a constant PAR level (photosynthetically active radiation) of ca. 300 µmol m−2 s−1 (lamps: Lival Shuttle Plus, Osram Delux F, 24W/41–827, Sipoo, Finland). The samplings were conducted in two rounds, each consisting of three controls and three aphid-infested saplings. The mesh sleeves were removed, and the branch tips (with the aphids) were enclosed within PET bags. The PET bags were tightly fastened to the base of the branch tip with wire tags, ensuring the needles were not damaged. The MnO2-scrubbed and charcoal-filtered air was blown into the bags via Teflon tubing at a rate of 0.36 L min−1 for 25 min prior to the sampling through a hole cut to the upper corner of the bag. After flushing the bags, the second corners of the bags were cut, and clean stainless tubes containing 250 mg of Tenax TA adsorbent (Markes International, Llantrisant, UK) were inserted and fastened with wire tags. The BVOC samples were collected into the tubes for 20 min using a vacuum pump (Model N022AN.18, KNF Neuberger, Inc., Freiburg, Germany) at an average flow rate of 0.2 L min−1. Blank samples were also collected from empty PET bags. Flow rates were adjusted before sampling using a mini-Buck calibrator (Model M-5, A.P. Buck, Inc., Orlando, FL, USA). On the last sampling day, BVOCs were collected from a similar uninfested branch tip from an adjacent branch of the same whorl to study systemic emissions.
The BVOC samples were analysed with a gas chromatograph–mass spectrometer (GC-MS, Hewlett-Packard GC 6890, MSD 5973). VOCs in the adsorbent tubes were desorbed with a thermal desorber (Perkin-Elmer ATD400 Automatic Thermal Desorption system, Wellesley, MA, USA) connected to the GC with a heat transfer line at +200 °C. The adsorbent tubes were first heated at +280 °C for 10 min, cryofocused at −30 °C on a cold trap and then injected in a split mode into an HP-5MS capillary column (model 19091S-436; 60 m × 0.25 mm i.d (inner diameter) × 0.25 μm film thickness; Agilent, County of Santa Clara, CA, USA) with helium used as the carrier gas. The oven temperature programme was set at +40 °C for 1 min, scheduled to increase by 5 °C min−1 to +125 °C and subsequently by 10 °C min−1 to +260 °C, and hold for 3.5 min, at a 1.2 mL min−1 column flow. Mass spectra were obtained by a scanning technique from 33 to 400 m/z. Monoterpenes (MTs), sesquiterpenes (SQTs) and green leaf volatiles (GLVs) were identified by comparing their mass spectra with the commercial standards, Wiley library and retention indices. The amounts of compounds for which standards were not available, but were identified with significant quality value (>90%) by the Wiley library, were calculated using α-pinene, 1,8-cineole and longifolene as reference substances for non-oxygenated MTs, oxygenated MTs and SQTs, respectively. The emission rates of the BVOC samples were calculated using Equation (1).
E = F   C 2 C 1 A
where E = the emission rate (ng cm−2 h−1), F is the flow rate (L min−1) to a collection bag, A is the total area of needles used for BVOC collection (cm2), C1 is the concentration of VOCs in the incoming air (ng L−1) and C2 is the concentration of VOCs in the outgoing air (ng L−1). C1 was assumed to be zero, as the quantity of VOCs in the empty PET bags was subtracted from the plant emissions and the replacement air to the bags was filtered. Needle area determination was based on needle numbers and lengths [55,56]. The formula was multiplied by 60 to convert minutes to hours.
Experiment 2: One branch tip per sapling from the control and aphid treatments was sampled for BVOC analysis. The sampling in 2016 differed from that in 2015 in the following ways. Sampling was conducted only once, on 27 June in outdoor conditions at +23 °C and with a PAR level of ca. 1500 µmol m−2 s−1 using portable battery-operated BVOC collection systems [57]. Bags were flushed with charcoal-filtered and MnO2-scrubbed air for 20 min using a flow rate 0.6 L min−1 that was not changed for collection. The sample was pulled into an adsorbent tube at a rate of 0.2 L min−1 for 15 min. GC-MS analysis was conducted using a different device (Hewlett-Packard GC 7890, MSD 5975C) and HP-5MS capillary column (model 19091S-105; 50 m × 0.20 mm i.d × 0.33 μm film thickness; Agilent, USA). The oven temperature programme was set at +40 °C for 2 min, then increased by 5 °C min−1 to +210 °C, and after that by 20 °C min−1 to +250 °C and held for 5 min, at a 1 mL min−1 column flow. Mass spectra were obtained by a scanning technique from 35 to 500 m/z. Emission rates were calculated per shoot length (ng cm−1 h−1) [58]. Otherwise, the methods were the same as in Experiment 1.

2.4. Statistical Analyses

Experiment 1: The effects of aphid infestation on BVOC emissions were studied by t-tests (normally distributed data, studied by Shapiro–Wilk test) or the Mann–Whitney tests (data not normally distributed even after data transformations) on each sampling time separately. T-tests or the Mann–Whitney tests were also used to test the differences between treatments in systemic emission rates. The Spearman correlation test was used for aphid-infested saplings to study the relationship between the daily averages of aphid numbers and BVOCs from infested branch tips. Only those BVOCs significantly affected by aphid infestation were studied by correlation tests.
Experiment 2: T-tests or the Mann–Whitney tests were used to test differences in BVOC emission rates between uninfested and aphid-infested plants. The Spearman correlation test was run between aphid numbers and BVOC emission rates (those significantly affected by aphid infestation) from the branch tips of the aphid-infested samplings.
In the results, untransformed values are shown. IBM SPSS Statistics for Windows (version 25.0, IBM Corp., Armonk, NY, USA) was used for all statistical tests.

3. Results

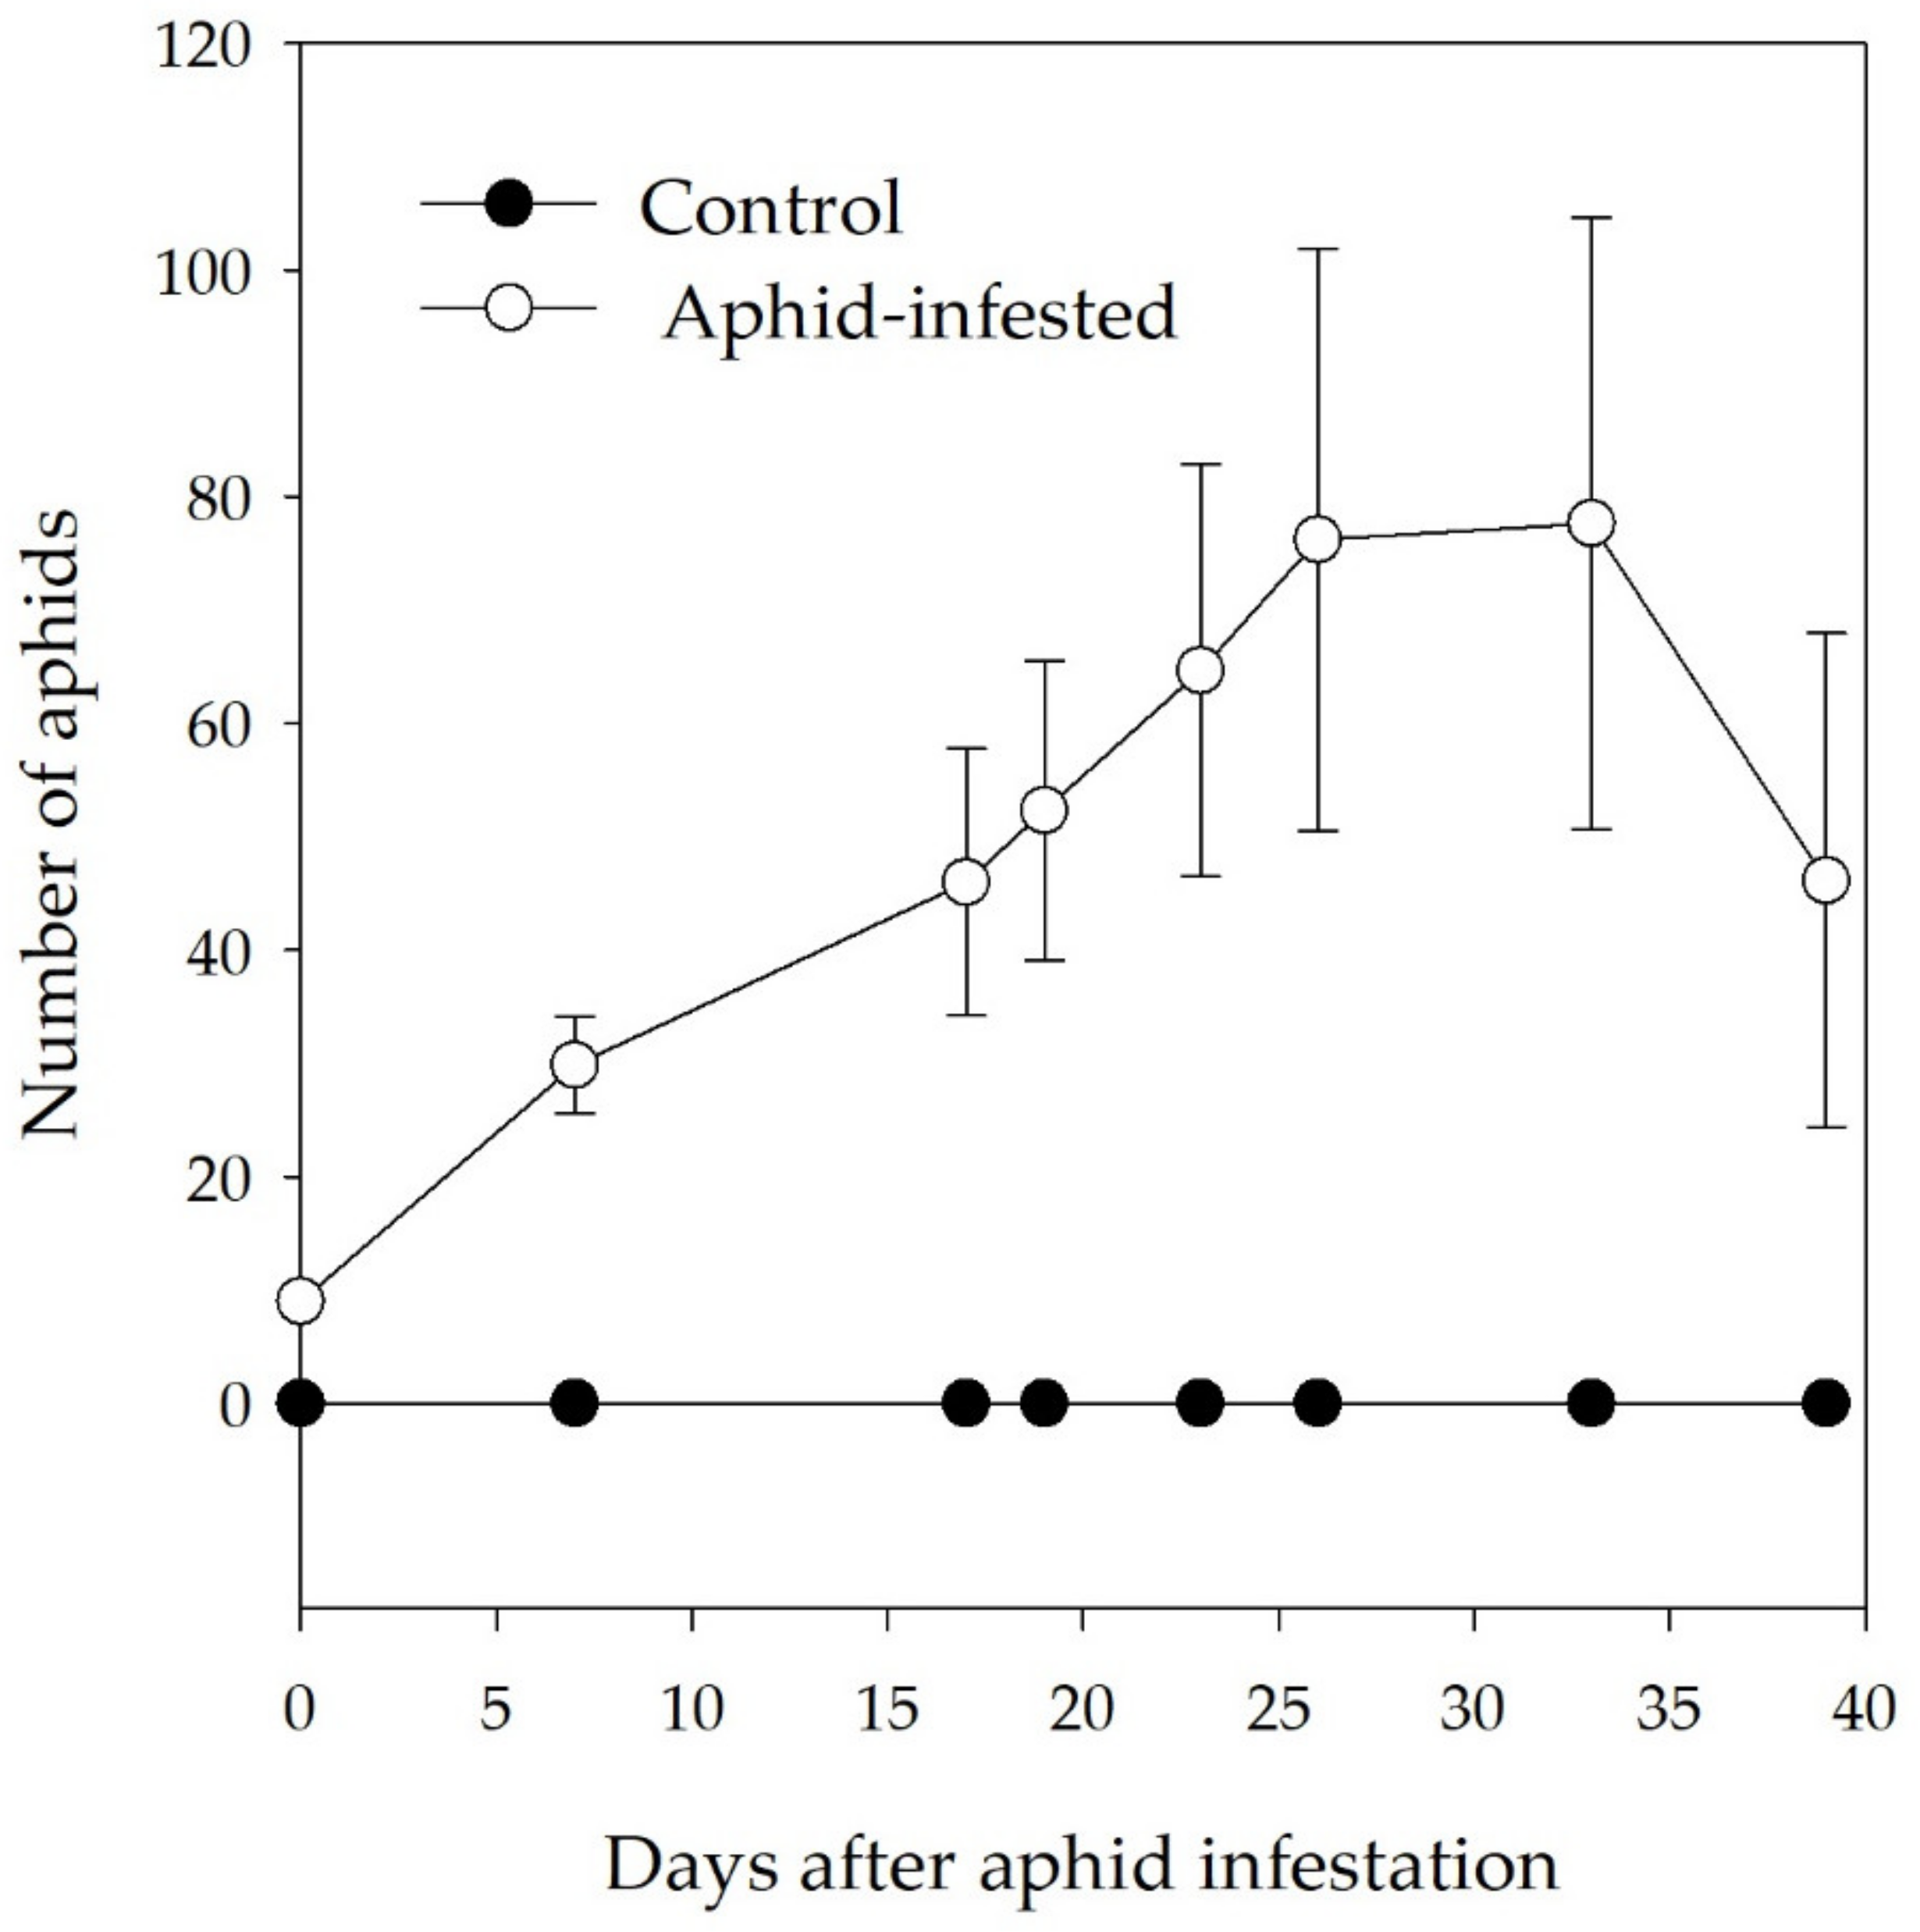
3.1. Aphid Density on Infested Branch Tips

Experiment 1: In 2015, the number of aphids occurring on aphid-infested plants increased over time since the beginning of the experimental trial, reaching an average of 77 ± 27 aphids per sapling 33 days after artificial infestation (Figure 1). In particular, the maximum number of aphids observed on an individual sapling was 188. Some winged aphids (alate) were observed to be produced 17 days after aphid infestation. The accumulation of honeydew on bark and needle surfaces was observed on Day 26 after aphid infestation.
In Experiment 2, aphids were counted on 27 June, 5 weeks from the beginning of the experiment, from the branch tips used for BVOC collection. The average number of living aphids was 138 ± 20 on the branch tips of the aphid-infested saplings and 0 on those of controls. Honeydew was abundant in the aphid-infested branch tips.

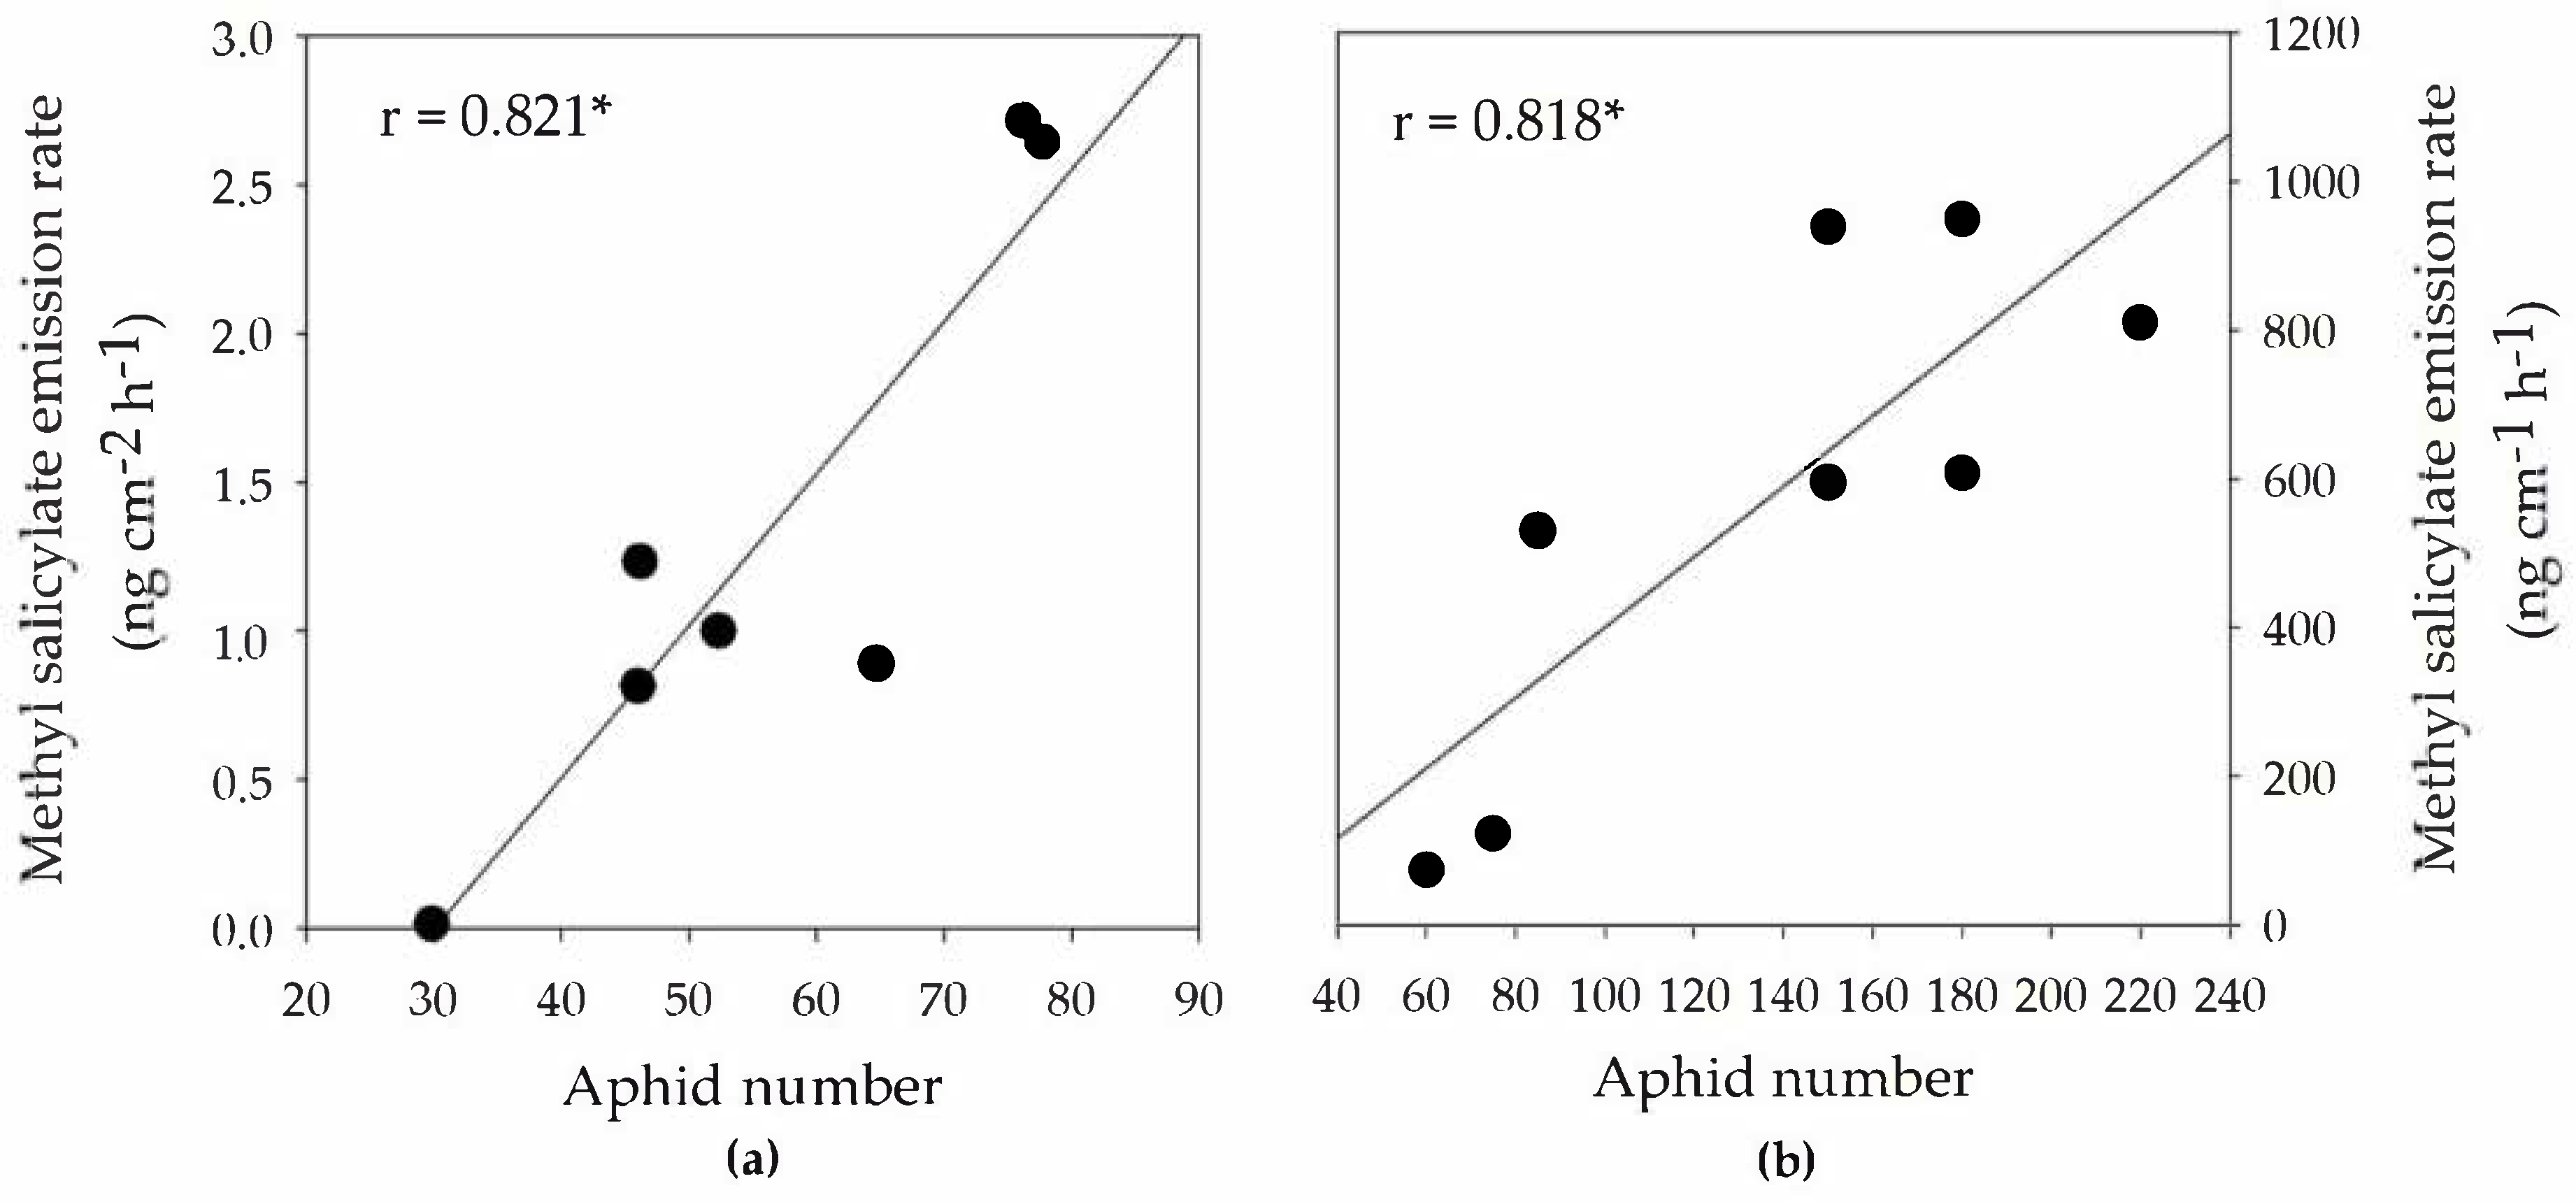
3.2. BVOC Emission Rates from Infested Branch Tips

Experiment 1: The emission rates of all individual compounds and total MTs, SQTs and GLVs from the infested branch tips and their controls at all sampling times are shown in Table S1. The emissions of MeSA were significantly higher from aphid-infested saplings on all sampling occasions after infestation (Figure 2a), more precisely, 15× higher on Day 7, 715× on Day 17, 518× on Day 19, 549× on Day 23, 267× on Day 26, 850× on Day 33 and 1075× on Day 39 after infestation. As an average of all sampling points after infestation, the MeSA emissions were 500 times higher in aphid-infested saplings. MeSA emissions peaked 5 weeks (33 days) after the infestation when, also, the number of aphids was the highest. After 3 weeks of feeding, the emission rates of MeSA remained at the same level as the total monoterpene emission rates (Table S1). The daily averages of MeSA emissions were positively correlated with the numbers of living aphids (Figure 3a).
Aphid infestation did not significantly affect total MT emissions (Table S1). On Day 33, the emission rates of two oxygenated MTs, borneol (Figure 2b) and camphor (Table S1), were significantly increased by aphid infestation, 36-fold and 3-fold, respectively. The emission rates of total SQTs (Table S1) were 24 times higher from aphid infested saplings than from controls 33 days after infestation, the difference being statistically significant (P = 0.048, t-test). On that day, the emissions of several SQTs were significantly increased by aphid infestation: (E,E)-α-farnesene (Figure 2c, 53× higher emissions), β-elemene (Figure 2d, 14×), β-caryophyllene (Figure 2e, 9×), δ-cadinene (Figure 2f, 10×), α-amorphene (Table S1, 16×), α-muurolene (Table S1, 9×), cis-α-bisabolene (Table S1, induction). The emission rates of (E)-β-farnesene (Table S1) were also increased by a factor of 27 but not significantly (P = 0.065, Mann–Whitney test). Among SQTs, (E,E)-α-farnesene emissions showed a significant effect of aphid infection a week earlier (Figure 2c) than other SQTs and had the highest emission rates among the SQTs. The emission rates of GLV (Z)-3-hexenyl-acetate were increased by a factor of 38 in aphid-infested branch tips compared to in controls on Day 19, and those of 1-hexanol, by a factor of 5 on Day 33 from infestation (Table S1). Among the terpenoids and GLVs significantly affected, the following showed significant, positive correlations between their daily average emission rates and the number of living aphids: borneol (r = 0.893, P = 0.007, n = 7), (E,E)-α-farnesene (r = 0.821, P = 0.023, n = 7) and 1-hexanol (r = 0.964, P < 0.001, n = 7).
Experiment 2: Aphid infestation for 5 weeks increased the emission rates of MeSA by a factor of 75 in 2016 (Table 1). The emission rates of MeSA were higher than those of any other compounds in aphid-infested saplings (Table 1). The number of living aphids and MeSA emission rates were positively correlated (Figure 3b). Aphid infestation significantly increased the total emission rates of SQTs by a factor of 7 (P = 0.004, t-test, Table 1.) Among the SQTs, three farnesene isomers—(E)-β-farnesene (identified with commercial standard), (E,E)-α-farnesene (Wiley library with 95% confidence) and α-farnesene (potentially (Z,E)-α-farnesene, Wiley library with 90% confidence)—were significantly affected and had the highest emission rates (Table 1). Their total emission rates were eight times higher from aphid-infested than control saplings but did not correlate with the aphid number (data not shown). The effects on other BVOCs were not significant (Table 1).

3.3. BVOC Emissions from Branches Adjacent to Aphid-Infested Branches (Systemic Emissions)

Table S2 shows the systemic BVOC emission rates of individual compounds and total MTs, SQTs and GLVs, i.e., samples collected from uninfested branch tips from branches adjacent to aphid-infested branches, as well as their controls, at the end of Experiment 1. The systemic emission rates of MeSA were 0.8% of those from the adjacent infested branch tips collected on the same day. The systemic MeSA emission rates were, at that point, 20 times higher in the aphid-infested trees than in the controls, but the effect was not significant. The other compounds were not significantly affected either (Table S2).

4. Discussion

Our result confirmed that the branch tips of Scots pine infested by a C. pinea population emit increased amounts of MeSA and SQTs, which were earlier found to be typical aphid-induced compounds in other conifers such as Norway spruce (Picea abies (L.) H. Karst.) [59], in deciduous trees [43,44] and in herbaceous plants [37]. Furthermore, we were able to show that MeSA emission per needle area and shoot length has a strong positive correlation with C. pinea density on the bark of the same branch. Both MeSA and SQTs are known to have hormone-like properties and the potential to affect the organisms in the surroundings of the aphid-attacked plant. MeSA has phytohormone properties and is functional in the plant to plant communication [7,60]. Several SQTs are related to plant insect communication [3], and (E)-β-farnesene (EBS), increased by aphid infestation in this study, is a well-known aphid alarm pheromone released by disturbed or attached aphids [61] but also produced by plants in their essential oils [61,62].
Salicylic acid (SA)-related genes are known to be expressed in agricultural plants after aphid feeding on the phloem sap, and the effector for the production of salicylate synthesis is the specific Armet protein, which is secreted into the phloem sap in aphid saliva [63,64]. The proposed function of Armet in aphid saliva is to bind Ca2+ ions that are released in the phloem sap after aphid stylet penetration into phloem sieve tubes [65]. The Ca2+ ions secreted by a plant will activate the occlusion of the sieve plates and thus limit the phloem sap flow in the sieve tubes and availability of phloem sap for aphids [65]. This defence strategy could be effective against aphid species, but it is relatively poorly known how many aphid species are capable of producing Armet [64] and which other methods aphids may use to reduce stylet-induced Ca2+ ions in the phloem sap. The release of Ca2+ ions in the phloem sap is known to act also as a systemic signal to transmit systemic defence responses in different parts of plants after herbivore feeding or phytopathogen attack [66]. In our study, no volatile compound showed a systemically induced response. This suggests that the MT or SQT emissions of Scots pine do not have a systemic response to aphid feeding, in contrast to Scots pine SQTs systemically responding to common pine sawfly (Diprion pini L.) oviposition [67], and MTs, to needle feeding by European pine sawfly larvae (Neodiprion sertifer L.) [58] and bark feeding by the large pine weevil (Hylobius abietis L.) [68].
In plants, MeSA production is catalysed from SA by a methyltranferase enzyme [60,69]. The aphid Armet has the capacity to regulate the genes controlling a methyltransferase that converts SA to methyl salicylate along with the regulation of the genes controlling methyl esterase enzymes that convert methyl salicylate back to SA [64]. However, although the Armet proteins of aphid saliva have this capacity, the Armet found in chewing insect saliva did not have the capacity to regulate SA and MeSA metabolism in plants [64]. An earlier study [43], comparing aphid-induced and chewing leaf beetle-induced BVOC emissions from deciduous trees Alnus glutinosa (L.) (Gaertn.) and Betula pendula (Roth.), found that leaf-feeding specialist aphids induced MeSA emissions from both tree species. However, leaf chewing leaf beetles that fed on the same tree species did not affect MeSA but induced, mostly, the emissions of terpenes and GLVs. In Scots pine, foliar herbivory by sawfly Acantholyda posticalis larvae increased the emissions of MTs (e.g., β-pinene and 1,8-cineole) and caused an over 3-fold increase in SQTs (including EBS and (E,E)-α-farnesene, increased by C. pinea in this study) [56]. N. sertifer larva feeding caused a 14-fold increase in MT, a 7-fold increase in SQT and a 13-fold increase in GLV emissions from Scots pine shoots during the one-month study period, causing the highest emissions 6–7 days from feeding [58]. D. pini larva feeding caused an over 15-fold increase in MT emissions (including of major Scots pine MTs, e.g., α-pinene, β-pinene, myrcene and limonene) [58]. Another study [70] also reported increased MT and SQT (including farnesenes and other SQTs, increased by C.pinea here) emissions by D. pini feeding. Bark herbivory by H. abietis caused a 3–4 fold increase in MT and 7–8 fold increase in SQT emissions from bark surfaces [68,71] and the induction of EBS [71]. None of these chewing insects significantly affected MeSA emissions from Scots pine. Needle cell-sucking spider mites and small gall mites induced MeSA emission from the needles of P. abies [72]. Earlier studies on agricultural crop plants have shown that individual leaf cell-sucking spider mites are inducers of MeSA in numerous host plant species [73]. Thus, MeSA emissions from plants, including conifers, seem to be indicative of sucking herbivores and could have diagnostic value for forest protection. It is noteworthy that the MeSA emissions of C. pinea-infested saplings exceeded those of monoterpenes that normally contribute over 90% of Scots pine emissions when measured using the same techniques as those used here [56,58].
Among terpenes, three closely related SQTs, the farnesenes, were significantly responding to aphid feeding. In both years, (E,E)-α-farnesene was the most responsive SQT to aphid infestation, and in the first-year experiment, it responded earlier than the other terpenoids. In the second year, there was a significant increase in the emission of E-β-farnesene (EBS). This compound is a well-known aphid alarm pheromone, released by aphids when disturbed by natural enemies or other factors [61]. EBS can be released by both adults and nymphs, and its release induced the escape reaction in the nearby aphids [74]. It is possible that our BVOC samplings in two successive years caused a different rate of disturbance and the release of an alarm pheromone. Plants capable of emitting EBS efficiently repelled aphids and, in addition, attracted natural enemies such as ladybird beetles [61]. However, when EBS was emitted by a genetically modified EBS-synthetizing plant, a repellent effect was found, but finally, there was not any significant effect on aphid performance [75]. We found minor amounts of EBS in the BVOC emission blend of uninfested pine seedlings in both years. EBS is a constituent of essential oils in several pine species [62,76] and has been shown to be emitted at low rates from herbivore-free P. sylvestris seedlings in the field [56,68] but also induced or increased by chewing herbivores [56,70,71]. It is also possible that the EBS from the control saplings of this study might be just contamination of the sticky SQT released by aphids and adhering on the surface of uninfested plants [77]. Based on the above, high farnesene emissions together with high MeSA may be indicative of bark-feeding aphid infestation, but not alone. MeSA seems to be a more sensitive indicator because it responded to aphid infestation 2–3 weeks earlier than sesquiterpenes.
Aphid infestation leads to the accumulation of honeydew on plant surfaces, particularly if the access of honeydew-collecting ants is limited [43]. Microbial growth on aphid honeydew might release small amounts of volatiles synthesised by bacteria and fungi, and these might be additional guides to attract natural enemies of aphids on plants [78]. Among the common MTs, such as the limonene and linalool produced and emitted by the host plant, there could be various microbial alcohols, alkenes esters and aromatics, such as benzenes produced by the bacteria associated with carbohydrate-rich honeydew. However, methyl salicylate and sesquiterpenes were not reported from honeydew emissions [78]. It was also demonstrated by the washing off of the honeydew from birch leaves and bark surfaces that honeydew removal did not reduce MeSA emissions from branch tips earlier infested by birch aphids [43]. Interestingly, MeSA [66,79] and farnesenes [1] were among the compounds induced in the host plant by bacterial and fungal phytopathogens. Therefore, future studies should clarify how much an aphid-induced BVOC profile differs from the BVOC emissions induced by phytopathogens in their host plant. Furthermore, induced emissions of MeSA [80] and farnesenes [61,81] are known to attract predators and parasitoids of aphids and other herbivorous insects and thus affect the function of forest ecosystems.

5. Conclusions

The induction of MeSA emission together with sesquiterpene farnesenes appeared to be indicative of aphid infestation on Scots pine. Our results suggest that a specific BVOC emission profile having these induced compounds has the potential to be used for the diagnosis of severe aphid infestations in conifers, and the profile differs from that in infestation by chewing needle and bark herbivores, characterized by a substantial increase in MTs and SQTs, although MeSA emission is also indicative of phytopathogen and spider mite attack. Our results are not only interesting from an indicator point of view, but they have importance for the understanding of the function of conifer forest ecosystems and can be applied in the development of sustainable biocontrol, forest nursery practices and forest management strategies.

Supplementary Materials

The following are available online at https://www.mdpi.com/1999-4907/11/5/573/s1, Table S1: Emission rates per needle area (ng cm−2 h−1) of BVOCs from control and aphid-infested Scots pine saplings before aphid infestation and at different days after aphid infestation in Experiment 1. Table S2: Average (SE) (n = 6) of systemic BVOC emission rates (ng cm−2 h−1) collected from an uninfested branch adjacent to an aphid-infested Scots pine branches and from control trees 39 days after aphid-infestation (Experiment 1).

Author Contributions

Conceptualization and methodology, M.K., J.J. and J.K.H.; data collection and analysis, M.K. and A.B.B.; original draft preparation M.K. and J.K.H; writing—review and editing M.K., J.J., A.B.B.: and J.K.H.; funding acquisition, J.J. and J.K.H. All authors have read and agreed to the published version of the manuscript.

Funding

This research was funded by the UEF International Top-Level Research Areas BORFOR and Aerosols, Climate Change and Human Health and the Academy of Finland (grant no. 252908 for J.J. and grant no. 278424 for J.K.H).

Conflicts of Interest

The authors declare no conflict of interest

References

  1. Jansen, R.M.C.; Wildt, J.; Kappers, I.F.; Bouwmeester, H.J.; Hofstee, J.W.; van Henten, E.J. Detection of diseased plants by analysis of volatile organic compound emission. Annu. Rev. Phytopathol. 2011, 49, 157–174. [Google Scholar] [CrossRef] [Green Version]
  2. Li, Z.; Paul, R.; Tis, T.B.; Saville, A.C.; Hansel, J.C.; Yu, T.; Ristaino, J.B.; Wei, Q. Non-invasive plant disease diagnostics enabled by smartphone-based fingerprinting of leaf volatiles. Nat. Plants 2019, 5, 856–866. [Google Scholar] [CrossRef] [PubMed]
  3. Holopainen, J.K.; Gershenzon, J. Multiple stress factors and the emission of plant VOCs. Trends Plant Sci. 2010, 15, 176–184. [Google Scholar] [CrossRef] [PubMed]
  4. Loreto, F.; Schnitzler, J.-P. Abiotic stresses and induced BVOCs. Trends Plant Sci. 2010, 15, 154–166. [Google Scholar] [CrossRef] [PubMed]
  5. Noe, S.M.; Hueve, K.; Niinemets, U.; Copolovici, L. Seasonal variation in vertical volatile compounds air concentrations within a remote hemiboreal mixed forest. Atmos. Chem. Phys. 2012, 12, 3909–3926. [Google Scholar] [CrossRef] [Green Version]
  6. Penuelas, J.; Sardans, J.; Filella, I.; Estiarte, M.; Llusia, J.; Ogaya, R.; Carnicer, J.; Bartrons, M.; Rivas-Ubach, A.; Grau, O.; et al. Impacts of global change on mediterranean forests and their services. Forests 2017, 8, 463. [Google Scholar] [CrossRef] [Green Version]
  7. Simpraga, M.; Ghimire, R.P.; Van Der Straeten, D.; Blande, J.D.; Kasurinen, A.; Sorvari, J.; Holopainen, T.; Adriaenssens, S.; Holopainen, J.K.; Kivimaenpaa, M. Unravelling the functions of biogenic volatiles in boreal and temperate forest ecosystems. Eur. J. For. Res. 2019, 138, 763–787. [Google Scholar] [CrossRef] [Green Version]
  8. Taipale, D.; Aalto, J.; Schiestl-Aalto, P.; Kulmala, M.; Bäck, J. Emissions of monoterpenes from new Scots pine foliage: Dependency on season, stand age and location and importance for models. Biogeosciences Discuss 2020. Available online: https://www.biogeosciences-discuss.net/bg-2019-502 (accessed on 24 April 2020). [CrossRef]
  9. Niinemets, U.; Kännaste, A.; Copolovici, L. Quantitative patterns between plant volatile emissions induced by biotic stresses and the degree of damage. Front Plant Sci. 2013, 4, 262. [Google Scholar] [CrossRef] [Green Version]
  10. Joutsensaari, J.; Yli-Pirilä, P.; Korhonen, H.; Arola, A.; Blande, J.D.; Heijari, J.; Kivimäenpää, M.; Mikkonen, S.; Hao, L.; Miettinen, P.; et al. Biotic stress accelerates formation of climate-relevant aerosols in boreal forests. Atmos. Chem. Phys. 2015, 15, 12139–12157. [Google Scholar] [CrossRef] [Green Version]
  11. Faiola, C.L.; Buchholz, A.; Kari, E.; Yli-Pirilä, P.; Holopainen, J.K.; Kivimäenpää, M.; Miettinen, P.; Worsnop, D.R.; Lehtinen, K.E.J.; Guenther, A.B.; et al. Terpene composition complexity controls secondary organic aerosol yields from scots pine volatile emissions. Sci. Rep. 2018, 8, 3053. [Google Scholar] [CrossRef] [PubMed] [Green Version]
  12. Faiola, C.L.; Pullinen, I.; Buchholz, A.; Khalaj, F.; Ylisirniö, A.; Kari, E.; Miettinen, P.; Holopainen, J.K.; Kivimäenpää, M.; Schobesberger, S.; et al. Secondary organic aerosol formation from healthy and aphid-stressed scots pine emissions. ACS Earth Space Chem. 2019, 3, 1756–1772. [Google Scholar] [CrossRef] [PubMed] [Green Version]
  13. Faiola, C.; Taipale, D. Impact of insect herbivory on plant stress volatile emissions from trees: A synthesis of quantitative measurements and recommendations for future research. Atmos. Environ X 2020, 5, 100060. [Google Scholar] [CrossRef]
  14. Zhao, D.F.; Buchholz, A.; Tillmann, R.; Kleist, E.; Wu, C.; Rubach, F.; Kiendler-Scharr, A.; Rudich, Y.; Wildt, J.; Mentel, T.F. Environmental conditions regulate the impact of plants on cloud formation. Nat. Commun. 2017, 8, 14067. [Google Scholar] [CrossRef] [Green Version]
  15. Tholl, D.; Boland, W.; Hansel, A.; Loreto, F.; Röse, U.S.R.; Schnitzler, J.-P. Practical approaches to plant volatile analysis. Plant J. 2006, 45, 540–560. [Google Scholar] [CrossRef]
  16. Chang, C.; Wang, J.; Chang, C.; Liang, M.; Lin, M. Development of a multicopter-carried whole air sampling apparatus and its applications in environmental studies. Chemosphere 2016, 144, 484–492. [Google Scholar] [CrossRef] [Green Version]
  17. McKinney, K.A.; Wang, D.; Ye, J.; de Fouchier, J.; Guimaraes, P.C.; Batista, C.E.; Souza, R.A.F.; Alves, E.G.; Gu, D.; Guenther, A.B.; et al. A sampler for atmospheric volatile organic compounds by copter unmanned aerial vehicles. Atmos. Meas. Tech. 2019, 12, 3123–3135. [Google Scholar] [CrossRef] [Green Version]
  18. Kefauver, S.C.; Filella, I.; Penuelas, J. Remote sensing of atmospheric biogenic volatile organic compounds (BVOCs) via satellite-based formaldehyde vertical column assessments. Int. J. Remote Sens. 2014, 35, 7519–7542. [Google Scholar] [CrossRef]
  19. Maja, M.M.; Kasurinen, A.; Yli-Pirilä, P.; Joutsensaari, J.; Klemola, T.; Holopainen, T.; Holopainen, J.K. Contrasting responses of silver birch VOC emissions to short- and long-term herbivory. Tree Physiol. 2014, 34, 241–252. [Google Scholar] [CrossRef] [Green Version]
  20. Bishop, J.A. Bumble Bees (Bombus hypnorum) Collect Aphid Honeydew on Stone Pine (Pinus pumila) in the Russian Far-East. J. Kans. Entomol. Soc. 1994, 67, 220–222. [Google Scholar]
  21. Stadler, B.; Michalzik, B. Aphid infested Norway spruce are "hot spots" in throughfall carbon chemistry in coniferous forests. Can. J. For. Res. 1998, 28, 1717–1722. [Google Scholar] [CrossRef]
  22. Stadler, B.; Dixon, A. Ecology and evolution of aphid-ant interactions. Annu. Rev. Ecol. Evol. Syst. 2005, 36, 345–372. [Google Scholar] [CrossRef]
  23. Durak, R.; Wegrzyn, E.; Leniowski, K. When a little means a lot—Slight daily cleaning is crucial for obligatory ant-tended aphids. Ethol. Ecol. Evol. 2016, 28, 20–29. [Google Scholar] [CrossRef]
  24. Wenninger, A.; Hollingsworth, T.; Wagner, D. Predatory hymenopteran assemblages in boreal Alaska: Associations with forest composition and post-fire succession. Ecoscience 2019, 26, 205–220. [Google Scholar] [CrossRef]
  25. Holopainen, J.K.; Blande, J.D.; Sorvari, J. Functional role of extrafloral nectar in boreal forest ecosystems under climate change. Forests 2020, 11, 67. [Google Scholar] [CrossRef] [Green Version]
  26. Warrington, S. Relationship between SO2 dose and growth of the pea aphid, Acyrthosiphon Pisum, on peas. Environ. Pollut. 1987, 43, 155–162. [Google Scholar] [CrossRef]
  27. Bolsinger, M.; Flückiger, W. Ambient air pollution induced changes in amino acid pattern of phloem sap in host plants—Relevance to aphid infestation. Environ. Pollut. 1989, 56, 209–216. [Google Scholar] [CrossRef]
  28. Warrington, S.; Whittaker, J.B. Interactions between Sitka Spruce, the green spruce aphid, sulfur dioxide pollution and drought. Environ. Pollut. 1990, 65, 363–370. [Google Scholar] [CrossRef]
  29. Holopainen, J.K.; Kainulainen, P.; Oksanen, J. Effects of gaseous air pollutants on aphid performance on Scots pine and Norway spruce seedlings. Water Air Soil Pollut. 1995, 85, 1431–1436. [Google Scholar] [CrossRef]
  30. Holopainen, J.K.; Semiz, G.; Blande, J.D. Life-history strategies affect aphid preference for yellowing leaves. Biol. Lett. 2009, 5, 603–605. [Google Scholar] [CrossRef] [Green Version]
  31. Beetge, L.; Kruger, K. Drought and heat waves associated with climate change affect performance of the potato aphid Macrosiphum euphorbiae. Sci. Rep. 2019, 9, 3645. [Google Scholar] [CrossRef] [PubMed] [Green Version]
  32. Ye, J.; Jiang, Y.; Veromann-Jurgenson, L.; Niinemets, U. Petiole gall aphid (Pemphigus spyrothecae) infestation of Populus x petrovskiana leaves alters foliage photosynthetic characteristics and leads to enhanced emissions of both constitutive and stress-induced volatiles. Trees 2019, 33, 37–51. [Google Scholar] [CrossRef] [PubMed]
  33. Day, K.R.; Ayres, M.P.; Harrington, R.; Kidd, N.A.C. Interannual dynamics of aerial and arboreal green spruce aphid populations. Popul. Ecol. 2010, 52, 317–327. [Google Scholar] [CrossRef]
  34. Banfield-Zanin, J.A.; Leather, S.R. Frequency and intensity of drought stress alters the population size and dynamics of Elatobium abietinum on Sitka spruce. Ann. Appl. Biol. 2014, 165, 260–269. [Google Scholar] [CrossRef]
  35. Straw, N.A.; Green, G. Interactions between green spruce aphid (Elatobium abietinum (Walker)) and Norway and Sitka spruce under high and low nutrient conditions. Agric. For. Entomol. 2001, 3, 263–274. [Google Scholar] [CrossRef]
  36. Kilpeläinen, J.; Finer, L.; Neuvonen, S.; Niemelä, P.; Domisch, T.; Risch, A.C.; Jurgensen, M.F.; Ohashi, M.; Sundström, L. Does the mutualism between wood ants (Formica rufa group) and Cinara aphids affect Norway spruce growth? For. Ecol. Manag. 2009, 257, 238–243. [Google Scholar] [CrossRef]
  37. Kasal-Slavik, T.; Eschweiler, J.; Kleist, E.; Mumm, R.; Goldbach, H.E.; Schouten, A.; Wildt, J. Early biotic stress detection in tomato (Solanum lycopersicum) by BVOC emissions. Phytochemistry 2017, 144, 180–188. [Google Scholar] [CrossRef]
  38. Agelopoulos, N.; Birkett, M.A.; Hick, A.J.; Hooper, A.M.; Pickett, J.A.; Pow, E.M.; Smart, L.E.; Smiley, D.; Wadhams, L.J.; Woodcock, C.M. Exploiting semiochemicals in insect control. Pestic. Sci. 1999, 55, 225–235. [Google Scholar] [CrossRef]
  39. Catola, S.; Centritto, M.; Cascone, P.; Ranieri, A.; Loreto, F.; Calamai, L.; Balestrini, R.; Guerrieri, E. Effects of single or combined water deficit and aphid attack on tomato volatile organic compound (VOC) emission and plant-plant communication. Environ. Exp. Bot. 2018, 153, 54–62. [Google Scholar] [CrossRef]
  40. Xu, Q.; Hatt, S.; Han, Z.; Francis, F.; Chen, J. Combining E-β-farnesene and methyl salicylate release with wheat-pea intercropping enhances biological control of aphids in North China. Biocontrol. Sci. Technol. 2018, 28, 883–894. [Google Scholar] [CrossRef]
  41. Mauck, K.E.; De Moraes, C.M.; Mescher, M.C. Deceptive chemical signals induced by a plant virus attract insect vectors to inferior hosts. Proc. Natl. Acad. Sci. USA 2010, 107, 3600–3605. [Google Scholar] [CrossRef] [PubMed] [Green Version]
  42. Carr, J.P.; Tungadi, T.; Donnelly, R.; Bravo-Cazar, A.; Rhee, S.; Watt, L.G.; Mutuku, J.M.; Wamonje, F.O.; Murphy, A.M.; Arinaitwe, W.; et al. Modelling and manipulation of aphid-mediated spread of non-persistently transmitted viruses. Virus Res. 2020, 277, 197845. [Google Scholar] [CrossRef] [PubMed]
  43. Blande, J.D.; Korjus, M.; Holopainen, J.K. Foliar methyl salicylate emissions indicate prolonged aphid infestation on silver birch and black alder. Tree Physiol. 2010, 30, 404–416. [Google Scholar] [CrossRef] [PubMed]
  44. Staudt, M.; Jackson, B.; El-Aouni, H.; Buatois, B.; Lacroze, J.; Poessel, J.; Sauge, M. Volatile organic compound emissions induced by the aphid Myzus persicae differ among resistant and susceptible peach cultivars and a wild relative. Tree Physiol. 2010, 30, 1320–1334. [Google Scholar] [CrossRef] [PubMed] [Green Version]
  45. Joo, E.; Van Langenhove, H.; Simpraga, M.; Steppe, K.; Amelynck, C.; Schoon, N.; Muller, J.-F.; Dewulf, J. Variation in biogenic volatile organic compound emission pattern of Fagus sylvatica L. due to aphid infection. Atmos. Environ. 2010, 44, 227–234. [Google Scholar] [CrossRef]
  46. Mentel, T.F.; Kleist, E.; Andres, S.; Dal Maso, M.; Hohaus, T.; Kiendler-Scharr, A.; Rudich, Y.; Springer, M.; Tillmann, R.; Uerlings, R.; et al. Secondary aerosol formation from stress-induced biogenic emissions and possible climate feedbacks. Atmos. Chem. Phys. 2013, 13, 8755–8770. [Google Scholar] [CrossRef] [Green Version]
  47. Bergström, R.; Hallquist, M.; Simpson, D.; Wildt, J.; Mentel, T.F. Biotic stress: A significant contributor to organic aerosol in Europe? Atmos. Chem. Phys. 2014, 14, 13643–13660. [Google Scholar] [CrossRef] [Green Version]
  48. Pezet, J.; Elkinton, J.; Gomez, S.; Mckenzie, E.A.; Lavine, M.; Preisser, E. Hemlock woolly adelgid and elongate hemlock scale induce changes in foliar and twig volatiles of eastern hemlock. J. Chem. Ecol. 2013, 39, 1090–1100. [Google Scholar] [CrossRef] [Green Version]
  49. Heie, O.E. The Aphidoidea (Hemiptera) of Fennoscandia and Denmark. VI: Family Aphididae: Part 3 of Tribe Macrosiphini of Subfamily Aphidinae, and Family Lachnidae. Fauna Entomol Scand 31; E.J. Brill: Leiden, The Netherlands, 1995; pp. 148–149. [Google Scholar]
  50. Manninen, A.M.; Holopainen, T.; Lyytikäinen-Saarenmaa, P.; Holopainen, J.K. The role of low-level ozone exposure and mycorrhizas in chemical quality and insect herbivore performance on Scots pine seedlings. Glob. Chang. Biol. 2000, 6, 111–121. [Google Scholar] [CrossRef]
  51. Volkl, W. Foraging behaviour and sequential multisensory orientation in the aphid parasitoid, Pauesia picta (Hym., Aphidiidae) at different spatial scales. J. Appl. Entomol. 2000, 124, 307–314. [Google Scholar] [CrossRef]
  52. Domisch, T.; Finer, L.; Neuvonen, S.; Niemelä, P.; Risch, A.C.; Kilpeläinen, J.; Ohashi, M.; Jurgensen, M.F. Foraging activity and dietary spectrum of wood ants (Formica rufa group) and their role in nutrient fluxes in boreal forests. Ecol. Entomol. 2009, 34, 369–377. [Google Scholar] [CrossRef]
  53. Baradat, P.; Yazdani, R. Genetic expression for monoterpenes in clones of Pinus sylvestris grown on different sites. Scan. J. For. Res. 1988, 3, 25–36. [Google Scholar] [CrossRef]
  54. Kivimäenpää, M.; Markkanen, J.M.; Ghimire, R.P.; Holopainen, T.; Vuorinen, M.; Holopainen, J.K. Scots pine provenance affect the emission rate and chemical composition of volatile organic compounds of forest floor. Can. J. For. Res. 2018, 48, 1373–1381. [Google Scholar] [CrossRef]
  55. Flower-Ellis, J.; Olsson, L. Estimation of volume, total and projected area of Scots pine needles from their regression on length. Studia For. Suec. 1993, 190, 1–19. [Google Scholar]
  56. Kivimäenpää, M.; Ghimire, R.P.; Sutinen, S.; Häikiö, E.; Kasurinen, A.; Holopainen, T.; Holopainen, J.K. Increases in volatile organic compound emissions of Scots pine in response to elevated ozone and warming are modified by herbivory and soil nitrogen availability. Eur. J. For. Res. 2016, 135, 343–360. [Google Scholar] [CrossRef]
  57. Kivimäenpää, M.; Magsarjav, N.; Ghimire, R.; Markkanen, J.; Heijari, J.; Vuorinen, M.; Holopainen, J.K. Influence of tree provenance on biogenic VOC emissions of Scots pine (Pinus sylvestris) stumps. Atmos. Environ. 2012, 60, 477–485. [Google Scholar] [CrossRef]
  58. Ghimire, R.P.; Markkanen, J.M.; Kivimäenpää, M.; Lyytikäinen-Saarenmaa, P.; Holopainen, J.K. Needle removal by sawfly larvae increases branch-level VOC emissions and reduces below-ground emissions of Scots pine. Environ. Sci. Technol. 2013, 47, 4325–4332. [Google Scholar] [CrossRef]
  59. Pettersson, M.; Unelius, C.R.; Valterova, I.; Borg-Karlson, A. Semiochemicals related to the aphid Cinara pilicornis and its host, Picea abies: A method to assign nepetalactone diastereomers. J. Chromatogr. A 2008, 1180, 165–170. [Google Scholar] [CrossRef]
  60. Vlot, A.C.; Dempsey, D.A.; Klessig, D.F. Salicylic acid, a multifaceted hormone to combat disease. Annu. Rev. Phytopathol. 2009, 47, 177–206. [Google Scholar] [CrossRef] [Green Version]
  61. Li, J.; Hu, H.; Mao, J.; Yu, L.; Stoopen, G.; Wang, M.; Mumm, R.; de Ruijter, N.C.A.; Dicke, M.; Jongsma, M.A.; et al. Defense of pyrethrum flowers: Repelling herbivores and recruiting carnivores by producing aphid alarm pheromone. New Phytol. 2019, 223, 1607–1620. [Google Scholar] [CrossRef]
  62. Mukrimin, M.; Kovalchuk, A.; Ghimire, R.P.; Kivimäenpää, M.; Sun, H.; Holopainen, J.K.; Asiegbu, F.O. Evaluation of potential genetic and chemical markers for Scots pine tolerance against Heterobasidion annosum infection. Planta 2019, 250, 1881–1895. [Google Scholar] [CrossRef] [PubMed] [Green Version]
  63. Wang, W.; Dai, H.; Zhang, Y.; Chandrasekar, R.; Luo, L.; Hiromasa, Y.; Sheng, C.; Peng, G.; Chen, S.; Tomich, J.M.; et al. Armet is an effector protein mediating aphid-plant interactions. FASEB J. 2015, 29, 2032–2045. [Google Scholar] [CrossRef] [PubMed]
  64. Cui, N.; Lu, H.; Wang, T.; Zhang, W.; Kang, L.; Cui, F. Armet, an aphis effector protein, induces pathogen resistance in plants by promoting the eaccumulation of salicylic acid. Philos. Trans. R Soc. Lond B Biol. Sci. 2019, 374, 1767. [Google Scholar] [CrossRef]
  65. van Bel, A.J.E.; Will, T. Functional Evaluation of Proteins in Watery and Gel Saliva of Aphids. Front Plant Sci. 2016, 7, 1840. [Google Scholar] [CrossRef] [Green Version]
  66. van Bel, A.J.E.; Furch, A.C.U.; Will, T.; Buxa, S.V.; Musetti, R.; Hafke, J.B. Spread the news: Systemic dissemination and local impact of Ca2+ signals along the phloem pathway. J. Exp. Bot. 2014, 65, 1761–1787. [Google Scholar] [CrossRef]
  67. Mäntylä, E.; Kleier, S.; Lindstedt, C.; Kipper, S.; Hilker, M. Insectivorous birds are attracted by plant traits induced by insect egg deposition. J. Chem. Ecol. 2018, 44, 1127–1138. [Google Scholar] [CrossRef]
  68. Heijari, J.; Blande, J.D.; Holopainen, J.K. Feeding of large pine weevil on Scots pine stem triggers localized bark and systemic shoot emission of volatile organic compounds. Environ. Exp. Bot. 2011, 71, 390–398. [Google Scholar] [CrossRef]
  69. Tieman, D.; Zeigler, M.; Schmelz, E.; Taylor, M.G.; Rushing, S.; Jones, J.B.; Klee, H.J. Functional analysis of a tomato salicylic acid methyl transferase and its role in synthesis of the flavor volatile methyl salicylate. Plant J. 2010, 62, 113–123. [Google Scholar] [CrossRef]
  70. Mäntylä, E.; Kleier, S.; Kipper, S.; Hilker, M. The attraction of insectivorous tit species to herbivore-damaged Scots pines. J. Ornithol. 2017, 158, 479–491. [Google Scholar] [CrossRef]
  71. Kovalchuk, A.; Raffaello, T.; Jaber, E.; Kerio, S.; Ghimire, R.; Lorenz, W.W.; Dean, J.F.D.; Holopainen, J.K.; Asiegbu, F.O. Activation of defence pathways in Scots pine bark after feeding by pine weevil (Hylobius abietis). BMC Genom. 2015, 16, 352. [Google Scholar] [CrossRef] [Green Version]
  72. Kännaste, A.; Nordenhem, H.; Nordlander, G.; Borg-Karlson, A. Volatiles from a mite-infested spruce clone and their effects on pine weevil behavior. J. Chem. Ecol. 2009, 35, 1262–1271. [Google Scholar] [CrossRef] [PubMed]
  73. Ament, K.; Kant, M.R.; Sabelis, M.W.; Haring, M.A.; Schuurink, R.C. Jasmonic acid is a key regulator of spider mite-induced volatile terpenoid and methyl salicylate emission in tomato. Plant Physiol. 2004, 135, 2025–2037. [Google Scholar] [CrossRef] [PubMed] [Green Version]
  74. Schwartzberg, E.G.; Kunert, G.; Stephan, C.; David, A.; Rose, U.S.R.; Gershenzon, J.; Boland, W.; Weisser, W.W. Real-time analysis of alarm pheromone emission by the pea aphid (Acyrthosiphon Pisum) under predation. J. Chem. Ecol. 2008, 34, 76–81. [Google Scholar] [CrossRef] [Green Version]
  75. Kunert, G.; Reinhold, C.; Gershenzon, J. Constitutive emission of the aphid alarm pheromone, (E)-β-farnesene, from plants does not serve as a direct defense against aphids. BMC Ecol. 2010, 10, 23. [Google Scholar] [CrossRef] [PubMed] [Green Version]
  76. Nikolić, B.; Ristić, M.; Bojović, S.; Marin, P. Variability of the needle essential oils of pinus peuce from different populations in Montenegro and Serbia. Chem. Biodivers. 2008, 5, 1377–1388. [Google Scholar] [CrossRef] [PubMed]
  77. Mofikoya, A.O.; Bui, T.N.T.; Kivimäenpää, M.; Holopainen, J.K.; Himanen, S.J.; Blande, J.D. Foliar behaviour of biogenic semi-volatiles: Potential applications in sustainable pest management. Arthropod Plant Interact. 2019, 13, 193–212. [Google Scholar] [CrossRef] [Green Version]
  78. Goelen, T.; Sobhy, I.S.; Vanderaa, C.; de Boer, J.G.; Delvigne, F.; Francis, F.; Wackers, F.; Rediers, H.; Verstrepen, K.J.; Wenseleers, T.; et al. Volatiles of bacteria associated with parasitoid habitats elicit distinct olfactory responses in an aphid parasitoid and its hyperparasitoid. Funct. Ecol. 2020, 34, 507–520. [Google Scholar] [CrossRef]
  79. Chen, L.; Wang, W.; Wang, T.; Meng, X.; Chen, T.; Huang, X.; Li, Y.; Hou, B. Methyl salicylate glucosylation regulates plant defense signaling and systemic acquired resistance. Plant Physiol. 2019, 180, 2167–2181. [Google Scholar] [CrossRef]
  80. Zhu, J.W.; Park, K.C. Methyl salicylate, a soybean aphid-induced plant volatile attractive to the predator Coccinella septempunctata. J. Chem. Ecol. 2005, 31, 1733–1746. [Google Scholar] [CrossRef]
  81. Mumm, R.; Dicke, M. Variation in natural plant products and the attraction of bodyguards involved in indirect plant defense. Can. J. Zool. 2010, 88, 628–667. [Google Scholar] [CrossRef]
Figure 1. Aphid nymphs and adults (mean ± SE) counted on infested and uninfested branches during 2015 (Experiment 1).
Forests 11 00573 g001
Figure 2. Emission rates (mean ± SE) of (a) methylsalicylate, (b) borneol, (c) (E,E)-α-farnesene, (d) β-elemene, (e) β-caryophyllene and (f) δ-cadinene from Scots pine branch tips before and after aphid infestation in Experiment 1. Day 0 refers to aphid infestation. Stars indicate significant (P < 0.05) differences between control (n = 6) and aphid-infested (n = 6) saplings.
Forests 11 00573 g002
Figure 3. Relationship between the emission rate of methyl salicylate and the number of living aphids. (a) Daily average for aphid number and methyl salicylate emissions per needle area; the dots are different days from infestation in Experiment 1; (b) Aphid number and methyl salicylate emissions per shoot length; the dots represent individual saplings analysed 5 weeks after infestation in Experiment 2. r is the Spearman correlation coefficient and * refers to statistical significance (P < 0.05).
Forests 11 00573 g003
Table 1. Mean (SE) biogenic volatile organic compounds (BVOC) emission rates (ng cm−1 shoot length h−1) of uninfested and aphid-infested Scots pine branches 5 weeks after aphid infestation in 2016 (Experiment 2). Emboldened values indicate significant (*P < 0.05, **P < 0.01, a t-test or b Mann–Whitney test) differences between the treatments.
CompoundControl (n = 4)Aphid-Infested (n = 8)
Monoterpenes, MT
Tricyclene2.6 (1.0)3.2 (1.0)
α-Thujene0.6 (0.4)1.0 (0.5)
α-Pinene211.6 (73.0)269.9 (89.8)
Camphene21.5 (5.6)35.1 (9.4)
Sabinene14.9 (2.4)18.0 (7.7)
β-Pinene29.8 (17.7)54.1 (20.0)
Myrcene47.3 (20.7)231.5 (184.7)
α-Phellandrene0.8 (0.6)2.3 (1.7)
Δ-3-Carene245.9 (78.2)114.0 (71.2)
α-Terpinene2.2 (0.5)1.8 (0.9)
p-Cymene2.3 (0.3)1.5 (0.8)
Limonene61.8 (24.5)306.1 (197.0)
β-Phellandrene58.3 (26.4)269.5 (201.3)
1,8-Cineole16.9 (6.2)18.9 (8.8)
(E)-β-Ocimene4.4 (0.7)3.6 (1.8)
γ-Terpinene3.1 (0.5)2.5 (1.3)
Terpinolene13.2 (4.3)10.0 (4.6)
Linalool0.5 (0.5)1.6 (1.0)
Camphor2.7 (0.9)1.8 (0.6)
Bornyl acetate1.2 (0.6)3.5 (1.9)
Sesquiterpenes, SQT
β-Bourbobene0.7 (0.4)2.8 (2.3)
Longifolene2.2 (1.0)1.3 (0.4)
β-Caryophyllene1.0 (0.8)2.5 (1.4)
(E)-β-Farnesene3.9 (1.9)a15.7 (3.6) *
α-Farnesene6.1 (1.7)a51.6 (10.5) **
unknown ST10.2 (0.2)4.7 (3.1)
(E,E)-α-Farnesene11.8 (3.5)a111.7 (29.8) **
unknown ST21.7 (0.5)4.9 (1.9)
γ-Cadinene0.7 (0.3)1.0 (0.4)
δ-Cadinene1.4 (0.7)3.4 (1.2)
cis-α-Bisabolene0.2 (0.2)1.0 (0.7)
Green leaf volatiles, GLV
cis-3-Hexenyl-acetate2.5 (1.5)1.6 (1.0)
Benzenoids
Methyl benzoate0 (0)3.2 (1.4)
Benzyl acetate0 (0)1.0 (0.7)
Ethyl benzoate0 (0)3.4 (2.4)
Methyl salicylate7.7 (3.6)b 578.5 (118.5) **
Thymol methyl ether0.2 (0.2)0.9 (0.8)
Anethole0 (0)2.3 (1.1)
trans-Anethole0 (0)3.1 (1.3)
Total emissions
MTs743.9 (187.3)1351.4 (665.4)
SQTs29.6 (7.5)a 202.0 (41.7) **
GLVs2.5 (1.5)2.4 (1.8)
Benzenoids7.9 (3.6)a 592.3 (122.4) **
Compounds for each group are shown in order of increasing retention time. Compounds emitted ≤ 2 saplings: green leaf volatiles (GLV), 1-hexyl-acetate; monoterpenes (MTs), pinocarvone, borneol, 4-terpineol and three unknown compounds; and sesquiterpenes (SQTs), α-copaene, α-humulene and four unknown compounds. These compounds were not affected by aphid infestation and are included in the total GLVs, MTs and SQTs.

