Article

High Recovery of Saplings after Severe Drought in Temperate Deciduous Forests

by
Mirela Beloiu
1,*,
Reinhold Stahlmann
1 and
Carl Beierkuhnlein
1,2,3
1
Department of Biogeography, University of Bayreuth, Universitätsstraße 30, 95447 Bayreuth, Germany
2
GIB Department of Geography, University of Bayreuth, 95447 Bayreuth, Germany
3
BayCEER Bayreuth Center of Ecology and Environmental Research, University of Bayreuth, 95448 Bayreuth, Germany
*
Author to whom correspondence should be addressed.
Forests 2020, 11(5), 546; https://doi.org/10.3390/f11050546
Submission received: 6 April 2020 / Revised: 8 May 2020 / Accepted: 11 May 2020 / Published: 13 May 2020
(This article belongs to the Section Forest Ecology and Management)

Abstract

:
Drought episodes are predicted to increase their intensity and frequency globally, which will have a particular impact on forest vitality, productivity, and species distribution. However, the impact of tree species interaction on forest vulnerability to drought is not yet clear. This study aims to assess how deciduous saplings react to drought and whether tree species diversity can buffer the impact of drought stress on tree saplings. Based on field measurements of crown defoliation and species diversity, vulnerability, drought recovery, and species interaction were analyzed. Fieldwork was carried out in Central Eastern Germany in 2018 during the vegetation season and repeated in 2019. Ten random saplings were measured in each of the 218 plots (15 × 15 m) with 2051 saplings in total out of 41 tree species. We found that 65% of the saplings experienced defoliation during the drought of 2018, of which up to 13% showed complete defoliation. At the species level, Fagus sylvatica L. and Betula pendula Roth. saplings were less affected (<55%), whereas Carpinus betulus L., Sorbus aucuparia L., and Frangula alnus Mill. saplings were the most affected (≥85%). One year later, in 2019, C. betulus and S. aucuparia had a faster recovery rate than F. sylvatica, B. pendula, Quercus spp., and Crataegus spp. (p < 0.001). Furthermore, we showed that forest stands with high sapling species diversity had a reduced vitality under drought stress (p < 0.001), indicating a higher competition for resources. The study provides evidence that F. sylvatica saplings can withstand and survive to persistent drought. Species-specific responses to drought are essential to be considered for implementing adaptive forest management strategies to mitigate the impact of climate change.

1. Introduction

Globally, warming results in an increasing frequency, intensity, and duration of heat waves and droughts [1]. More intense, frequent, and longer heat waves and drought periods are expected for this century [2,3]. Central Europe is characterized by a seasonal temperate climate with warm summers. Projections for future climatic classes for Central Europe expect that the Köppen–Geiger Cfb climate (temperate, without dry season, and warm summer) will be partly maintained, but the Cfa climate (temperate, without dry season, and hot summer) will extend at the loss of Dfb climate (cold, without dry season, and warm summer) in eastern Central Europe [4]. This implies that summer drought (precipitation in the driest month in summer <40 mm month−1 and precipitation in the driest month in summer < precipitation in the wettest month in winter/3) is not expected in the long-term average conditions. However, in recent years, occasional summer heat waves with severe periods of drought were observed in Central Europe in 2003 [5,6,7,8] and recently in 2018/19 [9,10]. Equally extreme drought was recorded in Eastern Europe in 2010 [11]. At the end of the 20th century, European summer temperatures had already exceeded the reconstructed temperatures for the last 500 years [12]. The ecological impact of repeated strong periods of drought and heat will even be accelerated [13], particularly in ecosystems that are not adapted to extreme conditions such as the temperate forest [14]. Given that current mature trees have established during a much cooler climate of the 19th century, it is questionable whether the mature forests stands are already adjusted to the current thermal and hydric regime. Frequency and severity of drought and heat stress increase tree mortality globally [15]. Therefore, trends in climate-related physiological stress of mature and sapling trees need to be addressed.
Temperate deciduous forests represent the predominant natural zonal ecosystems with European beech (Fagus sylvatica L.) as a dominating species in major plant communities [16]. European temperate deciduous forest ecosystems are characterized by a very low diversity in tree species compared to other Holarctic regions of the temperate biome (NE America, E Asia). As a consequence of the strong impact of Pleistocene climatic fluctuations in this high latitude combined with dispersal barriers (mountain ridges, Mediterranean Sea), the European tree flora is considered to be depauperate [17]. Therefore, it is crucial to understand the warming and drought impacts on key species such as F. sylvatica. Species-specific negative growth responses to warming were detected for Central European trees with a particular impact on F. sylvatica [18,19]. Less abundant tree European deciduous species were found to be more drought-tolerant than F. sylvatica [20,21]. However, Metz et al. [22] found that drought susceptibility of F. sylvatica is modified by the tree species composition. Obviously, there is an influence of tree species diversity and composition on the responses of tree species to drought [23], but also an effect of drought on the competitive behavior of tree species [24].
Natural regeneration through seed dispersal, germination, and the establishment of cohorts of juvenile trees is the main process for the sustainable development of forests, enhancing local biodiversity and increasing resilience to extreme climatic events [25]. Juvenile trees are protected by the mature tree canopy from heat-related stress as they are not directly exposed to the atmosphere. However, in contrast to mature trees, juveniles only exhibit shallow root systems that do not reach deep into the ground, thus the tolerance of trees to environmental stress is predicted to increase with ontogeny [26]. The root system deepens with age, but water uptake and transpiration rates depend on species and site characteristics [27]. Tree ability to survive, grow, reproduce, and increase longevity under stressful conditions is given by their vitality, which can be used as a stress indicator [28]. An exponential increase in mortality with canopy defoliation has been shown in Europe [29,30]. However, the impact of species diversity on sapling susceptibility to drought and their interaction with mature trees is unclear.
Tree species distribution ranges are reflected in the species’ response to climatic extremes, which can be assessed through common garden experiments (e.g., Muffler et al. [31]). Whilst in Central European deciduous forests, climatic turning points shifting the interspecific competition between species have been modeled [32], however, model projections cannot cover the role of climatic singularities. As a consequence, common garden experiments and models need to be supported by observational studies when such events take place. This study aims to investigate the direct impact of extraordinary summer drought on natural regeneration of deciduous tree saplings in a large area of Central Europe and their potential recovery in the following year. Therefore, the following questions were addressed: (1) How do deciduous saplings react to severe drought? (2) Does tree species diversity buffer the impact of drought stress on tree saplings? To answer these questions, we surveyed the changes in tree vitality brought by the drought of 2018 in a large number of tree sapling species. We focused on the 10 most abundant species that are important for forest productivity, ecological stability, and biodiversity. We also analyzed the effect of species diversity on tree sapling vitality. We hypothesized finding species-specific responses reflecting the ecological niches and distribution ranges of contributing tree species.

2. Materials and Methods
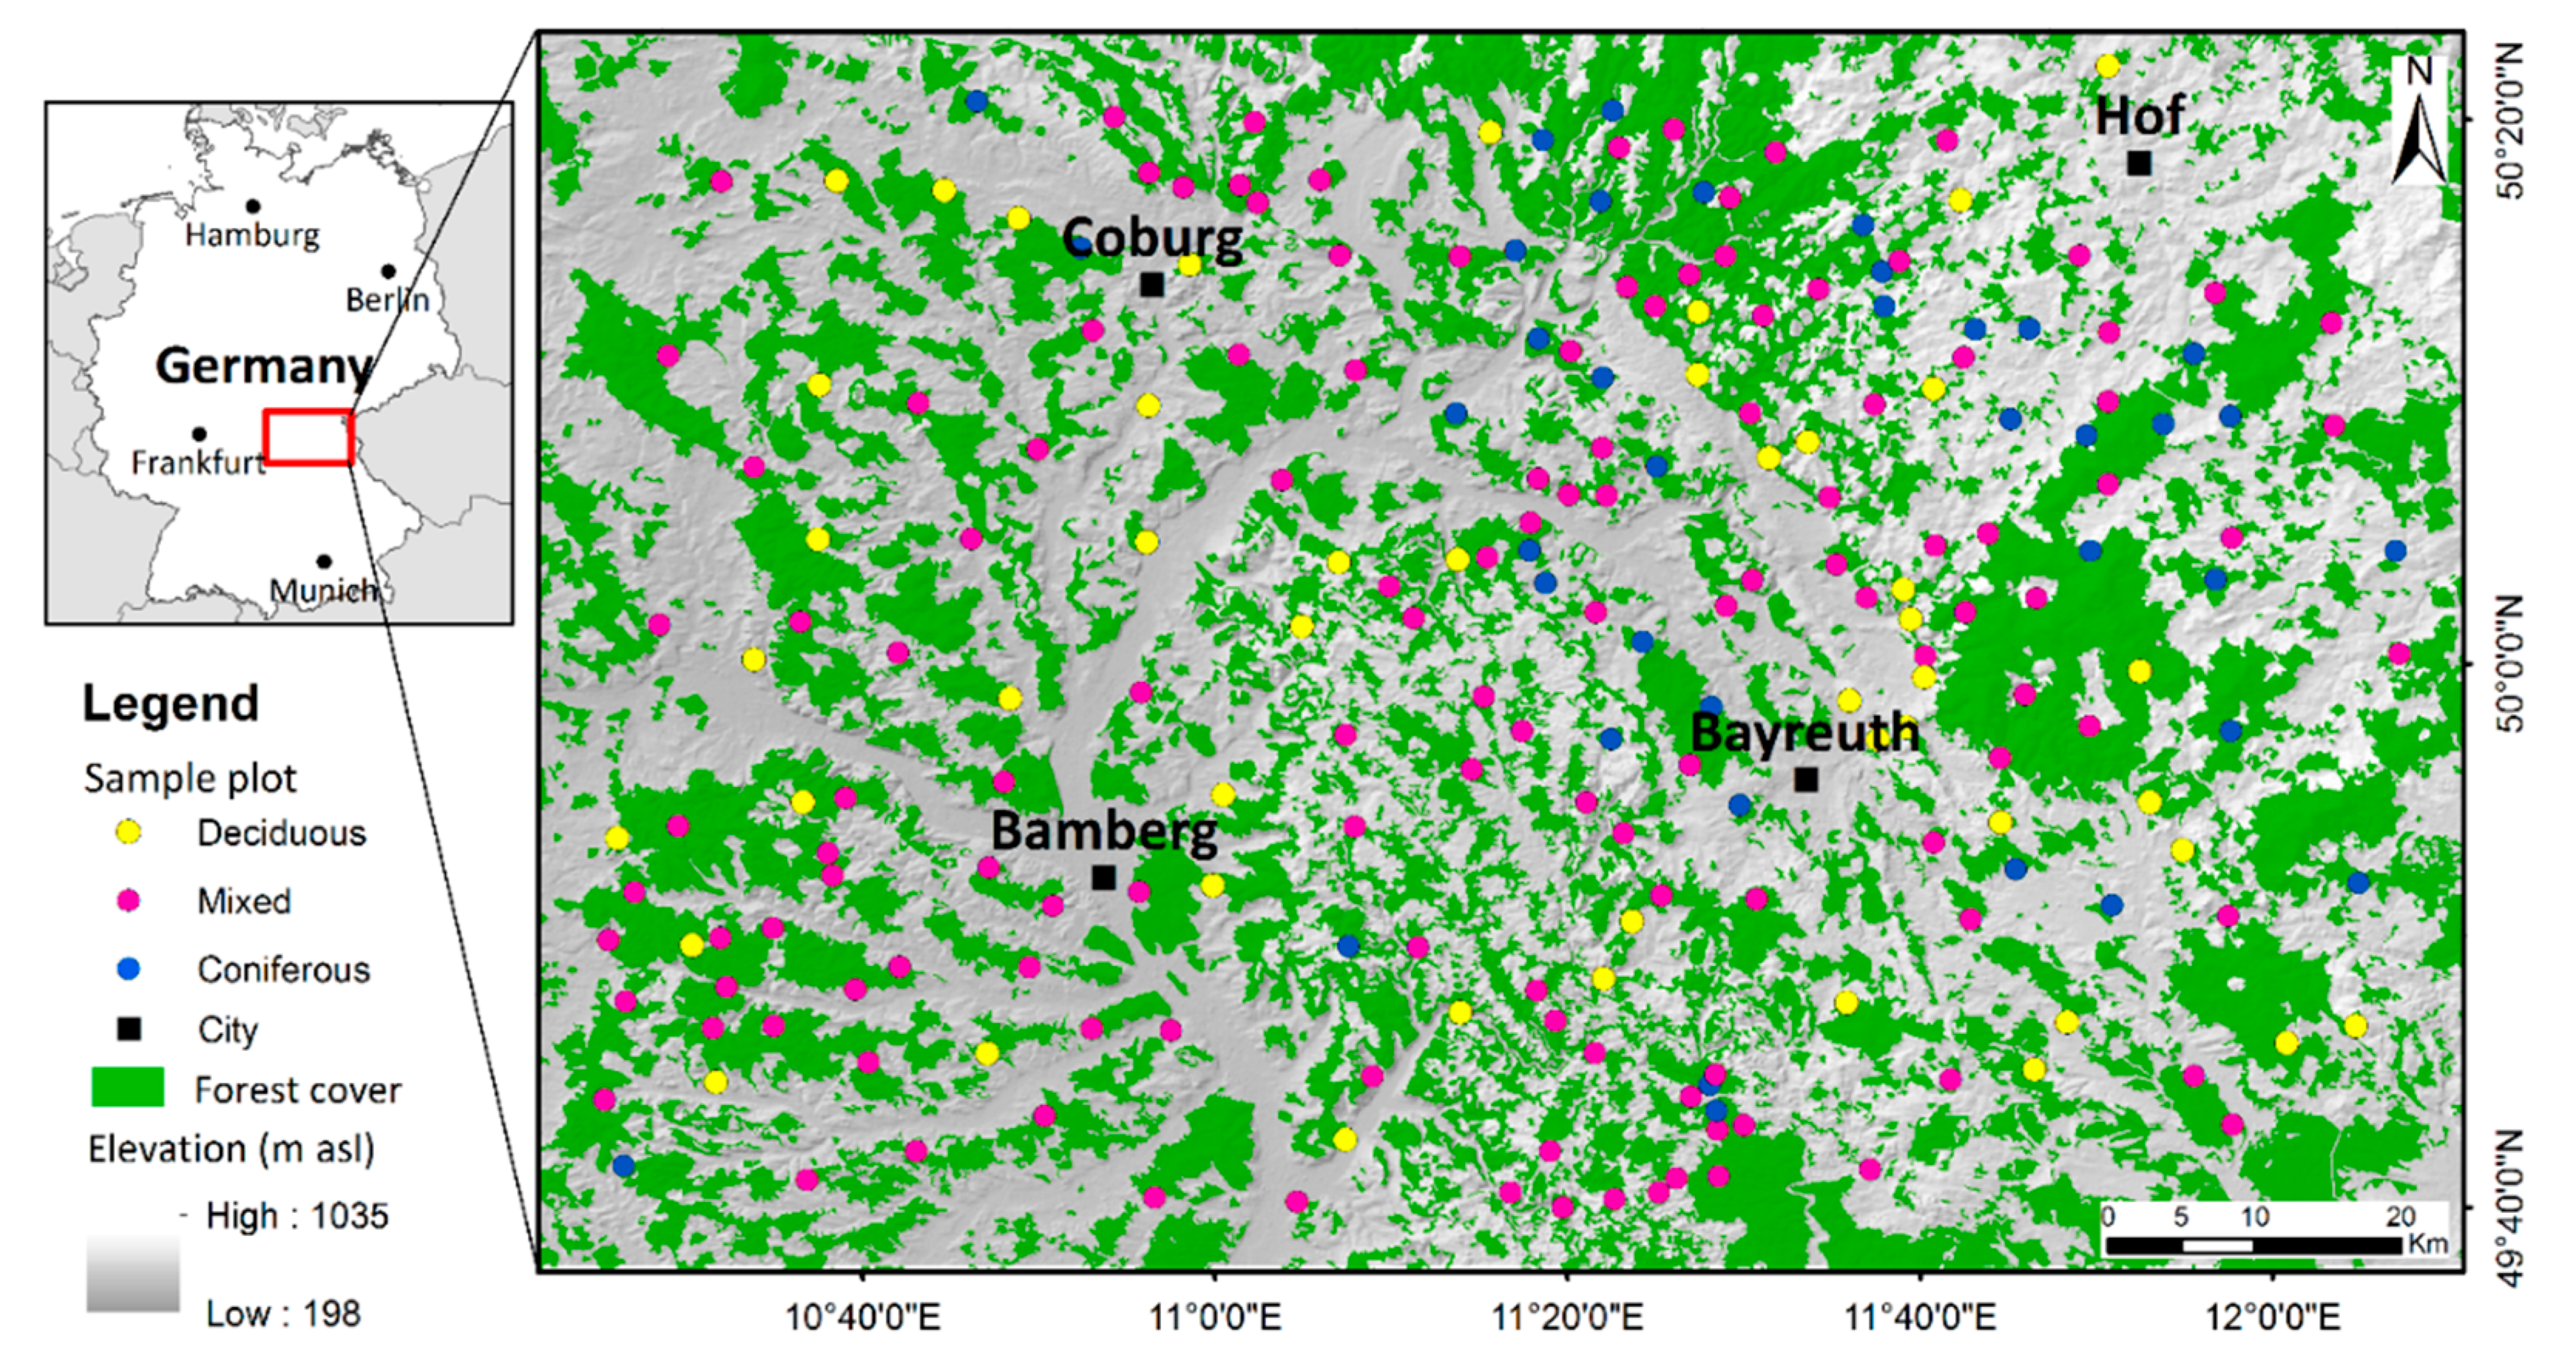
2.1. Study Area

The study area is located in central-eastern Germany (Northern Bavaria) (Figure 1) and is dominated by deciduous, mixed, and coniferous forests. The petrography of the bedrock is very diverse (dominated by limestone, followed by schist and slate) and as a consequence, soils differ considerably with cambisol, podzol, rendzina, histosol, and luvisol as the main soil types (Supplementary Materials 2, Table S1).

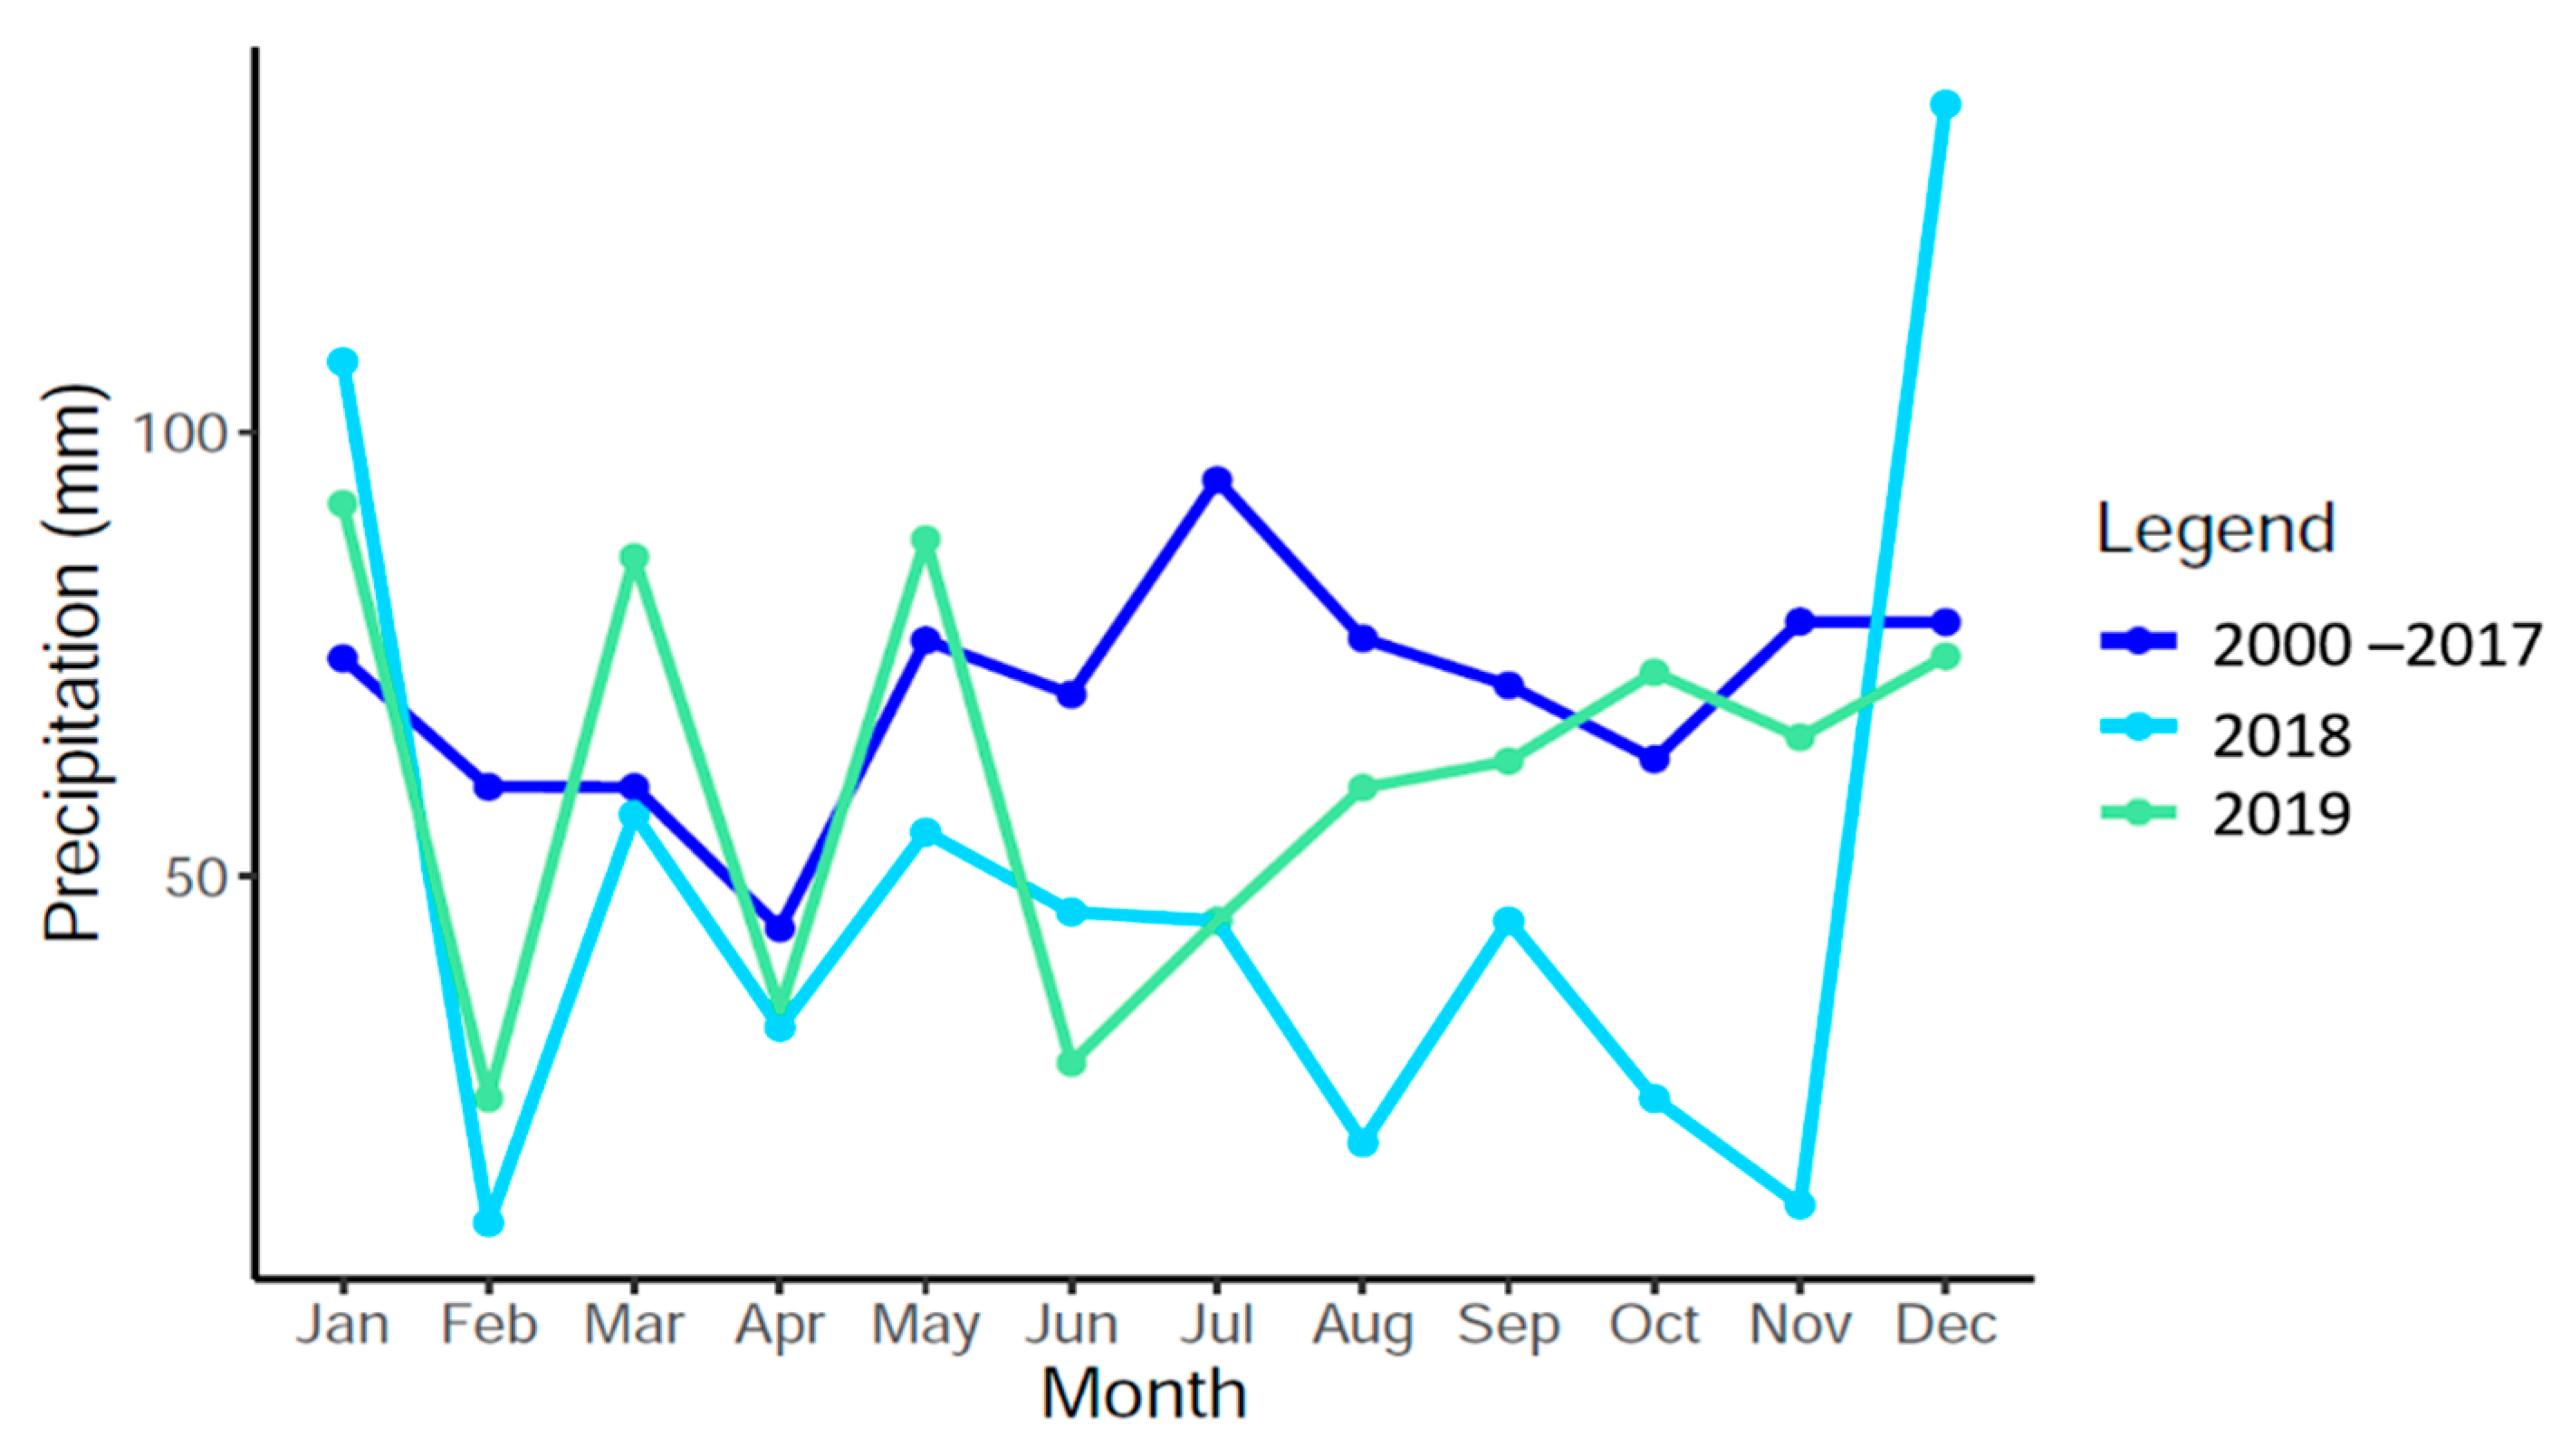
2.2. Environmental Data

Climatic data (temperature, precipitation, and evapotranspiration) were extracted from the raster dataset (1 × 1 km) provided by the German Meteorological Service. Soil type was extracted from the raster dataset (1 × 1 km) of the European Soil Databases (ESDB) version v2.0 [33,34]. Available water capacity (AWC) was extracted from the raster dataset “Topsoil physical properties for Europe (based on Land Use and Coverage Area frame Survey [LUCAS] topsoil data)” [35]. The European digital elevation model (EU-DEM) version 1.1 (25 m) [36] was used. The forest layer was extracted from the digital landscape model 1:250,000 (DLM250) [37].
During the period 1970–2019, the average annual precipitation ranged from 570 to 1344 mm, with a mean of 957 mm (Supplementary Materials 1, Figure S1a), and the average annual temperature ranged from 4.8 to 9.4 °C, with a mean of 7.1 °C for the study area (Supplementary Materials 1, Figure S1b) [38,39]. The average precipitation in the study sites during the summer months of 2018 was 50% less than in the period December 1999–November 2017 (Figure 2). The average precipitation from 2018 (595 mm) was less than the average precipitation of 2003 (611 mm) (Supplementary Materials 1, Figure S1c). Moreover, in 2018, the annual potential evapotranspiration (749 mm) exceeded the average precipitation (595 mm) (data not shown). Between 2000 and 2019, the average precipitation decreased with 91 mm, while the mean annual temperature increased with 0.5 °C (Supplementary Materials 1, Figure S1c,d). In 2019, the average precipitation was 736 mm and the mean annual temperature was 9.5 °C (Supplementary Materials 1, Figure S1c,d). The Standardized Precipitation Evapotranspiration Index (SPEI) for the period 2000–2019 indicated a more severe drought in 2018 than in 2003 and 2019. In 2019, it was a normal to moderate drought (Supplementary Materials 3, Figure S1a–e).

2.3. Field Measurements

Fieldwork was carried out during August and September in 2018 and repeated in 2019. The 218 plots (15 × 15 m) were established in 2018 based on a random selection of locations within the forest surface of the entire investigation area. To reduce spatial autocorrelation through sampling, the plots were positioned at a minimum distance of 1 km. From these random points, the nearest naturally established group of sapling deciduous trees in the understory was detected. Among these plots, 47 were located in stands with deciduous trees in the canopy, 133 in mixed forest, and 38 in stands dominated by mature conifers (Supplementary Materials 2, Table S1). The basal area (BA) for the respective forest stand was measured using the Bitterlich stick [40]. The mean BA for the forest stands ranged from 3 to 41 m2 ha−1, with a mean value of 22.4 m2 ha−1. The percentage of mature and sapling canopy cover was assessed separately for each plot in 2019. Species richness and abundance were recorded per plot. Elevation and Global Positioning System (GPS) coordinates were recorded for each plot.
For each plot, 10 deciduous tree saplings ≥ 1.3 m of height and with a diameter at breast height (DBH) below 10 cm were measured. All 10 saplings were selected randomly and marked for future comparison. Only in a few cases, less than 10 saplings could be sampled at a given plot. In 2019, five plots (50 saplings) out of 218 plots could no longer be considered because they were affected by human intervention and 48 saplings out of 21 plots could not be identified because the labels were missing. In total, 2149 saplings were recorded in 2018 and 2051 in 2019. However, only the 2051 saplings were used for further analysis. All saplings were attributed to a tree species.
To assess the vitality and drought damage, a simple classification was applied with the following vitality classes: (1) Undamaged/all leaves are undamaged by drought and do not show color changes; (2) partly damaged/individual leaves and branches of the sapling trees are damaged but the entire plant has still a major part of undamaged leaves; and (3) completely damaged/all leaves and branches of the plant show drought damage. Crown defoliation can serve as a stress indicator and correlates with tree growth [28].

2.4. Data Analysis

Changes in sapling vitality between 2018 and in 2019 and changes in the three vitality classes were assessed using Fisher’s exact test for count data and the pairwise comparison. The McNemar test, followed by a symmetry test for paired data from the “rcompanion” package [41], was used to determine whether the proportion of damaged saplings increased after the 2018 drought. Sapling recovery index was estimated as the ratio between the performance in terms of vitality after (2019) and during the drought of 2018, where values <1 indicate a decrease in performance (vitality) after the event [42]. The species recovery was assessed using the non-parametric Kruskal–Wallis test. Resilience and resistance index could not be calculated because vitality data were not available before the 2018 drought.
Tree species biodiversity was characterized by the Shannon diversity index. The diversity index was calculated for (1) all tree species from the plot; (2) all sapling species; and (3) all mature tree species. The Shannon diversity index was calculated based on species richness and species abundance, using the diversity function from the vegan package [43]. The vitality mode per plot was calculated and two groups were formed, the undamaged (vitality 1) and damaged group (vitality 2 and 3). The two classes (undamaged and damaged) were created because the sample size of completely damaged saplings (vitality 3) was too small in 2019 to meet the test criteria. The non-parametric Kruskal–Wallis test was used to check if there was a difference in terms of species diversity between the undamaged and damaged groups.
The influence of environmental variables (i.e., soil type, elevation) as well as forest stand characteristics (i.e., tree cover, BA) on tree vitality was tested using analysis of variance (ANOVA) and the non-parametric Kruskal–Wallis test. Normality of the data was checked with the Shapiro–Wilk test (p > 0.05) and homogeneity of variance was checked with the Levene test (p > 0.05). Statistical comparison for multiple groups was evaluated using the Tukey Honestly Significant Difference (HSD) test following ANOVA and Dunn’s test after a significant Kruskal–Wallis test. The comparison between multiple vitality classes based on the soil type was evaluated by the Fisher test. The McNemar test was used to assess if the number of damaged saplings increased after the 2018 drought. The SPEI drought index was calculated based on the climatic data provided by the German Meteorological Service (monthly precipitation and temperature) and using the SPEI package for the time scale 1, 2, 6, and 12 months. The potential evapotranspiration was calculated according to the Thornthwaite equation [44]. All statistical analyses were conducted with the software R 3.6.0 [45] and the additional packages FSA, RVAideMemoire, rgdal, raster v3.0-7, and ggplot2 v3.2.1.

3. Results

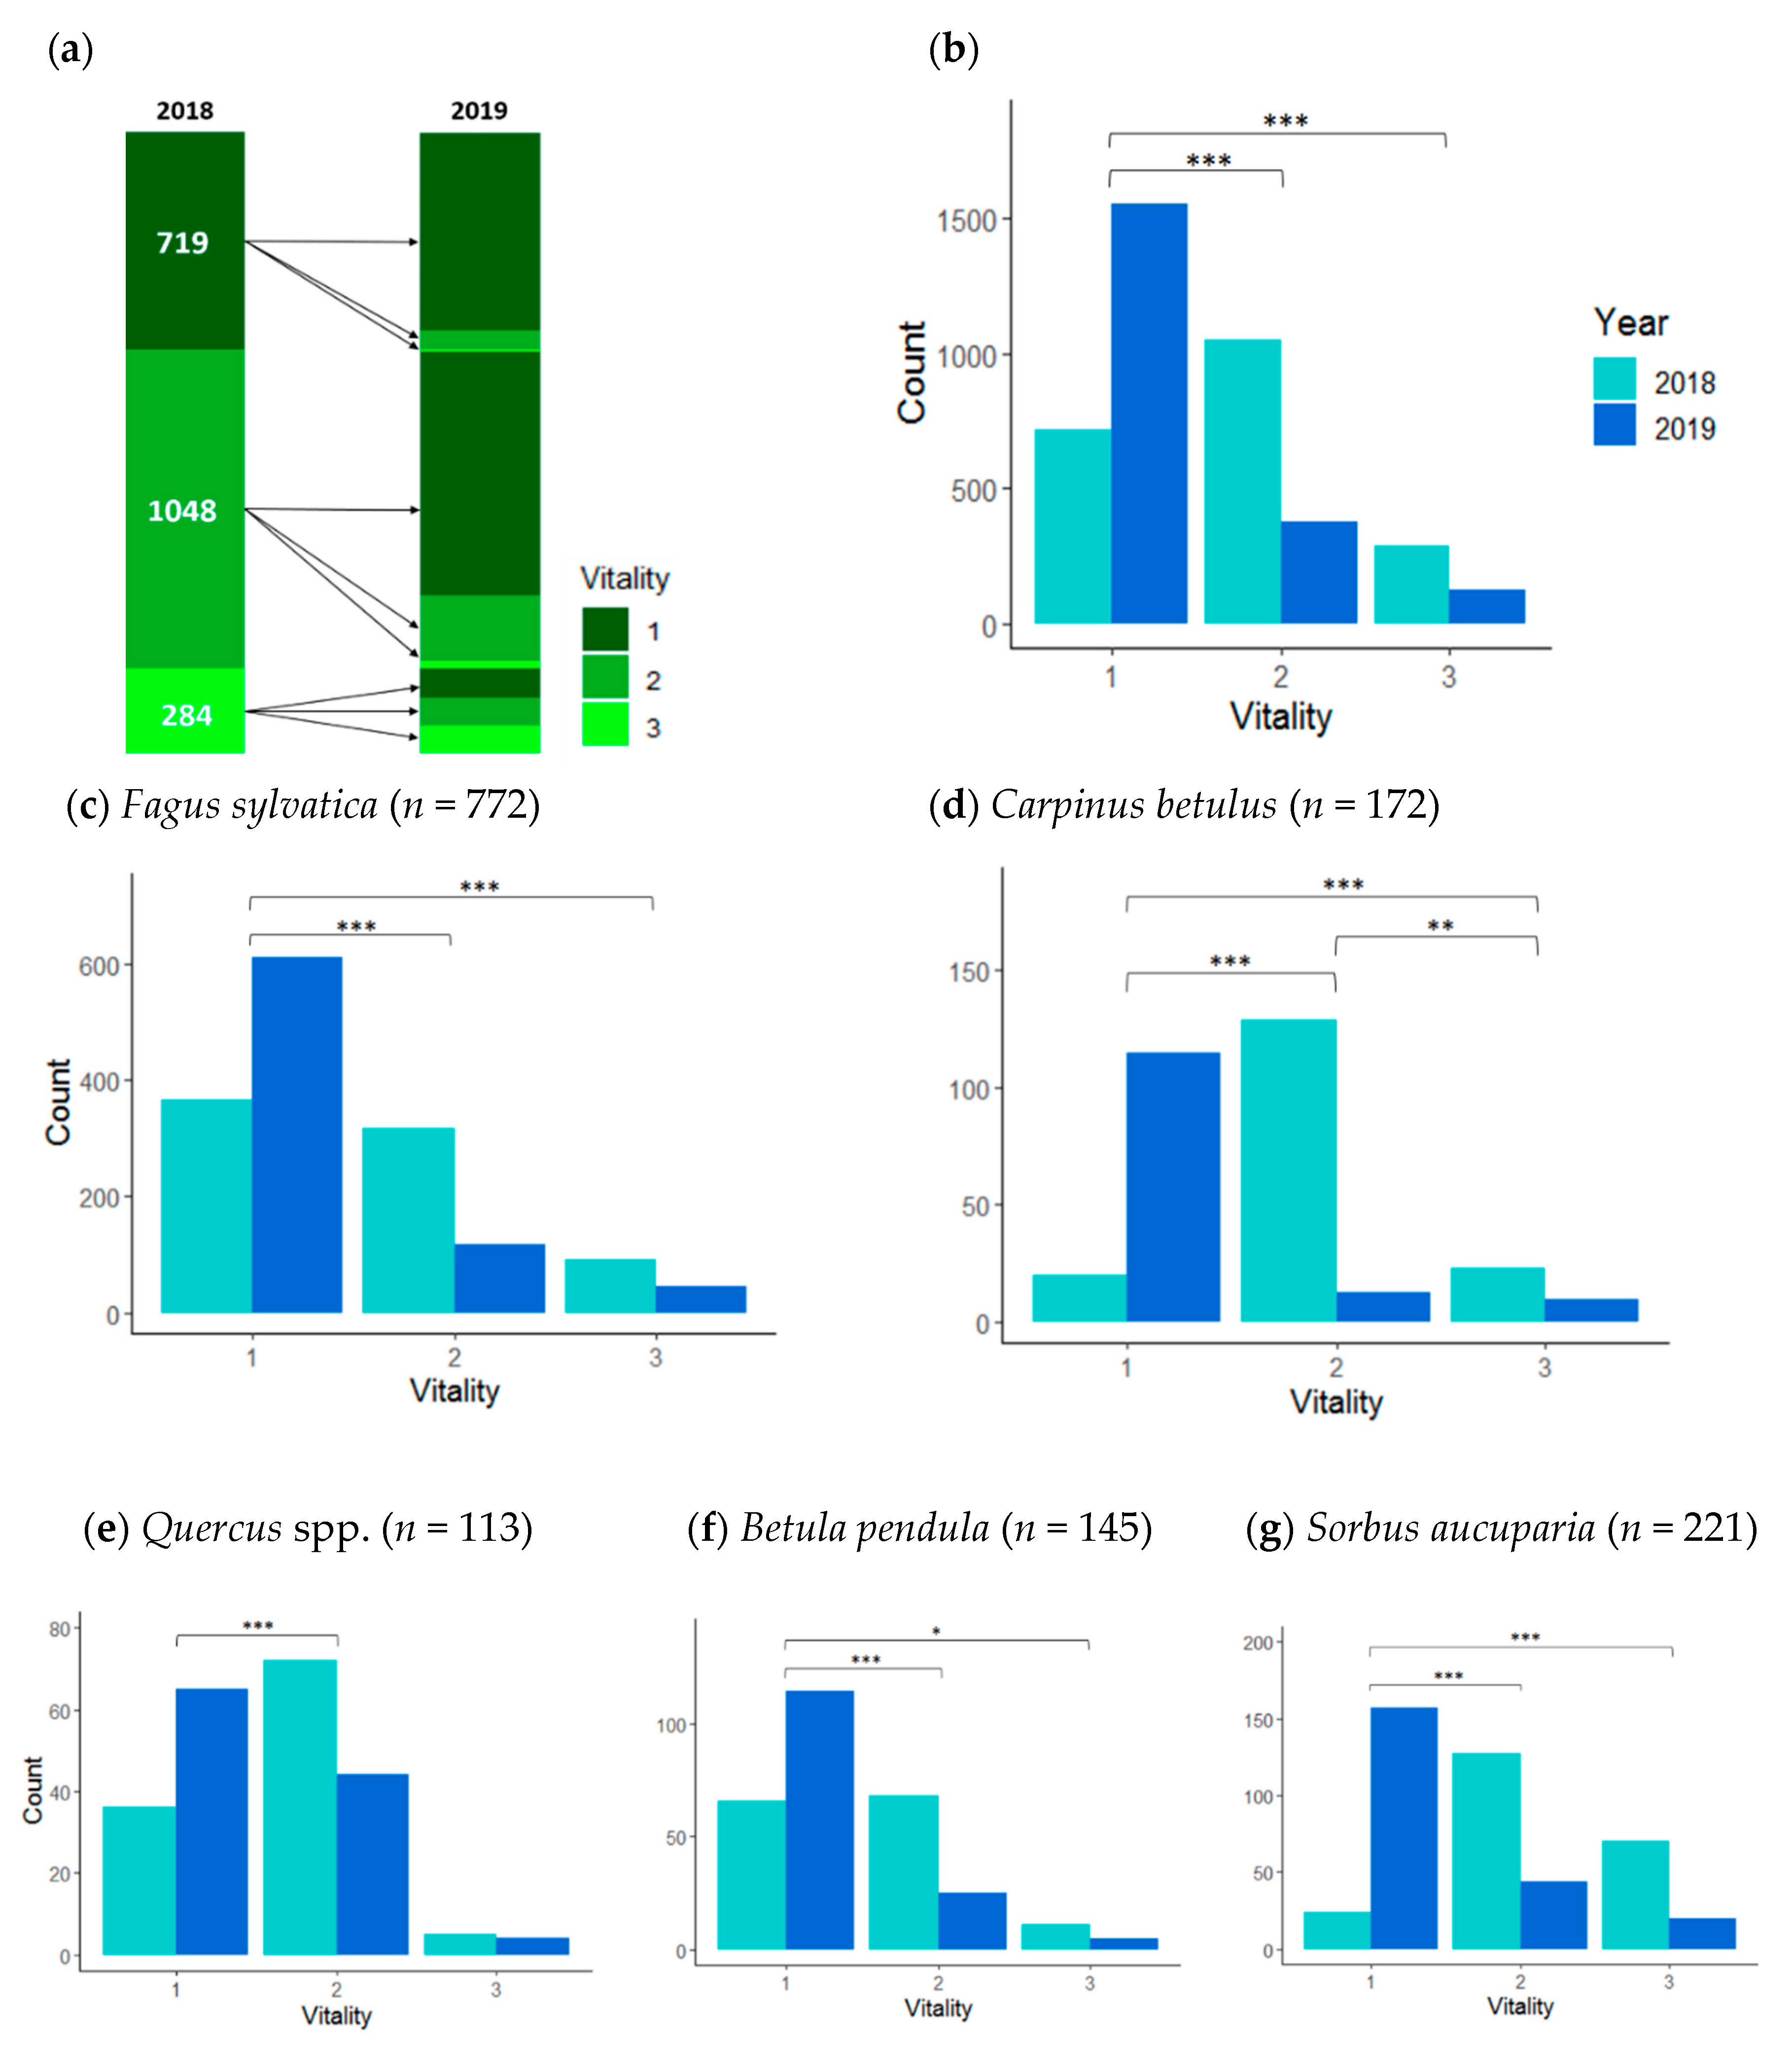
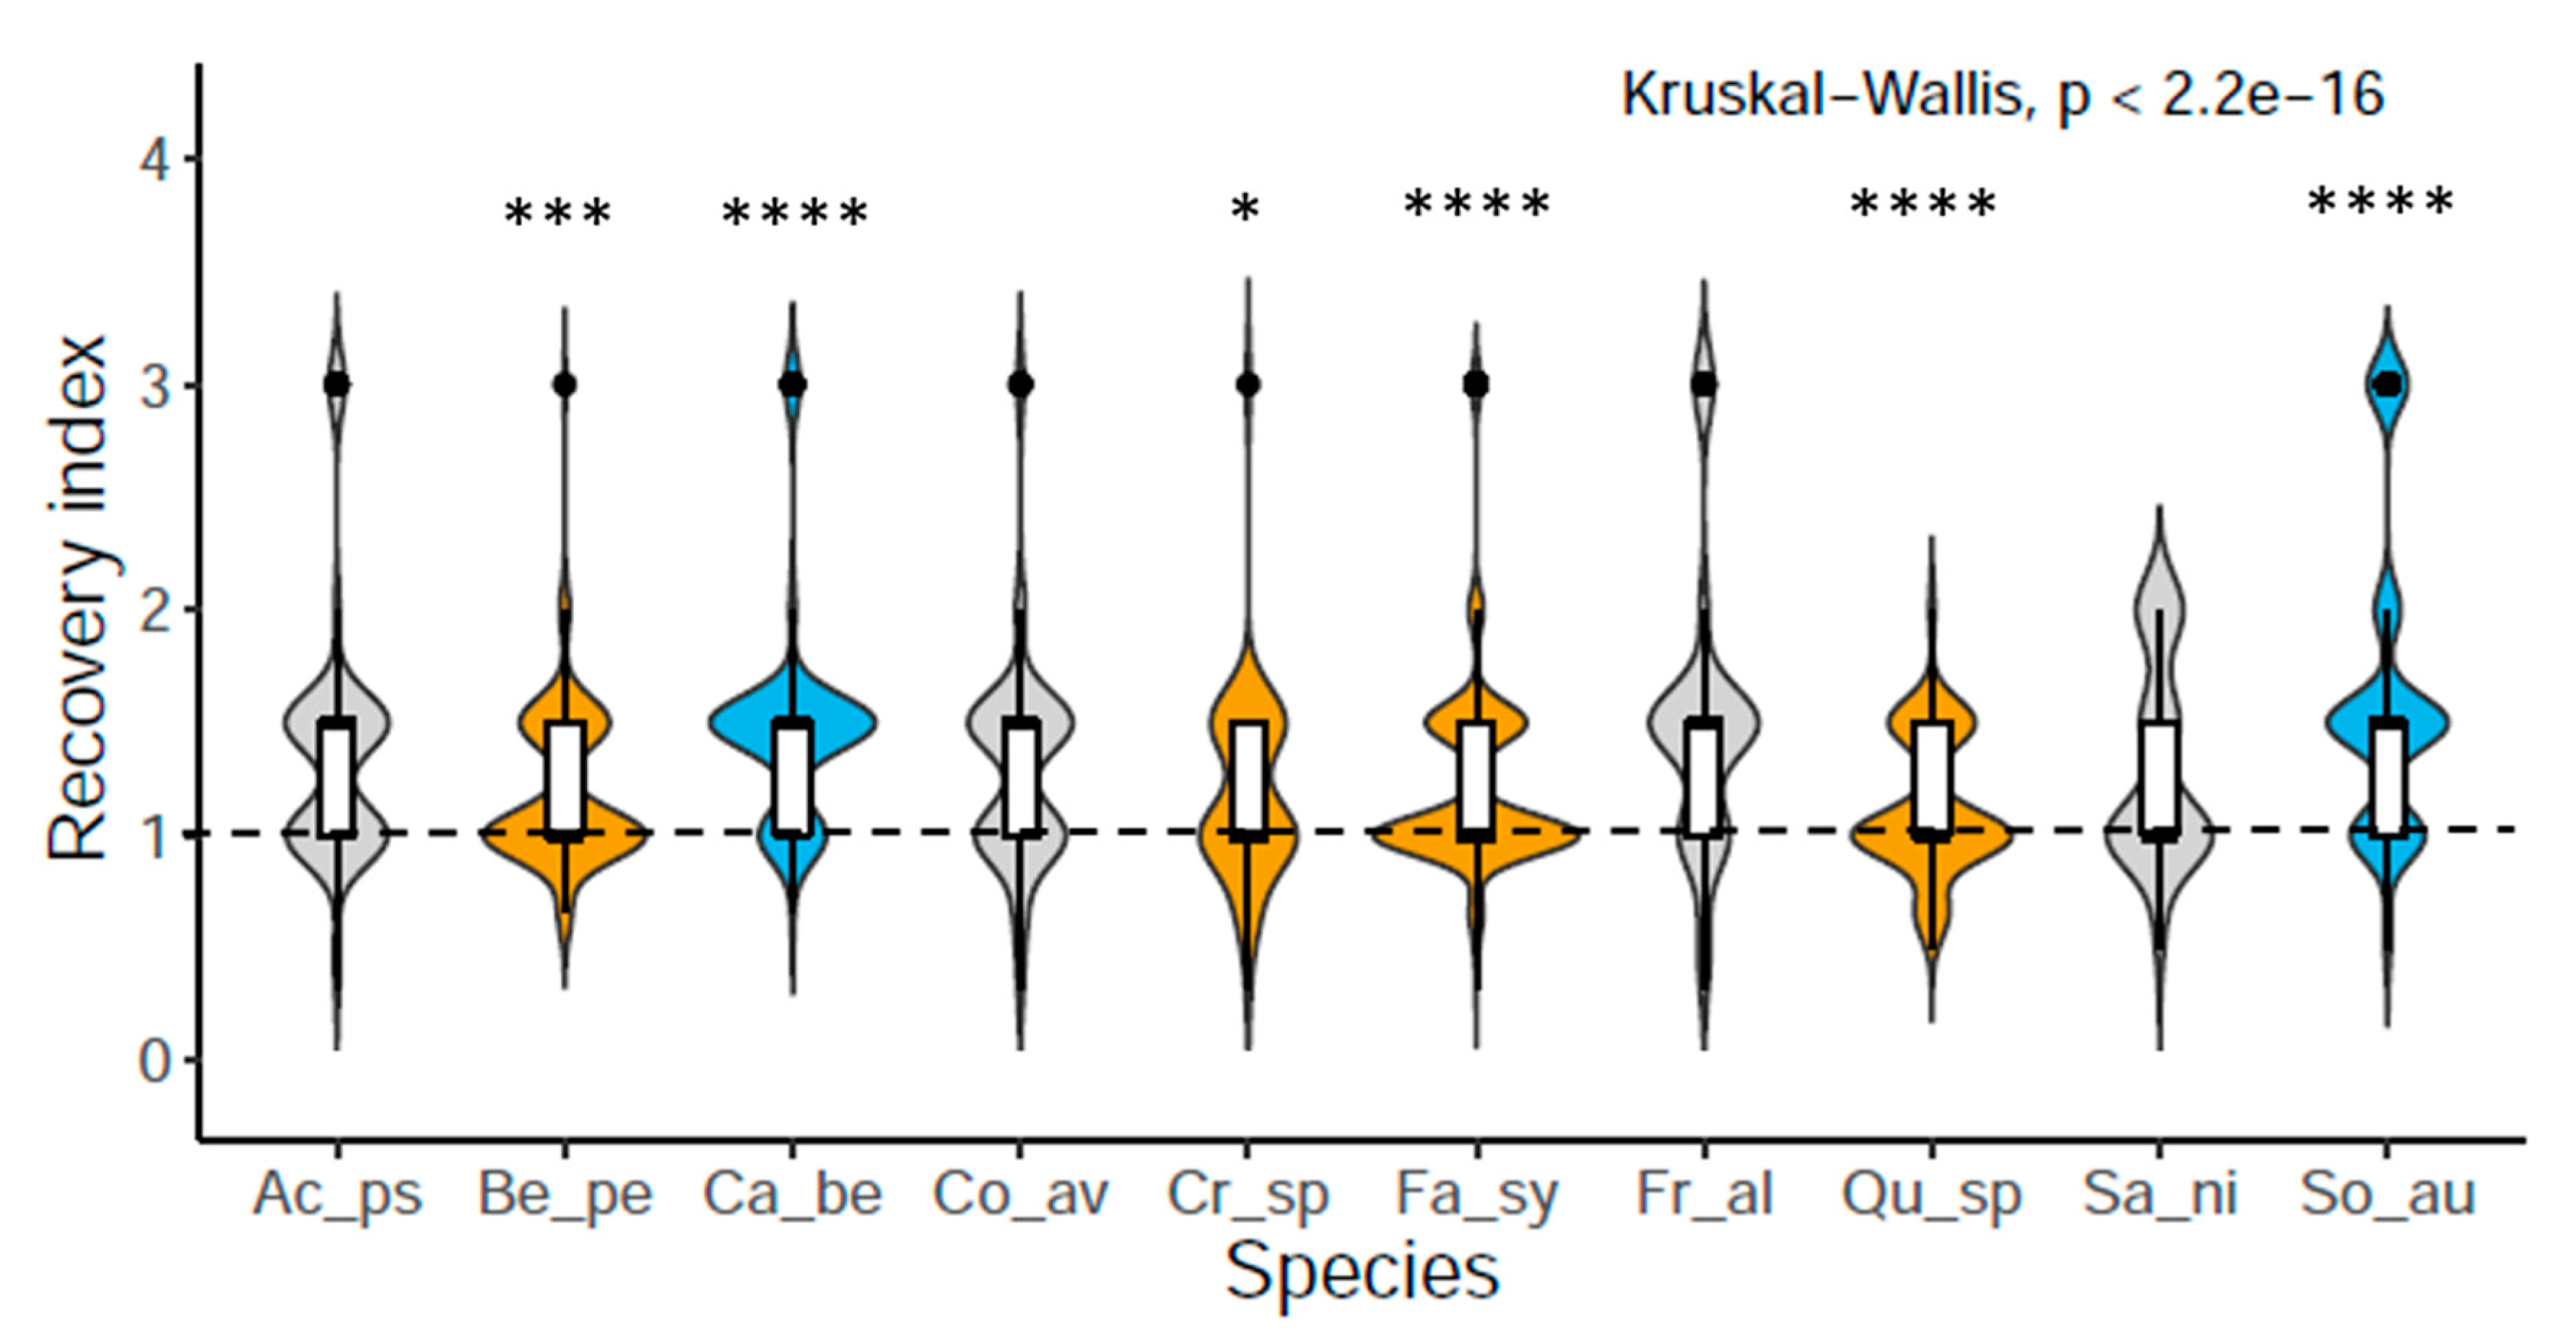
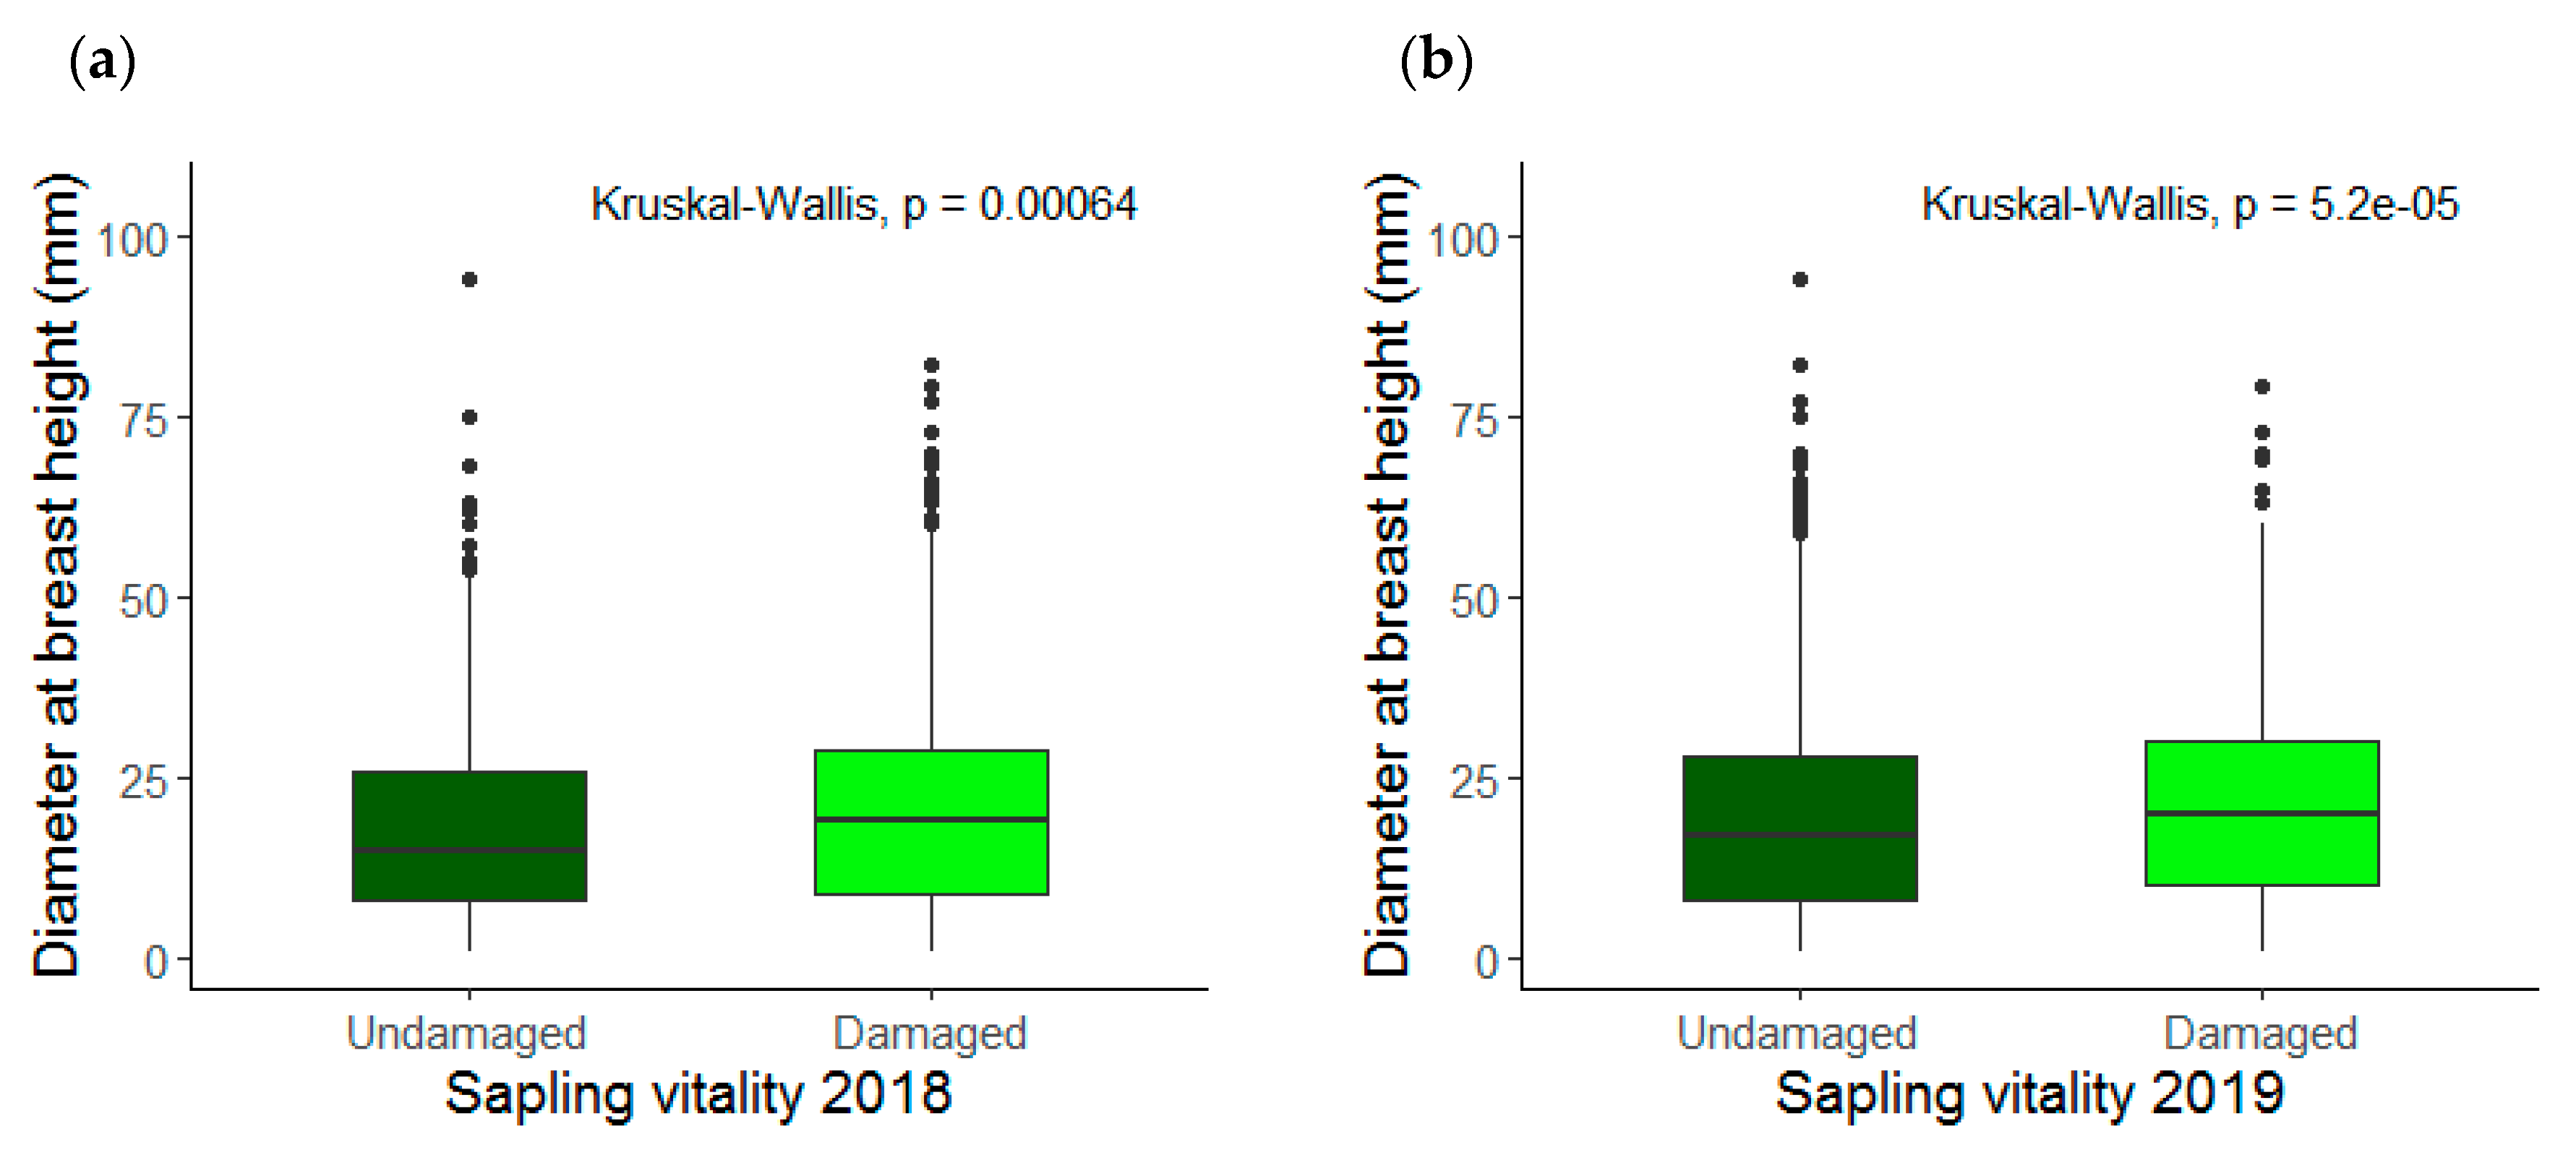
3.1. Saplings Response to Drought Stress and Their Recovery

In 2018, out of 2051 saplings measured, 35% were undamaged (vitality 1), 52% were partly damaged (vitality 2), and 13% were completely damaged (vitality 3). Whereas, in 2019, there was a significant difference between vitality groups in the order undamaged (72%) > partly damaged (22%) > completely damaged (6%) (McNemar test, p < 0.001) (Figure 3a and Supplementary Materials 1, Table S1). A significant shift in tree vitality was found between the two study periods. The forward shift patterns showed that saplings that were partly and completely damaged (vitality 2 and 3) in 2018 had significantly shifted toward the undamaged state (vitality 1) in 2019 (Fisher’s exact test, p < 0.001) (Figure 3b). This indicates a high recovery of the saplings damaged by the drought of 2018. However, there was also a backward shift, a lower percentage of saplings that were undamaged in 2018 were completely damaged in 2019 (Figure 3a). Out of 2051 saplings remeasured in 2019, 125 saplings recorded complete damage, with the aboveground compartment entirely defoliated.
Out of 41 tree sapling species measured, the 10 most abundant tree species found in more than 20 plots in 2018 and 2019 were Fagus sylvatica, rowan (Sorbus aucuparia L.), European hornbeam (Carpinus betulus L.), silver birch (Betula pendula Roth.), oak (Quercus spp.), sycamore (Acer pseudoplatanus L.), common hazel (Corylus avellana L.), alder buckthorn (Frangula alnus Mill.), elder (Sambucus nigra L.), and hawthorn (Crataegus spp.) (Table 1). We identified three species of Quercus, sessile oak (Q. petraea (Matt.) Liebl.) as the most abundant, followed by pedunculated oak (Q. robur L.) and red oak (Q. rubra L.). Quercus spp. were regarded together due to the occurrence of hybridization between Q. petraea and Q. robur.
At species level, there were significant differences in vitality between the species. Of the 10 abundant species, F. sylvatica and B. pendula recorded the least damage. The most affected species were S. aucuparia, C. betulus, F. alnus, and S. nigra, with the proportion of completely damaged saplings exceeding that of undamaged saplings. Sapling vitality classes recorded a significant shift in their structure (p < 0.001) between 2018 and 2019 for all 10 abundant species (Figure 3c–g, and Supplementary Materials 1, Figure S2). F. sylvatica showed a dominant proportion of undamaged saplings in 2018, but in the following year, there was a strong backward shift in vitality classes (p < 0.001) (Figure 3c).
The recovery rate of C. betulus and S. aucuparia was significantly higher than that of Quercus spp., F. sylvatica, B. pendula, and Crataegus spp. (Figure 4). A. pseudoplatanus, C. avellana, and F. alnus also recorded a high rate of recovery after the drought of 2018, whereas S. nigra had a slower rate of recovery, but this was not significant (Figure 4). None of the species analyzed showed a significant decrease in performance in 2019 (recovery index < 1), therefore they either maintained the same vitality or recovered.

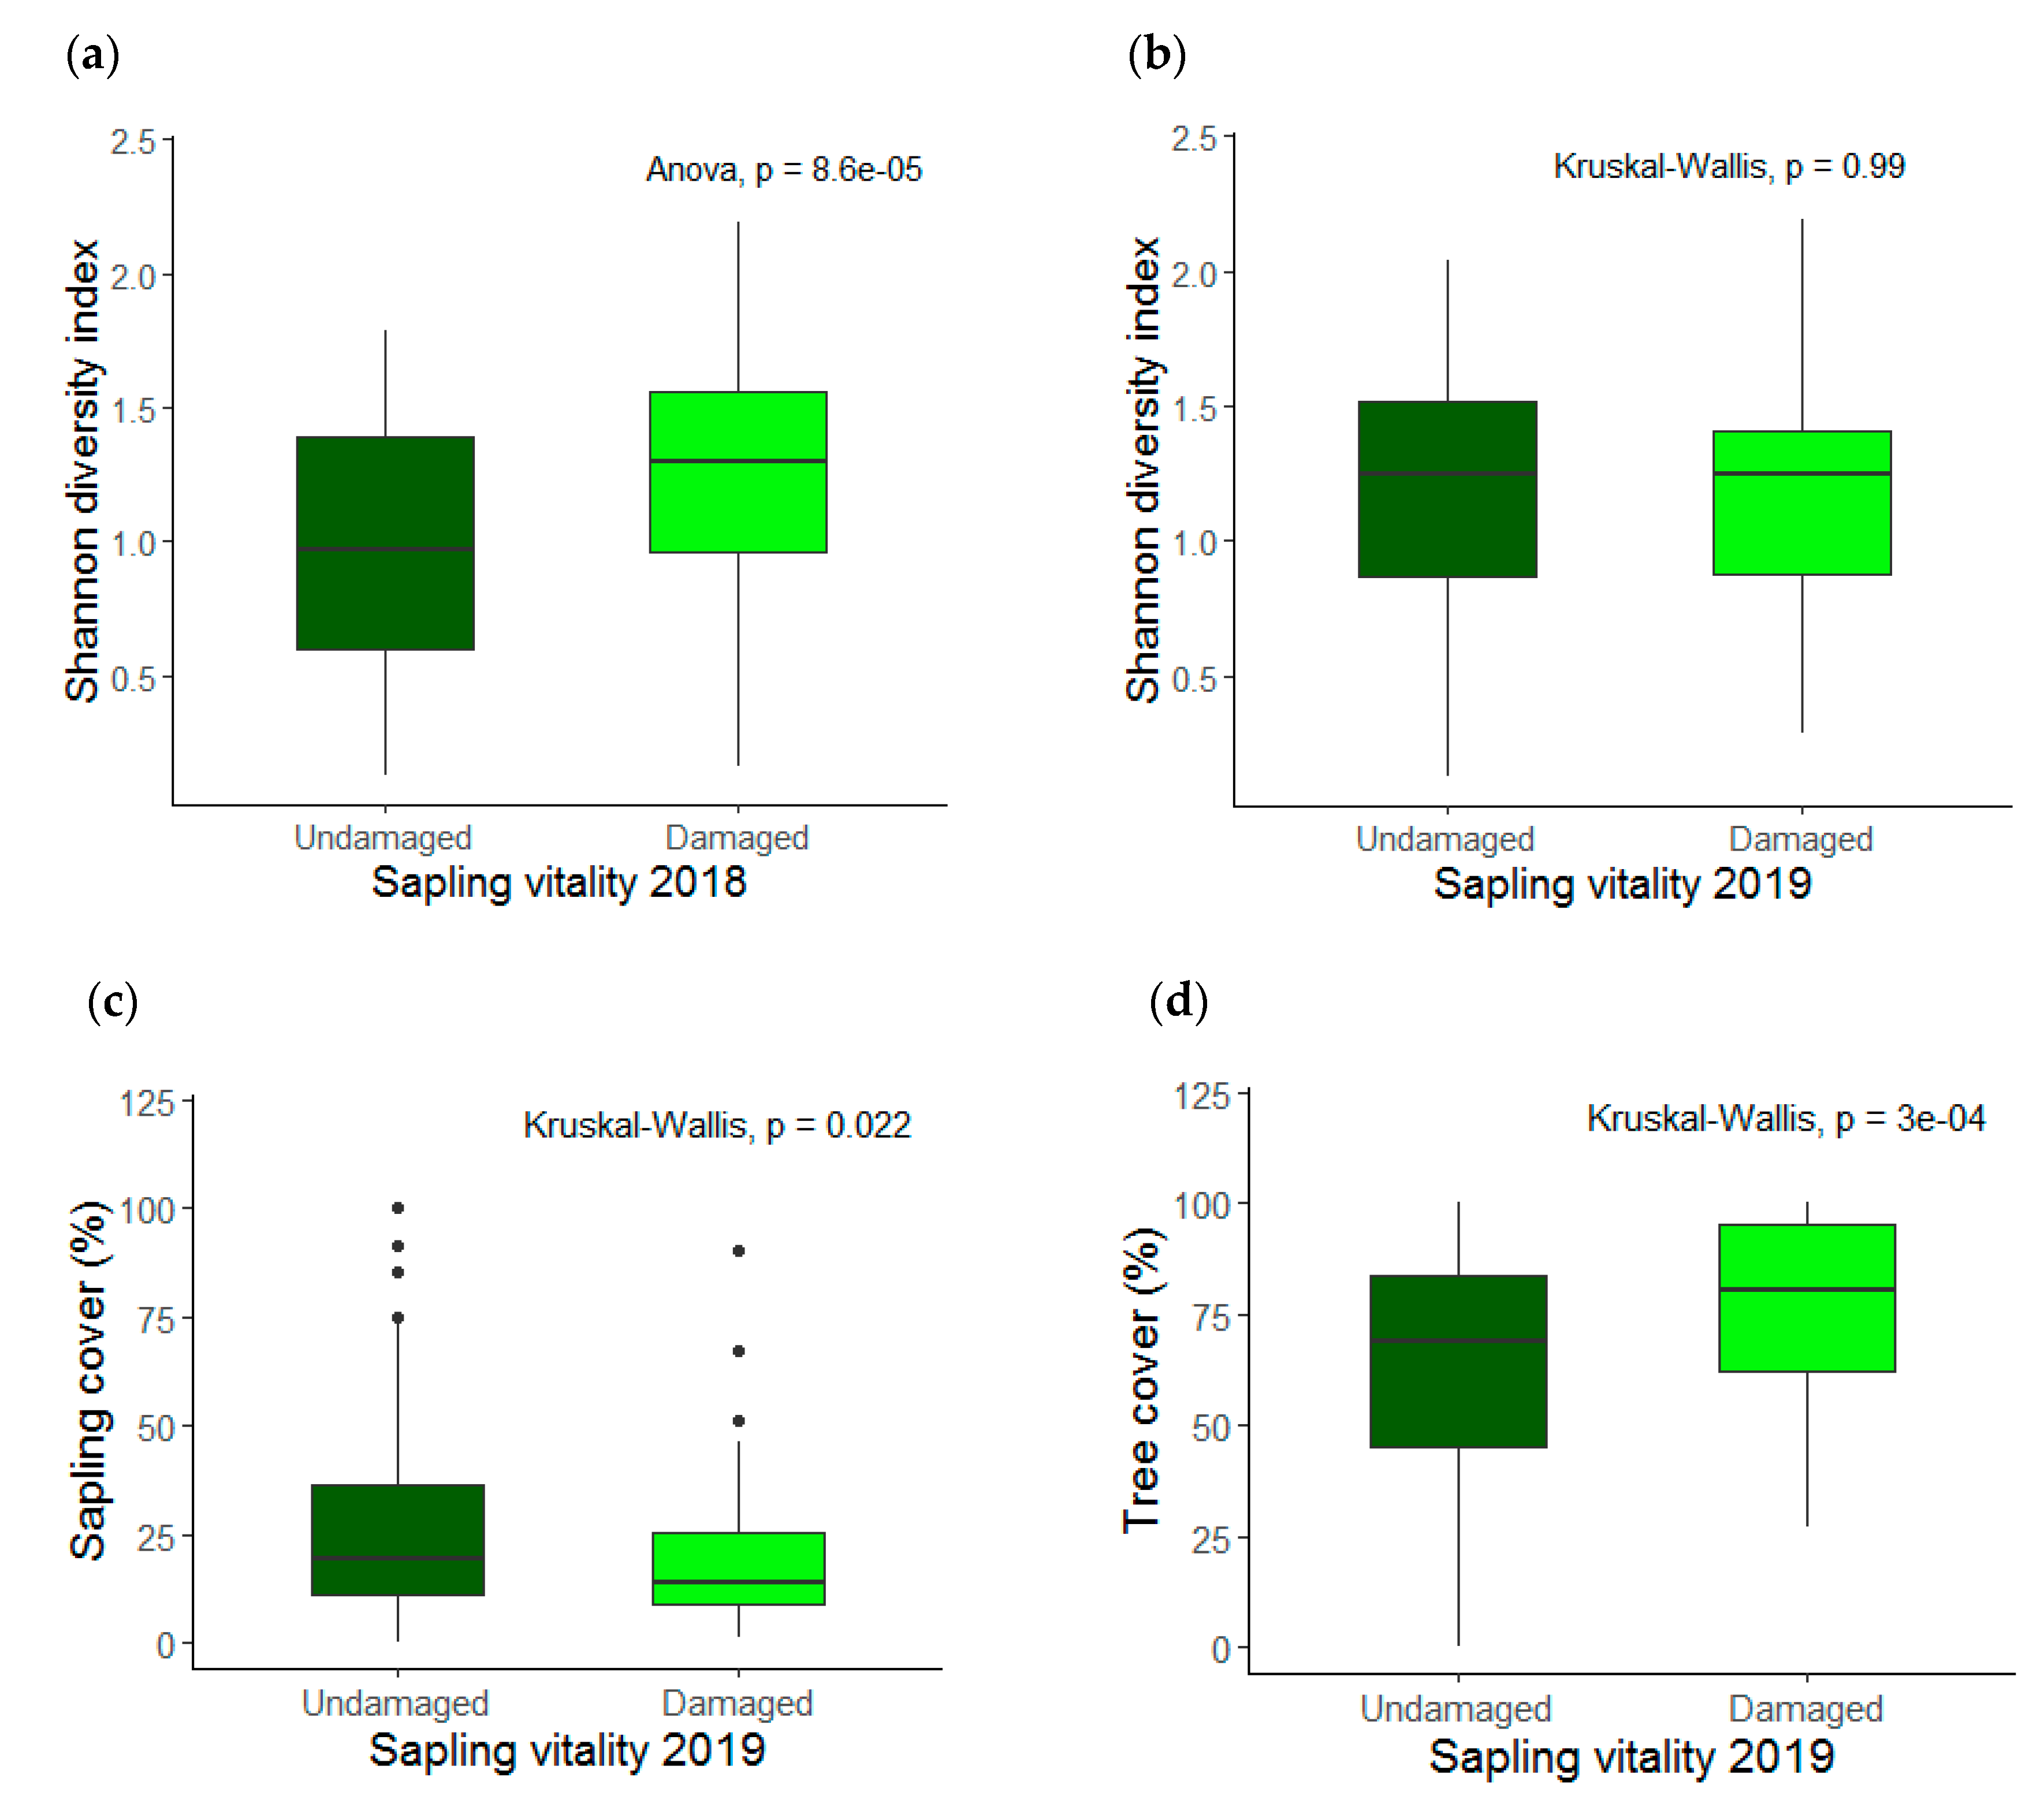
3.2. Species Diversity and Stand Characteristics

Species richness was between one and 10 tree species per plot, with a mean of five species per plot. Shannon diversity index for all tree species varied between 0.13 and 2.19, with a mean of 1.19. In 2018, forest stands with high tree diversity (mature and sapling trees) showed a reduced vitality than sites with low tree species diversity (p < 0.001) (Figure 5a). Additionally, sites with higher sapling diversity showed increased vulnerability to drought (Kruskal–Wallis test, p < 0.001), whereas mature tree species diversity had a neutral effect (Kruskal–Wallis test, p > 0.05). One year later, in 2019, species diversity did not differ between the undamaged and damaged plots (p > 0.05) (Figure 5b). Furthermore, sapling and mature tree diversity showed no significant difference in 2019 (Kruskal–Wallis test, p > 0.05) (data not shown). Plots with saplings undamaged had a higher canopy cover (p < 0.05) (Figure 5c). Saplings growing under mature trees with high canopy cover exhibited a lower vitality (p < 0.001) (Figure 5d).
Saplings with higher DBH experienced higher damage during the drought in 2018 and also one year later (Figure 6a,b). All 10 most abundant species showed a decrease in vitality with DBH, however, only for Crataegus spp. and S. nigra was the decrease significant in 2019 (Kruskal–Wallis test, p < 0.01) (data not shown). Moreover, the forest stand with a higher BA had more damaged saplings, but this relationship was not significant (Kruskal–Wallis test, p > 0.05). The relationship between AWC and sapling vitality per plot was assessed for 2018 and 2019, however, there were no significant differences between the groups (p > 0.05) (Supplementary Materials 1, Figure S3).
Of the 10 most abundant species, F. sylvatica, S. aucuparia, C. betulus, B. pendula, Quercus spp., C. avellana, F. alnus, and Crataegus spp. dominated mainly on cambisol and podzol soils, while A. pseudoplatanus and S. nigra were mostly found on podzol and rendzina soils (Supplementary Materials 2, Table S2). Tree saplings were affected by drought in large proportions in all soil types. However, saplings growing in luvisol were, in 2018, significantly more damaged than those on cambisol, podzol, and rendzina (Fisher’s test, p < 0.05) (Supplementary Materials 2, Table S3a,b). The number of damaged saplings in 2019 was higher than the number of undamaged saplings in 2018 in luvisol and this proportion was statistically different than in cambisol and podzol (Fisher’s exact test, p < 0.05, Supplementary Materials 2, Table S3b). In 2019, in each type of soil, the saplings recovered in high proportions. The number of saplings damaged during the drought of 2018 was statistically higher than the number of saplings damaged after the drought in 2019 (McNemar test p < 0.001) in all soil types (Supplementary Materials 2, Table S4).

4. Discussion

Our study yielded four major findings: (1) across all saplings, the summer drought of 2018 led to an increase in defoliation (decrease in vitality) of all investigated species, with F. sylvatica and C. betulus saplings less affected, whereas C. betulus, S. aucuparia, and F. alnus were the species most affected by drought; (2) the recovery rate was dependent on species, C. betulus and S. aucuparia recovered faster than Quercus spp., F. sylvatica, B. pendula, and Crataegus spp.; (3) forest stands with high species diversity were more exposed to drought stress than stands with low species diversity; and (4) saplings with higher DBH were more affected by drought stress than saplings with lower DBH.

4.1. Drought Response and Species Recovery

During the drought of 2018, 65% of the tree saplings (n = 2051) from the study area experienced a significant decrease in vitality. Sustained drought stress leads to a reduction in the canopy (i.e., decrease leaf growth, loss of older foliage), photosynthetic activity, and storage reserve [14,46]. In the study area, more than 85% of the saplings of S. aucuparia, C. betulus, F. alnus, and S. nigra experienced high defoliation rates. Such severe defoliation is associated with an increase in the nutrient cycle and a change in the biogeochemical cycles of the forest due to leaf fall [30]. However, the drought period of 2018 was not characterized by unprecedented high-temperature values in the study area, but rather a significantly lower amount of precipitation, especially during the summer months, compared to the average values of previous years (Figure 2 and SPEI drought index Supplementary Materials 3, Figure S1). Additionally, during the 2003 drought, a decline in European forest productivity was not caused by high temperatures, but rather by water limitations [47]. Low soil moisture reduces decomposition and mineralization, which leads to a shortage of nutrients [48]. Therefore, tree growth was found to be reduced during drought, but enhanced after the drought [49] when the nutrients were again accessible to the tree species.
The repeated survey in summer 2019 allowed us to detect a shift in tree vitality. Partially damaged saplings shifted mainly to undamaged saplings, indicating a high recovery rate after one year (Figure 3a). In 2018, only 35% of the saplings were undamaged, compared to 72% one year later. A similar study in the Mediterranean forests also identified a fast canopy recovery after significant drought dieback, regardless of age [50]. Although a high percentage of saplings recovered in 2019, 22% of the saplings were still partially damaged and 6% recorded complete defoliation. The SPEI drought index indicated a severe drought in 2018, but only a normal to moderate drought in 2019. However, the average precipitation was lower in 2019 (736 mm) compared to the average between 2000 and 2017 (957 mm). This partial recovery of the canopy can result from chronic stress, branch decline, and poor bud development, which in turn can increase susceptibility to further stress [14]. For example, crown defoliation increased during the drought events between 1987–2006 for both coniferous and deciduous species in Spain, with partial recovery after the events [30]. Moreover, Dobbertin and Brang [29] showed that the rate of mortality increased exponentially with crown defoliation in deciduous and coniferous forests in Switzerland. The vulnerability of already damaged saplings may increase under repeated drought stress, probably resulting in a complete dieback.
Tree recovery depends on the tree species strategies to cope with drought stress enhanced by the site conditions. Water limitation is considered the main factor for tree survival [51]. Species exhibit morphological and physiological traits that allow them to cope with drought stress to some extent. During severe drought events, defoliation of the canopy determines a decrease in photosynthetic capacity, which leads to depletion of the carbon reserves, followed either by a longer recovery phase of the surviving trees or their death [52]. Accordingly, all 10 abundant species recovered in high proportions, with S. aucuparia and C. betulus having a faster recovery rate than F. sylvatica, Quercus spp., B. pendula, and Crataegus spp. (Figure 4). The resistance and resilience of these species could not be assessed with the current dataset, therefore, further studies should be done.
The extensive defoliation of S. aucuparia under the drought of 2018 indicates a catastrophic failure of the hydraulic system. S. aucuparia is a species that is adapted to a short growing season, tolerates cold, frost, shade, high temperatures, and has a high ability to grow in different soil conditions, but does not tolerate drought [53]. Although it is currently a widespread species in Europe, a shift to upper elevation and latitude has been shown [54] and under future climate scenarios, it is predicted that it will lose more climate space than it gains, especially from Southern and Eastern Europe [55,56]. In the study area, a high proportion of S. aucuparia saplings are growing in cambisol and podzol. The species is highly dependent on the site characteristics, however, it is categorized as having a medium-deep root system (100 cm) [57]. Despite their high vulnerability to drought, S. aucuparia saplings had faster recovery than Quercus spp. and F. sylvatica (Figure 4). Similar to our results, in an experimental setup, Sorbus torminalis seedlings also showed a faster recovery rate compared to Quercus spp. and F. sylvatica [20]. In contrast, mature trees of S. torminalis and Q. petraea had a lower recovery than F. sylvatica [21]. This indicates that seedlings and saplings respond similarly to drought stress, but this may not be consistent with the performance of mature trees.
Among the species examined, saplings of F. sylvatica were less susceptible to drought stress and had a significant post-drought recovery (Figure 4). F. sylvatica is limited by temperature, drought, and humidity availability, however, it is predicted that its range will shrink in the south, be stable in central, and expand in northern Europe [58]. Under moderate drought stress, F. sylvatica fine-root production and length increases, being able to foster water uptake, however, under severe soil drought it decreases leading to root mortality [59]. Moreover, experimental setups showed that the photosynthetic performance of F. sylvatica and Q. pubescens saplings was severely impaired during a severe drought but recovered completely after re-wetting [60,61]. This suggests that the aboveground and belowground compartments are both severely affected by drought stress. In the study area, out of 772 F. sylvatica saplings, only 90 experienced complete defoliation during the drought of 2018 and 44 one year later. Compared to common garden experiments in which saplings were exposed to short term drought stress (e.g., four weeks) [60,61], the saplings from the study area were exposed to prolonged drought stress with low average spring and summer precipitation. Therefore, these results underline the ability of F. sylvatica saplings to cope with prolonged drought stress and recover.
Although mature trees of Quercus spp. have deeper roots and are considered to have a higher drought tolerance than F. sylvatica [49,62,63], our results showed that Quercus spp. saplings were even more vulnerable to drought than those of F. sylvatica. However, both species had a similar recovery rate (F. sylvatica 1.22 and Quercus spp. 1.12). In contrast, Kunz et al. [21] reported a higher recovery for F. sylvatica compared to Q. petraea mature trees. Q. petraea were the most common saplings in our study area. Both species have moderate drought resistance, with a less sensitive and deeper root system, they can access deeper water sources, however, a high density of Quercus shallow fine roots is found on the upper horizon, where the risk of drought is higher [62]. Quercus species have different preferences regarding soil conditions [64]; in the study area, they were found mostly in podzol, followed by cambisol and luvisol. Despite the drought resistance of Quercus spp., when mixed with F. sylvatica, the latter is competitively superior [62]. Additionally, in southern Europe, although canopy defoliation has increased in recent years, consistent with tree mortality, F. sylvatica has a lower mortality rate compared to Pinus spp. and Quercus spp. [30].
Tree saplings of B. pendula and F. sylvatica were found mainly in cambisol and podzol and experienced similar rates of defoliation. However, both species can tolerate different soil conditions. B. pendula is not drought tolerant but has a deep rooting system [65]. Therefore, the high shade tolerance of F. sylvatica saplings [66], together with the ability to deepen and intensify the root system under drought conditions, seems to lead to an efficient strategy, comparable to that of B. pendula. S. nigra had rather a low recovery compared to A. pseudoplatanus, but neither was significant. S. nigra can grow under poor soil conditions, but it is not drought tolerant [67]. In contrast, A. pseudoplatanus is a medium shade-tolerant [66] and moderately drought-sensitive species, which prefers locations with moderate to high soil moisture and nutrient-rich content [68]. Although most saplings of these two species were found in cambisol and rendzina soils, they were partly damaged during the 2018 drought but recovered in high proportions in 2019. Seedlings of other European Acer species (A. campestre and A. platanoides) showed a higher drought recovery compared to F. sylvatica and Q. petraea [20], whereas mature trees of Q. petraea showed a lower recovery than Acer and F. sylvatica species after drought [21]. Therefore, seedlings and sapling of Acer species may recover better from drought stress than mature trees.
C. betulus and F. alnus were found mainly in cambisol and podzol, but can also grow in a range of soils and are shade-tolerant species. Both species recorded a high level of defoliation, which may be explained by their preference for moist soils [69,70,71]. Nevertheless, saplings of C. betulus had a high rate of recovery. C. betulus, along with A. campestre, S. torminalis, and S. aria, are predicted to be among the best species adapted to a warmer and possibly drier climate in Central Europe in the future [72]. In conclusion, we found very species-specific responses to drought in deciduous saplings that have been mainly established through natural regeneration in the forest understory.

4.2. Species Diversity

Forest stands with high sapling species diversity showed more signs of reduced vitality. The Shannon diversity index for the total tree species decreased with the increase in sapling vitality in 2018. This can mean that forest stands that are more susceptible to drought (e.g., on shallow soils or with limited nutrient availability) have higher species diversity. It is less likely that the diversity of species and intraspecific competition would be the reason for this phenomenon because there is an incidence that diversity can mediate drought stress [23]. One year later, in 2019, no such effect was found any more due to the recovery of many saplings, which indicates a high resilience of the sapling community. The importance of species diversity in buffering forest drought vulnerability in European forests has been addressed in recent studies [49,73,74,75,76], however, unanimous consent has not yet been reached [23]. Grossiord [23] has shown that most studies have been done at the mature stage of development, therefore an assessment at the sapling level has been missing up to now. Species interaction is predicted to mitigate drought impact on trees by better partitioning resources among neighboring species or by facilitation as a result of tree species interaction (i.e., -intra/interspecific interaction in aboveground and belowground tree compartments) [23]. Positive effects of species interaction have been shown in several studies in temperate forests [22,49,73], indicating that mixed forest stands are more appropriate to mitigate the effects of global warming. However, such positive effects are expected in the long term and do not exclude short-term individual and species-specific responses to extreme events that are more likely to occur in highly diverse communities.
At the mature level, we identified a neutral effect of tree diversity on sapling vitality, where such an effect is considered to be determined by environmental conditions [77], whereas sapling diversity correlated negatively with vitality. Forest stands with a high diversity of saplings exhibited a low tree vitality. A negative relationship between species diversity and tree vitality was also found in other ecosystems [23]. It is discussed whether functional redundancy (i.e., functional niches overlap) may lead to stressful conditions during drought events with scarce water availability [73]. Enhanced transpiration is promoting competition for nutrients and water [14,76,78].
In species-rich stands, F. sylvatica is found to exhibit strong underground competitiveness, pushing the other species’ root system toward the surface including those of Q. petraea [79]. In species-rich stands, soil water extraction is high at the beginning of the drought, but decreases considerably under severe drought stress since the soil already has low water content; whereas in F. sylvatica dominant stands, soil water extraction was low at the beginning of the drought and increased during the drought [80]. Therefore, it can be emphasized that soil water resources from species-rich forests can be depleted faster than in the stands dominated purely by F. sylvatica. However, there are specific conditions in different ecosystems. A negative relation between species diversity and tree vitality has been shown in temperate, boreal, steppe, dry, and humid Mediterranean climates [75].
We showed that among the investigated groups of saplings in the understory, those saplings with a higher diameter at breast height (DBH) underwent more intense defoliation compared to those with lower DBH. This finding partly contradicts the assumption that resistance to environmental stress generally increases with ontogeny [26]. Since larger saplings need more resources to ensure their survival under mature tree canopies than smaller saplings [46], this can explain their higher defoliation under drought stress. Tree diameter may play an important role in the resistance, recovery, and resilience of the trees to drought. However, there is no general agreement whether smaller or larger trees are more vulnerable to drought because this depends on the site conditions and the duration of the drought.
As expected, the cover of saplings decreased with their vitality in 2019 (Figure 5c). Therefore, their photosynthetic tissue was not yet fully recovered. However, we should consider that sapling recovery is species-dependent. Our results also show that saplings growing under mature trees with a large canopy cover exhibit a lower vitality (Figure 5c). These results indicate that the relationship between mature trees and saplings is not only characterized by facilitation, but can promote higher susceptibility to drought stress and affect the sapling’s recovery. Partly similar to our results, it was shown that the crown dieback of saplings and mature trees of F. sylvatica can decrease with the soil water storage, plant height, species diversity, and light availability [81]. In our case, soil available water capacity (AWC) did not show a significant relationship with sapling vitality. However, saplings growing in luvisol were more susceptible to drought damage.
Extreme drought episodes are predicted to re-emerge in Bavaria with a higher intensity and frequency. The historic climate, warm temperate, and fully humid (Cfb) climate is predicted to change to a warmer/wetter climate in the wintertime and warmer/drier climate during spring and summer [82]. Winter precipitation is more likely to cause run-off and floods than to increase plant water availability [82]. This will have a great impact on plant growth [7]. Therefore, for efficient mitigation of climate change impacts on broadleaved tree species, it is critical to understand and include the effect of drought on saplings in the development of future forest management strategies.

5. Conclusions

In the understory of Central European forest ecosystems, tree sapling defoliation intensity and the recovery rate were affected by drought in a species-dependent way. This can affect the trajectories of natural regeneration in forest development. It needs to be understood how extreme drought influences juvenile trees in the understory, which cannot be monitored by remote sensing. Although more than 50% of the tree saplings experienced defoliation during the drought in 2018, the recovery rate was high in 2019. We identified that F. sylvatica and B. pendula saplings were capable of withstanding and surviving the extreme drought better than other species, whereas C. betulus and S. aucuparia recovered faster than F. sylvatica, Quercus spp., Crataegus spp., and B. pendula species. Moreover, forest stands with high sapling species diversity appear to have a reduced vitality under drought conditions. Until now, it cannot be disentangled whether this is an effect of interspecific competition or higher species richness on naturally resource-limited stands. Sapling vitality was also related to the canopy cover and the soil type, however, further work needs to be focused on the interaction of saplings and mature tree species under drought stress. These findings can help to design adapted long-term strategies for forest management in the face of an increasing likelihood of extreme climatic conditions.

Supplementary Materials

The following are available online at https://www.mdpi.com/1999-4907/11/5/546/s1. Supplementary Materials 1. Climatic variables and vitality of tree saplings per species. Supplementary Materials 2. Vitality of the tree saplings corresponding to the soil type. Supplementary Materials 3: Standardized Precipitation Evapotranspiration Index (SPEI) for the study area.

Author Contributions

M.B. and C.B. contributed to the formulation of the study; M.B., R.S., and C.B. collected the data; M.B. analyzed the data; M.B. wrote the paper; C.B. reviewed the paper. We thank the three anonymous reviewers for their pertinent comments which greatly improved the manuscript. All authors have read and agreed to the published version of the manuscript.

Funding

This research received no external funding.

Acknowledgments

The authors would like to thank Any Mary Petritan for their critical review of the manuscript; Samuel Hoffmann, Frank Weiser, David Kienle, Andreas von Heßberg for their support during the fieldwork; and Bernd Berauer for the useful discussions on the manuscript.

Conflicts of Interest

The authors declare no conflicts of interest.

References

  1. IPCC. Climate Change and Land: An IPCC Special Report on Climate Change, Desertification, Land Degradation, Sustainable Land Management, Food Security, and Greenhouse Gas Fluxes in Terrestrial Ecosystems; Shukla, P.R., Skea, J., Calvo Buendia, E., Masson-Delmotte, V., Pörtner, H.O., Roberts, D.C., Zhai, P., Slade, R., Connors, S., Van Diemen, R., et al., Eds.; IPCC: Geneva, Switzerland, 2019; in press. [Google Scholar]
  2. Meehl, G.A.; Tebaldi, C. More intense, more frequent, and longer lasting heat waves in the 21st century. Science 2004, 305, 994–997. [Google Scholar] [CrossRef] [PubMed] [Green Version]
  3. IPCC Managing the Risks of Extreme Events and Disasters to Advance Climate Change Adaptation: Special Report of the Intergovernmental Panel on Climate Change; Field, C.B.; Barros, V.; Stocker, T.F.; Dahe, Q. (Eds.) Cambridge University Press: Cambridge, UK, 2012. [Google Scholar]
  4. Beck, H.E.; Zimmermann, N.E.; McVicar, T.R.; Vergopolan, N.; Berg, A.; Wood, E.F. Present and future Köppen-Geiger climate classification maps at 1-km resolution. Sci. Data 2018, 5, 180214. [Google Scholar] [CrossRef] [PubMed] [Green Version]
  5. Schär, C.; Vidale, P.L.; Lüthi, D.; Frei, C.; Häberli, C.; Liniger, M.A.; Appenzeller, C. The role of increasing temperature variability in European summer heatwaves. Nature 2004, 427, 332–336. [Google Scholar] [CrossRef]
  6. Leuzinger, S.; Zotz, G.; Asshoff, R.; Korner, C. Responses of deciduous forest trees to severe drought in Central Europe. Tree Physiol. 2005, 25, 641–650. [Google Scholar] [CrossRef] [Green Version]
  7. Ciais, P.; Reichstein, M.; Viovy, N.; Granier, A.; Ogée, J.; Allard, V.; Aubinet, M.; Buchmann, N.; Bernhofer, C.; Carrara, A.; et al. Europe-wide reduction in primary productivity caused by the heat and drought in 2003. Nature 2005, 437, 529–533. [Google Scholar] [CrossRef]
  8. Rebetez, M.; Mayer, H.; Dupont, O.; Schindler, D.; Gartner, K.; Kropp, J.P.; Menzel, A. Heat and drought 2003 in Europe: A climate synthesis. Ann. For. Sci. 2006, 63, 569–577. [Google Scholar] [CrossRef] [Green Version]
  9. Buras, A.; Schunk, C.; Zeiträg, C.; Herrmann, C.; Kaiser, L.; Lemme, H.; Straub, C.; Taeger, S.; Gößwein, S.; Klemmt, H.-J.; et al. Are Scots pine forest edges particularly prone to drought-induced mortality? Environ. Res. Lett. 2018, 13, 025001. [Google Scholar] [CrossRef]
  10. Hanel, M.; Rakovec, O.; Markonis, Y.; Máca, P.; Samaniego, L.; Kyselý, J.; Kumar, R. Revisiting the recent European droughts from a long-term perspective. Sci. Rep. 2018, 8, 9499. [Google Scholar] [CrossRef]
  11. Trenberth, K.E.; Fasullo, J.T. Climate extremes and climate change: The Russian heat wave and other climate extremes of 2010. J. Geophys. Res. Atmos. 2012, 117. [Google Scholar] [CrossRef]
  12. Luterbacher, J. European seasonal and annual temperature variability, trends, and extremes since 1500. Science 2004, 303, 1499–1503. [Google Scholar] [CrossRef] [PubMed] [Green Version]
  13. Jentsch, A.; Kreyling, J.; Beierkuhnlein, C. A new generation of climate-change experiments: Events, not trends. Front. Ecol. Environ. 2007, 5, 365–374. [Google Scholar] [CrossRef]
  14. Bréda, N.; Huc, R.; Granier, A.; Dreyer, E. Temperate forest trees and stands under severe drought: A review of ecophysiological responses, adaptation processes and long-term consequences. Ann. For. Sci. 2006, 63, 625–644. [Google Scholar] [CrossRef] [Green Version]
  15. Allen, C.D.; Macalady, A.K.; Chenchouni, H.; Bachelet, D.; McDowell, N.; Vennetier, M.; Kitzberger, T.; Rigling, A.; Breshears, D.D.; Hogg, E.H.; et al. A global overview of drought and heat-induced tree mortality reveals emerging climate change risks for forests. For. Ecol. Manag. 2010, 259, 660–684. [Google Scholar] [CrossRef] [Green Version]
  16. Bohn, U.; Neuhäusl, R. Karte der Natürlichen Vegetation Europas/Map of the Natural Vegetation of Europe. Maßstab/Scale 1:2,500,000; Landwirtschaftsverlag: Münster, Germany, 2003. [Google Scholar]
  17. Beierkuhnlein, C. Biogeographie: Die räumliche Organisation des Lebens in Einer sich Verändernden Welt UTB 8341 Biologie; Ulmer: Stuttgart, Germany, 2007; ISBN 978-3-8001-2836-5. [Google Scholar]
  18. Zimmermann, J.; Hauck, M.; Dulamsuren, C.; Leuschner, C. Climate warming-related growth decline affects Fagus sylvatica, but not other broad-Leaved tree species in Central European mixed forests. Ecosystems 2015, 18, 560–572. [Google Scholar] [CrossRef]
  19. Knutzen, F.; Dulamsuren, C.; Meier, I.C.; Leuschner, C. Recent climate warming-related growth decline impairs European beech in the center of its distribution range. Ecosystems 2017, 20, 1494–1511. [Google Scholar] [CrossRef]
  20. Kunz, J.; Räder, A.; Bauhus, J. Effects of drought and rewetting on growth and gas exchange of minor European broadleaved tree species. Forests 2016, 7, 239. [Google Scholar] [CrossRef]
  21. Kunz, J.; Löffler, G.; Bauhus, J. Minor European broadleaved tree species are more drought-tolerant than Fagus sylvatica but not more tolerant than Quercus petraea. For. Ecol. Manag. 2018, 414, 15–27. [Google Scholar] [CrossRef]
  22. Metz, J.; Annighöfer, P.; Schall, P.; Zimmermann, J.; Kahl, T.; Schulze, E.-D.; Ammer, C. Site-adapted admixed tree species reduce drought susceptibility of mature European beech. Glob. Chang. Biol. 2016, 22, 903–920. [Google Scholar] [CrossRef]
  23. Grossiord, C. Having the right neighbors: How tree species diversity modulates drought impacts on forests. New Phytol. 2018. [Google Scholar] [CrossRef] [Green Version]
  24. Cavin, L.; Mountford, E.P.; Peterken, G.F.; Jump, A.S. Extreme drought alters competitive dominance within and between tree species in a mixed forest stand. Funct. Ecol. 2013, 27, 1424–1435. [Google Scholar] [CrossRef]
  25. Chazdon, R.L. Landscape restoration, natural regeneration, and the forests of the future. Ann. Mo. Bot. Gard. 2017, 102, 251–257. [Google Scholar] [CrossRef]
  26. Niinemets, Ü. Responses of forest trees to single and multiple environmental stresses from seedlings to mature plants: Past stress history, stress interactions, tolerance and acclimation. For. Ecol. Manag. 2010, 260, 1623–1639. [Google Scholar] [CrossRef]
  27. Hölscher, D.; Koch, O.; Korn, S.; Leuschner, C. Sap flux of five co-occurring tree species in a temperate broad-leaved forest during seasonal soil drought. Trees 2005, 19, 628–637. [Google Scholar] [CrossRef]
  28. Dobbertin, M. Tree growth as indicator of tree vitality and of tree reaction to environmental stress: A review. Eur. J. For. Res. 2005, 124, 319–333. [Google Scholar] [CrossRef]
  29. Dobbertin, M.; Brang, P. Crown defoliation improves tree mortality models. For. Ecol. Manag. 2001, 141, 271–284. [Google Scholar] [CrossRef]
  30. Carnicer, J.; Coll, M.; Ninyerola, M.; Pons, X.; Sanchez, G.; Penuelas, J. Widespread crown condition decline, food web disruption, and amplified tree mortality with increased climate change-type drought. Proc. Natl. Acad. Sci. USA 2011, 108, 1474–1478. [Google Scholar] [CrossRef] [Green Version]
  31. Muffler, L.; Beierkuhnlein, C.; Aas, G.; Jentsch, A.; Schweiger, A.H.; Zohner, C.; Kreyling, J. Distribution ranges and spring phenology explain late frost sensitivity in 170 woody plants from the Northern Hemisphere: Late frost sensitivity of woody species. Glob. Ecol. Biogeogr. 2016, 25, 1061–1071. [Google Scholar] [CrossRef]
  32. Mette, T.; Dolos, K.; Meinardus, C.; Bräuning, A.; Reineking, B.; Blaschke, M.; Pretzsch, H.; Beierkuhnlein, C.; Gohlke, A.; Wellstein, C. Climatic turning point for beech and oak under climate change in Central Europe. Ecosphere 2013, 4, 145. [Google Scholar] [CrossRef]
  33. Panagos, P.; Van Liedekerke, M.; Jones, A.; Montanarella, L. European Soil Data Centre: Response to European policy support and public data requirements. Land Use Policy 2012, 29, 329–338. [Google Scholar] [CrossRef]
  34. European Commission. The European Soil Database (v2.0)—1kmx1km. Available online: https://esdac.jrc.ec.europa.eu/content/european-soil-database-v20-vector-and-attribute-data (accessed on 3 April 2019).
  35. Ballabio, C.; Panagos, P.; Monatanarella, L. Mapping topsoil physical properties at European scale using the LUCAS database. Geoderma 2016, 261, 110–123. [Google Scholar] [CrossRef]
  36. European Environment Agency. European Digital Elevation Model (EU-DEM), Version 1.1. Available online: https://land.copernicus.eu/imagery-in-situ/eu-dem/eu-dem-v1.1 (accessed on 13 March 2019).
  37. BKG Federal Agency for Cartography and Geodesy. Digitales Landschaftsmodell 1:250,000 (DLM250). Available online: https://mis.bkg.bund.de/trefferanzeige?docuuid=fe53b281-fc8c-4f42-bee5-dc1d27acc2b0 (accessed on 3 March 2019).
  38. DWD. Climate Data Center (CDC): Grids of Monthly Total Precipitation over Germany, Version v1.0. Available online: https://opendata.dwd.de (accessed on 6 January 2019).
  39. DWD. Climate Data Center (CDC): Grids of Monthly Averaged Daily Air Temperature (2m) over Germany, Version v1.0. Available online: https://opendata.dwd.de (accessed on 6 January 2019).
  40. Bitterlich, W. Die Winkelzählprobe. Forstwiss. Centralblatt 1952, 71, 215–225. [Google Scholar] [CrossRef]
  41. Mangiafico, S. Functions to Support Extension Education Program Evaluation, R Package ‘Rcompanion, R Package Version 2.3.25. 2019. Available online: https://cran.r-project.org/web/packages/rcompanion/rcompanion.pdf (accessed on 10 December 2019).
  42. Lloret, F.; Keeling, E.G.; Sala, A. Components of tree resilience: Effects of successive low-growth episodes in old ponderosa pine forests. Oikos 2011, 120, 1909–1920. [Google Scholar] [CrossRef]
  43. Oksanen, J.; Blanchet, G.F.; Friendly, M.; Kindt, R.; Legendre, P.; McGlinn, D.; Minchin, P.R.; O’Hara, R.B.; Simpson, G.L.; Solymos, P.; et al. Vegan: Community Ecology Package, R Package Version 2.5-6. Available online: https://cran.r-project.org/web/packages/vegan/vegan.pdf (accessed on 4 March 2020).
  44. Vicente-Serrano, S.M.; Beguería, S.; López-Moreno, J.I. A multiscalar drought index sensitive to global warming: The standardized precipitation evapotranspiration index. J. Clim. 2010, 23, 1696–1718. [Google Scholar] [CrossRef] [Green Version]
  45. R Core Team. R: A Language and Environment for Statistical Computing; R Foundation for Statistical Computing: Vienna, Austria; Available online: https://www.r-project.org/ (accessed on 2 April 2018).
  46. Waring, R.H. Characteristics of trees predisposed to die. BioScience 1987, 37, 569–574. [Google Scholar] [CrossRef]
  47. Reichstein, M.; Ciais, P.; Papale, D.; Valentini, R.; Running, S.; Viovy, N.; Cramer, W.; Granier, A.; Ogée, J.; Allard, V.; et al. Reduction of ecosystem productivity and respiration during the European summer 2003 climate anomaly: A joint flux tower, remote sensing and modelling analysis. Glob. Chang. Biol. 2007, 13, 634–651. [Google Scholar] [CrossRef]
  48. Yavitt, J.B.; Wright, S.J.; Wieder, R.K. Seasonal drought and dry-season irrigation influence leaf-litter nutrients and soil enzymes in a moist, lowland forest in Panama. Aust. Ecol. 2004, 29, 177–188. [Google Scholar] [CrossRef]
  49. Pretzsch, H.; Schütze, G.; Uhl, E. Resistance of European tree species to drought stress in mixed versus pure forests: Evidence of stress release by inter-specific facilitation. Plant Biol. 2013, 15, 483–495. [Google Scholar] [CrossRef]
  50. Lloret, F.; Siscart, D.; Dalmases, C. Canopy recovery after drought dieback in holm-oak Mediterranean forests of Catalonia (NE Spain). Glob. Chang. Biol. 2004, 10, 2092–2099. [Google Scholar] [CrossRef]
  51. Park Williams, A.; Allen, C.D.; Macalady, A.K.; Griffin, D.; Woodhouse, C.A.; Meko, D.M.; Swetnam, T.W.; Rauscher, S.A.; Seager, R.; Grissino-Mayer, H.D.; et al. Temperature as a potent driver of regional forest drought stress and tree mortality. Nat. Clim. Chang. 2013, 3, 292–297. [Google Scholar] [CrossRef]
  52. Galiano, L.; Martínez-Vilalta, J.; Lloret, F. Carbon reserves and canopy defoliation determine the recovery of Scots pine 4 yr after a drought episode. N. Phytol. 2011, 190, 750–759. [Google Scholar] [CrossRef]
  53. Raspé, O.; Findlay, C.; Jacquemart, A.-L. Sorbus aucuparia L. J. Ecol. 2000, 88, 910–930. [Google Scholar] [CrossRef]
  54. Grace, J. Impacts of climate change on the tree line. Ann. Bot. 2002, 90, 537–544. [Google Scholar] [CrossRef] [PubMed] [Green Version]
  55. Harrison, P.A.; Berry, P.M.; Butt, N.; New, M. Modelling climate change impacts on species’ distributions at the European scale: Implications for conservation policy. Environ. Sci. Policy 2006, 9, 116–128. [Google Scholar] [CrossRef]
  56. Räty, M.; Caudullo, G.; de Rigo, D. Sorbus Aucuparia in Europe: Distribution, habitat, usage and threats. In European Atlas of Forest Tree Species; Publication Office of the European Union: Luxembourg, 2016. [Google Scholar]
  57. Mauer, O.; Palátová, E. Mountain ash (Sorbus aucuparia L.) root system morphogenesis. J. For. Sci. 2002, 48, 342–350. [Google Scholar]
  58. Dyderski, M.K.; Paź, S.; Frelich, L.E.; Jagodziński, A.M. How much does climate change threaten European forest tree species distributions? Glob. Chang. Biol. 2018, 24, 1150–1163. [Google Scholar] [CrossRef] [PubMed]
  59. Zang, U.; Goisser, M.; Häberle, K.-H.; Matyssek, R.; Matzner, E.; Borken, W. Effects of drought stress on photosynthesis, rhizosphere respiration, and fine-root characteristics of beech saplings: A rhizotron field study. J. Plant Nutr. Soil Sci. 2014, 177, 168–177. [Google Scholar] [CrossRef]
  60. Gallé, A.; Haldimann, P.; Feller, U. Photosynthetic performance and water relations in young pubescent oak (Quercus pubescens) trees during drought stress and recovery. N. Phytol. 2007, 174, 799–810. [Google Scholar] [CrossRef]
  61. Gallé, A.; Feller, U. Changes of photosynthetic traits in beech saplings (Fagus sylvatica) under severe drought stress and during recovery. Physiol. Plant. 2007, 131, 412–421. [Google Scholar] [CrossRef]
  62. Leuschner, C.; Backes, K.; Hertel, D.; Schipka, F.; Schmitt, U.; Terborg, O.; Runge, M. Drought responses at leaf, stem and fine root levels of competitive Fagus sylvatica L. and Quercus petraea (Matt.) Liebl. trees in dry and wet years. For. Ecol. Manag. 2001, 149, 33–46. [Google Scholar] [CrossRef]
  63. Zapater, M.; Hossann, C.; Bréda, N.; Bréchet, C.; Bonal, D.; Granier, A. Evidence of hydraulic lift in a young beech and oak mixed forest using 18O soil water labelling. Trees 2011, 25, 885–894. [Google Scholar] [CrossRef]
  64. Eaton, E.; Caudullo, G.; Oliveira, S.; de Rigo, D. Quercus robur and Quercus petraea. In European Atlas of Forest Tree Species; Publication Office of the European Union: Luxembourg, 2016. [Google Scholar]
  65. Beck, P.; Caudullo, G.; de Rigo, D.; Tinner, W. Betula pendula and Betula pubescens. In European Atlas of Forest Tree Species; Publication Office of the European Union: Luxembourg, 2016. [Google Scholar]
  66. Petritan, A.M.; Von Lupke, B.; Petritan, I.C. Effects of shade on growth and mortality of maple (Acer pseudoplatanus), ash (Fraxinus excelsior) and beech (Fagus sylvatica) saplings. Forestry 2007, 80, 397–412. [Google Scholar] [CrossRef]
  67. Enescu, C.M.; Durrant, T.H.; Caudullo, G. Sambucus nigra in Europe: Distribution, habitat, usage and threats. In European Atlas of Forest Tree Species; Publication Office of the European Union: Luxembourg, 2016. [Google Scholar]
  68. Pasta, S.; de Rigo, D.; Caudullo, G. Acer pseudoplatanus in Europe: Distribution, habitat, usage and threats. In European Atlas of Forest Tree Species; Publication Office of the European Union: Luxembourg, 2016. [Google Scholar]
  69. Godwin, H. Frangula alnus Miller. J. Ecol. 1943, 31, 77. [Google Scholar] [CrossRef]
  70. Stokdyk, J.P.; Herrman, K.S. Short-term impacts of Frangula alnus litter on forest soil properties. Water Air Soil Pollut. 2014, 225, 2000. [Google Scholar] [CrossRef]
  71. Sikkema, R.; Caudullo, G.; de Rigo, D. Carpinus betulus in Europe: Distribution, habitat, usage and threats. In European Atlas of Forest Tree Species; Publication Office of the European Union: Luxembourg, 2016. [Google Scholar]
  72. Walentowski, H.; Falk, W.; Mette, T.; Kunz, J.; Bräuning, A.; Meinardus, C.; Zang, C.; Sutcliffe, L.M.E.; Leuschner, C. Assessing future suitability of tree species under climate change by multiple methods: A case study in southern Germany. Ann. For. Res. 2017, 60. [Google Scholar] [CrossRef] [Green Version]
  73. Grossiord, C.; Granier, A.; Ratcliffe, S.; Bouriaud, O.; Bruelheide, H.; Checko, E.; Forrester, D.I.; Dawud, S.M.; Finer, L.; Pollastrini, M.; et al. Tree diversity does not always improve resistance of forest ecosystems to drought. Proc. Natl. Acad. Sci. USA 2014, 111, 14812–14815. [Google Scholar] [CrossRef] [Green Version]
  74. Ratcliffe, S.; Wirth, C.; Jucker, T.; van der Plas, F.; Scherer-Lorenzen, M.; Verheyen, K.; Allan, E.; Benavides, R.; Bruelheide, H.; Ohse, B.; et al. Biodiversity and ecosystem functioning relations in European forests depend on environmental context. Ecol. Lett. 2017, 20, 1414–1426. [Google Scholar] [CrossRef]
  75. Paquette, A.; Vayreda, J.; Coll, L.; Messier, C.; Retana, J. Climate change could negate positive tree diversity effects on forest productivity: A study across five climate types in Spain and Canada. Ecosystems 2018, 21, 960–970. [Google Scholar] [CrossRef] [Green Version]
  76. Sousa-Silva, R.; Verheyen, K.; Ponette, Q.; Bay, E.; Sioen, G.; Titeux, H.; Van de Peer, T.; Van Meerbeek, K.; Muys, B. Tree diversity mitigates defoliation after a drought-induced tipping point. Glob. Chang. Biol. 2018, 24, 4304–4315. [Google Scholar] [CrossRef]
  77. Jucker, T.; Avăcăriței, D.; Bărnoaiea, I.; Duduman, G.; Bouriaud, O.; Coomes, D.A. Climate modulates the effects of tree diversity on forest productivity. J. Ecol. 2016, 104, 388–398. [Google Scholar] [CrossRef] [Green Version]
  78. Jucker, T.; Bouriaud, O.; Avacaritei, D.; Dănilă, I.; Duduman, G.; Valladares, F.; Coomes, D.A. Competition for light and water play contrasting roles in driving diversity–productivity relationships in Iberian forests. J. Ecol. 2014, 102, 1202–1213. [Google Scholar] [CrossRef] [Green Version]
  79. Schume, H.; Jost, G.; Hager, H. Soil water depletion and recharge patterns in mixed and pure forest stands of European beech and Norway spruce. J. Hydrol. 2004, 289, 258–274. [Google Scholar] [CrossRef]
  80. Krämer, I.; Hölscher, D. Soil water dynamics along a tree diversity gradient in a deciduous forest in Central Germany. Ecohydrology 2010, 3, 262–271. [Google Scholar] [CrossRef]
  81. Chakraborty, T.; Saha, S.; Matzarakis, A.; Reif, A. Influence of multiple biotic and abiotic factors on the crown die-back of European beech trees at their drought limit. Flora 2017, 229, 58–70. [Google Scholar] [CrossRef]
  82. Estrella, N.; Menzel, A. Recent and future climate extremes arising from changes to the bivariate distribution of temperature and precipitation in Bavaria, Germany. Int. J. Climatol. 2013, 33, 1687–1695. [Google Scholar] [CrossRef]
Figure 1. Location of the 218 plots in the three forest types. Forest cover based on digital landscape model (DLM) 1:250,000 (DLM250), © GeoBasis-DE/BKG 2020.
Forests 11 00546 g001
Figure 2. Monthly average precipitation from January to December for the period 2000–2017, 2018, and 2019 at the study site. The precipitation data were extracted from the raster dataset (1 × 1 km) of the German Meteorological Service.
Forests 11 00546 g002
Figure 3. Vitality classes of all saplings (n = 2051). (a) Assessment of sapling vitality and their survival after the drought of 2018. The barplot on the left (2018) shows the fraction of saplings belonging to each category of vitality measured in 2018. The barplot on the right (2019) shows the fraction of saplings that have retained the same vitality, increased, or decreased their vitality. (b) Differences in sapling vitality classes between 2018 and 2019 for all saplings. (cg) Vitality of Fagus sylvatica, Carpinus betulus, Quercus spp., Betula pendula, and Sorbus aucuparia in 2018 and one year later (2019). Vitality 1 = undamaged, 2 = partly damaged, 3 = completely damaged saplings. Stars show the statistically significant difference between vitality groups based on Fisher’s exact test (* p < 0.05, ** p < 0.01, *** p < 0.001).
Forests 11 00546 g003
Figure 4. Sapling recovery index and species significance. Values < 1 indicate decline in performance, > 1 indicate increase in performance after the event and 1 indicates same state as during the event (colors: blue > 1, orange = 1, grey = not significant). Ac_ps—Acer pseudoplatanus; Be_pe—Betula pendula; Ca_be—Carpinus betulus; Co_av—Corylus avellana; Cr_sp—Crataegus spp.; Fa_sy—Fagus sylvatica; Fr_al—Frangula alnus; Qu_sp—Quercus spp.; Sa_ni—Sambucus nigra; and So_au—Sorbus aucuparia. Stars show the statistical significance between species (* p < 0.05, *** p < 0.001, **** p < 0.0001).
Forests 11 00546 g004
Figure 5. Shannon diversity index for all tree species and sapling vitality per plot in 2018 (a) and 2019 (b). (c) Sapling vitality and sapling cover (%); (d) Sapling vitality and mature tree cover (%). (a) The 53 plots undamaged and 160 damaged in 2018; (bd) The 159 plots with saplings undamaged and 54 plots with saplings damaged in 2019.
Forests 11 00546 g005
Figure 6. Sapling vitality and diameter at breast height (DBH) for all saplings (n = 2051). (a) Sapling vitality in 2018, 718 undamaged, and 1333 damaged saplings; (b) Sapling vitality in 2019, 1480 undamaged, and 571 damaged saplings.
Forests 11 00546 g006
Table 1. Ten most abundant tree saplings measured in 2018 and 2019 (1777 individuals) for their diameter at breast height (DBH) and vitality (1 = undamaged, 2 = partly damaged, 3 = completely damaged).
SpeciesNo./PlotDBH (mm)
(Mean, Min–Max)
Vitality 2018Vitality 2019
123123
Fagus sylvatica772/14121 (1–94)3653179061111744
Sorbus aucuparia221/7820 (2–70)24127701574420
Carpinus betulus172/4820 (2–82)2012923139249
Betula pendula145/4118 (2–63)666811115255
Quercus spp.113/4425 (2–79)3672565444
Acer pseudoplatanus103/4819 (1–57)3654138887
Corylus avellana99/5316 (1–54)3654977175
Frangula alnus52/2217 (1–44)83593985
Sambucus nigra52/2016 (3–63)16191724226
Crataegus spp.48/2723 (1–70)1828231152

