Abstract
Although photosynthesis (carbohydrate production) decreases under wind load, it is unclear how carbohydrate categories allocation changes. We determined the leaf morphology (specific leaf area (SLA), needle thickness), anatomy (cuticle thickness, epidermal thickness), photosynthesis (effective quantum yield of Photosystem II (Y(II)), carbohydrate (structure carbohydrate (SC) and non-structure carbohydrate (NSC)), and environmental variables in Pinus thunbergii plantations from coast to inland, with wind speed decreasing. As expected, wind, accounting for 19–69% of the total variation, was the most dominant environmental variable determining the leaf traits. Y(II) and NSC increased, while SC and SC/NSC decreased along the coast-inland gradients (p < 0.01). These results confirmed that, although carbohydrate production decreased, SC allocation increased with increasing wind load. SLA and needle thickness decreased, while cuticle thickness and epidermal thickness increased from coast to inland. Needle thickness and cuticle thickness showed strong correlations to SC/NSC. These variations indicated that carbohydrate categories allocation related to variations of needle morphology and anatomy for P. thunbergii under wind, because of more SC allocation in leaf to support tensile strength and hardness of the cell wall under wind. Therefore, allocation between SC and NSC may be helpful for understanding the long-term adaptation of plants to wind load.
1. Introduction
Wind, as one of most ubiquitous environmental stresses, impacts the growth and development of plants [1,2]. Responses of plants to wind has become a focus recently, and usually stress from wind results in a reduction of plants height and/or an increase in plants radial growth [3,4,5,6].
The response of leaf morphology, anatomy, and physiology to wind have also been studied previously. Both leaf area and specific leaf area (SLA) decrease [6,7], and leaf thickness, leaf cuticle, and epidermal thickness increase in windy environments [3,8,9]. Leaf photosynthesis (carbohydrates production) also decreases due to the inhibition of photosynthetic systems and a reduction in photosynthetic area by wind [2,10,11].
Although total carbohydrates (TC) decrease under windy conditions, soluble sugar usually increases to maintain osmotic pressure for the disturbance induced by wind, such as water loss and physical injury [12,13]. In addition, leaf cellulose and lignin were also found to increase support morphogenesis and restrict leaf tearing under wind [13,14]. However, it is less known about the carbohydrates categories allocation under wind, especially between structural carbohydrates (SC) and non-structural carbohydrates (NSCs). NSCs, such as starch and soluble sugar, sustains metabolic processes in plants. SC, mainly composed by cellulose and lignin, is the main component of cell wall framework [13,15]. Both lignin, the main component of secondary walls, and cellulose, the most abundant and common component of cell walls, are related to plant anatomy and morphology [14,16]. Therefore, it is likely that carbohydrate allocation between SC and NSC may be related to the adaptation of leaf anatomy and morphology to wind.
Wind speed gradually decreases from coast to inland [17,18], which provides a natural laboratory to explore long-term response and adaptation to wind for plants [6,19]. Plants may be also impacted, except of wind, by soil salinity and nutrient in coastal area with similar flat terrain [20,21,22]. Therefore, in this study, we determined leaf traits, including photosynthesis, carbohydrate categories, morphology, anatomy, and environment, such as wind speed, soil salinity and nutrient variables, from coast to inland in Pinus thunbergii plantations. The objectives of our study were to test (1) patterns of leaf SC and NSC allocation from coast to in land, and (2) the relationship between leaf SC and NSC allocation and leaf morphology, anatomy. Our study should be helpful for understanding the underlying mechanisms of the plants response and adaptation to wind load.
2. Material and Methods
2.1. Study Area and Experimental Design
The Japanese Black Pine, Pinus thunbergii Parl., native of eastern Asia, is adapted to coastal high salt and windy environments [23,24]. Our experimental site is located at Chengshan Forestry Farm (122.31° E, 37.23° N) in Shandong Province (Figure 1). The farm has 833 ha of pure P. thunbergii plantation with homogeneous age (60-year) and density (2 × 2 m) in coastal flat beach. The study area has a continental monsoon climate with average annual temperature of 11.4 °C and average annual precipitation of 793.2 mm. The prevailing wind direction is north, and soil type is infertile sandy soil.
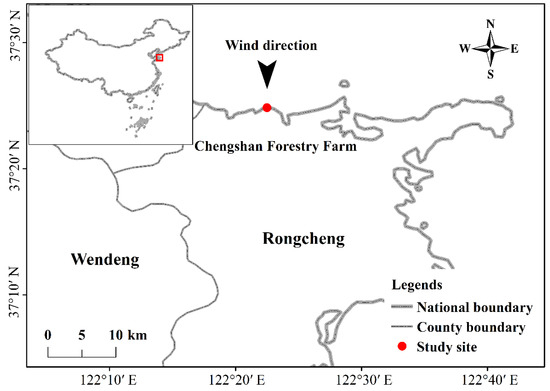
Figure 1.
Location of the study site.
Perpendicular to the coastline along the North–South direction, we set three 700-m transect lines at intervals of one kilometer. Eight plots, 10 × 10 m each, were established at 100 m interval along each transect line. As a result, a total of 24 plots were established. There is not any vegetation in front of Pinus thunbergii plantation at beach, so we defined the coast-inland gradients ranged from 0 to 700. The height (H) and diameter at breast height (DBH) for all trees, and wind speed, soil salinity and nutrient variables were all measured in each plot (Table 1). The abbreviations of part traits measured were listed (Table 2).

Table 1.
Stand characteristics of Pinus thunbergii plantations.
Table 2.
Abbreviations and definitions of traits in this study.
2.2. Sampling and Measurements
In September 2016, an anemograph (Kestrel-4000, Minneapolis, Minnesota, USA) was installed in the upper canopy by an experienced climber in each plot, the interval of data recording was two minutes, and the observation was repeated continuously for ten days. Based on the measured H and DBH, three average trees in each plot were randomly selected for fluorescence measurement and needles collection. Soil salinity was measured using a calibrated real-time conductivity meter (Testo 240, Testo AG, Lenzkirch, Germany) at five randomly selected locations in each plot. Moreover, five soil cores (0–20 cm) were collected using a 2.5 cm diameter soil auger. The five points were then combined into one composite soil sample. Photosystem II photochemistry is considered the most sensitive to environmental stress [25], and effective quantum yield of Photosystem II (Y(II)) is an important parameter of photochemical reaction which reflects actual efficiency of Photosystem II [26]. Therefore, we selected Y(II) as a physiological index. When the elongation of the current shoots was complete, several end branches without attack of pests in the middle part of the windward canopy, were detached using pruners from each sample tree [27], then immediately recut under water for fluorescence measurements within 10 min using a portable fluorometer (PAM 2100, Walz, Effeltrich, Germany) [28,29].
Ten mature and healthy current-year pooled needles (five fascicles) at the identical sample branches from the three sample trees in each plot were fixed in FAA (formaldehyde: glacial acetic acid: alcohol = 5:5:90) [27]. Transverse sections were made by cutting vertically in the middle part of the needle with a sharp razor blade. The transverse sections were stained in a 0.05% toluidine blue solution for at least 2 min, and then transferred to microscope slides, rinsed with pure water and photographed at 200× and 400× magnifications with a light microscope (Leica DM2500, Wetzlar, Germany). Digital photos were scaled and analyzed with Image J software (NIH, Bethesda, MD, USA) to determine needle thickness, cuticle thickness, and epidermal thickness.
Meanwhile, one hundred mature and healthy current year pooled needles (fifty fascicles) from the identical samples branches for each plot were randomly selected to be scanned for determining the projected area using the Wseen Leaf Area Analysis Systems (Wseen Co., Ltd., Hangzhou, China) in laboratory. Then samples were oven-dried at 60 °C for at least 72 h to determine dry leaf mass for calculation of SLA (cm2 g−1).
At last, 1 kg mature and healthy current year mixed needles from the three sample trees in each plot were selected to be oven dried to a constant weight, the soil samples were air-dried, and remaining roots and stones were removed by hand, and then dried needles and air-dried soils were ground using a plant sample mill (Shanghai, DS-T350) and sieved through a 60-mesh sieve (0.25 mm diameter) for chemical analysis.
2.3. Chemical Analyses
The soil total C was determined using a Multi CN/3000 analyzer (Analytic Jena AG, Jena, Germany). After the soil samples were digested using H2SO4, the soil total N was analyzed using Kjeltec KTM 2300 analyzer (Foss, Rose Scientific Ltd., Copenhagen, Denmark), and soil total P was determined utilizing molybdenum antimony colorimetric method. Starch and soluble sugar were determined respectively utilizing the method of Arndt et al. (2008) [30] and Hoch et al. (2002) [31]. Non-structural carbohydrates (NSC) content was calculated as the sum of soluble sugar and starch. Cellulose and lignin were determined following the method by Van Soest and Wine (1968) [32] with modifications. Structural carbohydrates (SC) content was calculated as the sum of lignin and cellulose. The results were expressed in percentages of mass.
2.4. Data Analysis
The data obtained for needle morphology, anatomy, and physiology exhibited normal distributions when tested using One-Sample Kolmogorov-Smirnov test (Appendix A Table A1).
Regression analysis was performed to test the photosynthesis, carbohydrate, morphology, and anatomy in relation to distance from the coastline, and the morphology and anatomy in relation to carbohydrate allocation. Hierarchical partitioning (HP) analysis was used to examine the effects of wind speed, soil salinity, and soil nutrient variables on leaf morphology, anatomy, photosynthesis, and carbohydrate. All analyses were performed using R statistical platform 3.3.0 (The University of Auckland, Auckland, New Zealand).
3. Results
3.1. Leaf Carbohydrate Production and Allocation from Coast to Inland
From coast to inland, Y(II) significantly (p < 0.01) increased from 0.63 ± 0.05 to 0.74 ± 0.02 (Figure 2). NSC increased (p < 0.01) from 9.58% ± 0.4% to 12.21% ± 0.77%, while SC decreased (p < 0.05) from 70.59% ± 1.03% to 65.29% ± 2.99% (Figure 3a,b). As a result, SC/NSC ratios also decreased (p < 0.001) (Figure 3c).
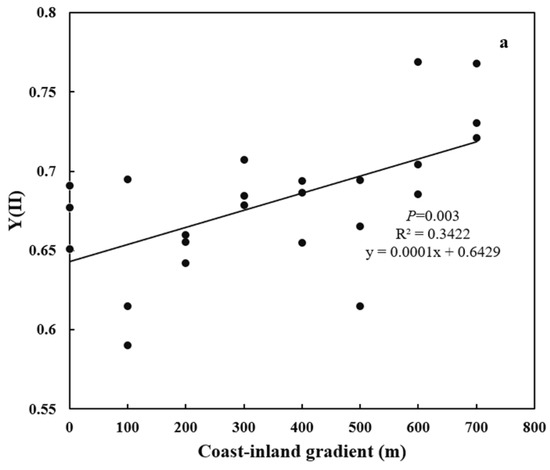
Figure 2.
Variations in Y(II) for P. thunbergii along the coast-inland gradient.
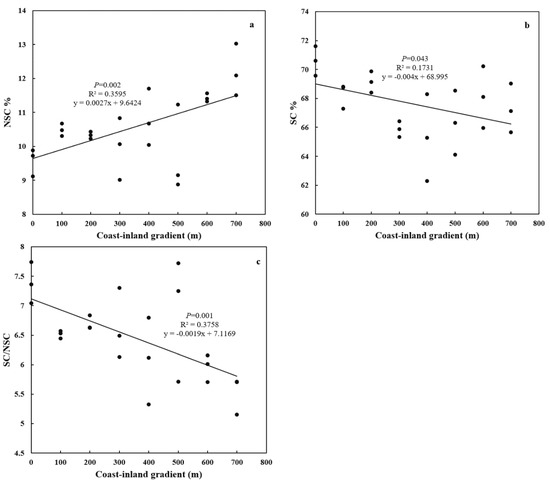
Figure 3.
Variations in leaf NSC and SC for P. thunbergii along the coast-inland gradient. (a) NSC, (b) SC, and (c) SC/NSC.
3.2. Leaf Morphology and Anatomy from Coast to Inland
Both special leaf area (SLA) and needle thickness increased (p < 0.0001) from coast (11.44 ± 0.02 cm2 g−1, 890.47 ± 26.42 μm) to inland (17.31 ± 0.038 cm2 g−1, 1298.17 ± 200.21 μm) (Figure 4a,b). Meanwhile, both epidermal thickness and cuticle thickness decreased (p < 0.0001) from 24.00 ± 0.025 μm and 5.16 ± 0.38 μm to 20.59 ± 0.874 μm and 3.49 ± 0.44 μm, respectively (Figure 5a,b). Needle thickness was negatively, while cuticle thickness was positively, related to SC/NSC (p < 0.01) (Figure 6a,b).
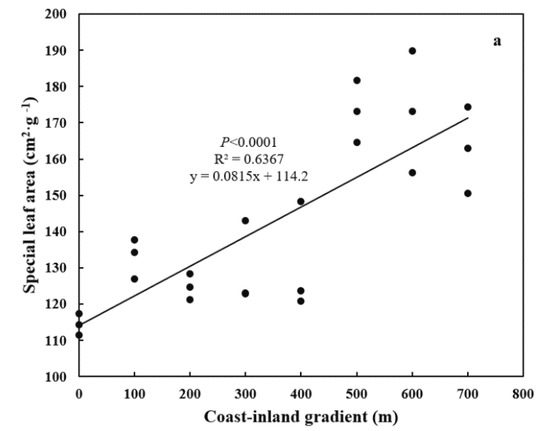
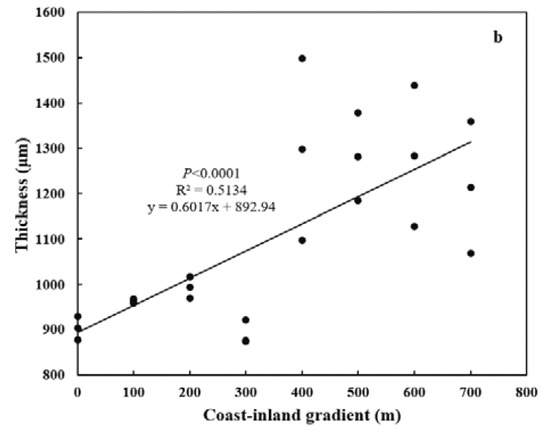
Figure 4.
Variations in leaf morphology for P. thunbergii along the coast-inland gradient. (a) Special leaf area (SLA), and (b) Leaf thickness.
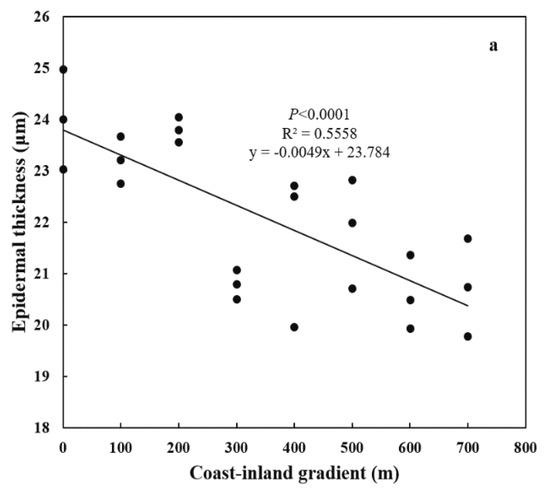
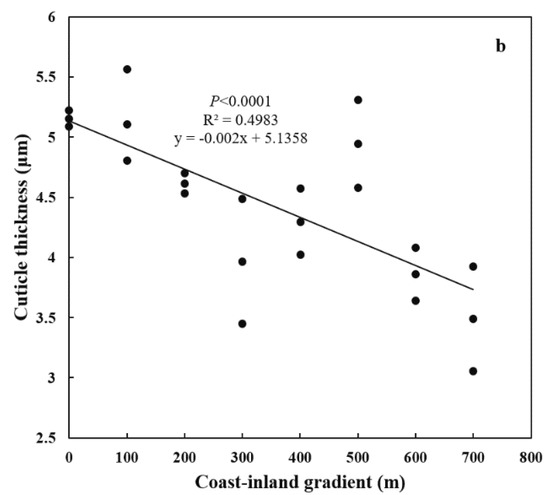
Figure 5.
Variations in leaf anatomy for P. thunbergii along the coast-inland gradient. (a) Epidermal thickness, and (b) Cuticle thickness.
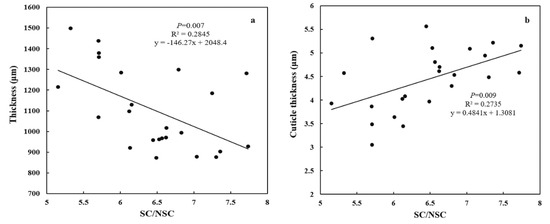
Figure 6.
The relationships between leaf carbohydrate categories and morphology and anatomy for P. thunbergii along the coast-inland gradient. (a) Leaf thickness and SC/NSC, and (b) Cuticle thickness and SC/NSC.
3.3. Effect of Environment on Leaf Traits along Coast-Inland Gradients
Hierarchical partitioning indicated that between 32% (in NSC) to 74% (in epidermal thickness) variation of leaf traits was accounted for by the chosen wind speed, soil salinity, and soil nutrients variables (Table 3). Wind, accounting for 19–69% of the total variation, was significantly associated with each leaf trait (p < 0.05), while soil variables, except of soil total P, were less impactful on the leaf traits.
Table 3.
Results of hierarchical partitioning for the effects of wind speed, salinity, and soil nutrient on leaf morphology, anatomy, photosynthesis, and carbohydrate of Pinus thunbergii along the coast-inland gradients.
4. Discussion
As expected, wind was the most dominant environmental factor determining the leaf traits along coast-inland gradients in this study. Under windy conditions, photosynthetic effective area would be reduced by leaf curl up [33], and the stomata may be closed to reduce water loss but increase the resistance to the entry of carbon dioxide into the leaf [10]. Therefore, it was not surprising that the photosynthetic capacity (Y(II)) was lower at coast with high wind speed than it at inland with low wind speed, which was consistent to the previous studies [2,11]. With the decreasing of photosynthetic production, carbohydrate category allocation also varied along the coast-inland gradients. We found that NSC was lower, while SC and SC/NSC were higher at coast with high wind speed than those inland with low wind speed. This might suggest, although carbohydrates production decreased, more carbohydrates were allocated to SC under windy conditions. For example, lignin concentrations increased from 28.63% inland to 30.26% at coast (Appendix A Figure A1), which was supported by the increasing activity of enzymes within the lignin synthesis pathway, such as peroxidase and phenyl ammonia-lyase, under wind load [34,35].
Leaf physical injury and physiological ill-effects, such as water loss, were often found for plant under wind load [1,10]. Therefore, leaf area and SLA would decrease to weaken the potential of leaf breakage under wind [3] and leaf thickness, especially blade surface thickness, increased to protect water [8,9,10,36]. Leaf cuticle and epidermal thickness increased, while SLA decreased under high wind speed which contributed to, first, increase leaf mechanical toughness to reduce leaf tearing and support morphogenesis [14,34], and second, increase the boundary layer thickness to reduce water loss [8,9,10,36].
However, needle thickness also increased from coast to inland with decreasing wind speed, which was unlike the results that leaf thickness increased with SLA decreased under windy conditions for broadleaf species in previously studied [3,7]. This may be due to the following two reasons: firstly, the decreased needle thickness should reduce needle surface area and volume, which may help to decrease drag and protect needles from wind load [10,37]; secondly, leaf area decreased (slope = −61.1) faster than mass (slope = −0.2) (Appendix A Figure A2), which was attributed to the case that thickening of the cuticle and epidermis retarded the decrease of mass.
Meanwhile, the good correlations between needle thickness, cuticle thickness and SC/NSC indicated that variations in carbohydrate categories allocations may be attributed to the adaptation of leaf morphology and anatomy for P. thunbergii under wind. Under wind, NSC, for mesophyll cell transverse division, were converted into SC, for cuticle cell wall construction, which to support tensile strength and hardness of cell wall, and increase leaf mechanical toughness and protect water [2,16,38]. Certainly there should be more experiments to verify the mechanism of carbohydrate allocation on leaf morphological adaptation to wind for plants in future.
5. Conclusions
This study is the first to reveal the changes in carbohydrate allocation between NSC and SC and their relationships to morphogenesis for a conifer along coast–inland gradients with decreasing wind speed. SC increased for cuticle cell wall thickening, and NSC decreased for mesophyll cell division with increasing wind load. Such allocation variations are significantly related to leaf morphology and anatomy. These results provided some insights into the adaption strategies of plants under wind load.
Author Contributions
P.Z., Y.W., and T.W. planned and designed the research. P.Z., Y.W., L.W. and H.Z. performed experiments, conducted fieldwork, analyzed data etc. P.Z., T.W., and G.G.W. wrote the manuscript. All authors have read and agreed to the published version of the manuscript.
Funding
This research was funded by National Natural Science Foundation of China (31770756).
Acknowledgments
We thank two anonymous reviewers and editor for their constructive suggestions on this manuscript.
Conflicts of Interest
The authors declare no conflict of interest.
Appendix A
Table A1.
One-Sample Kolmogorov-Smirnov Test.
Table A1.
One-Sample Kolmogorov-Smirnov Test.
| Y(II) | SC % | NSC % | SC/NSC | SLA (cm2 g−1) | Thickness (μm) | Epidermal Thickness (μm) | Cuticle Thickness (μm) | |
|---|---|---|---|---|---|---|---|---|
| N | 24 | 24 | 24 | 24 | 24 | 24 | 24 | 24 |
| Mean | 0.68 | 67.61 | 10.57 | 6.46 | 142.71 | 1103.54 | 22.08 | 4.48 |
| Std. deviation | 0.05 | 2.23 | 1.04 | 0.72 | 23.89 | 89.06 | 1.53 | 0.26 |
| Asymp. sig (2-tailed) | 0.20 | 0.19 | 0.20 | 0.31 | 0.28 | 0.34 | 0.23 | 0.20 |

Figure A1.
Variations in leaf lignin for P. thunbergii along the coast-inland gradient.

Figure A2.
The relationships between leaf area, mass and wind speed for P. thunbergii along the coast-inland gradient.
References
- Telewski, F.W. Is windswept tree growth negative thigmotropism? Plant Sci. 2012, 184, 20–28. [Google Scholar] [CrossRef] [PubMed]
- Reis, G.S.M.; de Almeida, A.F.; Mangabeira, P.A.O.; Dos Santos, I.C.; Pirovani, C.P.; Ahnert, D. Mechanical stress caused by wind on leaves of Theobroma cacao: Photosynthetic, molecular, antioxidative and ultrastructural responses. PLoS ONE 2018, 13, e0198274. [Google Scholar] [CrossRef] [PubMed]
- Anten, N.P.R.; Alcalá-Herrera, R.; Schieving, F.; Onoda, Y. Wind and mechanical stimuli differentially affect leaf traits in Plantago major. New Phytol. 2010, 188, 554–564. [Google Scholar] [CrossRef] [PubMed]
- Leblanc-Fournier, N.; Martin, L.; Lenne, C.; Decourteix, M. To respond or not to respond, the recurring question in plant mechanosensitivity. Front. Plant Sci. 2014, 5, 401. [Google Scholar] [CrossRef] [PubMed]
- Schymanski, S.J.; Or, D. Wind increases leaf water use efficiency. Plant Cell Environ. 2016, 39, 1448–1459. [Google Scholar] [CrossRef] [PubMed]
- Zhang, P.; Wang, H.; Wu, Q.; Yu, M.; Wu, T. Effect of wind on the relation of leaf N, P stoichiometry with leaf morphology in Quercus species. Forests 2018, 9, 110. [Google Scholar] [CrossRef]
- Wu, T.; Zhang, P.; Zhang, L.; Wang, G.; Yu, M. Morphological response of eight Quercus species to simulated wind load. PLoS ONE 2016, 11, e0163613. [Google Scholar] [CrossRef]
- Yang, S.J.; Sun, M.; Yang, Q.Y.; Ma, R.Y.; Zhang, J.L.; Zhang, S.B. Two strategies by epiphytic orchids for maintaining water balance: Thick cuticles in leaves and water storage in pseudobulbs. AoB Plants 2016, 8. [Google Scholar] [CrossRef]
- Ingram, G.; Nawrath, C. The roles of the cuticle in plant development: Organ adhesions and beyond. J. Exp. Bot. 2017, 68, 5307–5321. [Google Scholar] [CrossRef]
- Smith, V.C.; Ennos, A.R. The effects of air flow and stem flexure on the mechanical and hydraulic properties of the stems of sunflowers Helianthus annuus L. J. Exp. Bot. 2003, 54, 845–849. [Google Scholar] [CrossRef]
- Huang, P.; Wan, X.; Lieffers, V.J. Daytime and nighttime wind differentially affects hydraulic properties and thigmomorphogenic response of poplar saplings. Physiol. Plant. 2016, 157, 85–94. [Google Scholar] [CrossRef] [PubMed]
- Tang, F.Y.; Wang, T.; Zhu, J.M. Carbohydrate profiles during cotton (Gossypium hirsutum L.) boll development and their relationships to boll characters. Field Crops Res. 2014, 164, 98–106. [Google Scholar] [CrossRef]
- Yang, X.; Zhang, P.; Wu, Q.; Yan, H.; Yu, M.; Wang, G.; Wu, T. Effects of simulated wind load on leaf photosynthesis and carbohydrate allocation in eight Quercus species. J. Biobased Mater. Bioenergy 2017, 11, 652–657. [Google Scholar] [CrossRef]
- Barbehenn, R.V.; Haugberg, N.; Kochmanski, J.; Menachem, B. Effects of leaf maturity and wind stress on the nutrition of the generalist caterpillar Lymantria dispar feeding on poplar. Physiol. Entomol. 2015, 40, 212–222. [Google Scholar] [CrossRef]
- Godin, B.; Agneessens, R.; Gerin, P.A.; Delcarte, J. Composition of structural carbohydrates in biomass: Precision of a liquid chromatography method using a neutral detergent extraction and a charged aerosol detector. Talanta 2011, 85, 2014–2026. [Google Scholar] [CrossRef] [PubMed]
- Griffiths, J.S.; North, H.M. Sticking to cellulose: Exploiting Arabidopsis seed coat mucilage to understand cellulose biosynthesis and cell wall polysaccharide interactions. New Phytol. 2017, 214, 959–966. [Google Scholar] [CrossRef] [PubMed]
- Dong, Y.; Wang, Z.; Wu, T.; Yu, M.; Cheng, X.; Duan, X. Temporal and special distribution of wind in coastal area, Shanghai. Resour. Environ. Yangtze Basin 2013, 22, 40–45, (In Chinese with English abstract). [Google Scholar]
- Jensen, D.D.; Price, T.A.; Nadeau, D.F.; Kingston, J.; Pardyjak, E.R. Coastal Wind and Turbulence Observations during the Morning and Evening Transitions over Tropical Terrain. J. Appl. Meteorol. Climatol. 2017, 56, 3167–3185. [Google Scholar] [CrossRef]
- Gagnon, D.; Bradfield, G.E. Gradient analysis of west central Vancouver Island forests. Can. J. Bot. 1987, 65, 822–833. [Google Scholar] [CrossRef]
- Hesp, P.; Martínez, M.; Ecología, I. Disturbance Processes and Dynamics in Coastal Dunes. In Plant Disturbance Ecology: The Process and the Response; Johnson, E.A., Miyanishi, K., Eds.; Elsevier: Amsterdam, The Netherlands, 2007; pp. 215–247. [Google Scholar] [CrossRef]
- Karlin, M.S. Soil-Plant Relationships in the Sabkhat of America. In Sabkha Ecosystems. Volume V: The Americas; Khan, M.A., Boër, B., Ȫzturk, M., Clüsener-Godt, M., Gul, B., Breckle, S.-W., Eds.; Springer: Berlin/Heidelberg, Germany, 2016; pp. 329–347. [Google Scholar] [CrossRef]
- Both, S.; Riutta, T.; Paine, C.E.T.; Elias, D.M.O.; Cruz, R.S.; Jain, A.; Johnson, D.; Kritzler, U.H.; Kuntz, M.; Majalap-Lee, N.; et al. Logging and soil nutrients independently explain plant trait expression in tropical forests. New Phytol. 2019, 221, 1853–1865. [Google Scholar] [CrossRef]
- Mao, P.; Han, G.; Wang, G.; Yu, J.; Shao, H. Effects of age and stand density of mother trees on early Pinus thunbergii seedling establishment in the coastal zone, China. Sci. World J. 2014, 468036, 1–9. [Google Scholar] [CrossRef]
- Ewane, E.B.; Lee, J.H.; Lee, H.H. Eight-year monitoring of the height growth and survivorship of seedlings of Pinus thunbergii Parl. planted with sand fence and bush hedge protection in a coastal sandy environment in Korea. For. Sci. Technol. 2016, 12, 192–198. [Google Scholar] [CrossRef]
- Zha, T.; Wu, Y.; Jia, X.; Zhang, M.; Bai, Y.; Liu, P.; Ma, J.; Bourque, C.; Peltola, H. Diurnal response of effective quantum yield of PSII photochemistry to irradiance as an indicator of photosynthetic acclimation to stressed environments revealed in a xerophytic species. Ecol. Indic. 2017, 74, 191–197. [Google Scholar] [CrossRef]
- Feng, T.; Chen, S.S.; Gao, D.Q.; Liu, G.Q.; Bai, H.X.; Li, A.; Peng, L.X.; Ren, Z.Y. Selenium improves photosynthesis and protects photosystem II in pear (Pyrus bretschneideri), grape (Vitis vinifera), and peach (Prunus persica). Photosynthetica 2015, 53, 609–612. [Google Scholar] [CrossRef]
- Cornelissen, J.H.C.; Lavorel, S.; Garnier, E.; Díaz, S.; Buchmann, N.; Gurvich, D.E.; Reich, P.B.; Ter Steege, H.; Morgan, H.D.; Heijden, M.G.A.; et al. A handbook of protocols for standardized and easy measurement of plant functional traits worldwide. Aust. J. Bot. 2003, 51, 335–380. [Google Scholar] [CrossRef]
- Sendall, K.M.; Reich, P.B. Variation in leaf and twig CO2 flux as a function of plant size: A comparison of seedlings, saplings and trees. Tree Physiol. 2013, 33, 713–729. [Google Scholar] [CrossRef]
- Dusenge, M.E.; Wallin, G.; Gårdesten, J.; Niyonzima, F.; Adolfsson, L.; Nsabimana, D.; Uddling, J. Photosynthetic capacity of tropical montane tree species in relation to leaf nutrients, successional strategy and growth temperature. Oecologia 2015, 177, 1183–1194. [Google Scholar] [CrossRef]
- Arndt, S.K.; Livesley, S.J.; Merchant, A.; Bleby, T.M.; Grierson, P.F. Quercitol and osmotic adaptation of field-grown Eucalyptus under seasonal drought stress. Plant Cell Environ. 2008, 31, 915–924. [Google Scholar] [CrossRef]
- Hoch, G.; Popp, M.; Körner, C. Altitudinal increase of mobile carbon pools in Pinus cembra suggests sink limitation of growth at the Swiss treeline. Oikos 2002, 98, 361–374. [Google Scholar] [CrossRef]
- Van Soest, P.J.; Wine, R.H. Determination of lignin and cellulose in acid detergent fiber with permanganate. J. Assoc. Off. Agric. Chem. 1968, 51, 780–785. [Google Scholar] [CrossRef]
- Vogel, S. Leaves in the lowest and highest winds: Temperature, force and shape. New Phytol. 2009, 183, 13–26. [Google Scholar] [CrossRef] [PubMed]
- Jaegher, G.D.; Boyer, N.; Gaspar, T. Thigmomorphogenesis in Bryonia dioica: Changes in soluble and wall peroxidases, phenylalanine ammonia-lyase activity, cellulose, lignin content and monomeric constituents. Plant Growth Regul. 1985, 3, 133–148. [Google Scholar] [CrossRef]
- Kang, X.; Kirui, A.; Widanage, M.C.D.; Mentink-Vigier, F.; Cosgrove, D.J.; Wang, T. Lignin-polysaccharide interactions in plant secondary cell walls revealed by solid-state NMR. Nat. Commun. 2019, 10, 347. [Google Scholar] [CrossRef]
- Segado, P.; Domínguez, E.; Heredia, A. Ultrastructure of the epidermal cell wall and cuticle of tomato fruit (Solanum lycopersicum L.) during Development. Plant Physiol. 2016, 170, 935–946. [Google Scholar] [CrossRef]
- Kimmins, J.P. Forest Ecology; Addison-Wesley Press: New York, NY, USA, 2003. [Google Scholar]
- Schoelynck, J.; Bal, K.; Puijalon, S.; Meire, P.; Struyf, E. Hydrodynamically mediated macrophyte silica dynamics. Plant Biol. 2015, 14, 997–1005. [Google Scholar] [CrossRef] [PubMed]
© 2020 by the authors. Licensee MDPI, Basel, Switzerland. This article is an open access article distributed under the terms and conditions of the Creative Commons Attribution (CC BY) license (http://creativecommons.org/licenses/by/4.0/).