Article

Temporal Changes in Community Structure over a 5-Year Successional Stage in a Subtropical Forest

College of Forestry and Landscape Architecture, South China Agricultural University, Guangzhou 510642, China
*
Author to whom correspondence should be addressed.
Forests 2020, 11(4), 438; https://doi.org/10.3390/f11040438
Submission received: 16 February 2020 / Revised: 8 April 2020 / Accepted: 10 April 2020 / Published: 13 April 2020
(This article belongs to the Special Issue Modelling of Forests Structure and Biomass Distribution)

Abstract

:
In the context of global warming, the changes of forest structure, diversity, and productivity along with forest succession have always been a topic of interest for many researchers. Studying the changes in community structure, biomass, and diversity of different diameter at breast height (DBH) classes in subtropical mountainous forests during forest succession can provide data in support of future forest succession predictions and forest management. We analyzed the changes of three DBH classes in a 10-ha plot while studying subtropical mountainous forest succession in 2012 and 2017. The results showed that during forest succession, the community abundance and richness significantly decreased while biomass increased slightly. Among the three DBH classes, changes were the greatest in small trees, followed by large trees, and then medium-sized trees. The abundance, biomass, richness, and Shannon–Wiener index of small trees all decreased significantly. In forests with medium-sized trees, biomass decreased significantly and abundance did not change significantly. In large trees, abundance and biomass increased significantly. Changes were observed in environmental driving factors during forest succession. In 2012, driving factors with significant effects included total phosphorus, transmitted direct solar radiation, organic matter, and capillary water capacity. In 2017, two driving factors were total phosphorus and total potassium while the main driving factor was still total phosphorus. The results showed that during forest succession the abundance and diversity of small trees were principal components of community abundance and diversity. A reduction in small-tree abundance and diversity will decrease community abundance and diversity. Large-tree biomass was a principal component of community biomass; accumulation of large-tree biomass will increase community biomass. Schima superba Gardner and Champ. and Castanopsis carlesii (Hemsl.) Hayata are the main dominant species in this area, which can quickly form stable communities. S. superba is also a fire-resistant tree species. Therefore, in natural forest management, planting of S. superba and C. carlesii in the secondary bare land can be considered. In addition, the evergreen broad-leaved forest can be recovered to the forest structure and productivity level before selective cutting, which provides important inspiration for forest management in the region.

1. Introduction

Under global climate change, the development dynamics of forest structure, diversity, and productivity have always been the focus of researchers [1]. Climate warming changes the structure and diversity of the original forests [2,3,4]. Many studies have been carried out on this aspect in boreal forests and rainforests [5,6,7,8], but there are few studies on this aspect in subtropical forests [1]. Some studies have shown that the species distribution and productivity of subtropical evergreen broad-leaved forests have changed under the interference of climate change, such as the decline of forest biomass, the change of dominant species, the death of non-vascular epiphytes, and the migration of species [1,9,10]. However, the response of trees of different diameter at breast height (DBH) classes to climate change during forest succession is not clear.
Mountainous subtropical forests are composed of distinct layers, namely a canopy consisting of large trees, a subcanopy consisting of medium-sized trees, and an understory consisting of small trees [11]. Ecological succession in these forests is jointly determined by the canopy, subcanopy, and understory layers. During forest succession, changes in phylogenetic diversity [12], community structure and diversity [13], and forest carbon stock [14,15] occur, which result in varying effects on forest biodiversity, the carbon sink, and other ecological effects. Changes in stand structure occur in different forest layers during forest succession [16]. This inevitably leads to differences in forest diversity and biomass within the forest [11]. However, how the structure, diversity, and biomass of different forest layers change during forest succession is still not completely clear.
The canopy of our sample plot mainly consisted of mature Castanopsis carlesii (Hemsl.) Hayata and Schima superba Gardner and Champ., which are both tall trees and typical representatives of canopy tree species in our region [17,18]. The subcanopy mainly consists of immature and small trees while the understory is composed of juvenile trees, small juvenile trees, and shrubs. Due to differences in growth stages and microenvironments between the different forest layers, plants have different survival strategies at each stage. Canopy plants will compete for resources with the understory layer by reducing effective solar radiation and soil temperature, increasing soil moisture, and affecting soil nutrients [19,20,21,22]. Therefore, small trees tend to die during competition with large trees. However, the small-diameter class is major contributor towards community abundance and diversity [23]. Therefore, the death of small trees directly affects community structure and diversity [16]. Soil is the carrier of tree growth, and light is an essential resource for photosynthesis [24]. In many studies, light is a limiting factor for undergrowth [25,26]. The pioneer species and heliophytic tree species need to grow in a well-lit environment. At the mid–late stage of succession, insufficient light in the forest will cause the death of the pioneer species and heliophytic tree species [27]. Soil chemical factors, such as total nitrogen, total phosphorus, and total potassium, can provide the chemical elements needed for growth of trees [24], and play a key role in the survival, growth, and species distribution [28,29]. Soil physical factors, such as bulk density and natural moisture content, indirectly affect the water absorption of trees by affecting the water content and state in soil [7,30].
Many studies have shown that changes in forest community structure, diversity, and biomass vary during succession [11,31]. During different stages of succession, community species diversity does not increase or decrease monotonically but typically reaches a maximum at the middle stage of succession [32]. Changes in community biomass differ at different succession stages [33]; during the early stage, biomass will increase as trees grow, although while succession progresses the death of dominant species will decrease total biomass [34]. Similarly, community abundance is intimately associated with successional stages and will increase or decrease during different stages of succession [27]. Are changes in various forest layers during forest succession consistent with the community? There is currently no clear answer to this question. The contributions of various forest layers toward community structure, diversity, and biomass are still unclear.
The subtropical forest succession is a long-term process. Some studies have shown that needle-leaved forest, needle-leaved and broad-leaved mixed forest, and evergreen broad-leaved forest can be formed in the secondary succession of bare land in subtropical areas after 25, 50, and 75 years of succession, respectively [35]. Although 5 years is a short time for forest succession, we hypothesized that the stand structure will be appreciably different, although the type and the nature of the forest community remains unchanged over a 5-year successional stage. In this paper, we studied the changes in different DBH classes in a 10 ha mountainous forest in the Dongyuan Kanghe Nature Reserve during forest succession in 2012–2017 to answer the following questions: (1) What is the composition and distribution of different DBH classes during subtropical mountainous forest succession? (2) Are there significant changes in the composition and distribution of different DBH classes during mountainous subtropical forest succession? Is so, what changes occur? (3) What are the changes in major environmental driving forces in different DBH classes during forest succession? Answering these questions is helpful to understand forest succession stage and succession direction. Under global warming, it can provide data support and theoretical guidance for forest managers to make better forest management plans.

2. Materials and Methods
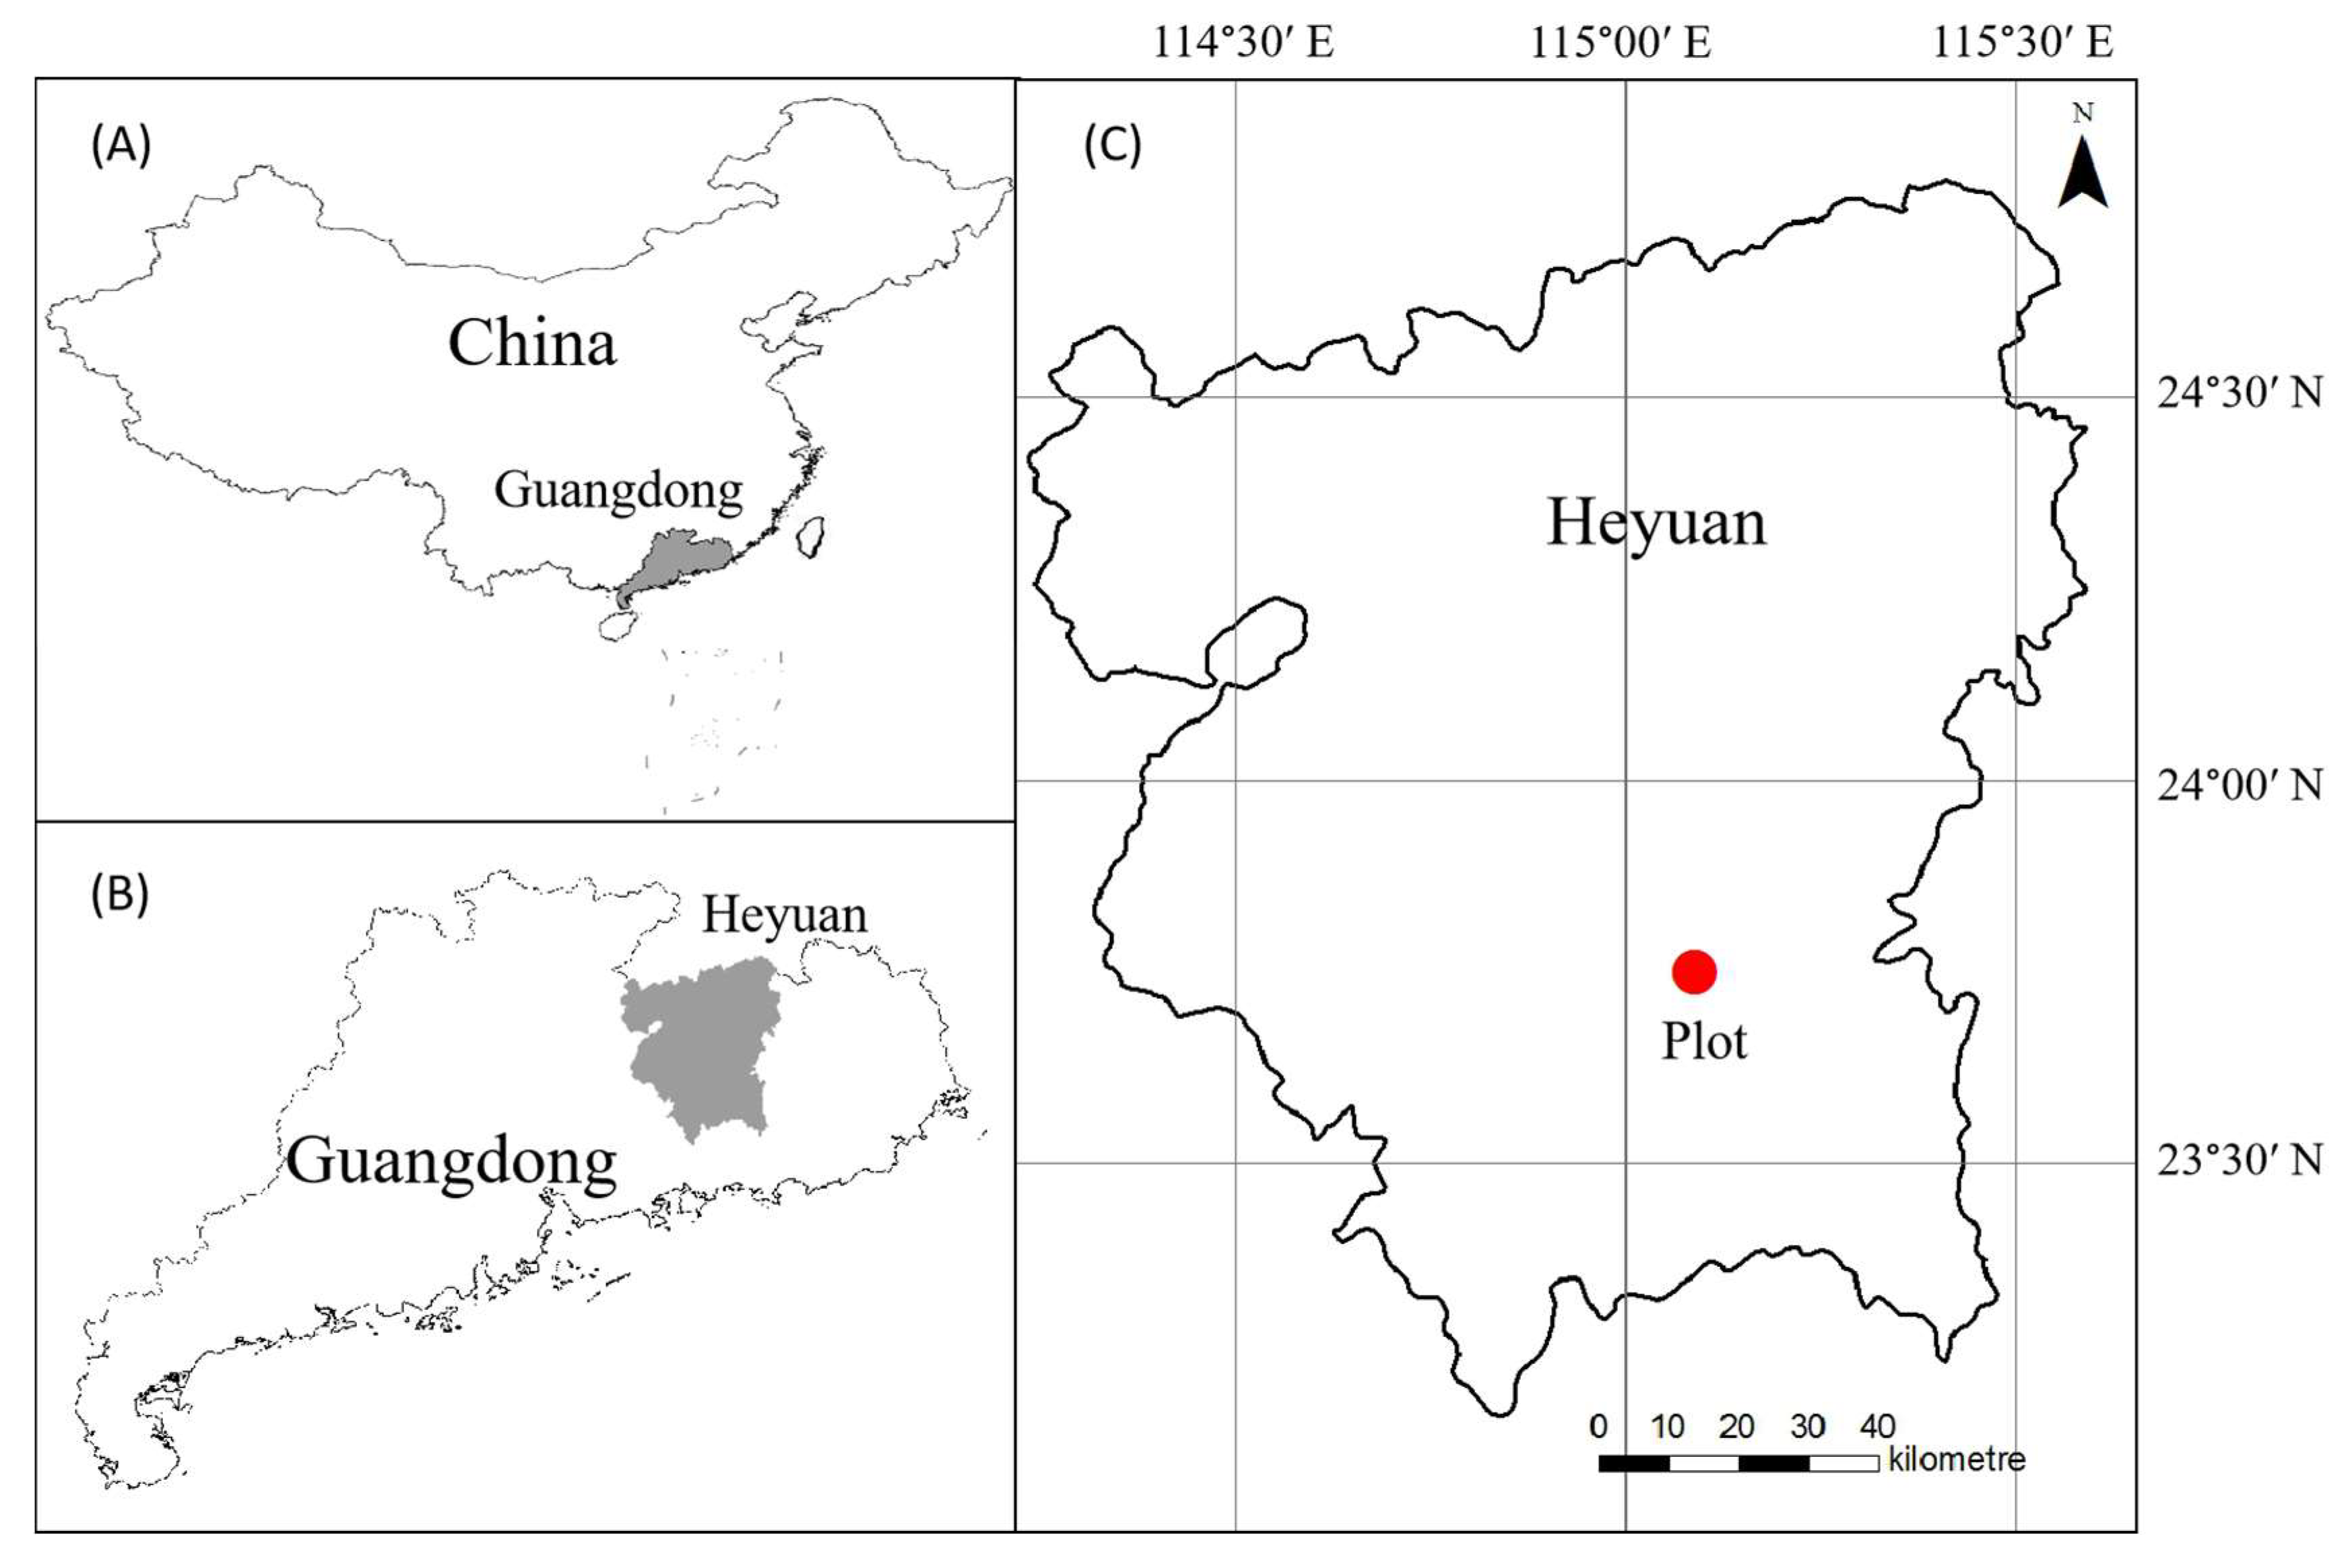
2.1. Study Area

The study area was located at the Kanghe Provincial Nature Reserve (115°04′–115°09′ E, 23°44′–23°53′ N) in the southeastern part of Guangdong Province, China (Figure 1). The nature reserve has a subtropical monsoon climate, with an annual mean temperature of 20–21 °C, annual mean rainfall of 2143 mm, and annual mean humidity of 77%. Major vegetation in the region includes secondary evergreen broad-leaved forests and mixed coniferous–broad-leaved forests [36]. Selective cutting was carried out in 1993 (DBH >13 cm). Since then, any form of cutting has been banned, and human interference has been excluded. At the first survey in 2012, the forest developed well, the canopy was closed, and the forest structure and productivity were greatly restored. C. carlesii, S. superba, Ardisia quinquegona Blume, Castanopsis fargesii Franch, and Itea chinensis Hook. and Arn were the main dominant species in the plot [37]. The dominant species in the community were mainly heliophytic tree species such as C. carlesii, S. superba, and C. fargesii, indicating that the forest was in the stage of succession dominated by heliophytes, that is, the early-to-mid stage of subtropical secondary succession [35].

2.2. Sampling Design

A 10 ha fixed sample area was established according to the standards of the Center for Tropical Forest Science (CTFS) [38]. The sample area was a 200 m × 500 m rectangle. An initial survey was conducted in 2012, and the area was resurveyed in 2017.

2.3. Data Collection and Measurements

All trees with a diameter at breast height (DBH) ≥1 cm in the sample plots were surveyed. The surveyed data included species, DBH, and tree height. In this paper, three different DBH classes were used to represent different forest layers as follows: small trees, 1 cm ≤ DBH < 7.5 cm; medium-sized trees, 7.5 cm ≤ DBH < 22.5 cm; and large trees, 22.5 cm ≤ DBH [36].
Surface soil was collected at the center and at 1/4 and 3/4 of the diagonals of every 20 × 20 m quadrat; five subsamples from each quadrat were mixed for analysis of soil chemical characteristics. At the same locations, a soil cutting ring was used for the collection of soil samples for analysis of physical characteristics. Eight soil factors such as organic matter, total nitrogen, and total phosphorus were used for measurement of soil physiochemical characteristics [39,40]. The physical characteristic of each quadrat was the mean value of five cutting ring samples collected in each quadrat.
A Nikon 4500 Coolpix® camera (Tokyo, Japan) equipped with a Nikon FC-E8 fish-eye lens was used for canopy photography at the center and at 1/4 and 3/4 of the diagonals of every quadrat. During photography, the camera was mounted on a tripod that was 1.65 m above the ground. The image resolution was 2272 × 1704 pixels, and images were stored in JPEG format. All photography was carried out on cloudy and windless days [41]. Gap Light Analyzer 2.0 [42] image processing software was used to analyze canopy photographs and measure four solar radiation factors (canopy openness, leaf area index, transmitted direct solar radiation, and transmitted diffuse solar radiation). The solar radiation factor of each quadrat was the mean value of five values collected in the quadrat.

2.4. Data Analysis

The binary standing tree volume formula in the Common Forest Tree Volume Tables for Forest Inventory drafted by the Guangdong Provincial Forestry Bureau and Guangdong Academy of Forest Inventory and Planning [43] was used. The specific formulas are as follows.
The formulas for binary standing tree volumes for coniferous, hardwood broad-leaved, and softwood broad-leaved trees are shown in Equations (1), (2), and (3), respectively:
V = 7.98524 × 10 5 D 1.74220 H 1.01198
V = 6.01228 × 10 5 D 1.87550 H 0.98496
V = 6.74286 × 10 5 D 1.87657 H 0.92888
where V is the standing stock of a single plant (m3), D is DBH (cm), and H is tree height (m).
The biomass expansion factor method recommended in Methodologies for Forestry Carbon Sequestration Projects [44] was used as a reference. The specific formula and biomass estimation factors (Table 1) are as follows. The single-tree biomass is calculated as
B = V × D × B E F × ( 1 + R )
where B is the single-tree biomass (t·individual−1), V is the single-tree volume (m3·individual−1), D is the basic wood density (t·m−3), BEF is the biomass expansion factor that is dimensionless and is used to convert tree volume to aboveground biomass, and R is the ratio of belowground biomass/aboveground biomass and is dimensionless.
The richness and Shannon–Wiener indices were used for quantitative analysis of the species diversity of different forest layers [45].
One-way analysis of variance was used to analyze the differences in diversity, structure, and biomass of different forest layers during forest succession. The Kruskal–Wallis test was used for testing as it is a non-parametric test method that is suitable for field ecological data analysis [46]. The multiple response permutation procedure (MRPP) was used to analyze differences in species distribution in the various forest layers during forest succession and between various forest layers in 2012 and 2017. The MRPP is a non-parametric statistical method that is widely used in the analysis of ecological data to test the differences in species distribution between two or more groups [47]. The higher the absolute T value, the greater the inter-group differences.
Indicator species analysis was used to study changes in indicator plants and indices in different forest layers during forest succession [47]. Redundancy analysis (RDA) was used to study the major driving factors during forest succession and changes in these factors.
Statistica 8.0 (Statsoft, Inc. Tulsa, OK, USA) was used for histograms, box plots, one-way analysis of variance, and the Kruskal–Wallis test of species abundance and biomass. PC-ORD (MjM Software, Gleneden Beach, OR, USA) was used to calculate the MRPP and for indicator species analysis. CANOCO 5.0 [48] was used for redundancy analysis.

3. Results

3.1. Characteristics of DBH Classes during Forest Succession

Significant changes were observed in the abundance of the community and three DBH classes in 2012–2017 (Table 2). At the plot-level, small trees showed the greatest change, with mean abundance decreasing from 152.40 to 113.66. Large trees showed the smallest change. Changes in biomass also occurred with large trees having the greatest change in biomass, which increased from 6.98 Mg to 7.89 Mg in each quadrat, while small trees had the smallest change. Changes in species diversity were relatively low, with small trees showing the largest change because its richness index decreased from 22.62 to 19.64, while medium-sized trees showed the smallest change. At the community-level, abundance and biomass of small and medium trees decreased, and abundance and biomass of large trees increased. The degree and trend of change at the community-level were consistent with the plot-level. However, in terms of species diversity index, small, medium, and large trees all decreased. The abundance of the community decreased, which was mainly affected by the large decrease in the abundance of small trees. The biomass of the community increased, mainly due to the increase in the biomass of the large trees.
During forest succession, the community size-structure changed significantly, especially the small trees (Figure 2A,B). In 2012, the community size-structure showed an inverted "J" shape, indicating a good community renewal status. In 2017, the community size-structure still showed an inverted “J” shape, but there was a large decrease in small trees, which indicated that the small trees were undergoing drastic changes. This may result in insufficient numbers of small trees to supplement future forest succession after the death of the medium and large trees.
The top ten species with changes in abundance all showed reductions, of which the top three species with the largest reductions were C. carlesii (−2289 plants), Cratoxylum cochinchinense (Lour.) Blume (−665), and S. superba (−644) (Figure 3A). The top ten species with changes in absolute abundance all showed reductions, of which the top three species with the highest reductions were Alchornea trewioides (Benth.) Müll. (−88.89%), Vitex negundo (−86.36%), and Pinus massoniana Lamb. (−83.02%) (Figure 3B). The top ten species with changes in biomass mainly showed increases, except for decreased biomass in P. massoniana and Cunninghamia lanceolata (Lamb.) Hook. The top three species with the greatest change in biomass were S. superba, (+36.34 Mg), C. carlesii (+26.41 Mg), and Engelhardtia roxburghiana Lindl. (+19.92 Mg) (Figure 3C). The top ten species with changes in absolute biomass included increases and decreases in biomass (Figure 3D).

3.2. Plot-Based Differences in Community Characteristics during Forest Succession

Diversity indices changed in different ways between different DBH classes during forest succession. The richness index of the entire community and the richness and Shannon–Wiener indices of small trees all decreased significantly (Figure 4A,C,D), while other indices experienced no significant change. Medium-sized trees showed the lowest change in diversity (Figure 4E,F), and large trees showed no significant change (Figure 4G,H).
With regard to abundance, except for medium-sized trees that showed no significant changes (Figure 5E), groups of all, small, and large trees showed significant decreasing, decreasing, and increasing trends, respectively (Figure 5A,C,G). Except for all trees that showed no significant change in biomass (Figure 5B), the biomass in groups of small, medium, and large trees showed significant decreasing, decreasing, and increasing trends, respectively (Figure 5D,F,H).
The MRPP was carried out on the differences in species composition and distribution in different DBH classes during succession (Table 3). The results showed that significant differences existed in species composition and distribution in all trees and small trees during forest succession although no significant differences were observed in medium-sized and large trees. The absolute T-value for small trees was large, indicating large changes occurred in the species composition and distribution of small trees during succession.
In addition, significant differences were observed in the species distribution and composition between different DBH classes (Table 4). A pairwise comparison of different DBH classes in 2012 by MRPP showed that the difference in the composition and distribution between all trees in the community and large trees was the greatest (|T| = 242.39) and the difference in the composition and distribution between all trees in the community and small trees was the least (|T| = 28.79). This indicates the composition and distribution of all trees is mainly affected by small trees. In addition, the inter-group differences between small trees and large trees (|T| = 216.30) were greater than between small and medium-sized trees (|T| = 147.58), showing that similar DBH classes have similar species composition and distribution. The 2017 results are consistent with the 2012 results.

3.3. Changes in Indicator Species in Different DBH Classes during Forest Succession

With the exception of one indicator plant in the medium-diameter class in 2017 (Cinnamomum porrectum), all other indicator plants were in the small-diameter class during forest succession (Table 5). The results showed that the small-diameter class had high species diversity and included species present in medium-sized and large-diameter classes. The numbers of indicator plant species in the small-diameter class in 2012 and 2017 were 28 and 23, respectively. The indicator values of indicator plants in the small-diameter class in 2017 showed varying degrees of decrease compared with 2012, of which C. porrectum showed the greatest decrease in indicator value by 50.6% and changed from an indicator plant to a non-indicator plant, while its abundance decreased by 52.9%. Aidia canthioides showed the greatest increase in indicator value (4.4%) and the lowest change in abundance (−3.7%).

3.4. Major Drivers for Community Succession

In the RDA analysis of 2012, 12 environmental factors explained 36.6% of the changes in species distribution, of which the first four axes in the RDA ordination graph explained a total of 78.97% of the variation. This shows that the first four axes could explain most of the effects of these environmental factors on species distribution but only axes 1 and 2 had significant explanatory effects (p < 0.05). Pseudo-canonical correlation reflects the effects of environmental factors on species distribution; the species–environment correlations of the four axes were high (Table 6). Only four environmental factors had significant explanatory effects on species distribution (p (adj) < 0.05), which included total phosphorus, transmitted direct solar radiation, organic matter, and capillary water capacity. Total phosphorus had the strongest explanatory effect and contributed 21.1% to the explained variation (Table 7). From the ordination graph (Figure 6A), we can see that total phosphorus and transmitted direct solar radiation had greater effects on species distribution than other environmental variables. In seen in Axis 1 from right to left, as total phosphorus increased, species abundance decreased.
In the RDA analysis of 2017, 12 environmental factors explained 35.7% of the changes in species distribution, of which the first four axes in the RDA sequence explained a total of 79.14% of the variation but only axis 1 has significant explanatory effects (p < 0.05) (Table 6). Only two environmental factors had significant explanatory effects on species distribution (p(adj) < 0.05), which were total phosphorus and total potassium. Total phosphorus had the strongest explanatory effect and contributed 29% to the explained variation (Table 7). From the ordination graph (Figure 6B), we can see that total phosphorus and total potassium had greater effects on species distribution. As seen in Axis 1 from left to right, as total phosphorus increased, species abundance decreased.

4. Discussion

By analyzing the changes of the small-diameter class, medium-diameter class, and large-diameter class during forest succession and combined with the biological characteristics of dominant species, we speculated that the forest succession tended to the mid–late stage of succession. Our results will help forest managers to understand the forest succession stage and succession direction and make forest management plans. For example, in natural forest management, forest managers may consider planting heliophytic tree species such as S. superba and C. carlesii on secondary bare land, which is conducive to rapid forest growth, increased forest productivity, and effective resistance of forest fires [18,49].
When compared with other measurements, community abundance showed the greatest change during succession, of which the small-diameter class showed the greatest change. A drastic reduction in the abundance in the small-diameter class may be due to environmental screening [50] and density limitations [51]. The abundance of large trees showed a slight increase, showing that large trees are more adapted to the existing environment during forest succession and occupy more environmental resources, such as solar radiation, than smaller trees. The large trees will form a closed canopy and dominate the stand structure, resulting in sparse solar radiation resources for smaller trees and will affect the growth and death of understory plants [52]. Changes in diversity during succession were relatively low, of which the small-diameter class showed the greatest change, followed by large trees, and then medium-sized trees. Changes in diversity may be related to changes in species abundance [53]. Changes in biomass were low, of which the largest change was in large trees, followed by medium-sized trees and then small trees. However, biomass increased in large trees but decreased in medium-sized and small trees. This indirectly shows that large trees absorb more solar radiation and soil nutrient resources than smaller trees [54].
Small trees usually experience a rapid growth phase, with high resource utilization rates and demands [55]. Hence, the abundance and diversity of the small-diameter class is dependent on the amount of available resources [23]. Large and medium-diameter classes are resource allocators, particularly for solar radiation [11], while small trees are at a weaker position in resource competition. In addition, small trees have relatively low vitality, stress tolerance, and survival probability. These conditions result in a drastic decrease in abundance in the small-diameter class [56] and decreased diversity over time during ecological succession. In addition, the community succession stage also has important effects on changes in the small-diameter class. The foundation species, C. carlesii, is a heliophytic tree species. The death of a large number of C. carlesii trees shows that it is not a mesophytic or sciophytic tree species that is adapted for the mid−late stage of succession [27]. C. carlesii had a cluttered distribution in the plot, and it was subject to high intra- and inter-specific competition in the community with rich diversity and limited resources [37]. In adaptive strategy theory [57,58], this type of heliophytic tree species should be a C-type strategy species that employs a competitive strategy to adapt to a resource-rich habitat. Successful competitors allocate most of their resources to aboveground vegetative growth organs and can fully utilize abundant resources in the environment, which makes it difficult for other plants to compete with it, thereby increasing its own fitness [59]. However, competition with S-type strategy species during the mid−late stages of succession causes many members of this species group to degrade and die [60]. This fits the phenomenon of C. carlesii, a C-type strategy species that will die in large numbers. Because small-tree abundance and diversity are principal components of abundance and diversity of the community [23], the abundance and diversity of the community decreases significantly due to the effects of the small-diameter class. In addition, changes in species distribution were the greatest for the small-diameter class during succession. This also results in significant changes in species distribution in the community.
Large trees occupy a significantly dominant position in resource acquisition, such as solar radiation [11]. This allocation of resources by large trees will affect resource acquisition by small trees and limit their growth [22]. In addition, the strong vitality and stress tolerance of large trees enables them to have a high survival probability. Additionally, medium-sized trees ultimately grow into large trees. Therefore, the abundance of biomass and diversity of large trees all increased. The foundation species, C. carlesii, is a C-strategy species in adaptive strategy theory [57,58] that is adapted to a resource-rich environment. During the mid−late stages of succession, environmental resources become limiting with competition from other mesophytic tree species [27,60]. However, as large C. carlesii trees possess abundant resources that can satisfy their own growth demands, they will not die as a result of resource deficiency over a short period of time. At this time, S-strategy species still did not show resource dominance and are unable to threaten large C-strategy trees. In initial floristic composition theory [61,62], plant species substitution does not necessarily occur in an orderly manner, and every species will tend to exclude and inhibit any new colonizing plants. Therefore, the large amount of resources possessed by large C. carlesii trees will exclude and inhibit all other plants directly, particularly small trees. Therefore, there will be a sufficient number of medium-sized C. carlesii trees to replenish the population of large C. carlesii trees, so that when large C. carlesii trees have not entered the decline stage, the latter will occupy a dominant position for a long period of time. Changes in canopy structure are primarily determined by the lifespan of dominant canopy species [63]. After large C. carlesii trees have entered the decline stage, changes in the canopy may be caused by the replacement by large trees (such as S. superba) with a longer lifespan, which then become the dominant tree species of the canopy. Large tree biomass is a principal component of community biomass [36]. Therefore, the biomass of the community increases because of the effects of an increase in large tree biomass.
Medium-sized trees lie between large and small trees in terms of dominance. Medium-sized trees will continue to grow into large trees while small trees grow into medium-sized trees. Currently, the growth rate for the abundance of medium-sized trees is negative, showing that the growth rate of small trees into medium-sized trees is lower than the growth rate of medium-sized trees into large trees. The speeds of death for C. carlesii and C. fargesii are relatively fast while those of sciophytic tree species (such as Itea chinensis Hook. and Arn and Aidia pycnantha (Drake) Tirveng) increase greatly. Among this increase and decrease, medium-sized trees showed the lowest change. In adaptive strategy theory [57,58], C-type strategy species such as C. carlesii and C. fargesii are gradually replaced by S-strategy species such as A. pycnantha.
In the small-diameter class, heliophytic tree species such as C. carlesii, C. fargesii, and C. lanceolata die off in large numbers while mesophytic tree species such as A. quinquegona and A. canthioides show a lower decrease in numbers. From this, we can see that forest succession was at the mid–late stage in the present study area, which fits the adaptive strategy theory [57,58] in which C-strategy species change into S-strategy species [60]. From the stable increase in the foundation species, C. carlesii, and the large increase in mesophytic and sciophytic tree species such as A. canthioides and Schefflera octophylla (Lour.) Harms, we can see that this also matches the initial floristic composition theory [61,62]. Large C. carlesii trees dominate the community, have already incorporated many resources, and will retain their dominant position for a long period of time. However, in small- and medium-diameter class, mesophytic and sciophytic tree species will gradually replace pioneer species and heliophytic tree species to ultimately occupy a dominant position [27].
The community in which the canopy remains stable reflected this in that the subcanopy gradually becomes sparse over time and the understory layer experiences drastic changes, showing significant self-thinning [56]. As the community reaches the mid–late stage of succession in which environmental resources are very limited [60], sample plots with high abundance and number of species will result in better resource absorption. Therefore, total phosphorus and total potassium in the soil will decrease as the number of species increases. As forest succession progresses, mesophytic and sciophytic tree species in the small-diameter class will gradually occupy a dominant position with increased resistance against environmental stress. Therefore, the effects of environmental resources on the species distribution in the small-diameter class decreases, which also decreases the distribution of species in the community. This can be seen in the redundancy analysis of the explanatory power of environmental factors in 2017. In this paper, major environmental factors that affected species distribution were total phosphorus, total potassium, and organic matter, which is consistent with Satdichanh et al. [64]. Their study found that soil nutrients show a strong correlation with stand structure during short-term forest succession but species interaction has important effects on stand structure when forest succession occurs over a longer period.
The trend of community succession has important implications for forest managers. Forest managers can carry out appropriate anthropic disturbances to ensure sustainable development of the forest [6,65]. For example, forest managers should pay attention to the collocation of tree species during the afforestation period. Pioneer species and heliophytic tree species can quickly form forests and give full play to the ecological efficiency of forests. Mesophytic and sciophytic tree species can grow in the understory of shaded forests to enrich community levels and replace pioneer species and heliophytic tree species in the middle and late stage of succession to promote forest succession [27,66]. From selective cutting in 1993 to the first survey in 2012, after 19 years of recovery, the community biomass reached 292.5 t/ha, which was similar to the biomass of the 400-year-old forest in the Dinghushan Biosphere Reserve (our study land is located at the same latitude with the Dinghushan Biosphere Reserve, and the vegetation types of both are evergreen broad-leaved forests) [1], indicating that the forest productivity had been close to or fully recovered. The stand density was 5007 plants per hectare, which was also similar to the stand density of the old forest in the Dinghushan Biosphere Reserve [1], indicating that the forest structure had been recovered to the level of the old forest. The recovery of forest structure and biomass indicates that the evergreen broad-leaved forest can be recovered to the forest structure and productivity level before selective harvesting after a certain number of years. However, in the forest species composition, heliophytic tree species were the main dominant species and the main component of the community, while mesophytic tree species were the secondary component of the community, which indicated that the forest species composition and distribution were quite different from the old forest [27,35].
We only conducted 5 years of dynamic monitoring; as a result, our understanding of the long-term direction of various forest layers during succession in subtropical mountainous forests is still not deep enough. In the next study, a longer monitoring period will be used in combination with further refinement of forest layers and DBH classes to expand the study of the characteristics of each species. This will enable us to explain forest succession patterns at the species or even the individual level. In particular, we wish to examine the direction of forest succession under climate change. Will forest succession be affected? The answers to these questions will provide valuable supporting data and guidance for understanding the direction of forest succession under climate change.

5. Conclusions

Studying the differential changes of plants at different stages of growth during forest succession will aid in exploring the direction of future succession in forests and provide data in support of forestry management. During forest succession, different types of changes occur in the community structure, diversity, and biomass of different DBH classes. Many individuals in the small-diameter class tend to die off as a result of environmental stress and stress from other individuals, resulting in changes in community structure and diversity. Large-diameter class trees were relatively stable and their biomass increased significantly over time, resulting in an increase in biomass of the community. Significant differences were observed in the species distribution of different DBH classes; small-diameter class have the highest abundance and diversity along with the lowest biomass, exhibiting a trend that is reversed in large trees, while medium-sized trees lay in the middle. Significant differences were found in species distribution patterns between different DBH classes, of which the small-diameter class has the most indicator plants. Changes were seen in major environmental driving factors during forest succession, and the explanatory power of environmental factors decreases over time. The large-diameter class will maintain a stable state and large C. carlesii trees will maintain a dominant position. In the medium-diameter class, heliophytic tree species such as C. carlesii were gradually replaced by mesophytic and sciophytic tree species, while the replacement rate increased in small-diameter class. Adaptive strategy theory can better explain changes in medium-and small-diameter classes while the initial floristic composition theory can better explain changes in the large-diameter class. The two theories showed that the existing community is at the early-to-mid stage of succession and tends to the mid–late stage of succession in the study area. After 19 years of recovery, the forest structure and productivity have been greatly improved, indicating that the evergreen broad-leaved forest can be recovered to the forest structure and productivity level before a selective cutting level after a certain number of years.

Author Contributions

Z.S. conceived and designed the study. M.X., T.L., P.X., H.C., and Z.S. collected the data. M.X. analyzed the data and wrote the manuscript. All the authors discussed the results and reviewed and approved the manuscript. All authors have read and agreed to the published version of the manuscript

Funding

This research was supported by the Forestry Department of Guangdong Province, China, for non-commercial ecological forest research (Grant No. B366).

Acknowledgments

We thank Zhenkui Li and Wenbin Li for field plant identification. We are very grateful to the staff of the Kanghe Provincial Nature Reserve of Guangdong Province for logistic support during field work.

Conflicts of Interest

The authors declare no conflict of interest.

References

  1. Zhou, G.Y.; Peng, C.H.; Li, Y.L.; Liu, S.Z.; Zhang, Q.M.; Tang, X.L.; Liu, J.X.; Yan, J.H.; Zhang, D.Q.; Chu, G.W. A climate change-induced threat to the ecological resilience of a subtropical monsoon evergreen broad-leaved forest in Southern China. Glob. Chang. Biol. 2013, 19, 1197–1210. [Google Scholar] [CrossRef] [PubMed]
  2. Labrecque-Foy, J.-P.; Morin, H.; Girona, M.M. Dynamics of territorial occupation by North American beavers in Canadian boreal forests: A novel dendroecological approach. Forests 2020, 11, 221. [Google Scholar] [CrossRef] [Green Version]
  3. Lavoie, J.; Girona, M.M.; Morin, H. Vulnerability of conifer regeneration to spruce budworm outbreaks in the Eastern Canadian boreal forest. Forests 2019, 10, 14. [Google Scholar] [CrossRef] [Green Version]
  4. Girona, M.M.; Morin, H.; Lussier, J.M.; Ruel, J.C. Post-cutting mortality following experimental silvicultural treatments in unmanaged boreal forest stsands. Front. For. Glob. Chang 2019, 2. [Google Scholar] [CrossRef] [Green Version]
  5. Navarro, L.; Morin, H.; Bergeron, Y.; Girona, M.M. Changes in spatiotemporal patterns of 20th century spruce budworm outbreaks in eastern Canadian boreal forests. Front. Plant Sci. 2018, 9, 15. [Google Scholar] [CrossRef] [PubMed] [Green Version]
  6. Montoro Girona, M.; Lussier, J.M.; Morin, H.; Thiffault, N. Conifer regeneration after experimental shelterwood and seed-tree treatments in boreal forests: Finding silvicultural alternatives. Front. Plant Sci. 2018, 9, 1145. [Google Scholar] [CrossRef] [PubMed]
  7. Bretfeld, M.; Ewers, B.E.; Hall, J.S. Plant water use responses along secondary forest succession during the 2015–2016 El Niño drought in Panama. New Phytol. 2018, 219, 885–899. [Google Scholar] [CrossRef] [Green Version]
  8. Seidl, R.; Thom, D.; Kautz, M.; Martin-Benito, D.; Peltoniemi, M.; Vacchiano, G.; Wild, J.; Ascoli, D.; Petr, M.; Honkaniemi, J.; et al. Forest disturbances under climate change. Nat. Clim. Chang. 2017, 7, 395–402. [Google Scholar] [CrossRef] [Green Version]
  9. Song, L.; Liu, W.Y.; Nadkarni, N.M. Response of non-vascular epiphytes to simulated climate change in a montane moist evergreen broad-leaved forest in southwest China. Biol. Conserv. 2012, 152, 127–135. [Google Scholar] [CrossRef]
  10. Nakao, K.; Matsui, T.; Horikawa, M.; Tsuyama, I.; Tanaka, N. Assessing the impact of land use and climate change on the evergreen broad-leaved species of Quercus acuta in Japan. Plant Ecol. 2011, 212, 229–243. [Google Scholar] [CrossRef]
  11. Yang, X.D.; Yan, E.R.; Chang, S.X.; Da, L.J.; Wang, X.H. Tree architecture varies with forest succession in evergreen broad-leaved forests in Eastern China. Trees 2015, 29, 43–57. [Google Scholar] [CrossRef]
  12. Michalski, S.G.; Bruelheide, H.; Durka, W. Phylogenetic turnover during subtropical forest succession across environmental and phylogenetic scales. Ecol. Evol. 2017, 7, 11079–11091. [Google Scholar] [PubMed] [Green Version]
  13. Kreutz, A.; Aakala, T.; Grenfell, R.; Kuuluvainen, T. Spatial tree community structure in three stands across a forest succession gradient in northern boreal Fennoscandia. Silva. Fenn. 2015, 49, 1–17. [Google Scholar] [CrossRef] [Green Version]
  14. Moroni, M.T.; Musk, R.; Wardlaw, T.J. Forest succession where trees become smaller and wood carbon stocks reduce. For. Ecol. Manag. 2017, 393, 74–80. [Google Scholar] [CrossRef]
  15. Laflower, D.M.; Hurteau, M.D.; Koch, G.W.; North, M.P.; Hungate, B.A. Climate-driven changes in forest succession and the influence of management on forest carbon dynamics in the Puget Lowlands of Washington State, USA. For. Ecol. Manag. 2016, 362, 194–204. [Google Scholar] [CrossRef] [Green Version]
  16. Wu, Y.Y.; Guo, C.Z.; Ni, J. Dynamics of major forest vegetations in Tiantong National Forest Park during the last 30 years. Chin. J. Appl. Ecol. 2014, 25, 1547–1554. [Google Scholar]
  17. Ali, A.; Ma, W.J.; Yang, X.D.; Sun, B.W.; Xu, M.S. Biomass and carbon stocks in Schima superba dominated subtropical forests of eastern China. J. For. Sci. 2014, 60, 198–207. [Google Scholar] [CrossRef] [Green Version]
  18. Yang, T.H.; Song, K.; Da, L.J.; Li, X.P.; Wu, J.P. The biomass and aboveground net primary productivity of Schima superba-Castanopsis carlesii forests in east China. Sci. China Life Sci. 2010, 53, 811–821. [Google Scholar] [CrossRef]
  19. Taylor, B.N.; Patterson, A.E.; Ajayi, M.; Arkebauer, R.; Bao, K.; Bray, N.; Elliott, R.M.; Gauthier, P.P.G.; Gersony, J.; Gibson, R. Growth and physiology of a dominant understory shrub, Hamamelis virginiana, following canopy disturbance in a temperate hardwood forest. Can J. For. Res. 2016, 47, 193–202. [Google Scholar] [CrossRef] [Green Version]
  20. Rojas, A.M.Q.; Schwarzkopf, T.; García, C.; Rico, M.J. Light environment in the understory of an Andean cloud forest: Canopy structure and climatic seasonality. Rev. Biol. Trop. 2016, 64, 1699–1707. [Google Scholar]
  21. Gendreau-Berthiaume, B.; Macdonald, S.E.; Stadt, J.J.; Hnatiuk, R.J. How dynamic are understory communities and the processes structuring them in mature conifer forests? Ecosphere 2015, 6, 1–49. [Google Scholar] [CrossRef]
  22. McKenzie, D.; Halpern, C.B.; Nelson, C.R. Overstory influences on herb and shrub communities in mature forests of western Washington, U.S.A. Can J. For. Res. 2000, 30, 1655–1666. [Google Scholar] [CrossRef]
  23. Su, X.P.; Wang, M.H.; Huang, Z.Q.; Fu, S.L.; Chen, H.Y.H. Forest Understorey Vegetation: Colonization and the Availability and Heterogeneity of Resources. Forests 2019, 10, 944. [Google Scholar] [CrossRef] [Green Version]
  24. Pallardy, S.G. Physiology of Woody Plants; Academic Press: Cambridge, MA, USA, 2010. [Google Scholar]
  25. Cano, F.J.; Sánchez-Gómez, D.; Gascó, A.; Rodriguez-Calcerrada, J.; Gil, L.; Warren, C.R.; Aranda, I. Light acclimation at the end of the growing season in two broadleaved oak species. Photosynthetica 2011, 49, 581–592. [Google Scholar] [CrossRef]
  26. Lhotka, J.M.; Loewenstein, E.F. Influence of canopy structure on the survival and growth of underplanted seedlings. New Forests 2008, 35, 89–104. [Google Scholar] [CrossRef]
  27. Wang, D.P.; Ji, S.Y.; Chen, F.P.; Xing, F.W.; Peng, S.L. Diversity and relationship with succession of naturally regenerated southern subtropical forests in Shenzhen, China and its comparison with the zonal climax of Hong Kong. For. Ecol. Manag. 2006, 222, 384–390. [Google Scholar] [CrossRef]
  28. Sarker, S.K.; Rashid, S.; Sharmin, M.; Haque, M.M.; Sonet, S.S.; Nur-Un-Nabi, M. Environmental correlates of vegetation distribution in tropical Juri forest, Bangladesh. Trop. Ecol. 2014, 55, 177–193. [Google Scholar]
  29. Thuiller, W. On the importance of edaphic variables to predict plant species distributions–limits and prospects. J. Veg. Sci. 2013, 24, 591–592. [Google Scholar] [CrossRef] [Green Version]
  30. Rubio, A.; Escudero, A. Small-scale spatial soil-plant relationship in semi-arid gypsum environments. Plant Soil 2000, 220, 139–150. [Google Scholar] [CrossRef]
  31. Lasky, J.R.; Uriarte, M.; Boukili, V.K.; Erickson, D.L.; John Kress, W.; Chazdon, R.L.; Vila, M. The relationship between tree biodiversity and biomass dynamics changes with tropical forest succession. Ecol. Lett. 2014, 17, 1158–1167. [Google Scholar] [CrossRef]
  32. Wang, Q.G.; Xing, Y.J.; Zhou, X.F.; Han, S.J. Relationship between diversity of forest plant and community dynamics in eastern mountain area of Heilongjiang Province, China. J. For. Res. 2006, 17, 289–292. [Google Scholar] [CrossRef]
  33. Girona, M.M.; Rossi, S.; Lussier, J.M.; Walsh, D.; Morin, H. Understanding tree growth responses after partial cuttings: A new approach. PLoS ONE 2017, 12, e0172653. [Google Scholar]
  34. Rozendaal, D.M.; Chazdon, R.L. Demographic drivers of tree biomass change during secondary succession in northeastern Costa Rica. Ecol. Appl. 2015, 25, 506–516. [Google Scholar] [CrossRef] [PubMed]
  35. Peng, S.L.; Hou, Y.P.; Chen, B.M. Establishment of Markov successional model and its application for forest restoration reference in Southern China. Ecol. Model. 2010, 221, 1317–1324. [Google Scholar] [CrossRef]
  36. Hu, Y.Q.; Su, Z.Y.; Li, W.B.; Li, J.P.; Ke, X.D. Influence of tree species composition and community structure on carbon density in a subtropical forest. PLoS ONE 2015, 10, e0136984. [Google Scholar] [CrossRef] [PubMed]
  37. HU, Y.Q.; LI, W.B.; CUI, J.Y.; SU, Z.Y. Spatial point patterns of dominant species by individual trees and biomass in a subtropical evergreen broad-leaved forest. Acta Ecol. Sin. 2016, 36, 1066–1072. [Google Scholar]
  38. Condit, R. Tropical Forest Census Plots: Methods and Results from Barro Colorado Island, Panama and a Comparison with Other Plots; Springer-Verlag: New York, NY, USA, 1998. [Google Scholar]
  39. Li, J.P.; Xu, M.F.; Su, Z.Y.; Sun, Y.D.; Hu, Y.Q. Soil fertility quality assessment under different vegetation restoration patterns. Acta Ecol. Sin. 2014, 34, 2297–2307. [Google Scholar]
  40. Bao, S.D. Soil and Agricultural Chemistry Analysis; Agriculture Press: Beijing, China, 2005. [Google Scholar]
  41. Beaudet, M.; Messier, C. Variation in canopy openness and light transmission following selection cutting in northern hardwood stands: An assessment based on hemispherical photographs. Agric. For. Meteorol. 2002, 110, 217–228. [Google Scholar] [CrossRef] [Green Version]
  42. Frazer, G.W.; Canham, C.D.; Lertzman, K.P. Gap Light Analyzer (GLA), Version 2.0: Imaging software to extract canopy structure and gap light transmission indices from true-colour fisheye photographs, users manual and program documentation. In Simon Fraser University, Burnaby, British Columbia, and the Institute of Ecosystem Studies; Millbrook: New York, NY, USA, 1999; Volume 36. [Google Scholar]
  43. Guangdong Provincial Forestry Bureau. Guangdong Academy of Forest Inventory and Planning. Common Forest Tree Volume Tables for Forest Inventory in Guangdong Province; Guangdong Provincial Forestry Bureau: Guangzhou, China, 2009.
  44. Li, J.L.; Shi, Z.G. Methodologies for Forestry Carbon Sequestration Projects; China Forestry Publishing House: Beijing, China, 2016. [Google Scholar]
  45. Magurran, A.E. Measuring Biological Diversity; John Wiley & Sons: Hoboken, NJ, USA, 2013. [Google Scholar]
  46. He, S.Y.; Zhong, Y.L.; Sun, Y.D.; Su, Z.Y.; Jia, X.R.; Hu, Y.Q.; Zhou, Q. Topography-associated thermal gradient predicts warming effects on woody plant structural diversity in a subtropical forest. Sci. Rep. 2017, 7, 40387. [Google Scholar] [CrossRef]
  47. McCune, B.; Grace, J.B.; Urban, D.L. Analysis of Ecological Communities; MjM Software Design: Gleneden Beach, OR, USA, 2002. [Google Scholar]
  48. Ter Braak, C.J.F.; Smilauer, P. CANOCO Reference Manual and User’s Guide: Software for Ordination, 5th ed.; Microcomputer Power: Ithaca, NY, USA, 2012. [Google Scholar]
  49. Zhang, R.; Yang, H.; Zhou, Z.; Shen, B.; Xiao, J.; Wang, B. A high-density genetic map of Schima superba based on its chromosomal characteristics. BMC Plant Biol. 2019, 19, 41. [Google Scholar] [CrossRef] [Green Version]
  50. Webb, C.O.; Gilbert, G.S.; Donoghue, M.J. Phylodiversity-dependent seedling mortality, size structure, and disease in a Bornean rain forest. Ecology 2006, 87, S123–S131. [Google Scholar] [CrossRef] [Green Version]
  51. Zhu, Y.; Mi, X.C.; Ren, H.B.; Ma, K.P. Density dependence is prevalent in a heterogeneous subtropical forest. Oikos 2010, 119, 109–119. [Google Scholar] [CrossRef]
  52. Montgomery, R.A.; Chazdon, R.L. Light gradient partitioning by tropical tree seedlings in the absence of canopy gaps. Oecologia 2002, 131, 165–174. [Google Scholar] [CrossRef] [PubMed]
  53. Kruger, L.M.; Midgley, J.J. The influence of resprouting forest canopy species on richness in southern Cape forests, South Africa. Glob. Ecol. Biogeogr. 2001, 10, 567–572. [Google Scholar] [CrossRef]
  54. Overman, A.R.; Scholtz, R.V. Accumulation of biomass and mineral elements with calendar time by cotton: Application of the expanded growth model. PLoS ONE 2013, 8, e72810. [Google Scholar] [CrossRef]
  55. Zheng, D.X.; Cai, Y.X.; Yang, Y.F.; Zheng, Z.Q.; Miao, S.H.; Wu, W.B. Stoichiometric characteristics of C, N and P in the dominant species sapling organs of Castanopsis fissa natural forest in northern Fujian. For. Res. 2017, 30, 154–159. [Google Scholar]
  56. Vandermeer, J.; de la Cerda, I.G. Height dynamics of the thinning canopy of a tropical rain forest: 14 years of succession in a post-hurricane forest in Nicaragua. For. Ecol. Manag. 2004, 199, 125–135. [Google Scholar] [CrossRef]
  57. Grime, J.P. Plant strategy theories: A comment on Craine (2005). J. Ecol. 2007, 95, 227–230. [Google Scholar] [CrossRef]
  58. Grime, J.P. Vegetation classification by reference to strategies. Nature 1974, 250, 26–31. [Google Scholar] [CrossRef]
  59. Gao, T.; Zhang, J.T. Individual and modular biomass of Lespedeza bicolor Turcz. populations in western mountain areas of Beijing. Chin. Bull. Bot. 2007, 24, 581–589. [Google Scholar]
  60. Zhang, J.T. Quantitative Ecology, 3rd ed.; Science Press: Beijing, China, 2018. [Google Scholar]
  61. Pulsford, S.A.; Lindenmayer, D.B.; Driscoll, D.A. A succession of theories: Purging redundancy from disturbance theory. Biol. Rev. 2016, 91, 148–167. [Google Scholar] [CrossRef] [PubMed]
  62. Egler, F.E. Vegetation science concepts I. Initial floristic composition, a factor in old-field vegetation development. Vegetatio 1954, 4, 412–417. [Google Scholar] [CrossRef]
  63. Benjamin, O.K.; Stephen, G.P. Forty-eight years of forest succession: Tree species change across four forest types in Mid-Missouri. Forests 2018, 9, 633. [Google Scholar]
  64. Satdichanh, M.; Ma, H.X.; Yan, K.; Dossa, G.G.O.; Winowiecki, L.; Vågen, T.G.; Gassner, A.; Xu, J.C.; Harrison, R.D.; Swenson, N. Phylogenetic diversity correlated with above-ground biomass production during forest succession: Evidence from tropical forests in Southeast Asia. J. Ecol. 2018, 107, 1419–1432. [Google Scholar] [CrossRef]
  65. Montoro Girona, M.; Morin, H.; Lussier, J.M.; Walsh, D. Radial growth response of black spruce stands ten years after experimental shelterwoods and seed-tree cuttings in boreal forest. Forests 2016, 7, 240. [Google Scholar] [CrossRef] [Green Version]
  66. Zhou, X.Y.; Wang, B.S.; Li, M.G.; Zan, Q.J. The community dynamics of the forest secondary succession in Heishiding Natural Reserve of Guangdong Province. Acta Bot. Sin. 1999, 41, 877–886. [Google Scholar]
Figure 1. Geographic location of the study area in Guangdong, China (A,B) and the plot (C).
Forests 11 00438 g001
Figure 2. The dynamic changes of size-structure during forest succession from 2012 (A) to (2017) (B).
Forests 11 00438 g002
Figure 3. Changes in abundance (A and B) and biomass (C and D; logarithmic scale) of ten dominant species during forest succession. Species code: AIDPYC, Aidia pycnantha (Drake) Tirveng.; ALCTRE, Alchornea trewioides (Benth.) Müll. Arg.; ARDQUI, Ardisia quinquegona Blume; CAMOLE, Camellia oleifera Abel; CASCAR, Castanopsis carlesii (Hemsl.) Hayata; CASFAR, Castanopsis fargesii Franch.; CASHYS, Castanopsis hystrix Hook. f. and Thomson ex A. DC.; CELTET, Celtis tetrandra Roxb.; CHOAXI, Choerospondias axillaris (Roxb.) B.L. Burtt and A.W. Hill; CINPOR, Cinnamomum porrectum (Roxb.) Kosterm.; CLEFOR, Clerodendrum fortunatum L.; CRALIG, Cratoxylum cochinchinense (Lour.) Blume; CUNLAN, Cunninghamia lanceolata (Lamb.) Hook.; ENGROX, Engelhardtia roxburghiana Lindl.; GLOERI, Glochidion eriocarpum Champ. ex Benth.; ILEMEM, Ilex memecylifolia Champ. ex Benth.; ILETRI, Ilex triflora Blume; ITECHI, Itea chinensis Hook. and Arn.; LITROT, Litsea rotundifolia Hemsl.; PINMAS, Pinus massoniana Lamb.; PYRCAL, Pyrus calleryana Decne.; RHOTOM, Rhodomyrtus tomentosa (Aiton) Hassk.; RHUCHI, Rhus chinensis Mill.; SCHSUP, Schima superba Gardner and Champ.; SYZHAN, Syzygium hancei Merr. and L.M. Perry; VIBFOR, Viburnum fordiae Hance; VITNEG, Vitex negundo L.
Forests 11 00438 g003
Figure 4. Changes in community diversity parameters in relation to forest succession. DBH classes are defined according to the tree size, as follows: All (A and B), All trees; Small (C and D), 1 cm ≤ DBH < 7.5 cm; Medium (E and F), 7.5 cm ≤ DBH < 22.5 cm; Large (G and H), 22.5 cm ≤ DBH.
Forests 11 00438 g004
Figure 5. Changes in community biomass parameters in relation to forest succession. DBH classes are defined according to the tree size, as follows: All (A and B), All trees; Small (C and D), 1 cm ≤ DBH < 7.5 cm; Medium (E and F), 7.5 cm ≤ DBH < 22.5 cm; Large (G and H), 22.5 cm ≤ DBH.
Forests 11 00438 g005
Figure 6. RDA ordination of species distribution and environmental variables in 2012 (A) and 2017 (B). Environmental variables: OM = organic matter; TN = total nitrogen; TP = total phosphorus; TK = total potassium; NMC = natural moisture content; BD = bulk density; CWC = capillary water capacity; TPor = total porosity; CO = canopy openness; LAI = leaf area index; TDir = transmitted diffuse solar radiation; TDif = transmitted diffuse solar radiation (mols·m−2·d−1).
Forests 11 00438 g006
Table 1. Estimation of biomass factors.
Species GroupD (g/cm2)BEF (t)R
Cunninghamia lanceolata (Lamb.) Hook.0.3071.6340.246
Pinus massoniana Lamb.0.3801.4720.187
Mixed broad-leaved trees0.4821.5140.262
Table 2. Community characteristics of different diameter at breast height (DBH) classes during forest succession.
IndexDBH Classes (2012)DBH Classes (2017)
AllSmallMediumLargeAllSmallMediumLarge
Plot-Level
Abundance200.28152.4036.7911.09160.46113.6634.1012.70
Species Richness25.1422.628.053.1022.8319.647.983.34
Shannon–Wiener index2.372.351.550.752.302.251.550.81
Biomass (Mg)11.700.434.296.9812.050.373.807.89
Community-Level
Abundance50,07038,1009198277240,11528,41585243176
Species Richness15313899551471279547
Biomass (Mg)2925.4107.01072.31746.13012.991.6949.51971.8
Table 3. Multi-response permutation procedures (MRPP) to test for significance of variation in species composition of different DBH classes during forest succession. The DBH classes are as follows: All, All trees; Small, 1 cm ≤ DBH < 7.5 cm; Medium, 7.5 cm ≤ DBH < 22.5 cm; Large, 22.5 cm ≤ DBH.
Groups ComparedTAP
All (2012) vs. All (2017)−4.980.0030.002
Small (2012) vs. Small (2017)−7.220.0050.000
Medium (2012) vs. Medium (2017)−1.000.0010.131
Large (2012) vs. Large (2017)−0.370.0010.231
Table 4. Multi-response permutation procedures (MRPP) to test for significance of variation in different years plant species composition across different DBH classes. The DBH classes are as follows: All, All trees; Small, 1 cm ≤ DBH < 7.5 cm; Medium, 7.5 cm ≤ DBH < 22.5 cm; Large, 22.5 cm ≤ DBH.
Groups Compared20122017
TAPTAP
Overall Comparison−253.010.171< 10−7−254.560.168< 10−7
Pairwise Comparison
All vs. Small−28.790.019<10−7−42.740.029<10−7
All vs. Medium−184.740.140<10−7−176.130.134<10−7
All vs. Large−242.390.221<10−7−244.070.217<10−7
Small vs. Medium−147.580.099<10−7−136.610.093<10−7
Small vs. Large−216.300.172<10−7−211.610.167<10−7
Medium vs. Large−99.010.096< 10−7−88.230.080< 10−7
Table 5. Plant species with a significant indicator value (IV) ≥ 20 for different DBH classes from both 2012 and 2017 communities. The DBH classes are as follows: Small, 1 cm ≤ DBH < 7.5 cm; Medium, 7.5 cm ≤ DBH < 22.5 cm; Large, 22.5 cm ≤ DBH. * indicates significant at p < 0.05. Species code: ADIMIL, Adinandra milletii (Hook. and Arn.) Benth. and Hook.f. ex Hance; AIDCAN, Aidia canthioides (Champ. ex Benth.) Masam.; AIDPYC, Aidia pycnantha (Drake) Tirveng.; ARDQUI, Ardisia quinquegona Blume; BEITSA, Beilschmiediatsangii Merr.; CAMOLE, Camellia oleifera Abel; CASCAR, Castanopsis carlesii (Hemsl.) Hayata; CASVIL, Casearia villilimba Merr.; CINPOR, Cinnamomum porrectum (Roxb.) Kosterm.; CRYCHI, Cryptocarya chinensis (Hance) Hemsl.; DAPOLD, Daphniphyllum oldhamii (Hemsl.) K.Rosenthal; DIOMOR, Diospyros morrisiana Hance; ELACHI, Elaeocarpus chinensis (Gardner and Champ.) Hook. f. ex Benth.; ENGROX, Engelhardtia roxburghiana Lindl.; EURBRE, Eurya brevistyla Kobuski; EURMAC, Eurya macartneyi Champ.; FICVAR, Ficus variolosa Lindl. ex Benth.; ILEPUB, Ilex pubescens Hook. and Arn.; ITECHI, Itea chinensis Hook. and Arn.; LITROT, Litsea rotundifolia Hemsl.; MACCHI, Machilus chinensis (Benth.) Hemsl.; MACVEL, Machilus velutina Champ. ex Benth.; PHOPRU, Photinia prunifolia (Hook. and Arn.) Lindl.; SCHOCT, Schefflera heptaphylla (L.) Frodin.; SCHSUP, Schima superba Gardner and Champ.; STYODO, Styrax odoratissima F.B. Forbes and Hemsl.; STYSUB, Styrax suberifolius Hook. and Arn.; TARMOL, Tarenna mollissima (Walp.) Rob.
Species Code20122017Rate of Abundance Change (%)Rate of IV Change (%)
DBH
Class
IVAbundance
(Small)
DBH
Class
IVAbundance
(Small)
ITECHI186.4 *3052181.8 *2454−19.6−5.3
ARDQUI173.2 *4918173.1 *4636−5.7−0.1
ELACHI165.7 *792161.6 *664−16.2−6.2
EURMAC165.7 *628164.6 *567−9.7−1.7
ILEPUB165.7 *775163.1 *609−21.4−4
DIOMOR164 *589159.4 *496−15.8−7.2
MACVEL161.9 *774157.8 *596−23−6.6
SCHSUP159.8 *4283153.3 *3489−18.5−10.9
BEITSA155.9 *895151.4 *804−10.2−8.1
PHOPRU152.8 *700145.3 *529−24.4−14.2
MACCHI152 *519141 *319−38.5−21.2
STYODO149.4 *457143.2 *342−25.2−12.6
FICVAR146.4 *280135.6 *192−31.4−23.3
AIDCAN145.7 *1421147.7 *1368−3.74.4
EURBRE144.0 *327140.5 *270−17.4−8
ADIMIL142.7 *565137.2 *335−40.7−12.9
SCHOCT142.6 *376137.1 *325−13.6−12.9
CASCAR142.2 *48262312813−41.7
TARMOL139.5 *298134 *237−20.5−13.9
ENGROX134.2 *783116.9369−52.9−50.6
CASVIL133.8 *251128.3 *195−22.3−16.3
CRYCHI131.8 *252129.5 *231−8.3−7.2
AIDPYC131.7 *1699131.5 *1598−5.9−0.6
CAMOLE130.8 *730122.4 *264−63.8−27.3
CINPOR128.2 *329225.7 *181−45
STYSUB123.2 *340117.4244−28.2−25
DAPOLD122.2 *153112.280−47.7−45
Table 6. Eigenvalues and explained variations of the first four axes in redundancy analysis (RDA) ordination of species distribution and environmental variables.
StatisticAxis 1Axis 2Axis 3Axis 4
2012
Eigenvalues0.14570.07390.03770.0314
Cumulative explained variation (%)14.5721.9725.7428.88
Pseudo-canonical correlation0.80740.76110.74320.8244
Cumulative explained fitted variation (%)39.8660.0870.3878.97
p value0.0010.0280.6750.797
2017
Eigenvalues0.17030.04770.03540.0295
Cumulative explained variation (%)17.0321.825.3428.29
Pseudo-canonical correlation0.85630.64350.74760.7901
Cumulative explained fitted variation (%)47.6360.9770.8979.14
p value0.0010.5590.8380.919
Table 7. Effects of environmental variables on species distribution.
Environmental VariablesExplained VariationExplained Fitted Variation (%)p (adj)
2012
Total phosphorus (g/kg)7.721.10.012
Transmitted direct solar radiation (mols·m−2·d−1)5.615.30.012
Organic matter (g/kg)4.712.90.024
Capillary water capacity (g/kg)3.810.40.024
2017
Total phosphorus (g/kg)10.429.00.012
Total potassium (g/kg)5.114.20.024

