The Benefits of Local Forest Recreation in Austria and Its Dependence on Naturalness and Quietude


Abstract
1. Introduction
2. Materials and Methods
2.1. The Survey Instrument and its Structure
2.2. Individual Travel Demand Model
2.3. Design of a Baseline Management Scenario for Comparison to the Status Quo
- Increase in the amount of timber that is lumbered, and changes of the forest management practices within the legal limits of the forest and nature conservation laws (e.g., monocultures, shorter rotation periods from planting to lumbering, more clear-cuttings compared to small-scale or single-tree lumbering; it is assumed that the PEFC certification of all timber lumbered in ÖBf forests does not change); and
- the reduction of conservation efforts, as well as the limitation of protected areas to the legally feasible minimum.
3. Descriptive Survey Results
4. The Value of Naturalness and Quietude for Local Recreation
5. The Potential Benefits of the Current Management Framework to Sustain the Value of Local Recreation
- Forests are open and accessible to the public for recreation purposes according to Austrian law.
- Recreation activities do not equally depend on the naturalness of the forest. Some activities, such as cycling do not rely on ecological forest management while the naturalness of the forest influences other activities, such as walking or wildlife observation.
- Quietude in forests is important for many types of recreation but forest owners and managers cannot increase natural quietude. Rare exceptions are the restriction of access to certain areas (e.g., banning cars or reducing picnic facilities), and the limitation of noise from lumbering to hours with fewer visitors. Most artificial noises that can be heard in forests (such as noise from infrastructures and air transport; see [20]), cannot be prevented by landowners.
- The density of vegetation may reduce noise to some extent. Forest management may increase the density of vegetation and lead to a higher degree of naturalness.
6. Results and Discussion
7. Conclusions
Author Contributions
Funding
Acknowledgments
Conflicts of Interest
Appendix A. Selected Questions of the Representative Household Survey
- -
- Walking/hiking with kids & the family
- -
- Nordic walking, jogging, fitness
- -
- Cross-country skiing, ski tours
- -
- Cycling and mountain biking
- -
- Wildlife observation
- -
- Collection of plants/mushrooms
- -
- Participation in excursions and guided tours
- -
- Tour/round trip to tourist destinations (e.g., restaurants)
- -
- Picnic/BBQ
- -
- Hunting
- -
- Fishing
- -
- Very often (about 1 time per week)
- -
- Often (2 to 3 times per month)
- -
- Not too often (about 1 time per month)
- -
- Rarely (3 to 5 times per year)
- -
- Very rarely (1 to 2 times per year)
- -
- Almost never (more rarely than 1 time per year)
- -
- Never (no activities in the last 5 years)
- -
- Up to 3 km
- -
- Up to 5 km
- -
- Up to km
- -
- Up to km
- -
- Up to km
- -
- Up to km
- -
- 26 km or more
- -
- Mostly during the summer half-year (spring to fall)
- -
- During the winter season
- -
- All year round
- -
- Rather during the week
- -
- Rather on weekends
- -
- Regardless of the day (during the week and on weekends)
- -
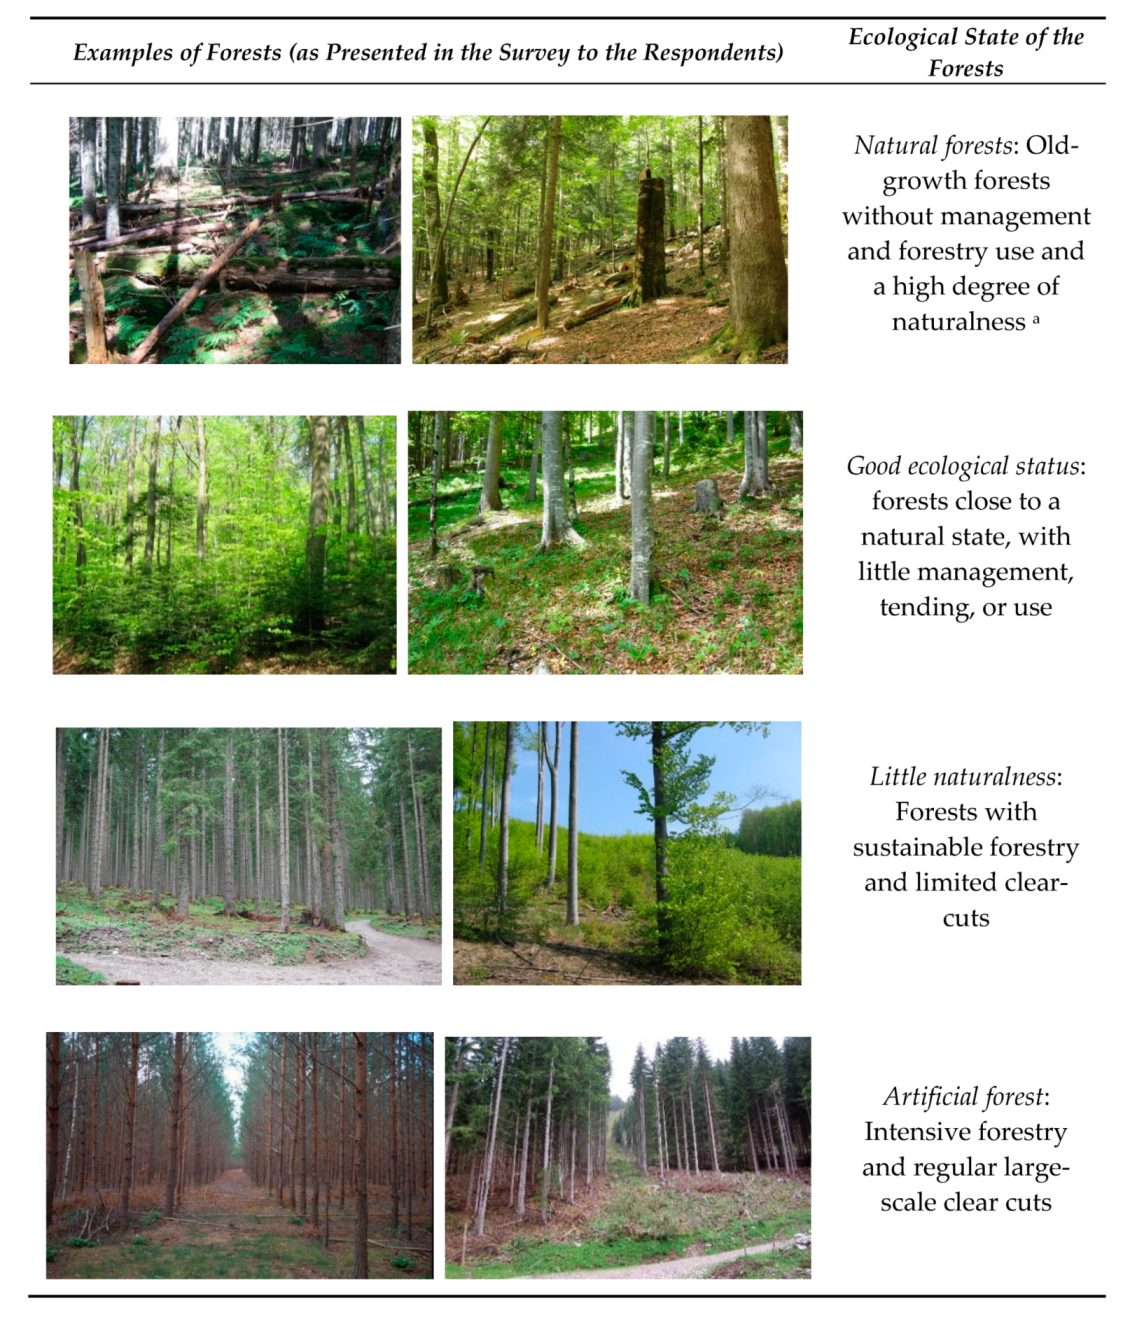
- Natural forests: Old-growth forests without management and forestry use
- -
- Good ecological status: forests close to a natural state, with little management, tending, or use
- -
- Little naturalness: Forests with sustainable forestry and limited clear-cuts
- -
- Artificial forest: Intensive forestry and regular large-scale clear cuts
- -
- … only natural sounds
- -
- … some artificial noise
- -
- … intensive and permanent artificial noises
- -
- Yes
- -
- No
Appendix B. Additional Data and Information on the Transport Mode Choice of Respondents

| Activity | By Foot | Bicycle | Car | Public Transport | Mean Distance (km)a |
|---|---|---|---|---|---|
| Walking/hiking alone (includes walking the dog) | 62.1% | 4.6% | 24.3% | 9.0% | 5.1 |
| Walking/hiking with kids & the family | 52.2% | 5.5% | 36.5% | 5.8% | 7.1 |
| Nordic walking, jogging, fitness | 75.4% | 4.5% | 17.9% | 2.2% | 5.0 |
| Cross-country skiing, ski tours | 21.3% | 8.5% | 66.0% | 4.3% | 15.9 |
| Cycling and mountain biking | 11.1% | 78.7% | 7.4% | 2.8% | 7.4 |
| Wildlife observation | 43.9% | 9.8% | 26.8% | 19.5% | 7.0 |
| Collection of plants/mushrooms | 33.3% | 8.3% | 54.2% | 4.2% | 10.0 |
| Participation in excursions and guided tours | 55.6% | 0.0% | 22.2% | 22.2% | 12.3 |
| Tour/round trip to tourist destinations (e.g., restaurants) | 6.3% | 8.3% | 79.2% | 6.3% | 15.9 |
| Picnic/BBQ | 15.4% | 15.4% | 65.4% | 3.8% | 8.4 |
| Hunting | 14.3% | 0.0% | 85.7% | 0.0% | 8.5 |
| Fishing | 18.8% | 25.0% | 56.3% | 0.0% | 10.9 |
Appendix C. Explanatory Footnotes to Table 8. Economic Value of Recreation on ÖBf Land Based on Current Multifunctional Forestry Compared to the Hypothetical Baseline Scenario (in Million EUR)
- a
- Total benefits of local recreation in forests are derived from the total recreation benefits per person displayed in Table 6 multiplied by the relevant population living in a 5 km radius from the forest.
- b
- The additional benefits of a higher degree of naturalness of the status quo compared to the baseline scenario are calculated by the following equation: . denotes the increase of recreation benefits depending on the degree of naturalness for the status quo (current management) compared to the baseline scenario. are total recreation benefits (depending on the degree of naturalness), and and are the degrees of naturalness for the status quo and the baseline scenario, respectively. As outlined in Table 1, , while .
- c
- The additional recreation benefits owing to increased quietude which are derived from a reduction of lumbering in ÖBf forests are computed by the following equation: . denotes the additional recreation benefits owing to a reduction of lumbering in ÖBf forests. are total recreation benefits (depending on quietude). and is the share of respondents pursuing their recreation activities during weekdays when timber is lumbered and denotes the share of artificial noises in forests stemming from lumbering during weekdays. is the annual amount of timber lumbered in the baseline scenario, while denotes the quantity of lumbered timber in the status quo. As outlined in Table 1, , while .
- d
- The additional recreation benefits stemming from a higher density of vegetation in ÖBf forests are calculated by the following equation: . The variable denotes the share of respondents who feel disturbed by artificial noises stemming from infrastructures and residential areas outside of the forests that a more dense vegetation may reduce. It is assumed that the changes of the degree of naturalness can approximate the change of the density of the vegetation.
References
- Andkjær, S.; Arvidsen, J. Places for active outdoor recreation—a scoping review. J. Outdoor Recreat. Tour. 2015, 12, 25–46. [Google Scholar] [CrossRef]
- Zandersen, M.; Tol, R.S. A meta-analysis of forest recreation values in Europe. J. For. Econ. 2009, 15, 109–130. [Google Scholar] [CrossRef]
- Iglesias-Merchan, C.; Diaz-Balteiro, L.; Soliño, M. Transportation planning and quiet natural areas preservation: Aircraft overflights noise assessment in a National Park. Transp. Res. 2015, 41, 1–12. [Google Scholar] [CrossRef]
- Edwards, D.E.; Jay, M.; Jensen, F.S.; Lucas, B.; Marzano, M.; Montagné, C.; Peace, A.; Weiss, G. Public preferences across Europe for different forest stand types as sites for recreation. Ecol. Soc. 2012, 17, 27. [Google Scholar] [CrossRef]
- Pröbstl-Haider, U. Cultural ecosystem services and their effects on human health and well-being—A cross-disciplinary methodological review. J. Outdoor Recreat. Tour. 2015, 10, 1–13. [Google Scholar] [CrossRef]
- Sandifer, P.A.; Sutton-Grier, A.E.; Ward, B.P. Exploring connections among nature, biodiversity, ecosystem services, and human health and well-being: Opportunities to enhance health and biodiversity conservation. Ecosyst. Serv. 2015, 12, 1–15. [Google Scholar] [CrossRef]
- Moseley, D.; Connolly, T.; Sing, L.; Watts, K. Developing an indicator for the physical health benefits of recreation in woodlands. Ecosyst. Serv. 2018, 31, 420–432. [Google Scholar] [CrossRef]
- European Environment Agency (EEA). Common International Classification of Ecosystem Services (CICES, v. 4.3). Available online: http://www.eea.europa.eu (accessed on 7 July 2017).
- Stenger, A.; Harou, P.; Navrud, S. Valuing environmental goods and services derived from forests. J. For. Econ. 2009, 15, 1–14. [Google Scholar] [CrossRef]
- Clough, P. The value of ecosystem services for recreation. In Ecosystem Services in New Zealand—Conditions and Trends; Dymond, J.R., Ed.; Manaaki Whenua Press: Lincoln, New Zealand, 2013; pp. 330–342. [Google Scholar]
- Bertram, C.; Larondelle, N. Going to the woods is going home: Recreation benefits of a larger urban forest site—A travel cost analysis for Berlin, Germany. Ecol. Econ. 2017, 132, 255–263. [Google Scholar] [CrossRef]
- Braat, L.C.; de Groot, R. The ecosystem services agenda: bridging the worlds of natural science and economics, conservation and development, and public and private policy. Ecosyst. Serv. 2012, 1, 4–15. [Google Scholar] [CrossRef]
- Vallecillo, S.; La Notte, A.; Zulian, G.; Ferrini, S.; Maes, J. Ecosystem services accounts: Valuing the actual flow of nature-based recreation from ecosystems to people. Ecol. Model. 2018, 392, 196–211. [Google Scholar] [CrossRef] [PubMed]
- Grebner, D.L.; Bettinger, P.; Siry, J.P. Introduction to Forestry and Natural Resources; Academic Press: London, UK, 2013. [Google Scholar]
- Bundesforstegesetz (1996). Bundesgesetz zur Neuordnung der Rechtsverhältnisse der Österreichischen Bundesforste und Errichtung einer Aktiengesellschaft zur Fortführung des Betriebes „Österreichische Bundesforste” idF. BGBl. I Nr. 136/2004 [Federal act regulating the legal relationships of the Austrian Federal Forests and the establishment of a public limited company as a legal successor; as amended by the Austrian federal register 136/2004].
- Dudley, N. Guidelines for Applying Protected Area Management Categories; IUCN: Gland, Switzerland, 2008. [Google Scholar]
- Getzner, M.; Gutheil-Knopp-Kirchwald, G.; Kreimer, E.; Kirchmeir, H.; Huber, M. Gravitational natural hazards: Valuing the protective function of Alpine forests. For. Policy Econ. 2017, 80, 150–159. [Google Scholar] [CrossRef]
- Costanza, R.; de Groot, R.; Braat, L.; Kubiszewski, I.; Fioramonti, L.; Sutton, P.; Farber, S.; Grasso, M. Twenty years of ecosystem services: How far have we come and how far do we still need to go? Ecosyst. Serv. 2017, 28, 1–16. [Google Scholar] [CrossRef]
- Czajkowski, M.; Bartczak, A.; Giergicsny, M.; Navrud, S.; Żylicz, T. Providing preference-based support for forest ecosystem management. For. Policy Econ. 2014, 39, 1–12. [Google Scholar] [CrossRef]
- Buxton, R.T.; McKenna, M.F.; Mennitt, D.; Fristrup, K.; Crooks, K.; Angeloni, L.; Wittemyer, G. Noise pollution if is pervasive in U.S. protected areas. Science 2017, 356, 531–533. [Google Scholar] [CrossRef]
- Getzner, M.; Meyerhoff, J.; Schläpfer, F. Willingness to pay for nature conservation policies in state-owned forests: An Austrian case study. Forests 2018, 9, 537. [Google Scholar] [CrossRef]
- Bakhtiari, F.; Jacobsen, J.B.; Strange, N.; Helles, F. Revealing lay people’s perceptions of forest biodiversity value components and their application in valuation method. Glob. Ecol. Conserv. 2014, 1, 27–42. [Google Scholar] [CrossRef]
- De Valck, J.; Landuyt, D.; Broekx, S.; Liekens, I.; De Nocker, L.; Liesbet Vranken, L. Outdoor recreation in various landscapes: Which site characteristics really matter? Land Use Policy 2017, 65, 186–197. [Google Scholar] [CrossRef]
- Paudyal, R.; Stein, T.V.; Ober, H.K.; Swisher, M.E.; Jokela, E.J.; Adams, D.C. Recreationists’ Perceptions of Scenic Beauty and Satisfaction at a Public Forest Managed for Endangered Wildlife. Forests 2018, 9, 241. [Google Scholar] [CrossRef]
- Parviainen, J. Virgin and natural forests in the temperate zone of Europe. For. Snow Landsc. Res. 2005, 79, 9–18. [Google Scholar]
- Cameron, A.C.; Trivedi, P.K. Regression Analysis of Count Data, 2nd ed.; Cambridge University Press: Cambridge, UK, 2013. [Google Scholar]
- Kling, C.L.; Crooker, J.R. Recreation demand models for environmental valuation. In Handbook of Environmental and Resource Economics; Bergh, J., Ed.; Edward Elgar: Cheltenham, UK, 1999; pp. 755–764. [Google Scholar]
- Phaneuf, D.J.; Smith, V.K. Recreation demand models. In Handbook of Environmental Economics; Mäler, K.G., Vincent, J., Eds.; North Holland: Amsterdam, The Netherlands, 2005; Volume 2, pp. 671–761. [Google Scholar]
- Randall, A. A difficulty with the travel cost method. Land Econ. 1994, 70, 88–96. [Google Scholar] [CrossRef]
- RVS. Nutzen-Kosten-Untersuchungen im Verkehrswesen; Austrian Ministry of Transport Innovation and Technology: Vienna, Austria, 2010. [Google Scholar]
- Shires, J.D.; de Jong, G.C. An international meta-analysis of values of travel time savings. Eval. Program Plan. 2009, 32, 315–325. [Google Scholar] [CrossRef] [PubMed]
- Small, K.A. Valuation of travel time. Econ. Transp. 2012, 1, 2–14. [Google Scholar] [CrossRef]
- Wheat, P.; Batley, R. Quantifying and decomposing the uncertainty in appraisal value of travel time savings. Transp. Policy 2015, 44, 134–142. [Google Scholar] [CrossRef]
- Hampicke, U. Naturschutzökonomie; UTB: Stuttgart, Germany, 1991. [Google Scholar]
- Lankia, T.; Neuvonen, M.; Pouta, E. Effects of water quality changes on the recreation benefits of swimming in Finland: Combined travel cost and contingent behavior model. Water Resour. Econ. 2019, 25, 2–12. [Google Scholar] [CrossRef]
- Krizek, K.J. Measuring the wind through your hair? Unravelling the positive utility of bicycle travel. Res. Transp. Bus. Manag. 2019, in press. [Google Scholar] [CrossRef]
- de Vos, J. Do people travel with their preferred travel mode? Analysing the extent of travel mode dissonance and its effect on travel satisfaction. Transp. Res. 2018, 117, 261–274. [Google Scholar] [CrossRef]
- Zhu, J.; Fan, Y. Daily travel behavior and emotional well-being: Effects of trip mode, duration, purpose, and companionship. Transp. Res. 2018, 118, 360–373. [Google Scholar] [CrossRef]
- Gössling, S.; Choi, A.; Dekker, K.; Metzler, D. The Social Cost of Automobility, Cycling and Walking in the European Union. Ecol. Econ. 2019, 158, 65–74. [Google Scholar] [CrossRef]
- Abrantes, P.A.L.; Wardman, M.R. Meta-analysis of UK values of travel time: An update. Transp. Res. 2011, 45, 1–17. [Google Scholar] [CrossRef]
- Hörnstein, L.; Fredman, P. On the distance to recreational forests in Sweden. Landsc. Urban Plan. 2000, 51, 1–10. [Google Scholar] [CrossRef]
- Markussen, M.; Buse, R.; Garrelts, M.; Manez Costa, M.; Menzel, S.; Marggraf, R. Valuation and Conservation of Biodiversity; Springer: Berlin, Germany; New York, NY, USA, 2003. [Google Scholar]
- Ninan, K.N. Conserving and Valuing Ecosystem Services and Biodiversity; Earthscan: London, UK, 2009. [Google Scholar]
- Haines-Young, R.; Potschin, M.; Kienast, F. Indicators of ecosystem service potential at European scales: mapping marginal changes and trade-offs. Ecol. Indic. 2012, 21, 39–53. [Google Scholar] [CrossRef]
- Von Grünigen, S.; Kienast, F.; Ott, W.; Cerny, N. Ökosysteme und ihre Leistungen erfassen und räumlich darstellen [Assessment and mapping of ecosystem services]; Bundesamt für Umwelt [Federal Environmental Agency]: Zurich, Switzerland,, 2013. [Google Scholar]
- Kumar, P. The Economics of Ecosystems and Biodiversity—Ecological and Economic Foundations; Earthscan: London, UK, 2010. [Google Scholar]
- Elsasser, P.; Meyerhoff, J.; Montagné, C.; Stenger, A. A bibliography and database on forest benefits valuation studies from Austria, France, Germany, and Switzerland—A possible base for a concerted European approach. J. For. Econ. 2009, 15, 93–107. [Google Scholar] [CrossRef]
- ÖBf. Nachhaltigkeitsbericht 2017; Austrian Federal Forests (ÖBf): Purkersdorf, Austria, 2018. [Google Scholar]
- Austrian Forestry Act. Forstgesetz: Bundesgesetz vom 3. Juli 1975, mit dem das Forstwesen geregelt wird (Forstgesetz 1975), BGBl. Nr. 440/1975 idF BGBl. I Nr. 56/2016.
- Austrian Forestry Act – Appendix. Protocols to the Austrian Forestry Act (BGBl. Nr. 440/1975), NR: GP XIII RV 1266 AB 1677 S. 150. BR: 1392 AB 1425 S. 344.
- Getzner, M.; Gutheil-Knopp-Kirchwald, G.; Huber, M.; Jungmeier, M.; Kirchmeir, H.; Kreimer, E.; Zak, D. Werte der Natur: Wasserversorgung, Erosionsschutz, lokale Klimaregulation Erholungsleistung, Biologische Vielfalt [Values of Nature: drinking water, erosion control, local climate regulation, recreation, biodiversity]; Research Report to the Österreichische Bundesforste (ÖBf) [Austrian Federal Forests]; Vienna University of Technology: Vienna, Austria, 2016. [Google Scholar]
- Getzner, M.; Huber, M.; Kirchmeir, H. Werte der Natur: Holz, Kultur-und Naturlandschaft für den Tourismus, Erneuerbare Energien, Ruhe, Speicherung von CO2 [Values of Nature: Timber, cultural and natural landscapes for tourism, renewable energy, quiet, carbon storage]; Research Report to the Österreichische Bundesforste (ÖBf) [Austrian Federal Forests]; Vienna University of Technology: Vienna, Austria, 2017. [Google Scholar]
- Grabherr, G.; Koch, G.; Kirchmeir, H.; Reiter, K. Hemerobie österreichischer Waldökosysteme [Hemeroby of Austrian forest ecosystems]. In Publications of the Austrian MaB program; MaB: Innsbruck, Austria, 1998; Volume 17. [Google Scholar]
- Schirpke, U.; Meisch, C.; Marsoner, T.; Tappeiner, U. Revealing spatial and temporal patterns of outdoor recreation in the European Alps and their surroundings. Ecosyst. Serv. 2018, 31, 336–350. [Google Scholar] [CrossRef]
- Getzner, M. Visitors’ preferences for landscape conservation in Alpine environments: Differences across regions, conservation programs, and socio-economic groups. Landsc. Res 2019. online first. [Google Scholar] [CrossRef]
- Bartczak, A.; Englin, J.; Rang, A. When are forest visits valued the most? An analysis of the seasonal demand for forest recreation in Poland. Environ. Resour. Econ. 2012, 52, 249–264. [Google Scholar] [CrossRef]
- Sana, S.; Eja, P. Recreational cultural ecosystem services: How do people describe the value? Ecosyst. Serv. 2017, 26, 1–9. [Google Scholar]
- Trimpop, M.; Hirsch, K.-W. Lärmschutz durch Wald—Teil 1: Bestimmung der Schallpegelminderung durch Pfadvergleichsmessungen [Noise reduction in forests—part 1: The reduction of noise assessed by comparing noise paths]. In Fortschritte der Akustik—DAGA 2010, Proceedings of the 36; Deutsche Gesellschaft für Akustik (DEGA), Ed.; Deutsche Jahrestagung für Akustik: Berlin, Germany, 2010; pp. 167–168. [Google Scholar]
- Hirsch, K.-W.; Trimpop, M. Lärmschutz durch Wald—Teil 2: Forstliche Aspekte bei der Schallausbreitungsrechnung [Noise reduction in forests—part 2: Forests and the calculation of sound propagation]. In Fortschritte der Akustik—DAGA 2010, Proceedings of the 36; Deutsche Gesellschaft für Akustik (DEGA), Ed.; Deutsche Jahrestagung für Akustik: Berlin, Germany, 2010; pp. 169–170. [Google Scholar]
- Elsasser, P.; Weller, P. Aktuelle und potentielle Erholungsleistung der Wälder in Deutschland: Monetärer Nutzen der Erholung im Wald aus Sicht der Bevölkerung. Allg. Forst. Jagdztg. 2013, 184, 83–95. [Google Scholar]
- Bösch, M.; Elsasser, P.; Franz, K.; Lorenz, M.; Moning, C.; Olschewski, R.; Rödl, A.; Schneider, H.; Schröppel, B.; Weller, P. Forest ecosystem services in rural areas of Germany: Insights from the national TEEB study. Ecosyst. Serv. 2018, 31, 77–83. [Google Scholar] [CrossRef]
- De Salvo, M.; Signorello, G. Non-market valuation of recreational services in Italy: A meta-analysis. Ecosyst. Serv. 2015, 16, 47–62. [Google Scholar] [CrossRef]
- Schägner, J.P.; Brander, L.; Paracchini, M.L.; Maes, J.; Gollnow, F.; Bertzky, B. Spatial dimensions of recreational ecosystem service values: A review of meta-analyses and a combination of meta-analytic value-transfer and GIS. Ecosyst. Serv. 2018, 31, 395–409. [Google Scholar] [CrossRef]
- Mayer, M.; Woltering, M. Assessing and valuing the recreational ecosystem services of Germany’s national parks using travel cost models. Ecosyst. Serv. 2018, 31, 371–386. [Google Scholar] [CrossRef]
- Getzner, M. Importance of free-flowing rivers for recreation: Case study of the River Mur in Styria, Austria. J. Water Resour. Plan. Manag. 2014, 141, 04014050. [Google Scholar] [CrossRef]


| Categories of Land | Total Area (hectares) | Share of Land Categories (% of total area) | Current Management (status quo) a: Multifunctional Forestry | Baseline Scenario |
|---|---|---|---|---|
| Total ÖBf area (rounded) | 844,000 | 100% | 100% | 100% |
| of which: forests | 511,000 | 61% | 61% | 61% |
| Status of conservation b | ||||
| Strict conservation | - | - | 8% | 6% |
| Strong conservation | - | - | 25% | 20% |
| Weak conservation | - | - | 17% | 14% |
| Intensity of commercial forestry c,d | ||||
| Intensive commercial forestry c,d | 336,000 | 40% | 40% | ++ |
| Sustainable forestry c,d | 5000 | + | ||
| Protective forests without commercial use | 97,280 | 12% | 12% | 0 |
| Protective forests with commercial use | 54,720 | 6% | 6% | ++ |
| Other areas inside forests | 18,000 | 3% | ||
| Land with some conservation status (rounded, % of total land) | 50% | 40% | ||
| Degree of naturalness (measured by a biodiversity index based on the hemeroby concept) (mean on a 5-point scale; 5 = completely natural) e | 2.80 | 2.50 | ||
| Annual timber production (million solid m3) | 1.52 | 1.80 | ||
| Survey Subject | Share of Respondents/Value of Variable |
|---|---|
| Perceived ecological condition of Austrian forests | |
| Very good/good ecological condition | 81.5% |
| Condition of the forest closest to the respondent’s home | |
| Natural forest | 12.7% |
| Good ecological status | 56.8% |
| Little naturalness | 16.4% |
| Artificial forest | 6.7% |
| (Self-reported) Distance of the respondent’s household to the next forest | |
| up to 3 km | 62.4% |
| 3 to 5 km | 17.2% |
| 5 to 10 km | 10.6% |
| more than 10 km | 9.9% |
| Austrian residents living in a certain distance to the next forest | |
| up to 3 km | 5.331 million (62.34%) |
| 3 to 5 km | 1.469 million (17.18%) |
| 5 to 10 km | 0.905 million (10.58) |
| more than 10 km | 0.846 million (9.89%) |
| Austrian residents living in a certain distance to the next forest owned by the Austrian Federal Forests (ÖBf) | |
| up to 3 km | 2.064 million (39.02%) |
| 3 to 5 km | 0.459 million (8.68%) |
| 5 to 10 km | 1.644 million (31.08%) |
| more than 10 km | 1.122 million (21.21%) |
| Distance from the respondent’s household to the next (closest) forest | 4.56 km (mean) 2.00 km (median) 5.30 km (std. deviation) |
| Activity | No. of Respondents | Share of Respondents Pursuing the Resp. Activity | Perceived Naturalness of the Forest of the Respective Activity (1 = completely natural, 4 = not natural at all) | |
|---|---|---|---|---|
| Mean | Std. Dev. | |||
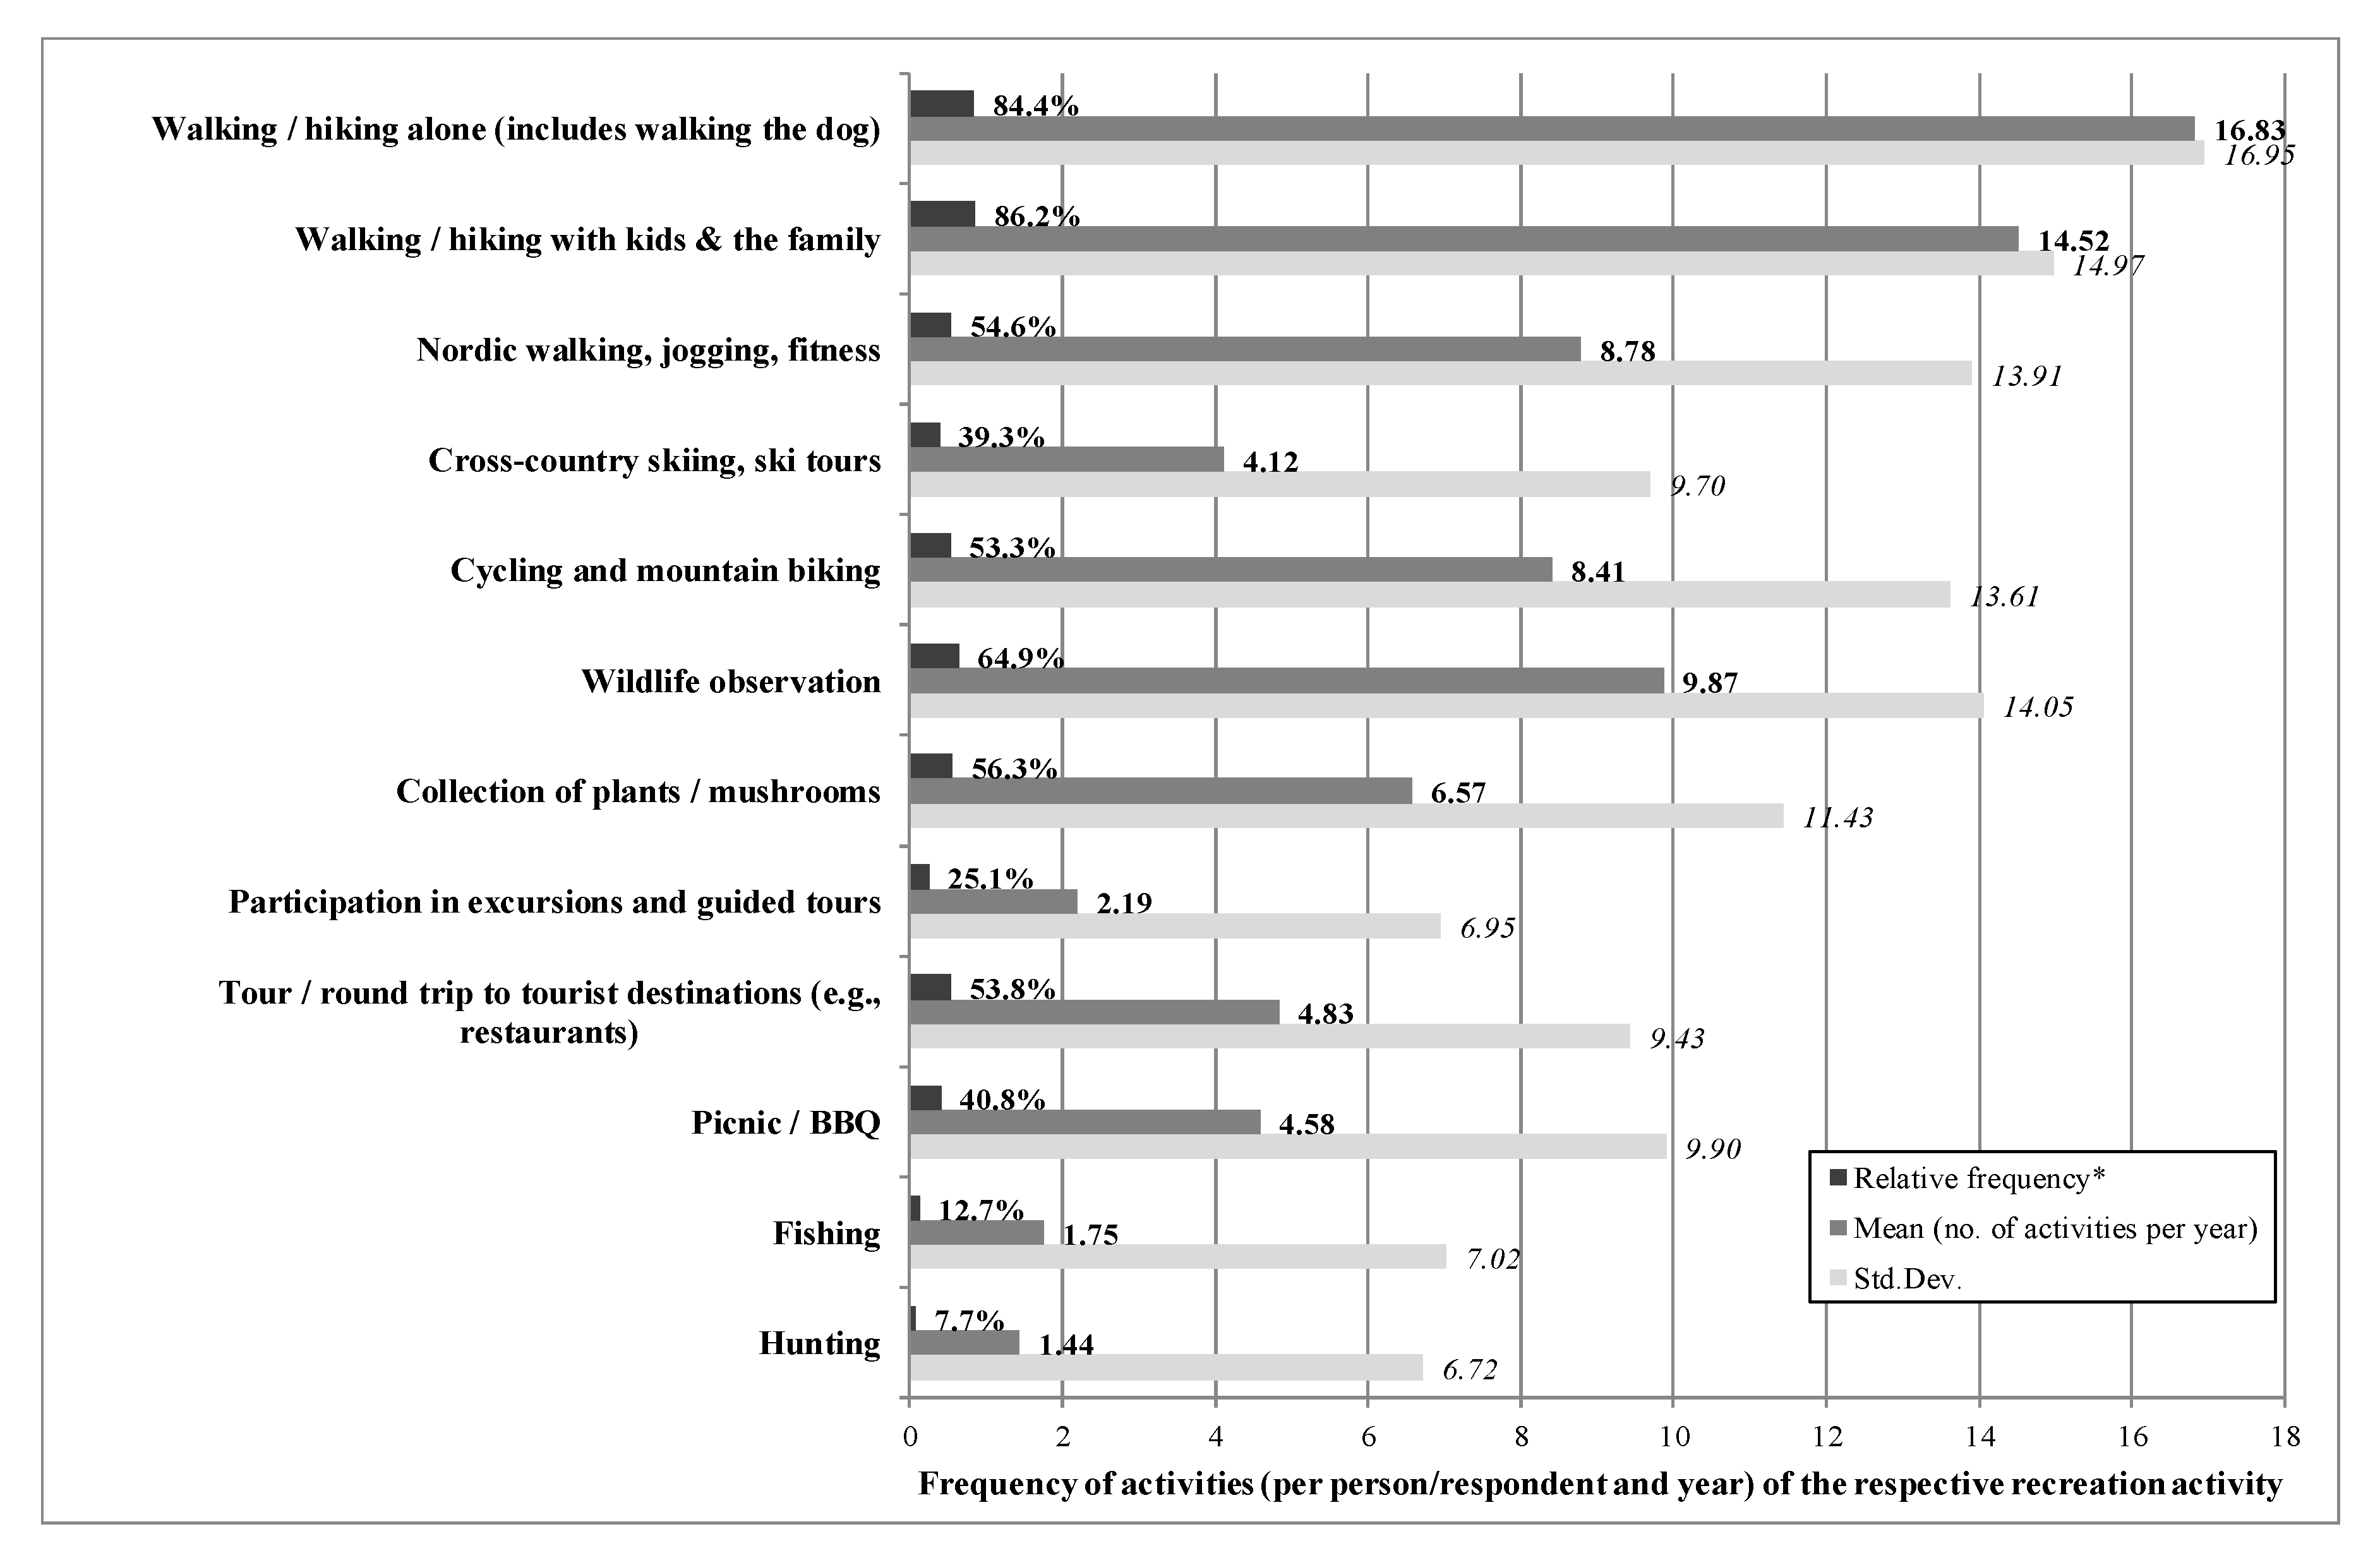
| Walking/hiking alone (includes walking the dog) | 1267 | 84.41% | 1.99 | 0.71 |
| Walking/hiking with kids & the family | 1294 | 86.21% | 2.04 | 0.66 |
| Nordic walking, jogging, fitness | 820 | 54.63% | 2.26 | 0.77 |
| Cross-country skiing, ski tours | 590 | 39.31% | 2.79 | 0.97 |
| Cycling and mountain biking | 800 | 53.30% | 2.40 | 0.84 |
| Wildlife observation | 974 | 64.89% | 1.82 | 0.71 |
| Collection of plants/mushrooms | 845 | 56.30% | 1.77 | 0.69 |
| Participation in excursions and guided tours | 377 | 25.12% | 2.01 | 0.80 |
| Tour/round trip to tourist destinations (e.g., restaurants) | 808 | 53.83% | 2.29 | 0.79 |
| Picnic/BBQ | 613 | 40.84% | 2.31 | 0.84 |
| Hunting | 116 | 7.73% | 2.04 | 0.84 |
| Fishing | 190 | 12.66% | 2.13 | 0.82 |
| Activity | No. of Respondents | Levels of Noises (quietude) in the Forest(% of Respondents Pursuing the Resp. Activity) | |||
|---|---|---|---|---|---|
| Only Natural Noises | Some Artificial Noise | Intensive & Permanent Artificial Noises | Disturbance by Artificial Noises (Some or Intensive) | ||
| Walking/hiking alone (includes walking the dog) | 1267 | 48.86% | 47.91% | 3.24% | 16.26% |
| Walking/hiking with kids & the family | 1294 | 46.52% | 50.46% | 3.01% | 16.23% |
| Nordic walking, jogging, fitness | 820 | 37.68% | 56.83% | 5.49% | 15.49% |
| Cross-country skiing, ski tours | 590 | 28.81% | 53.05% | 18.14% | 13.73% |
| Cycling and mountain biking | 800 | 35.13% | 58.25% | 6.63% | 13.50% |
| Wildlife observation | 974 | 62.94% | 34.70% | 2.36% | 17.35% |
| Collection of plants/mushrooms | 845 | 63.55% | 33.96% | 2.49% | 13.85% |
| Participation in excursions and guided tours | 377 | 36.34% | 57.82% | 5.84% | 19.89% |
| Tour/round trip to tourist destinations (e.g., restaurants) | 808 | 25.62% | 59.78% | 14.60% | 19.18% |
| Picnic/BBQ | 613 | 37.36% | 53.51% | 9.14% | 22.35% |
| Hunting | 116 | 52.59% | 43.10% | 4.31% | 27.59% |
| Fishing | 190 | 48.95% | 44.21% | 6.84% | 27.37% |
| Dependent Variable: Frequency of Trips to the Preferred Forest for Local Recreation Activities. | Coefficient | z-Statistic | Prob. | 95% Confidence Intervalsof Coefficients | |
|---|---|---|---|---|---|
| Lower Bound | Upper Bound | ||||
| Constant | 2.962 | 93.13 | *** | 2.901 | 3.023 |
| Travel costs = measured by the travel distance (in km) to the preferred forest for local recreation. | −0.025 | 11.66 | *** | −0.027 | −0.022 |
| Activities = 1 for the respective recreation activity (see list below); the activity “Walking/hiking alone (includes walking the dog)” is the baseline activity. | |||||
| Walking/hiking with kids & the family | −0.096 | 3.87 | ** | −0.174 | −0.017 |
| Nordic walking, jogging, fitness | −0.185 | 5.11 | *** | −0.273 | −0.096 |
| Cross-country skiing, ski tours | −0.393 | 7.09 | *** | −0.496 | −0.290 |
| Cycling and mountain biking | −0.107 | 2.63 | ** | −0.197 | −0.017 |
| Wildlife observation | −0.280 | 8.48 | *** | −0.365 | −0.196 |
| Collection of plants/mushrooms | −0.489 | 11.88 | *** | −0.579 | −0.399 |
| Participation in excursions and guided tours | −0.702 | 10.39 | *** | −0.821 | −0.582 |
| Tour/round trip to tourist destinations (e.g., restaurants) | −0.505 | 9.84 | *** | −0.600 | −0.411 |
| Picnic/BBQ | −0.471 | 9.39 | *** | −0.569 | −0.372 |
| Hunting | −0.039 | 0.47 | - | −0.231 | 0.152 |
| Fishing | −0.246 | 3.09 | ** | −0.401 | −0.090 |
| Degree of naturalness = 1 if the respondent perceives the preferred forest as a natural forest (highest degree of naturalness) | 0.329 | 7.84 | *** | 0.273 | 0.384 |
| Quiet = 1 if respondent could only hear natural sounds | 0.127 | 3.64 | *** | 0.081 | 0.172 |
| Adj. R2 | 0.109 | ||||
| S.E. of regression | 14.029 | ||||
| Log likelihood | −31,684.640 | ||||
| LR statistic | 94,696.6*** | ||||
| n (total number of observations included) | 8694 | ||||
| N (number of respondents) | 1501 | ||||
| Activity | (1) | (2) | (3) | (4) | (5) | (6) | (7) | (8) |
|---|---|---|---|---|---|---|---|---|
| Walking/hiking alone (includes walking the dog) | −0.02 | 40.58 | 0.47 | 18.88 | 18.41 | 309.84 | 279.87 | 346.80 |
| Walking/hiking with kids & the family | −0.10 | 44.46 | 0.67 | 29.99 | 29.31 | 425.63 | 412.68 | 441.61 |
| Nordic walking, jogging, fitness | −0.18 | 48.08 | 0.44 | 21.26 | 20.82 | 182.78 | 177.80 | 188.92 |
| Cross-country skiing, ski tours | −0.39 | 56.52 | 1.66 | 94.10 | 92.43 | 380.38 | 369.73 | 393.53 |
| Cycling and mountain biking | −0.11 | 44.93 | 0.63 | 28.34 | 27.71 | 232.94 | 227.97 | 239.09 |
| Wildlife observation | −0.28 | 51.96 | 0.64 | 33.27 | 32.63 | 322.05 | 310.74 | 336.00 |
| Collection of plants/mushrooms | −0.49 | 60.43 | 1.01 | 60.96 | 59.95 | 394.04 | 378.20 | 413.57 |
| Participation in excursions and guided tours | −0.70 | 69.06 | 1.11 | 76.67 | 75.56 | 165.83 | 160.64 | 172.22 |
| Tour/round trips to destinations (e.g., restaurants) | −0.51 | 61.10 | 1.74 | 106.02 | 104.28 | 503.69 | 484.54 | 527.31 |
| Picnic/BBQ | −0.47 | 59.69 | 0.88 | 52.45 | 51.58 | 236.47 | 228.36 | 246.48 |
| Hunting | −0.04 | 42.18 | 0.94 | 39.86 | 38.91 | 55.92 | 50.79 | 60.08 |
| Fishing | −0.25 | 50.55 | 1.10 | 55.72 | 54.62 | 95.81 | 93.57 | 97.63 |
| Mean | Lower Bound | Upper Bound | |
|---|---|---|---|
| All Austrian forests (100%) | |||
| Total average recreation benefits per respondent per year for all activities in all Austrian forests (EUR) (Sum of column (6) of Table 6) | 3305.36 | 3188.23 | 3449.90 |
| Additional recreation benefits in natural forests (additional consumer surplus) per respondent and year (EUR) (i.e., if all forests were in a natural state) a | 1086.24 | 871.64 | 1324.30 |
| Additional recreation benefits in quiet forests (additional consumer surplus) per respondent and year (EUR) (i.e., if only natural sounds could be heard in all forests) b | 419.11 | 259.49 | 594.07 |
| Forests on ÖBf land (15%) | |||
| Total average recreation benefits per respondent per year for all activities in ÖBf forests (EUR) (this is 15% of EUR 3305.36 per person and year) | 495.80 | 478.23 | 517.48 |
| Additional recreation benefits in natural forests (additional consumer surplus) per respondent and year (EUR) (i.e., if all ÖBf forests were in a natural state) a | 162.94 | 130.75 | 198.65 |
| Additional recreation benefits in quiet forests (additional consumer surplus) per respondent and year (EUR) (i.e., if only natural sounds could be heard in all ÖBf forests) b | 62.87 | 38.92 | 89.11 |
| Local Recreation in All Austrian Forests a | Values (EUR million) |
|---|---|
| Total recreation benefits | 8342 |
| Additional total recreation benefits if all forests had the highest degree of naturalness | 2741 |
| Additional total recreation benefits if only natural noises could be heard | 1058 |
| Local recreation in ÖBf forests (15% of total forest area) | |
| Total recreation benefits | 1251 |
| Additional total recreation benefits if all forests had the highest degree of naturalness | 411 |
| Additional total recreation benefits if only natural noises could be heard | 159 |
| Increase of recreation benefits with current management by increased naturalness in ÖBf forests b | 42.26 |
| Increase of recreation benefits by a reduction of artificial sounds owing to less lumbering c | 1.20 |
| Increase of recreation benefits by a reduction of artificial sounds owing to an increased density of forests (higher degree of naturalness) d | 2.04 |
| Sum of increased recreation benefits owing to the current status quo in comparison to the baseline scenario | 45.5 |
© 2020 by the authors. Licensee MDPI, Basel, Switzerland. This article is an open access article distributed under the terms and conditions of the Creative Commons Attribution (CC BY) license (http://creativecommons.org/licenses/by/4.0/).
Share and Cite
Getzner, M.; Meyerhoff, J. The Benefits of Local Forest Recreation in Austria and Its Dependence on Naturalness and Quietude. Forests 2020, 11, 326. https://doi.org/10.3390/f11030326
Getzner M, Meyerhoff J. The Benefits of Local Forest Recreation in Austria and Its Dependence on Naturalness and Quietude. Forests. 2020; 11(3):326. https://doi.org/10.3390/f11030326
Chicago/Turabian StyleGetzner, Michael, and Jürgen Meyerhoff. 2020. "The Benefits of Local Forest Recreation in Austria and Its Dependence on Naturalness and Quietude" Forests 11, no. 3: 326. https://doi.org/10.3390/f11030326
APA StyleGetzner, M., & Meyerhoff, J. (2020). The Benefits of Local Forest Recreation in Austria and Its Dependence on Naturalness and Quietude. Forests, 11(3), 326. https://doi.org/10.3390/f11030326