Article

Response of Soil CO2 Efflux to Shelterwood Harvesting in a Mature Temperate Pine Forest

1
School of Geography and Earth Sciences and McMaster Centre for Climate Change, McMaster University, Hamilton, ON L8S 4K1, Canada
2
Department of Geography and Environmental Management, University of Waterloo, Waterloo, ON N2L 3G1, Canada
*
Author to whom correspondence should be addressed.
Forests 2020, 11(3), 304; https://doi.org/10.3390/f11030304
Submission received: 23 September 2019 / Revised: 26 February 2020 / Accepted: 4 March 2020 / Published: 10 March 2020
(This article belongs to the Section Forest Ecology and Management)

Abstract

:
In forest ecosystems, soil CO2 efflux is an important component of ecosystem respiration (RE), which is generally driven by variability in soil temperature and soil moisture. Tree harvesting in forests can alter the soil variables and, consequently, impact soil CO2 efflux. This study investigated the response of total soil CO2 efflux, and its components, to a shelterwood harvesting event of a mature temperate white pine (Pinus strobus L.) forest located in Southern Ontario, Canada. The objective was to explore the response of soil CO2 effluxes to changes in the forest microclimate, such as soil temperature and soil moisture, after shelterwood harvesting removed approximately one-third of the overstory canopy. No significant differences were found in both soil temperature and soil moisture between the pre-harvesting (2008–2011) and post-harvesting (2012–2014) periods. Despite similar soil microclimates, total soil CO2 effluxes were significantly reduced by up to 37%. Soil CO2 effluxes from heterotrophic sources were significantly reduced post-harvesting by approximately 27%, while no significant difference in the mineral-soil horizon sources were measured. An analysis of RE, measured with an eddy covariance tower over the study area, showed an increase post-harvesting. However, the overall net ecosystem carbon exchange showed no significant difference between pre- and post-harvesting. This was due to an increase in the gross ecosystem productivity post-harvesting, compensating for the increased losses (i.e., increased RE). This study highlights the complexities of soil CO2 efflux after a disturbance, such as a harvest. The knowledge gained from this study adds to our understanding of how shelterwood harvesting may influence ecosystem carbon exchange and will be useful for forest managers focused on carbon sequestration and forest conservation.

1. Introduction

Forest ecosystems account for about 80% of the world’s biomass and are considered an important sink for atmospheric carbon dioxide (CO2) [1]. The forest carbon cycle is strongly influenced by the environmental and edaphic factors [2,3,4,5,6,7,8,9,10]. In addition, silvicultural practices, such as forest thinning, can also have a profound impact on forest carbon dynamics by changing soil temperature, soil water content, soil organic matter, root biomass, and microbial activity [11,12,13,14,15,16]. These silvicultural practices are being adopted in North America and across the world, not only to manage forests, particularly planted stands, but also to enhance their carbon sequestration capabilities and/or to restore them to their previous native species [15].
In the Great Lakes—St. Lawrence Region of Canada, the Ministry of Natural Resources and Forestry (OMNRF) uses a number of silvicultural practices based on the characteristics of the current forest, its history and the desired forest condition. One such practice is a specific shelterwood harvest, which consists of selectively removing mature trees, while maintaining legacy trees (largest, best quality), in a series of two or more partial cuts, over the course of 10–30 years. Shelterwood harvesting encourages natural regeneration and development of seedlings in partial shade; [17,18,19]. It changes the tree spacing, number, and size distribution, which can affect the dynamics of carbon uptake through above ground productivity and carbon losses through soil respiration processes [11,20]. A more open canopy alters the radiation dynamics, interception of precipitation, wind flow patterns, water vapour deficit, soil temperature, and soil moisture [11,21,22]. Shelterwood harvesting also causes changes in root density and production altering autotrophic respiration, litter-fall input and, hence, soil microbial activity. These changes may cause variations in soil CO2 efflux, also referred to as soil respiration [23].
Peng et al. [12] found that amongst the studies that examined the impacts of forest harvesting on soil respiration, only a few have examined selective harvesting or thinning effects, with little information on spatial and temporal patterns of soil CO2 efflux response in these forests, particularly in conifer stands. This is important because an increasing number of temperate conifer forests in Eastern North America are being managed to enhance their carbon sequestration capabilities to restore them to their native species composition, enhance biodiversity, and conserve water resources. Therefore, there is an urgent need to enhance our understanding of the effects of silvicultural practices, in particular shelterwood harvest, on soil processes and carbon sequestration [24].
In this study, we investigated the response of soil CO2 efflux and its components to a shelterwood harvesting event in a mature temperate white pine (Pinus strobus L.) forest, located near Lake Erie in Southern Ontario, Canada. The purpose of the study was to explore the response of soil CO2 efflux dynamics to changes in forest microclimate, such as soil temperature and soil moisture, after a partial (i.e., selective) thinning event. Both soil temperature and soil moisture have been previously shown to strongly influence soil respiration at this site [6]. Therefore, seasonal variability of soil temperature, soil moisture and soil CO2 efflux were measured using an automated soil CO2 chamber system [25,26], and comparisons were made between the pre- (2008–2011) and post-harvesting (2012–2014) periods. Given that soil respiration is a major component of RE at the site [27], we also investigated the contribution of soil CO2 efflux after shelterwood harvesting to RE, measured with the eddy covariance method.

2. Methods

2.1. Study Site

This study was conducted at a mature white pine forest near Turkey Point Provincial Park on the northern shore of Lake Erie in Southern Ontario, Canada. This site is part of the Turkey Point Flux Station (TPFS), or Turkey Point Observatory of the Global Water Futures (GWF) program, and global Fluxnet. The forest is dominated (>82%) by eastern white pine (Pinus strobus L.), which was planted in 1939 to stabilize local sandy soils. As of 2014, the average tree height was about 21.8 ± 1.7 m, and stand density was about 421 ± 166 stems·ha−1. Other tree species include 11% balsam fir (Abies balsamea L. Mill) and species native to the hardwood forests of North American Eastern Temperate Forest Ecoregion, including 4% oak (Quercus velutina L., Q. alba L.), 2% red maple (Acer rubrum L.), and some wild black cherry trees (Prunus serotina Ehrh). The understory consists of ferns (Pteridium aquilinum L.), mosses (Polytrichum spp.), poison ivy (Rhus radicans L. ssp.) and Rubus species [28,29]. The topography at the site is fairly flat with well drained sandy soil (Brunisolic Gray Brown Luvisol, following the Canadian Soil Classification system), which is composed of ~98% sand, 1% silt, and 1% clay. Further site details are provided in Arain and Restrepo-Coupe [30] and Peichl et al. [28,29].

2.2. Shelterwood Harvest Treatment

This forested site is managed by the Ontario Ministry of Natural Resources and Forestry (OMNRF) under the shelterwood silvicultural system [17,18,19]. This system is characterized by two or more partial thinning treatments over a few decades to allow for regeneration and development of seedlings in partial shade. The forest was first thinned in 1983, where one-third of trees were randomly removed. In March of 2012, a second partial cut was conducted and approximately 30% of the dominant overstory trees were selectively removed to improve light and water availability and stimulate growth of the remaining trees. The long-term aim of the management is to convert the pine plantation back to the native stand with mixed-wood ecosystem characteristics [19]. A mechanical harvester was used to cut, de-limb and section the selected trees. To reduce soil compaction and disturbance, the harvester used pre-existing multi-use trails throughout the stand. Thinning residues (e.g., limbs, bark, crowns) were placed on the ground ahead of the harvester to limit compaction when trails were not accessible [17]. After shelterwood harvesting, the average basal area was reduced by 13% [31], while peak leaf area index was reduced by 35% [17]. It was estimated that the thinning added 43 t of foliage, 200 t of live branches, and 129 t of dead branches to the forest floor, while an additional 515 t of roots were made inactive from growth and production [17]. These components will decompose and are expected to contribute significantly to the ecosystem respiration.

2.3. Soil CO2 Efflux Measurements

Soil CO2 efflux was measured using an automated chamber system, as described below. The main advantage of an automated chamber system, compared to manual measurements, is the ability to take continuous long-term measurements of soil CO2 efflux, which are useful in studying short- and long-term responses of soil CO2 efflux to environmental variables [7]. The chamber system occupied an approximate area of 50 m × 50 m and was located about 100 m north from the eddy covariance flux tower at the site. The experimental area was chosen to complement the ecosystem carbon flux measurements by the flux tower. The individual chamber locations, although few in replicates due to logistical and budgetary constraints, were placed in locations within the footprint of the eddy covariance flux tower measurements, with the aim to provide data on the soil CO2 efflux contribution to the overall ecosystem respiration. Chambers were placed away from tree stems, in order to avoid large roots, particularly for those chambers measuring heterotrophic respiration. Additionally, the chambers were located away from thick understory and placed on level ground. As soil respiration is comprised of contributions from the mineral-soil, the organic-litter horizon and roots with their associated mycorrhizae, some of our collars were strategically placed to elucidate the contribution from these different components to the total soil respiration.
The chamber system was established to measure total soil CO2 efflux, including those from root exclusion and forest floor removal plots. The chamber system was installed in June 2008, with the initial installation of four chambers. One chamber was established to measure heterotrophic respiration (FRT1) in the trenched plot whereby live tree roots were severed in the area surrounding the chamber [32]. The other three chambers were used as a control chambers and measured total soil CO2 efflux (FS: FS1, FS2, and FS22). One of the control chambers (FS22) was altered in May 2009 to measure the contributions from the mineral-soil horizon (FLR) to total soil respiration, by removing the litter–fermenting–humified (LFH) layer. Additional litter, which may have settled inside this chamber, was periodically removed, including any material from the harvesting event. Additionally, in May 2009, two more control chambers (FS3 and FS4) were added to the chamber system to measure total soil respiration. Finally, in May 2010, two additional chambers were installed, one as a control (FS5) and an additional chamber to measure heterotrophic respiration (FRT2); increasing the total number of chambers in the chamber system to eight. In total, five chambers were measuring total soil CO2 efflux, two chambers measured heterotrophic soil CO2 efflux, and one chamber measured contributions from the mineral-soil horizon.
Soil CO2 efflux was continuously measured at each chamber location, using automated non-steady state chambers developed by the University of British Columbia [7,25,26,33]. Each chamber consisted of a collar and a chamber lid that fit onto the collar. The collar was constructed from a polyvinyl chloride (PVC) cylinder and were inserted approximately 2–4 cm into the ground to avoid cutting roots near the soil surface. Additionally, the height of the collar was maintained at a minimum height above the ground so when the chamber lid was open, there was no reduction in air flow over the soil surface within the collar [7]. The chamber lid consisted of a transparent plastic dome fixed to a metal frame and the lid was the same diameter as the collars. A torsion spring provided enough force to close the chamber dome, while a chamber-mounted, two-way pneumatic cylinder opened the dome when compressed air was pushed through the tubing [32,33]. When the dome closed during measurements, a foam gasket sealed the dome around the collar on which the chamber rested, providing an air-tight seal. A small fan inside the chamber circulated the air, preventing stagnation zones and microclimate formation. When a chamber was not in use, the chamber lid was kept open as to allow precipitation and litter to naturally settle into the collar area. Any vegetation that grew inside the collars between visits was removed to eliminate any potential photosynthesis effect.
The chambers were controlled by a computer housed in a datalogger box, which collected and processed data, and controlled the instrument pumps and gas analyzer equipment. Cycling through the chambers, including opening and closing their lids, was done with custom MATLAB (The MathWorks Inc., Natick, MA, USA) programs. Each chamber closed individually for a one-minute interval, where the CO2 concentration was sampled and measured by an infrared gas analyzer (model LI-840, Li-COR Inc.). Measurements were cycled through the eight collars for a total of three cycles per half-hour period. Thus, each half-hour consisted of three, minute-long CO2 concentration measurements per chamber. One half-hourly value was produced for each collar by averaging the three measurements taken during that half-hour. These average values were used for computation and analysis. Concentrations measured during the fifteen seconds following dome closure were discarded to ensure the samples tubes were relatively free from air from the previous sampled chamber and to account for the time taken for the chamber lid to completely close.
In order to measure soil CO2 efflux (FS) with these chambers, the measured time rate of change in chamber headspace CO2 mole fraction or mixing ratio are estimated [7]. The soil CO2 efflux (µmol CO2 m−2 s−1) from each chamber was calculated using Equation (1) as shown below:
F S = ρ a V e A d S c d t
where ρa is air density in the chamber headspace (μmol m−3), Ve is the effective volume of the chamber (m3), A is the area (m2) of the soil surface covered by the chamber collar, and dSc/dt is the time rate of change of CO2 mixing ratio in the chamber headspace (μmol CO2 mol−1 dry air s−1).
The mean Ve value was calculated using the Equation (2) by injecting CO2 through the top of the chamber domes for one minute and recording the CO2 concentration change (in ppm):
V e = I R T P V ( S c S m )
where Sc (μmol CO2 μmol−1 dry air s−1) is the rate of CO2 concentration increase during the calibration period, I (μmol CO2 s−1) is the rate of injection of CO2 during the calibration period, Sm (μmol CO2 μmol−1 dry air s−1) is the rate of change of CO2 concentration, P is the atmospheric pressure (Pa), V is the volume of the chamber (m3), T is the chamber air temperature (K), and R is the universal gas constant (8.314 J μmol−1 K−1).
According to the work done by Jassal et al. [7], an accurate estimation of the effective chamber volume will help in acquiring good measurements of soil CO2 efflux. Effective chamber volume varies seasonally due to snow and litterfall, and the expansion and contraction of the chambers and collars due to variation in air temperature.
Due to limited weekly field site visits, chamber volumes were measured a few times during the growing season, primarily to check changes in the litter layer within the collars and to remove vegetation. The mean value of the Ve, calculated using Equation (2), was 0.069 m3 during the snow-free season [32]. During the snow season, snow depth measurements were taken inside the chambers, when possible, and used to adjust the Ve.
Measuring soil CO2 efflux during the winter was challenging as snowfall can completely fill the collars, heavy ice and snow on the dome can force the chamber to remain shut for extended periods of time, and cold temperatures can create leaks in sample tubes or compressed air lines [32]. Frequent site visits were made during the winter season to remove snow from the top of the dome and around the collar rim to ensure a continued tight seal for measurements.

2.4. Data Processing and Quality Control of Soil Flux Data

Soil CO2 efflux data were quality controlled with a custom script written in MATLAB software (The MathWorks Inc., Natick, MA, USA). In the script, the slope of time versus efflux in the high-frequency (1 Hz) data for each measurement interval was estimated. This was a process by which half-hourly soil CO2 efflux data were reviewed to identify and subsequently remove non-representative measurements. For the quality assessment, first the root-mean-square-error (RMSE) of the linear fit of chamber headspace CO2 mole fractions versus time was calculated. Next, by applying a threshold value of 1 for the ratio of RMSE to the slope of the linear fit of dSc/dt, all values above this threshold were considered unreliable and were removed following a method similar to Jassal et al. [7]. A visual inspection was also conducted to remove any remaining erroneous data. Negative fluxes were discarded as any vegetation, whether by moss or small plants, were removed on the soil surface within the chambers.
In addition to data removal through quality control, data loss also occurred from chamber malfunctions, calibrations, the lack of compressed air available, which controls the ability of the chamber dome to close, and winter snow and ice accumulation. In 2013, hydraulic problems arose in the two-way pneumatic cylinder, resulting in approximately 80%–90% of annual data loss and data removal for most of the chambers, all occurring during the growing season. Further mechanical problems in the two-way pneumatic cylinder occurred in 2014, with about 70%–90% of the data removed. The percentage of data retained decreased over the years due to a combination of equipment age, malfunctions and removal of the chamber system (November 20, 2011 and March 27, 2012) for forest harvesting operations.

2.5. Eddy Covariance Flux and Ancillary Data

Water, carbon and energy fluxes were measured using a closed-path eddy covariance system. Flux measurements were made at 20 Hz above the canopy on top of a scaffolding tower at a height of 28 m. Above canopy fluxes of carbon and water were calculated using a methodology outlined by Baldocchi et al. [34]:
F = w ¯ c ¯
where F refers to the flux of water, carbon or energy, w’ is the covariance of vertical wind speed, measured by a sonic anemometer (CSAT3, Campbell Scientific Inc. (CSI)), and c’ is the covariance of CO2 or water vapour concentrations, measured by an infrared gas analyzer (Li-7000, LI-COR Inc.). Half-hourly net ecosystem productivity (NEP) was calculated by adding CO2 flux and the CO2 storage, which is calculated as change in CO2 concentration over time in the air column below the eddy covariance sensors [35]. Ecosystem respiration (RE) was estimated using a non-linear logistic relationship between nocturnal half-hourly CO2 fluxes during high turbulence conditions and soil temperature at 2 cm depth [28,29,35]. Gross ecosystem productivity (GEP) was determined by adding measured NEP to model daytime RE. Soil temperature and soil moisture were measured at 5, 10, 20, 50, and 100 cm depths at two locations, near the chamber system location. For the analysis, soil temperature at a depth of 5 cm and soil moisture, averaged between 0 and 30 cm, were used. All flux and meteorological data were quality controlled and averaged at half-hourly intervals [35]. For further details on site’s eddy covariance tower instrumentation refer to Arain and Restrepo-Coupe [30] and Peichl et al. [28,29].

2.6. Statistical Analysis of Pre- and Post-Harvesting

To determine whether the shelterwood harvesting event can be detected within the variability of the data, a comparison was made for the pre- (2008–2011) and post-harvesting (2012–2014) periods. Half-hourly soil temperature and soil moisture values were averaged daily to allow for a comparison of adequate sized data points between the two periods [36,37]. As soil CO2 efflux measurements had several half-hourly gaps after quality control, only available measurements taken at 11:00 for each day were compared, as the mean daily soil CO2 efflux value was found to correspond best to values around 11:00 at this site, and in previous studies [38].
The soil temperature, soil moisture, soil CO2 efflux, and eddy covariance flux data (all denoted by x’ in Equation 4) were normalized using the min-max normalization method where the values are rescaled to range between 0 and 1 using the following equation:
x = x min ( x ) max ( x ) min ( x )
where min (x) and max (x) are the minimum and maximum values of x for the complete dataset (2008–2014). This was done to normalize the variability between the various chambers and eddy covariance tower flux measurements, and allow for a more direct comparison between all. An F-test was then applied to assess whether the variances of the two periods were equal or not, followed by a t-test to determine if there was any significant difference (p-value < 0.05) in the means.
Furthermore, as these variables change seasonally, the relative contribution of component fluxes to the total soil CO2 efflux were examined for different months of the year. Following similar work to Heinemeyer et al. [39], two-month averages of diurnal variability of soil temperature and soil CO2 efflux rates, for each individual chamber, were constructed for March–April, July–August, August–September, and December–January. To check for changes, diurnal patterns from pre- and post-harvesting years were compared. Comparisons for the diurnal patterns from pre- and post-harvesting were made for selected two-month seasons in those years with a similar climate: when their two-month average temperature and total precipitation were similar.
We fitted a mixed effect model on our data, where natural logarithm of soil CO2 efflux was modelled as a dependent variable of three fixed variables: soil temperature, soil moisture and shelterwood management (represented by the “thinning” categorical variable), and two random variables: “chamber number” and “day of year”. The random variables accounted for possible effects of pseudoreplication (“chamber number”) and time series correlation (“day of year”) in our dataset. The model was fitted as full (with all three fixed explanatory variables), then also without the “thinning” categorical variable, and finally without the “soil moisture” and “thinning” variables. Note that “soil temperature” and “soil moisture”, when present, were allowed to have interaction terms. Daily average values were used in these models. Akaike’s information criterion (AIC) was then used to compare the three models. This analysis was completed in R-software (R Core Team, Vienna, Austria) [40] and using the lme4 package [41].
Finally, please note that this study was not a truly replicated experiment and the results needed to be viewed and interpreted cautiously due to pseudoreplication [42].

3. Results

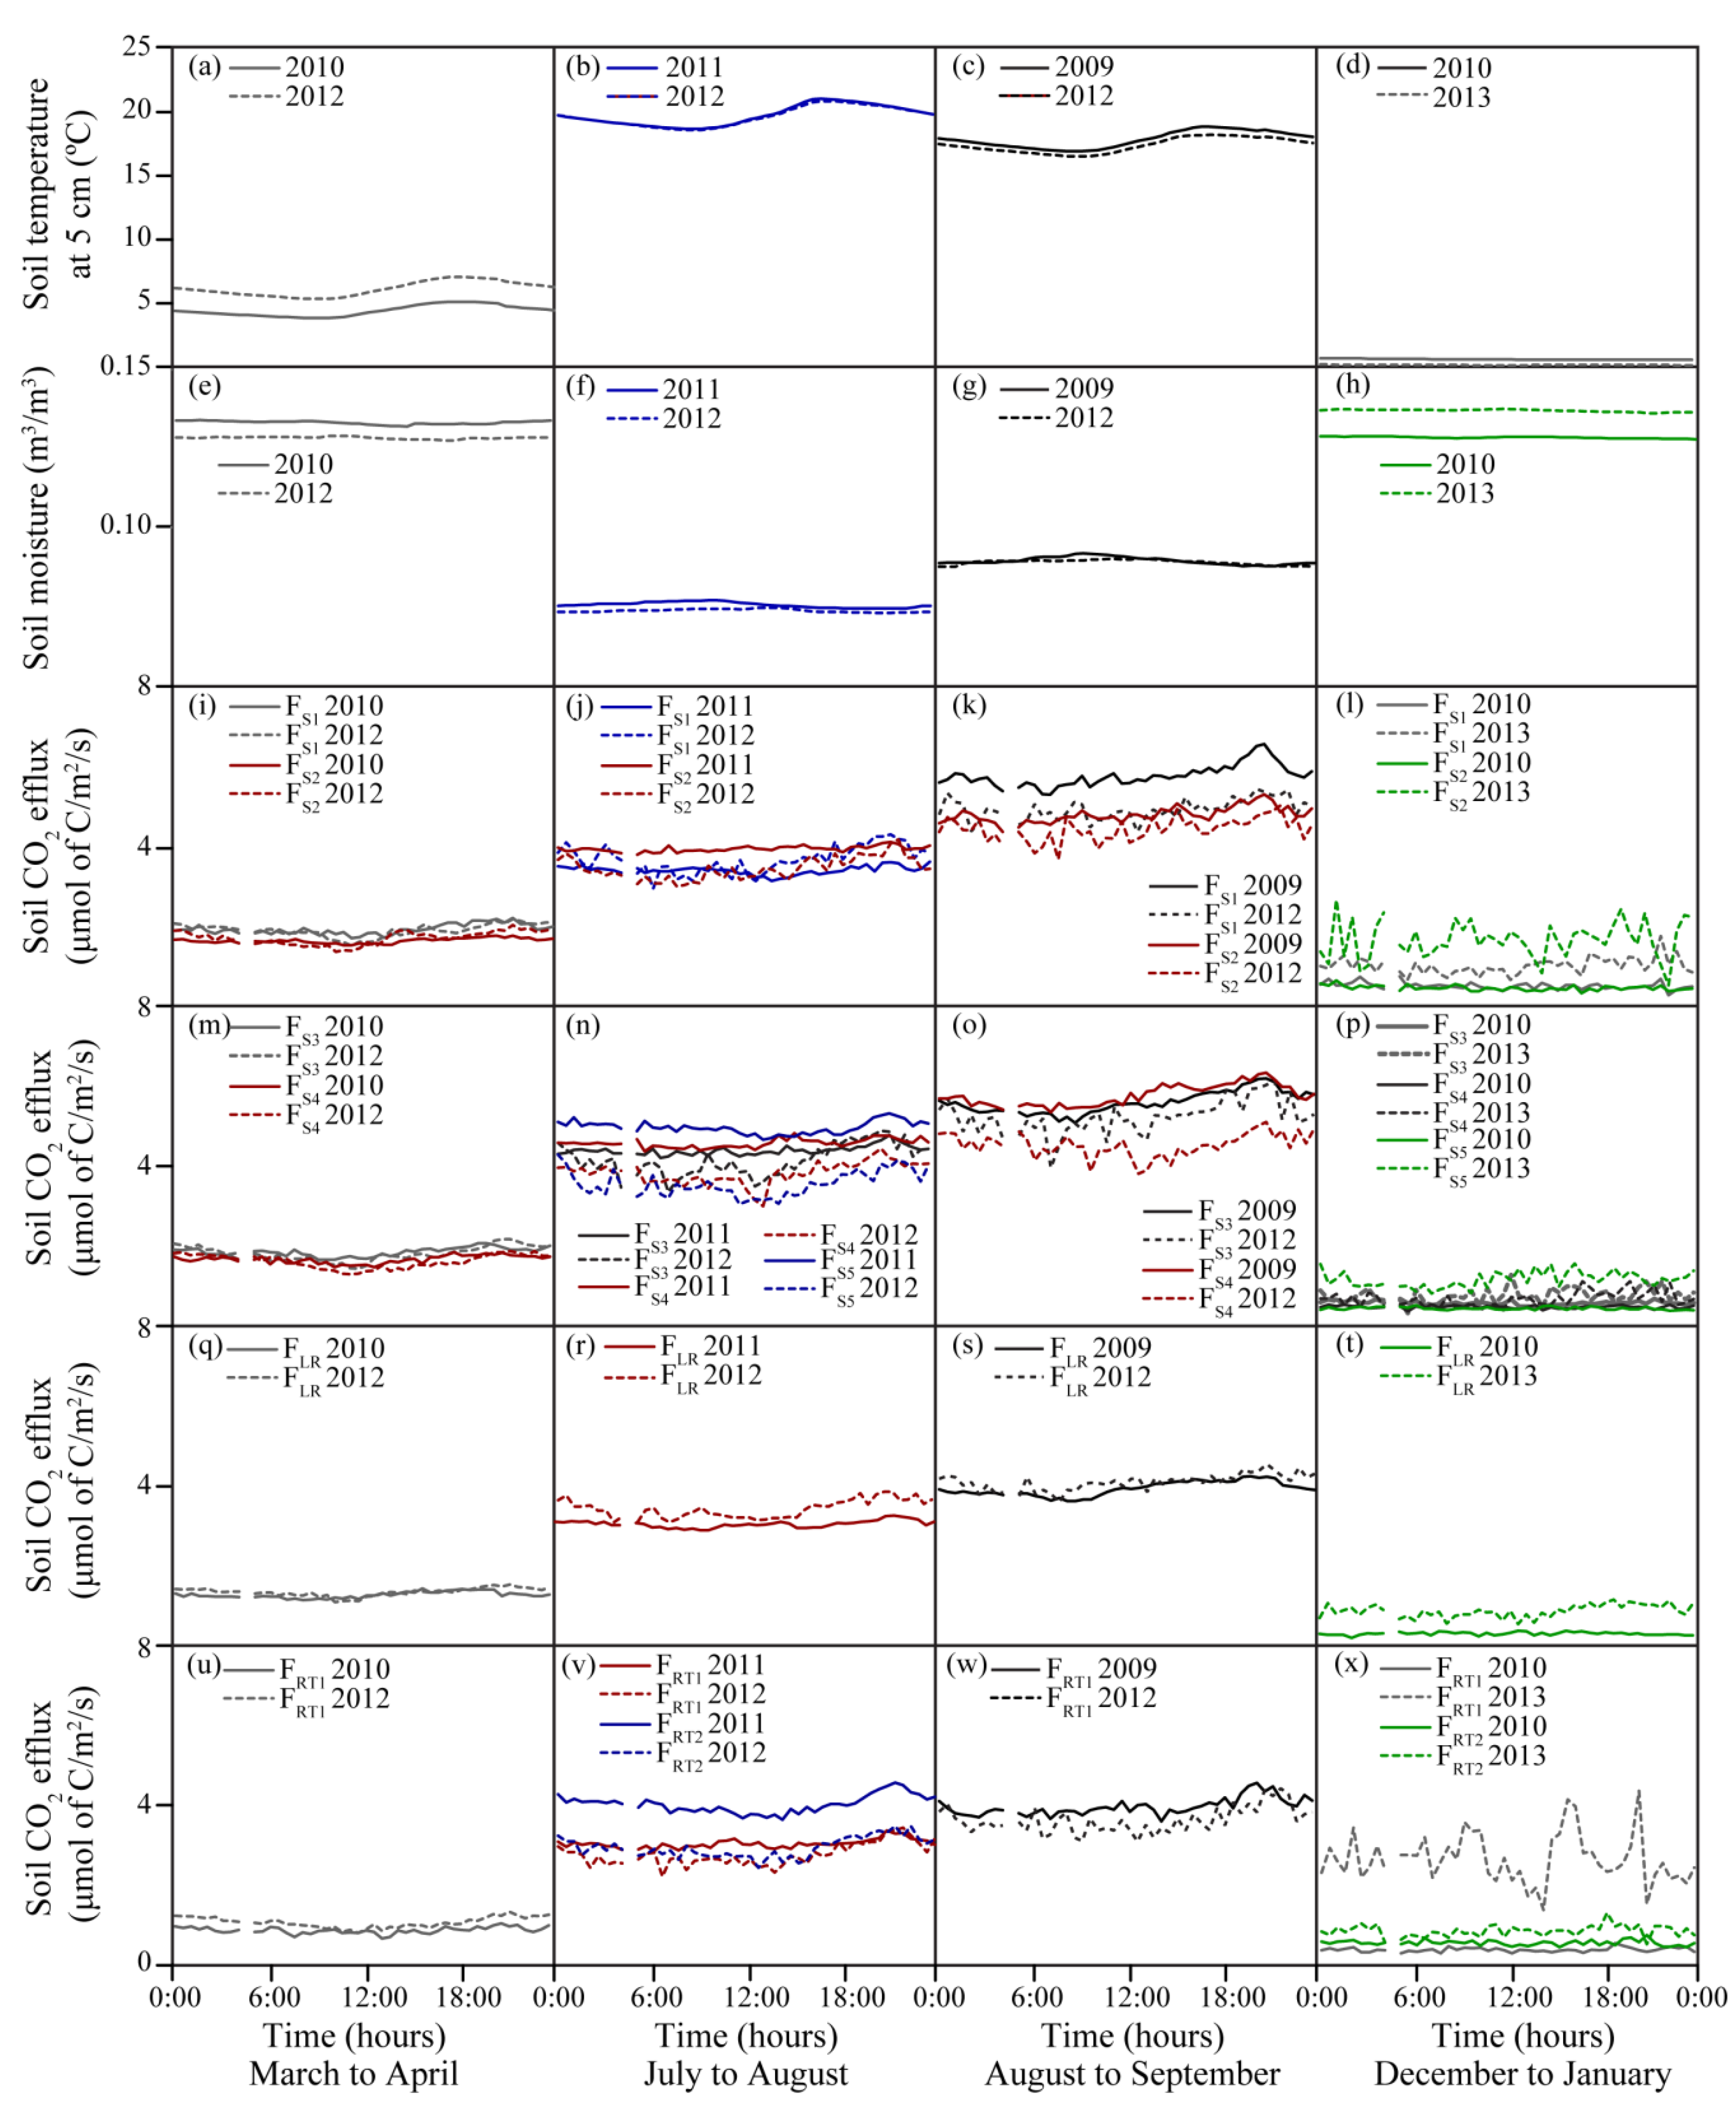
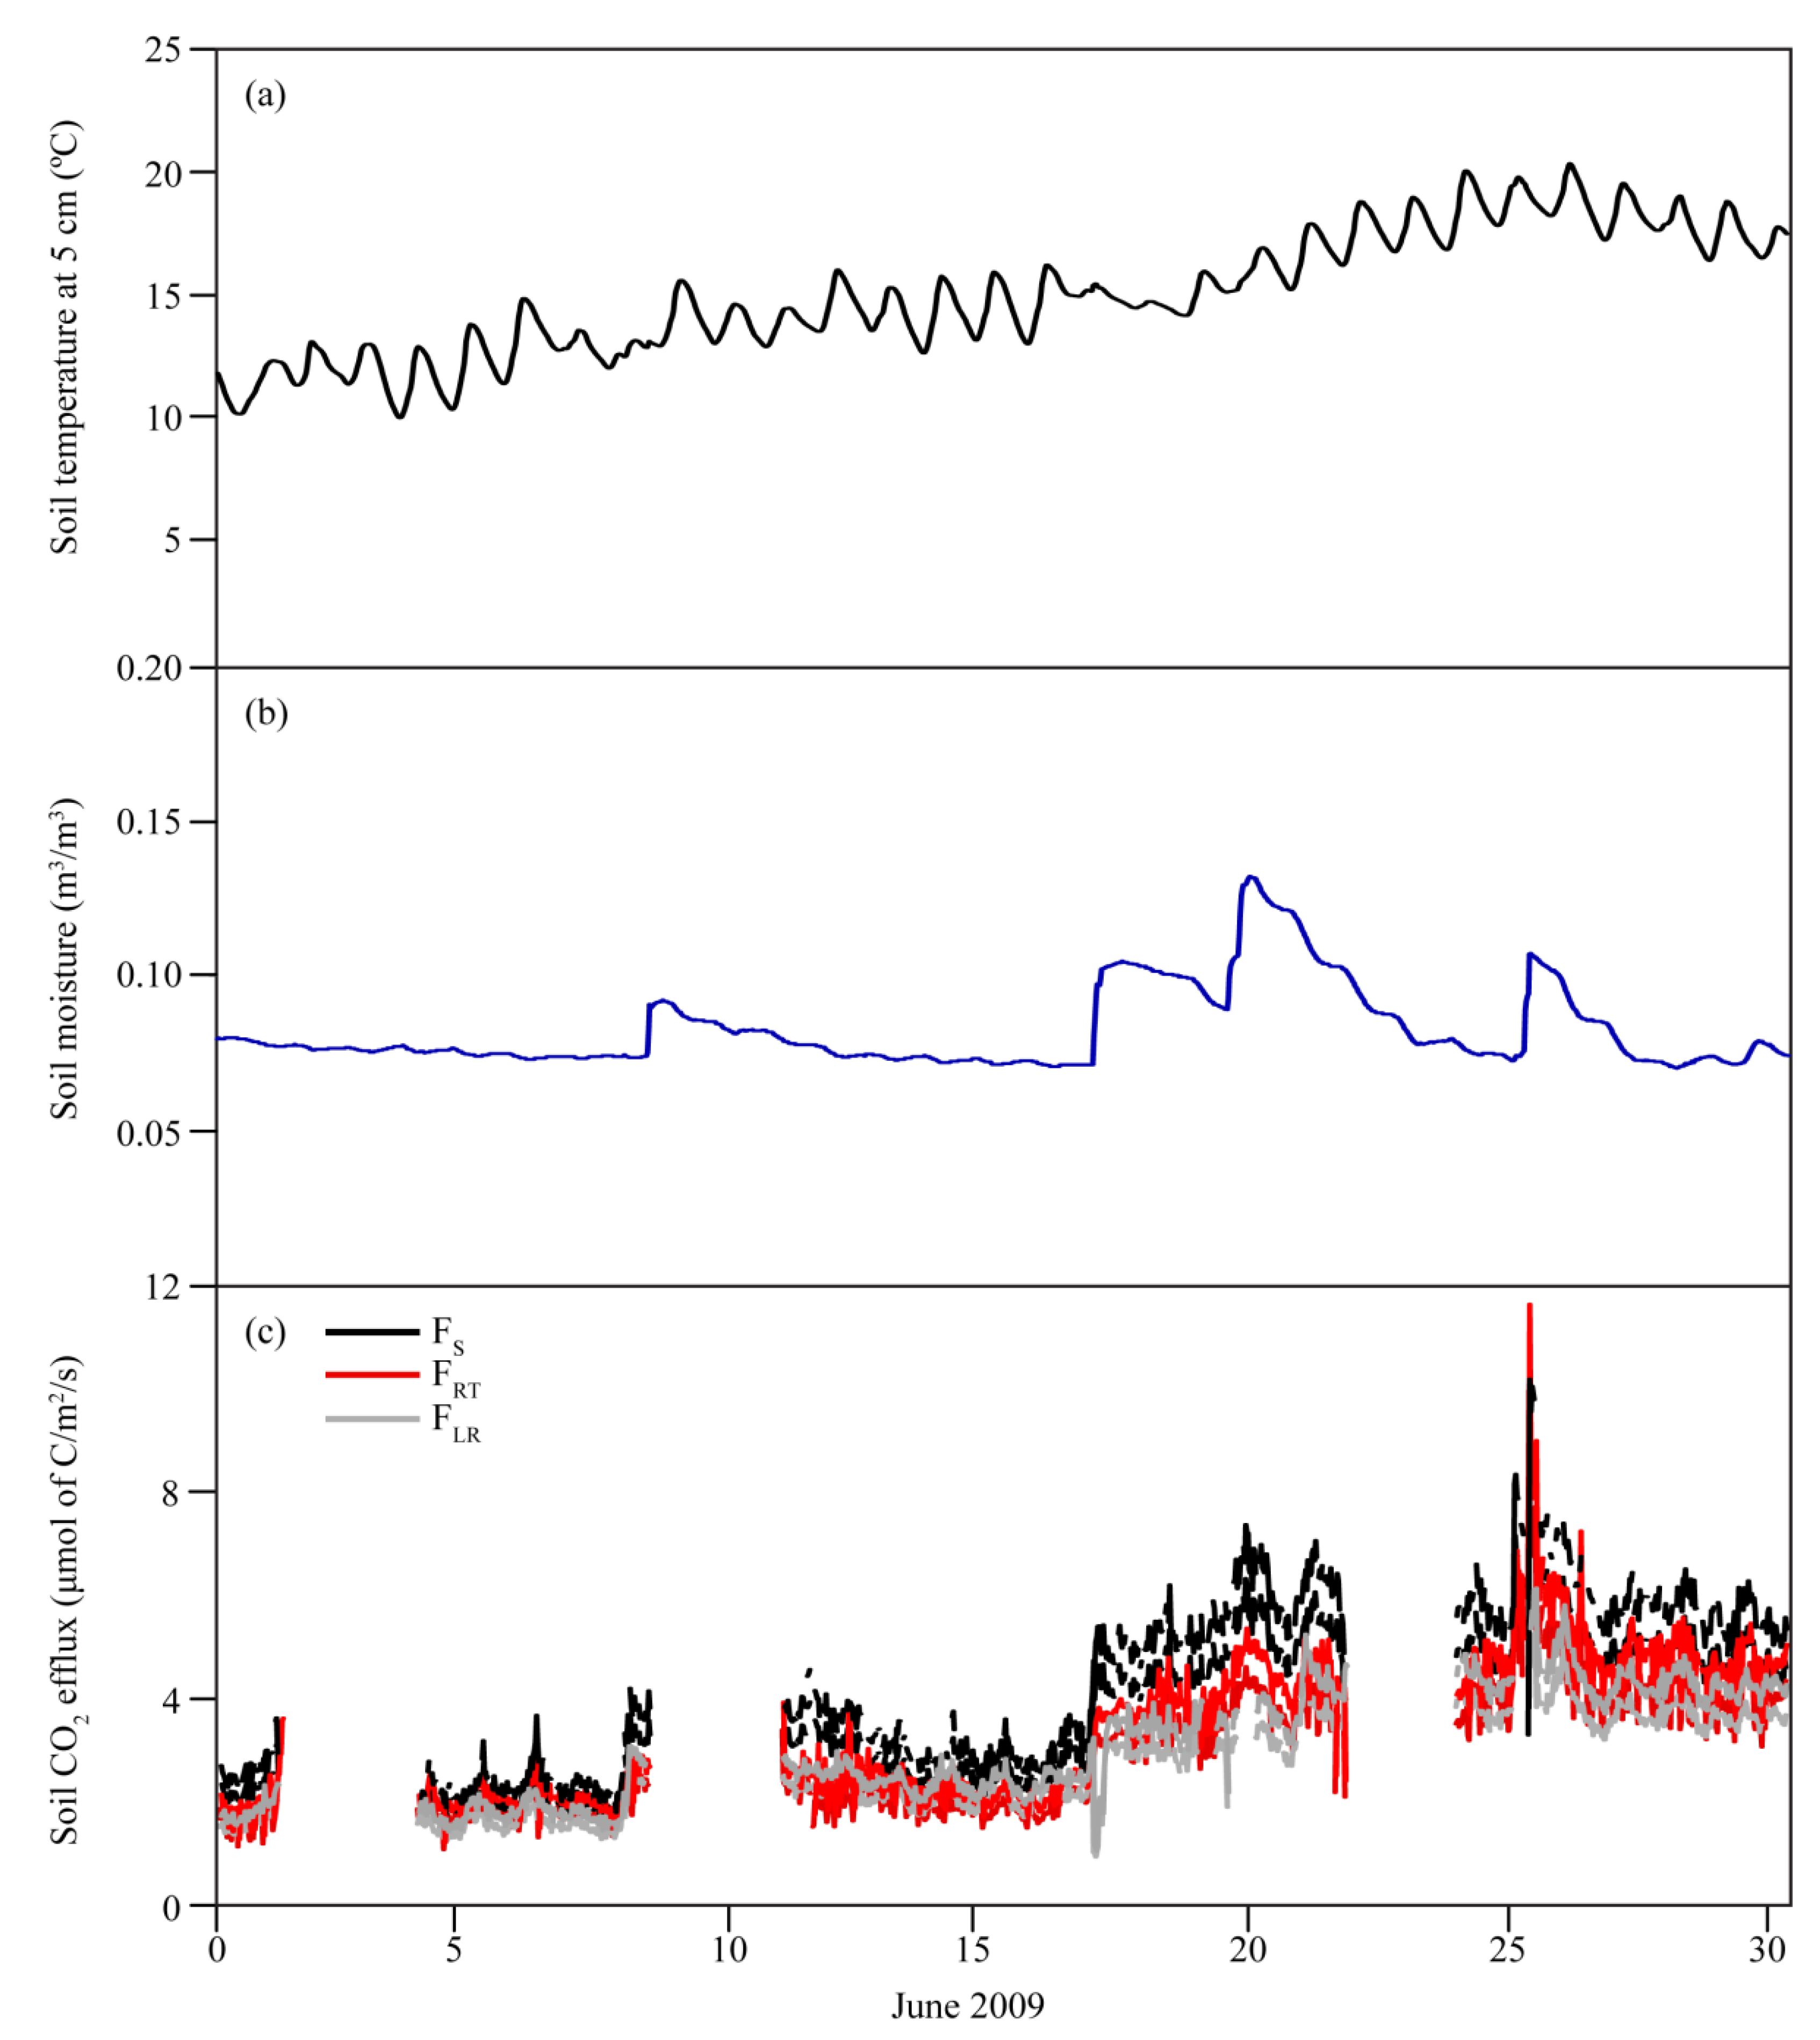
3.1. Seasonal Variations in Soil Temperature and Soil Moisture

During the study, the site experienced a large seasonal variation in temperature with air temperatures reaching above 30°C in the summer, and well below 0 °C in the winter. This variation was also reflected in the soil temperatures measured at 5 cm depth, but less pronounced. Daily soil temperatures fluctuated around 0 °C in the winter, increased by April, peaked in July or August, and then decreased again by October (Figure 1a). The mean soil temperature for the seven-year data period from 2008 to 2014 was 9.3 ± 7.5 °C, with the highest soil temperature of 23 °C recorded during the summer of 2013, and the lowest temperature of −2.9 °C recorded during the winter of 2012. However, in 2012, above-normal temperatures occurred in March; increasing soil temperatures well above 10 °C for approximately 20 days.
Daily soil moisture showed large variations during the seven-year study period, which is attributed to rainfall and/or snowmelt events, and influenced by the well-drained sandy soil at this site. Annually, soil moisture increased during the winter season, with maximum values observed after snowmelt (Figure 1b). Little variability in soil moisture was observed during the 2012 growing season, as very few rainfall events occurred, and this year was deemed a dry year [43]. The mean soil moisture over the seven-year study period was 0.12 ± 0.03 m3/m3, with the highest value of 0.25 m3/m3 recorded during the spring of 2013 due to a combination of snowmelt and precipitation. In each growing season, soil moisture levels in this well-drained soil declined to approximately 0.065 m3/m3.
Diurnal pattern of soil temperatures over the two-month period for each season of the study showed a typical decrease overnight, then an increase coinciding with an increase in daylight, with peak values in late -afternoon (Figure 2a–d). The diurnal pattern of mean soil moisture over the July to August and August to September months showed increased overnight values that decreased as the day progressed (Figure 2f,g). For the March–April and December–January months, mean diurnal values of soil moisture stayed relatively flat (Figure 2e,h). Soil moisture for the winter was higher than the growing season, due to the lack of evapotranspiration and an increase in precipitation events.

3.2. Seasonal Variability of Soil CO2 Efflux

From 2008 to 2014, the soil CO2 efflux rates showed seasonal patterns following seasonal soil temperature, where soil CO2 effluxes were low during the winter and high during the summer. There was a large amount of variability in soil CO2 effluxes during the growing season and much less during the winter months. Soil CO2 efflux from the control chambers (Figure 1c,d) showed the highest daily average values at 3.1 ± 2.0, 2.5 ± 1.8, 3.2 ± 2.2, 3.1 ± 2.1, and 3.3 ± 2.4 μmol of C m2 day−1 for FS1, FS2, FS3, FS4, and FS5, respectively. Both FS1 and FS2 showed high CO2 effluxes in 2009, compared with the following years. Soil CO2 effluxes for FS4 were higher in 2010 and 2014 compared with the other control chambers. Equipment malfunctions limited the number of observations for 2013 and 2014, with chamber data only from FS3 and FS5 in 2013, and FS4 in 2014, passing quality control. No observations during the 2011/12 winter season were recorded due to the removal of the automatic chamber system for shelterwood harvesting.
Before removal of the litter-layer, FLR produced similar soil CO2 effluxes to both FS1 and FS2 (Figure 1e). After litter-layer removal, soil CO2 effluxes dropped and remained lower than the control chambers, producing daily average value of 2.2 ± 1.5 μmol of C m2 day−1 over six years.
The two chambers where soil was trenched to exclude tree roots also produced lower values of soil CO2 efflux compared to the control chambers, with daily average values of 2.0 ± 1.5 and 2.2 ± 1.5 μmol of C m2 day−1 for FRT1 and FRT2, respectively. These averaged daily soil CO2 efflux values were similar to those from FLR for most years, except 2009 and 2014.
Mean averaged half-hourly soil CO2 efflux rates, compared to soil temperature and soil moisture, showed diurnal fluctuations that mimic the diurnal pattern of soil temperature, while responding to increases in soil moisture (Figure 3). An example from June 2009 showed that soil CO2 effluxes from the control (FS), heterotrophic (FRT) and mineral-soil horizon (FLR) increased with an increase in both soil temperature and soil moisture. However, in this example, June 17 showed an instance where the mineral-soil component decreased at the onset of a rainfall event. Conversely, and less common, instances of a decrease in the mineral-soil component occurred in the following years.
In January and December 2013, large pulses of soil CO2 effluxes were observed from FLR, FRT1, FRT2, and FS2 chambers, often exceeding values recorded during growing seasons (Figure 1c–e). Based on observed meteorological data, these soil CO2 efflux pulses seem to have corresponded to an increase in soil temperature, from temperatures below freezing to a few degrees above 0 °C, and an increase in soil moisture (from 0.14 to 0.20 m3/m3), both of which may have stimulated microbial activity. These rare observations could also be due to the melting of ice or dense snow cover on top of the soil within the chambers, which was blocking the release of soil CO2 accumulated in the near-surface soil layer.
Two-month diurnal average of soil CO2 effluxes for each season showed differences in the range of magnitude. Although soil CO2 efflux had more variability than soil temperature and soil moisture, for each season, the soil CO2 efflux increased during the daylight, peaking around 21:00, about 3–5 hours after soil temperature peaks. Afterwards, emissions decreased overnight, with the lowest usually observed in the early morning hours. Soil CO2 effluxes at approximately 11:00 were found to be close to the mean daily average for total soil CO2 efflux and its components.

3.3. Comparison of Soil Temperature and Soil Moisture Pre- and Post-Harvesting

Mean values of soil temperature over the pre- and post-harvesting time periods were 9.4 ± 7.5 °C and 9.1 ± 7.5 °C, respectively, while the mean values of soil moisture were 0.11 ± 0.03 m3/m3 and 0.12 ± 0.03 m3/m3, respectively. A t-test with normalized daily data did not show a significant difference for both soil variables (Table 1). While soil temperature did not change much between the pre- and post-harvesting periods, an increase of 3% in soil moisture was observed, even with the data from a 2012 drought year included in the post-harvesting period. A comparison of the median and range of pre- and post-harvesting data confirmed that soil temperature was similar and soil moisture showed a slight increase after harvesting (Figure 4). As soil temperature at this site was correlated to air temperature, the median and range of pre- and post-harvesting air temperature was also compared and determined that the measurements were similar between the two periods.

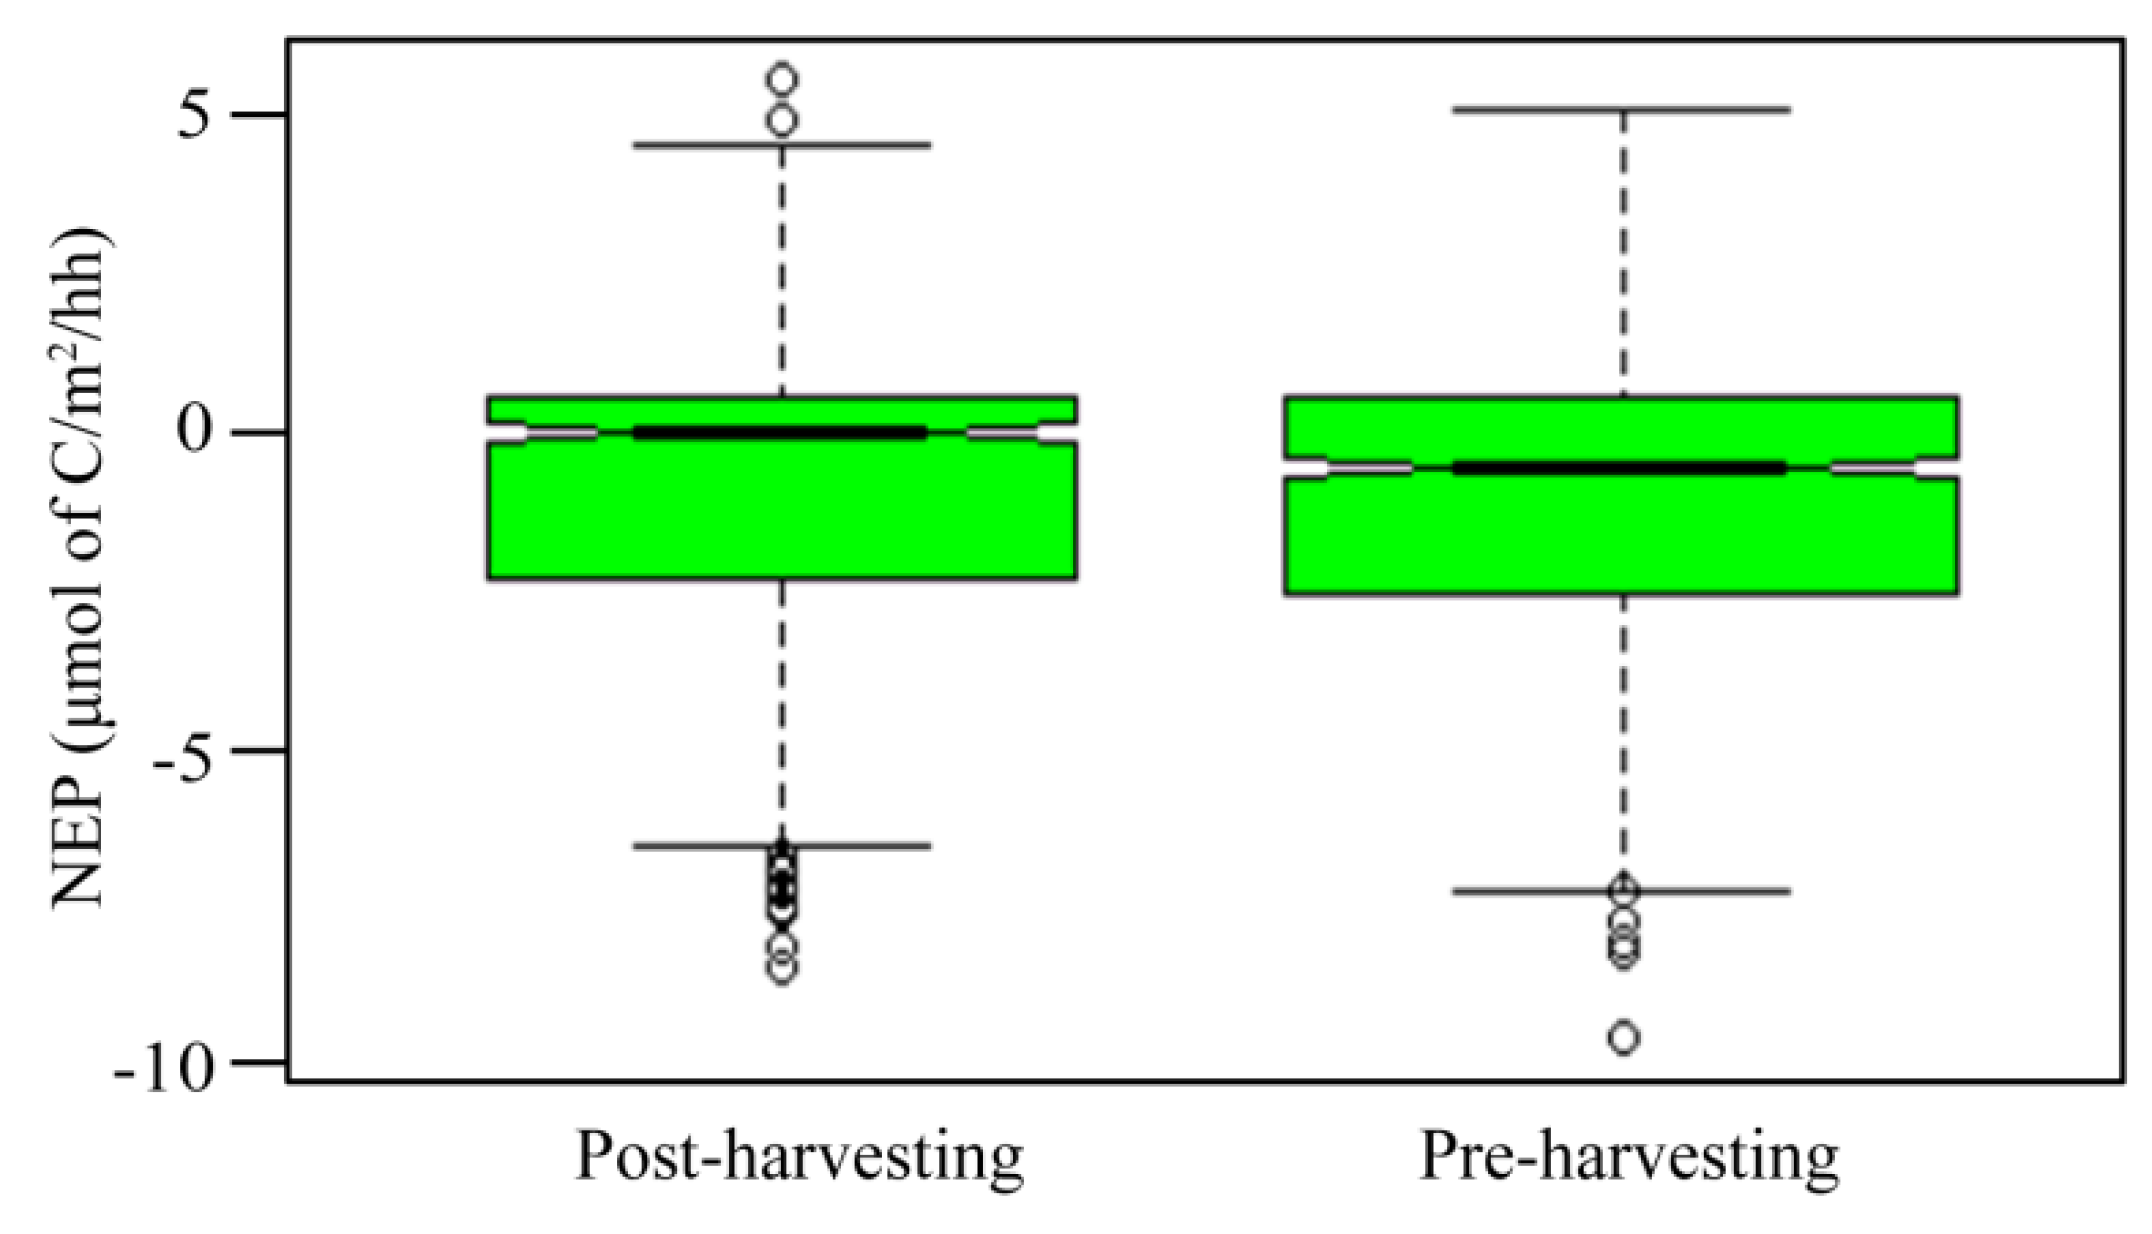
3.4. Comparison of Soil CO2 Effluxes Pre- and Post-Harvesting

For March to April, representing spring, a comparison was made for years 2010 and 2012, which had similar observed climate. For the control (Figure 2i,m) and the litter-layer removed chambers (Figure 2q) minimal change was observed as the magnitude and diurnal pattern were similar. One trenched chamber (the other trenched chamber not being installed until May 2010), showed an increase with the average diurnal soil CO2 efflux increasing from 0.86 ± 0.07 to 1.09 ± 0.11 μmol of C m2 s−1 (Figure 2u).
In July to August, a comparison of 2011 to 2012 showed a decrease in the average diurnal soil CO2 efflux for the control chambers, but an increase in the standard deviation (Figure 2j,n). The largest change was measured for FS5, with a decrease in the average by 1.42 μmol of C m2 s−1 and an increase in the standard deviation of 0.13 μmol of C m2 s−1. FLR had an increase in both the mean and standard deviation, (3.09 ± 0.07 μmol of C m2 s−1 to 3.45 ± 0.18 μmol of C m2 s−1; Figure 2r), while both FRT1 and FRT2 decreased in the average diurnal soil CO2 efflux, and an increase in the standard deviation (3.07 ± 0.09 μmol of C m2 s−1 to 2.72 ± 0.23 μmol of C m2 s−1 and 4.02 ± 0.18 μmol of C m2 s−1 to 2.93 ± 0.21 μmol of C m2 s−1 for FRT1 and FRT2, respectively; Figure 2v).
Comparing the two-month diurnal average of August to September, between 2009 and 2012, the four available control chambers all had a decrease in soil CO2 effluxes (Figure 2k,o). The largest difference was seen in FS4, with a daily average increase of 1.24 μmol of C m2 s−1 and an increase in the daily average standard deviation of 0.02 μmol of C m2 s−1. FLR had a slight increase in both the daily average and standard deviation post-harvesting (Figure 2s). The daily average soil CO2 efflux for FRT1 decreased by 0.29 μmol of C m2 s−1 between 2009 and 2012, while the standard deviation increased by 0.10 μmol of C m2 s−1 (Figure 2w). Despite similar soil temperature and soil moisture conditions, soil CO2 effluxes decreased post-harvesting during the growing season, except for FLR, which showed an increase.
For the December–January months, a comparison of 2010–2013 two-month diurnal averages showed an increase in soil CO2 effluxes for all five control chambers, with the largest average increase of 1.25 ± 0.33 μmol of C m2 s−1 seen in FS2 (Figure 2l,p). FLR had an increase in the daily average soil CO2 efflux, with an average of 0.84 μmol of C m2 s−1 in 2013, compared to an average of 0.31 μmol of C m2 s−1 in 2010 (Figure 2t). Both FRT1 and FRT2 had a higher soil CO2 efflux in 2013, compared with 2010 (Figure 2x). FRT2 increased from an average of 0.57 ± 0.06 μmol of C m2 s−1 in 2010, to an average of 0.82 ± 0.12 μmol of C m2 s−1 in 2013. FRT1 had the largest difference between the two years, with an average of 0.37 ± 0.05 μmol of C m2 s−1 in 2010, to an average of 2.58 ± 0.52 μmol of C m2 s−1 in 2013. The difference was attributed to a large amount of CO2 released at the end of December 2013, which persisted for approximately five days and was comparable to values observed during the growing seasons. Note that the number of observations recorded during the winter months were much less than during the growing season, so these recordings in December 2013 have a stronger influence on the winter average.
Comparison of the soil CO2 effluxes measured pre- and post-harvesting showed that there was a reduction from each of the chambers after the shelterwood harvest event (Table 1, Figure 5). Reduction in total soil CO2 efflux ranged from 1 to 37%, with the highest difference from FS1, and minimal change in FS3 measurements. The chamber with the litter-layer removed (FLR) had a 2% reduction, while both measurements from the trenched chambers (FRT1 and FRT2) decreased by approximately 27%. A significant difference for all but two of the chambers were shown for the normalized data (Table 1). Both FS3 and FLR showed no significant difference between pre- and post-harvesting periods (Table 1). Overall, we observed a decrease in emissions after the harvesting, with a reduction observed in control chambers and those with severed roots (Figure 5). In Figure 5, with the year 2013, soil CO2 efflux values appear to be much higher, however, this was due to large data gaps where most of the data in that year came from the growing season and was biased to higher values.
Results from mixed effects model analysis corroborated above analysis in that soil CO2 efflux was positively related to both soil temperature and soil moisture. Including the “thinning” variable in the model improved the model fit, suggesting that there was a statistical difference in fluxes and the relationship between pre- and post-harvesting soil CO2 effluxes. Furthermore, differences in the estimated model coefficients also suggest differences in the response of soil CO2 emissions to changes in soil temperature and soil moisture, with the largest variability detected in the “soil moisture” variable (see Appendix A for details).

3.5. Comparison of Soil CO2 Effluxes to Ecosystem Respiration

To assess the impact of shelterwood harvesting on overall carbon budget of the forest, an analysis of net ecosystem productivity (NEP) using the eddy covariance flux data from the nearby flux tower was conducted following methods outlined by Trant (2014). Using data from 2008 to 2014, as compared to the 2003–2012 for the analysis by Trant (2014), showed that thinning, following harvesting, did not significantly impact the response of NEP (Figure 6). Post-harvesting NEP fluxes were within the range of interannual variability over the study period (2008–2014). Mean pre-harvesting NEP was 237 ± 81 g C m−2 year−1 as compared to post-harvesting NEP of 185 ± 97 g C m−2 year−1. Since NEP is a difference of two large fluxes, Gross Ecosystem Productivity (GEP) and ecosystem respiration (RE), the differences between these components were also considered. Mean annual post-harvesting (2012 to 2014) GEP was 1519 ± 78 g C m−2 year−1 as compared to pre-harvesting (2008 to 2011) GEP of 1479 ± 74 g C m−2 year−1. Median and range of RE fluxes pre-harvesting (1233 ± 152 g C m−2 year−1) and post-harvesting (1326 ± 55 g C m−2 year−1) were also similar (Figure 4d). Based on the results, there was no significant impact on the flux measurements following harvesting, however, both the GEP and RE fluxes increased after the shelterwood harvesting, while NEP fluxes decreased (less overall carbon sink). The observed reduction in soil CO2 efflux rates did not reflect a substantial reduction in the ecosystem respiration at our site.

4. Discussion

Soil temperature and soil moisture have been shown to be a major influence on the soil CO2 efflux dynamics [44,45,46]. Results from this study were in agreement with these studies as soil CO2 efflux followed the seasonal pattern of soil temperature, with the lowest CO2 effluxes observed during the winter, and highest during the growing season. Observed half-hourly soil CO2 efflux rates showed diurnal fluctuations that mimic the diurnal pattern of soil temperature, while responding to increases in soil moisture. Pulses of soil CO2 efflux were observed during the winter of 2013/2014, with measured values similar to those observed during the growing season. These pulses seem to correspond to an increase in soil temperature and melting of the snow cover. The formation of dense snow and/or ice lenses in a snowpack can impede the upward diffusion of soil CO2 efflux [45,47]. Monson et al. [45] observed a similar increase in soil CO2 efflux due to meltwater, from the above snow cover layer, and an increase in soil temperature, which increased the activity of soil microbes during spring for a subalpine ecosystem. DeForest et al. [48] observed pulses in soil respiration following full leaf senesce that corresponded with an input of fresh litter decay. This pattern did not occur annually, and may be attributed to a warmer season. In relation to the possibility of warming soils, these pulses could have implications on the cycling of nutrients released from the decomposition of the litter-layer [48]. Improvement of collecting robust and accurate soil CO2 efflux data, during the winter season, would help in the understanding the response of soil CO2 efflux to winter environmental factors, such as snow, ice accumulation, and freeze/thaw events.
Forest management practices, such as shelterwood harvesting, produces disturbances that alter the physical structure, microclimate, physiochemical properties, and biological activity of forest soils and vegetation, affecting soil respiration [12,46,49,50,51,52]. Mixed results from the literature [23,49,50,51,52,53,54,55,56,57] highlights the need for comprehensive and long-term studies, to explore the impact of shelterwood harvesting, which is being increasingly adopted to manage forest ecosystems, on soil CO2 efflux and the overall carbon budget. This study is an important step forward in this direction, where soil CO2 efflux measurements were conducted, over the seven-year period (2008–2014), in a managed temperate forest.
Comparison of soil temperature and soil moisture, between pre- and post-harvesting periods, showed no significant difference, although there was a small (0.3 ± 7.5 °C) decrease in soil temperature, while soil moisture showed a small increase (0.01 ± 0.03 m3/m3) following post-harvesting. The slight increase in soil moisture post-harvesting may reflect the reduced root density and subsequent reduced water uptake. It may also reflect increased insulation from the litter left behind by the harvesting event, which could help reduce soil evaporation and hence water loss. Despite similar soil microclimates, total soil CO2 effluxes were significantly reduced by up to 37%. Soil CO2 effluxes from heterotrophic sources were significantly reduced post-harvesting by approximately 27%, while no significant difference in the mineral-soil horizon sources were measured. Although root respiration may decrease with a decrease in root biomass post-harvesting, root respiration from the remaining trees may also increase as a result of increased photosynthetic rate and growth of new roots due to a decrease in competition for water and nutrients among remaining trees [49]. In the thinned stands, dead roots from harvested trees can also contribute more soil CO2 efflux after the treatment [49]. In contrast, Shabaga et al. [50] found that partial harvesting, in northern mixed deciduous forests, increased soil respiration due to an increase in soil temperatures, and enhanced decomposition rates of harvested residue, such as leaves/needles and woody debris left on ground, and the decomposition of dead roots. They also reported that, after thinning, forest understory regrowth contributed to a reduction in soil temperatures, but influenced patterns of soil CO2 efflux by increasing summer respiration and Q10 values, likely due to increased root respiration. Wang et al. [51] found no change in soil respiration between control and thinned larch plantation sites, however, the distribution in different components were altered, as both heterotrophic and autotrophic respiration were higher at the thinned site, whereas litter decomposition was lower. Wang et al. [51] attributed the higher levels of heterotrophic respiration from the mineral-soil to a change in soil temperature, something not found in this study.
As suggested by Sullivan et al. [52], a possible reason for the lower soil CO2 efflux can be explained by a decline in live tree root respiration being greater than a possible increase in soil CO2 efflux, resulting from an increase in root production by surviving trees, and a possible increase in heterotrophic respiration associated with the decomposition of newly dead roots and understory plant litter. The shelterwood harvest may have altered the soil environment, by changing amounts and sources of belowground carbon for microbial metabolism, thus reducing soil CO2 efflux [49]. Since this study only examined the short-term effects of shelterwood harvesting, the increase in quantity of high-quality carbon available for microbial decomposition, usually associated with this harvesting, may not yet be available for decomposition [52]. Tang et al. [49] found that soil respiration decreased by 13% post-thinning at their site, for data normalized with soil temperature and soil moisture. They note that due to natural climate variability and the effect of thinning on soil temperature and moisture, no significant trends were found in actual non-normalized soil respiration post-thinning. They suggested that the net effects of thinning on soil respiration are the result of complex and numerous interacting factors. Tang et al. [49] argued that apart from thinning impacts, that changes soil temperature, soil moisture and biotic factors, soil CO2 efflux in a thinned forest may also be influenced by climate variability (such as drought in 2012 for this site).
An analysis of the eddy covariance flux data, specifically net ecosystem productivity (NEP), gross ecosystem productivity (GEP), and ecosystem respiration (RE) from the nearby flux tower, showed that harvesting had no significant impact. Since there was a reduction in soil CO2 efflux post-harvesting while both GEP and RE increased, it appears that the surge in RE was primarily caused by the increase in autotrophic respiration due to the enhancement in forest growth. Indeed, personal communications with above-ground growth researchers at our site (personal communication, Shawn McKenzie) have shown that post-harvesting, above-ground tree biomass increased with significant increases in diameter at breast-height and basal area detected. This suggests that despite the decrease in soil CO2 emissions, an increase in above-ground RE may have compensated for any reductions in soil CO2 efflux. Finally, an increase in RE can also be attributed to a disparity between flux footprints for the eddy covariance fluxes, which encompass the whole stand, as compared to a localized area where the soil CO2 efflux chambers were installed. Soil CO2 efflux chambers often overestimate soil respiration as compared to RE measured by the eddy covariance system [58]. This study highlights the complexities and challenges associated with soil CO2 efflux studies and the need for comprehensive and long-term field studies to better understand the response of these fluxes to a change in the future climate.

5. Conclusions

Silvicultural practices, such as shelterwood harvesting, can have a profound impact on forest carbon dynamics by changing soil temperature, and soil water content, soil organic matter, root biomass, and microbial activity. These silvicultural practices are being adopted in North America and across the world, not only to manage forests, particularly planted stands, but also to enhance their carbon sequestration capabilities, and/or to restore them to their previous native species, such as mixed woodland in the Great Lakes region. By comparing soil CO2 effluxes between pre- and post-harvesting years, this study showed that soil temperature and soil moisture did not show any significant changes post-harvesting compared to pre-harvesting. Despite similar climate conditions, soil CO2 effluxes post-harvesting were lower than pre-harvesting. Further collection of soil CO2 efflux measurements as the forest re-establishes are needed to determine the full effect of the shelterwood system on soil respiration and, particularly, the impact to heterotrophic and autotrophic respiration following post-harvesting. Results presented in this study are useful for forest management practitioners, specifically those focused on carbon sequestration and forest conservation. The knowledge gained from this research will help in developing polices for better management of forest ecosystems in Eastern Canada, in addition to assisting in planning and developing realistic strategies to offset fossil fuel CO2 emissions to improve environmental quality.

Author Contributions

Conceptualization, A.A., M.K. and E.H.; Methodology, R.T., M.K., E.H. and A.A.; Formal Analysis, R.T., M.K. and E.H.; Writing – Original Draft Preparation, R.T. and E.H.; Writing – Review & Editing, R.T., M.K. and A.A.; Visualization, R.T., M.K., E.H. and A.A.; Funding Acquisition, A.A. All authors have read and agreed to the published version of the manuscript.

Funding

This study was funded by the Natural Sciences and Engineering Research Council (NSREC) Discovery and Strategic grants and the Ontario Ministry of the Environment (MOE). Funding from the Canadian Foundation of Innovation (CFI) through New Opportunity and Leaders Opportunity Fund and Ontario Research Fund of the Ministry of Research and Innovation is also recognized. In kind support from the Ontario Ministry of Natural Resources and Forestry (OMNRF), Natural Resources Canada, Environment Canada, the Long Point Region Conservation Authority (LPRCA), Long Point Waterfowl Research and Education Centre, Normandale Fish Culture Station, and the St. Williams Conservation Reserve Community Council are also acknowledged.

Acknowledgments

We thank Jason Brodeur, the members of the McMaster Hydrometeorology and Climatology research group, and Zoran Nesic (T. A. Black’s group at the University of British Columbia) for their contributions to the flux and biometric data. We also thank Steve Williams from OMNRF. We appreciate the useful suggestions provided by the three reviewers, and are grateful for their contribution during the editorial process of this paper.

Conflicts of Interest

The authors declare no conflict of interest.

Appendix A

Table A1. Comparison of various model fits for the observed soil flux data.
Mixed Effects Model fitted (Random effects were: Chamber, DOY) Fixed, as listed below, including interactions:Sample dfAICBIC1:1 obs vs pred adj R2
LN(Rs) ~ Ts only53854.7853886.1250.6467
LN(Rs) ~ Ts + SM63597.2883634.8950.7272
LN(Rs) ~ Ts + SM + Thinning73463.5743507.4500.7281
LN(Rs) ~ Ts + SM + Thinning + Variety93459.1693515.5810.7280
LN(Rs) ~ Ts*SM + Thinning + Variety103294.8153357.4950.7537
LN(Rs) ~ Ts*SM*Thinning *Variety272922.0773091.3120.7571
Variety = total Rs, Rh, LFH collar groupings. Interaction terms included when variables (*), Thinning categorical variable = PreThin = 1 for 2008–2011 data inclusive, and 0 otherwise, For the 1:1 comparison, predicted LN(Rs) values where back-transformed before the comparison.
Table A2. Comparison of model parameter estimates for pre- and post-harvesting formulation of the best-fitted model (LN(Rs) ~ Ts*SM*THINNING *Variety).
Variable Pre-Harvesting EstimatePost-Harvesting Estimate
Soil temperature0.06719–0.00243
Soil moisture1.8378–6.97301
Soil temperature and moisture interaction term0.19180.8676
Intercept–4.3074–3.1823

References

  1. Pan, Y.; Birdsey, R.A.; Fang, J.; Houghton, R.; Kauppi, P.E.; Kurz, W.A.; Phillips, O.L.; Shvidenko, A.; Lewis, S.L.; Canadell, J.G.; et al. A large and persistent carbon sink in the world’s forests. Science 2011, 333, 988–993. [Google Scholar] [CrossRef] [Green Version]
  2. Davidson, E.A.; Belk, E.; Boone, R.D. Soil water content and temperature as independent or confounded factors controlling soil respiration in a temperate mixed hardwood forest. Glob. Chang. Biol. 1998, 4, 217–227. [Google Scholar] [CrossRef] [Green Version]
  3. Heimann, M.; Reichstein, M. Terrestrial ecosystem carbon dynamics and climate feedbacks. Nature 2008, 451, 289–293. [Google Scholar] [CrossRef] [PubMed]
  4. Piao, S.; Ciais, P.; Friedlingstein, P.; Peylin, P.; Reichstein, M.; Luyssaert, S.; Margolis, H.; Fang, J.; Barr, A.; Chen, A.; et al. Net carbon dioxide losses of northern ecosystems in response to autumn warming. Nature 2008, 451, 49–52. [Google Scholar] [CrossRef] [PubMed]
  5. Allen, C.D.; Macalady, A.K.; Chenchouni, H.; Bachelet, D.; McDowell, N.; Vennetier, M.; Kitzberger, T.; Rigling, A.; Breshears, D.D.; Hogg, E.H.; et al. A global overview of drought and heat-induced tree mortality reveals emerging climate change risks for forest. For. Ecol. Manag. 2010, 259, 660–684. [Google Scholar] [CrossRef] [Green Version]
  6. Khomik, M.; Arain, M.A.; Liaw, K.-L.; McCaughey, J.H. The debut of a flexible model for soil respiration: the Gamma model. J. Geophys. Res.-BIOGEO 2009, 114, GO3004. [Google Scholar] [CrossRef]
  7. Jassal, R.S.; Black, T.A.; Nesic, Z.; Gaumont-Guay, D. Using automated non-steady-state chamber systems for making continuous long-term measurements of soil CO2 efflux in forest ecosystems. Agric. For. Meteorol. 2012, 161, 57–65. [Google Scholar] [CrossRef]
  8. Wharton, S.; Falk, M.; Bible, K.; Schroeder, M.; Paw U, K.T. Old-growth CO2 flux measurements reveal high sensitivity to climate anomalies across seasonal, annual and decadal time scales. Agric. For. Meteorol. 2012, 161, 1–14. [Google Scholar] [CrossRef]
  9. Bastos, A.; Running, S.W.; Gouveia, C.; Trigo, R.M. The global NPP dependence on ENSO: La Niña and the extraordinary year of 2011. J. Geophys. Res.-Atmos. 2013, 118, 1247–1255. [Google Scholar] [CrossRef] [Green Version]
  10. Hogg, E.H.; Michaelian, M.; Hook, T.I.; Undershultz, M.E. Recent climatic drying leads to age-independent growth reductions of white spruce stands in western Canada. Glob. Chang. Biol. 2017, 23, 5297–5308. [Google Scholar] [CrossRef]
  11. Vesala, T.; Suni, T.; Rannik, Ü.; Keronen, P.; Markkanen, T.; Sevanto, S.; Grönholm Smolander, S.; Kulmala, M.; Ilvesniemi, H.; Ojansuu, R.; et al. Effect of thinning on surface fluxes in a boreal forest. Glob. Biogeochem. Cycle 2005, 19. [Google Scholar] [CrossRef]
  12. Peng, Y.; Thomas, S.C.; Tian, D. Forest management and soil respiration: Implications for carbon sequestration. Environ. Rev. 2008, 16, 93–111. [Google Scholar] [CrossRef]
  13. Powers, M.D.; Webster, C.R.; Pregitzer, K.S.; Palik, B.J. Spatial dynamics of radial growth and growth efficiency in residual Pinus resinosa following aggregated retention harvesting. Can. J. For. Res. 2009, 39, 109–117. [Google Scholar] [CrossRef]
  14. D’Amato, A.W.; Bradford, J.B.; Fraver, S.; Palik, B.J. Forest management for mitigation and adaptation to climate change: Insights from long-term silviculture experiments. For. Ecol. Manag. 2011, 262, 803–816. [Google Scholar] [CrossRef]
  15. Gustafsson, L.; Baker, S.C.; Bauhus, J.; Beese, W.J.; Brodie, A.; Kouki, J.; Lindenmayer, D.B.; Lohmus, A.; Martinez, P.G.; Messier, C.; et al. Retention forestry to maintain multifunctional forests: A world perspective. BioScience 2012, 62, 633–645. [Google Scholar] [CrossRef] [Green Version]
  16. Magruder, M.; Chhin, S.; Palik, B.; Bradford, J.B. Thinning increases climatic resilience of red pine. Can. J. For. Res. 2013, 43, 878–889. [Google Scholar] [CrossRef]
  17. Trant, J. Effects of Thinning on Carbon Dynamics in a Temperate Coniferous Forest. Master’s Thesis, McMaster University, Hamilton, ON, Canada, 2014; p. 64. [Google Scholar]
  18. OMNRF. A Silvicultural Guide to Managing Southern Ontario Forests; Ontario Ministry of Natural Resources and Forestry: Toronto, ON, Canada, 2000; p. 654.
  19. OMNRF. A Silvicultural Guide for the Great Lakes-St. Lawrence Conifer Forest in Ontario; Ontario Ministry of Natural Resources and Forestry: Toronto, ON, Canada, 1998; p. 424.
  20. Marchi, M.; Paletto, A.; Cantiani, P.; Bianchetto, E. Comparing thinning system effects on ecosystem services provision in artificial black pine (Pinus nigra J.F. Arnold) forests. Forests 2018, 9, 188. [Google Scholar] [CrossRef] [Green Version]
  21. Stoffel, J.I.; Gower, S.T.; Forrester, J.A.; Mladenoff, D.J. Effects of winter selective tree harvest on soil microclimate and surface CO2 efflux of a northern hardwood forest. For. Ecol. Manag. 2010, 259, 257–265. [Google Scholar] [CrossRef]
  22. Woods, S.; Ahl, R.; Sappington, J.; McCaughey, W. Snow accumulation in thinned lodgepole pine stands, Montana, USA. For. Ecol. Manag. 2006, 235, 202–211. [Google Scholar] [CrossRef]
  23. Peng, Y.; Thomas, S.C. Soil CO2 efflux in uneven-aged managed forests: Temporal patterns following harvest and effects of edaphic heterogeneity. Plant Soil 2006, 289, 253–264. [Google Scholar] [CrossRef]
  24. Jandl, R.; Lindner, M.; Vesterdal, L.; Bauwens, B.; Baritz, R.; Hagedorn, F.; Johnson, D.W.; Minkkinen, K.; Byrne, K.A. How strongly can forest management influence soil carbon sequestration? Geoderma 2007, 137, 253–268. [Google Scholar] [CrossRef]
  25. Drewitt, G.B.; Black, T.A.; Nesic, Z.; Humphreys, E.R.; Jork, E.M.; Swanson, R.; Ethier, G.J.; Griffis, T.; Mergenstern, K. Measuring forest floor CO2 fluxes in a Douglas-fir forest. Agric. For. Meteorol. 2002, 110, 299–317. [Google Scholar] [CrossRef]
  26. Jassal, R.; Black, T.A.; Novak, M.; Morgenstern, K.; Nesic, Z.; Gaumont-Guay, D. Relationship between soil CO2 concentrations and forest-floor CO2 effluxes. Agric. For. Meteorol. 2005, 130, 176–192. [Google Scholar] [CrossRef]
  27. Khomik, M.; Arain, M.A.; Brodeur, J.J.; Peichl, M.; Restrepo-Coupe, N.; McLaren, J.D. Relative contributions of soil, foliar, and woody tissue respiration to total ecosystem respiration in four pine forests of different ages. J. Geophys. Res. 2010, 115, G03024. [Google Scholar] [CrossRef] [Green Version]
  28. Peichl, M.; Arain, M.A.; Brodeur, J.J. Age effects on carbon fluxes in temperate pine forests. Agric. For. Meteorol. 2010, 150, 1090–1101. [Google Scholar] [CrossRef]
  29. Peichl, M.; Brodeur, J.J.; Khomik, M.; Arain, M.A. Biometric and eddy covariance based estimates of carbon fluxes in an age-sequence of temperate pine forests. Agric. For. Meteorol. 2010, 150, 952–965. [Google Scholar] [CrossRef]
  30. Arain, M.A.; Restrepo-Coupe, N. Net ecosystem production in a temperate pine plantation in southeastern Canada. Agric. For. Meteorol. 2005, 128, 223–241. [Google Scholar] [CrossRef]
  31. Kula, M. Biometric-Based Carbon Estimates and Environmental Controls within an Age-Sequence of Temperate Forests. Master’s Thesis, McMaster University, Hamilton, ON, Canada, 2014; p. 64. [Google Scholar]
  32. Nicholas, E. Assessing Seasonal Dynamics of Soil CO2 Efflux Using Continuous Measurements in a Temperate Pine Forest. Master’s Thesis, McMaster University, Hamilton, ON, Canada, 2011. [Google Scholar]
  33. Gaumont-Guay, D.; Black, T.A.; Barr, A.G.; Jassal, R.S.; Nesic, Z. Biophysical controls on rhizospheric and heterotrophic components of soil respiration in a boreal black spruce stand. Tree Physiol. 2008, 28, 161–171. [Google Scholar] [CrossRef]
  34. Baldocchi, D.D.; Hicks, B.B.; Meyers, T.P. Measuring biosphere-atmosphere exchanges of biologically related gasses with micrometeorological methods. Ecology 1998, 69, 1331–1340. [Google Scholar] [CrossRef]
  35. Brodeur, J.J. Data-Driven Approaches for Sustainable Operation and Defensible Results in a Long-Term, Multi-Site Ecosystem Flux Measurement Program. Ph.D. Thesis, McMaster University, Hamilton, ON, Canada, 2014; p. 232. [Google Scholar]
  36. Hungate, B.A.; Jackson, R.B.; Field, C.B.; Chapin III, F.S. Detecting changes in soil carbon in CO2 enrichment experiments. Plant Soil 1996, 187, 135–145. [Google Scholar] [CrossRef]
  37. Johnson, D.H. The insignificance of statistical significance testing. J. Wildl. Manag. 1999, 63, 763–772. [Google Scholar] [CrossRef] [Green Version]
  38. Cueva, A.; Bullock, S.H.; Lopez-Reyes, E.; Vargas, R. Potential bias of daily soil CO2 efflux estimates due to sampling time. Sci. Rep. 2017, 7, 11925. [Google Scholar] [CrossRef] [PubMed] [Green Version]
  39. Heinemeyer, A.; DiBene, C.; Lloyd, R.; Tortorella, D.; Baxter, R.; Huntley, B.; Gelsomino, A.; Ineson, P. Soil respiration: Implications of the plant-soil continuum and respiration chamber collar-insertion depth on measurement and modelling of soil CO2 efflux rates in three ecosystems. Eur. J. Soil Sci. 2011, 62, 82–94. [Google Scholar] [CrossRef] [Green Version]
  40. R Core Team. R: A Language and Environment for Statistical Computing; R Foundation for Statistical Computing: Vienna, Austria, 2013; Available online: http://www.R.-project.org/ (accessed on 18 February 2020).
  41. Bates, D.; Maechler, M.; Bolker, B.; Walker, S. Fitting linear mixed-effects models using lme4. J. Stat. Softw. 2015, 67, 1–48. [Google Scholar] [CrossRef]
  42. Hurlbert, S.H. Pseudoreplication and the design of ecological field experiments. Ecol. Monogr. 1984, 54, 187–211. [Google Scholar] [CrossRef] [Green Version]
  43. Skubel, R.; Arain, M.A.; Peichl, M.; Brodeur, J.J.; Khomik, M.; Thorne, R.; Trant, J.; Kula, M. Age effects on the water-use efficiency and water-use dynamics of temperate pine plantation forests. Hydrol. Process. 2015, 29, 4100–4113. [Google Scholar] [CrossRef]
  44. Borken, W.; Xu, Y.J.; Davidson, E.A.; Beese, F. Site and temporal variation of soil respiration in European beech, Norway spruce, and Scots pine forests. Glob. Chang. Biol. 2002, 8, 1205–1216. [Google Scholar] [CrossRef]
  45. Monson, R.K.; Burns, S.P.; Williams, M.W.; Delany, A.C.; Weintraub, M.; Lipson, D.A. The contribution of beneath-snow soil respiration to total ecosystem respiration in a high-elevation, subalpine forest. Glob. Biogeochem. Cycle 2006, 20. [Google Scholar] [CrossRef] [Green Version]
  46. Ryu, S.-R.; Concilio, A.; Chen, J.; North, M.; Ma, S. Prescribed burning and mechanical thinning effects on belowground conditions and soil respiration in a mixed-conifer forest, California. For. Ecol. Manag. 2009, 257, 1324–1332. [Google Scholar] [CrossRef]
  47. Winston, G.C.; Sundquist, E.T.; Stephens, B.B.; Trumbore, S.E. Winter CO2 fluxes in a boreal forest. J. Geophys. Res. 1997, 102, 28795–28804. [Google Scholar] [CrossRef] [Green Version]
  48. DeForest, J.L.; Chen, J.; McNulty, S.G. Leaf litter is an important mediator of soil respiration in an oak-dominated forest. Int. J. Biometeorol. 2009, 53, 127–134. [Google Scholar] [CrossRef] [PubMed]
  49. Tang, J.; Qi, Y.; Xu, M.; Misson, L.; Goldstein, A.H. Forest thinning and soil respiration in a ponderosa pine plantation in the Sierra Nevada. Tree Physiol. 2005, 25, 57–66. [Google Scholar] [CrossRef] [PubMed]
  50. Shabaga, J.A.; Basiliko, N.; Caspersen, J.P.; Jones, T.A. Seasonal controls on patterns of soil respiration and temperature sensitivity in a northern mixed deciduous forest following partial-harvesting. For. Ecol. Manag. 2015, 348, 208–219. [Google Scholar] [CrossRef]
  51. Wang, H.; Liu, W.; Wang, W.; Zu, Y. Influence of long-term thinning on the biomass carbon and soil respiration in a larch (Larix gmelinii) forest in Northeastern China. Sci. World J. 2013. [Google Scholar] [CrossRef] [Green Version]
  52. Sullivan, B.W.; Kolb, T.E.; Hart, S.C.; Kaye, J.P.; Dore, S.; Montes-Helu, M. Thinning reduces soil carbon dioxide but not methane flux from southwestern USA ponderosa pine forests. For. Ecol. Manag. 2008, 255, 4047–4055. [Google Scholar] [CrossRef]
  53. Selig, M.F.; Seiler, J.R.; Tyree, M.C. Soil carbon and CO2 efflux as influenced by the thinning of loblolly pine (Pinus taeda L.) plantations on the piedmont of Virginia. For. Sci. 2008, 54, 58–66. [Google Scholar]
  54. Ohashi, M.; Gyokusen, K.; Saito, A. Measurement of carbon dioxide evolution from a Japanese cedar (Crytomeria japonica D. Don) forest floor using an open-flow chamber method. For. Ecol. Manag. 1999, 123, 105–114. [Google Scholar] [CrossRef]
  55. Concilio, A.; Ma, S.; Li, Q.; LeMoine, J.; Chen, J.; North, M.; Moorhead, D.; Jensen, R. Soil respiration response to prescribed burning and thinning in mixed-conifer and hardwood forests. Can. J. For. Res. 2005, 35, 1581–1591. [Google Scholar] [CrossRef]
  56. Concilio, A.; Ma, S.; Ryu, S.-R.; North, M.; Chen, J. Soil respiration response to experimental disturbances over 3 years. For. Ecol. Manag. 2006, 228, 82–90. [Google Scholar] [CrossRef]
  57. Ma, S.; Chen, J.; North, M.; Erickson, H.; Bresee, M.; LeMoine, J. Short-term effects of experimental burning and thinning on soil respiration in an old-growth, mixed-conifer forest. Environ. Manag. 2004, 33, S148–S159. [Google Scholar] [CrossRef]
  58. Brændholt, A.; Steenberg Larsen, K.; Ibrom, A.; Pilegaard, K. Overestimation of closed-chamber soil CO2 effluxes at low atmospheric turbulence. Biogeosciences 2017, 14, 1603–1616. [Google Scholar] [CrossRef] [Green Version]
Figure 1. Daily values of (a) soil temperature at 5 cm depth; (b) soil moisture averaged between 0 and 30 cm depths; and soil CO2 efflux from (c) mineral-soil efflux (FLR), (d) root trenched efflux (FRT1 and FRT2), (e) initial group of control (FS1 and FS2) chambers, and (f) latest group of control (FS3, FS4, and FS5) chambers, from 2008 to 2014. Grey line denotes timing of the shelterwood harvesting event.
Forests 11 00304 g001
Figure 2. Two-month averages of the diurnal pattern for: soil temperature at 5 cm depth in (a) March to April, (b) July to August, (c) August to September and (d) December to January; soil moisture averaged between 0 to 30 cm depth for (e) March to April, (f) July to August, (g) August to September and (h) December to January; mineral-soil CO2 efflux (FLR) for (i) March to April, (j) July to August, (k) August to September and (l) December to January; root trenched CO2 efflux (FRT) for (m) March to April, (n) July to August, (o) August to September and (p) December to January; initial group of control (FS1 and FS2) chambers for (q) March to April, (r) July to August, (s) August to September and (t) December to January; and latest group of control (FS3, FS4 and FS5) chambers for (u) March to April, (v) July to August, (w) August to September and (x) December to January. Diurnal average patterns from pre- (solid line) and post- (dotted line) harvesting event in 2012 are compared with the same months that have similar average temperature and total precipitation.
Forests 11 00304 g002
Figure 3. Daily (a) soil temperature at 5 cm depth; (b) soil moisture averaged between 0 and 30 cm depths; and (c) total soil CO2 efflux (FS), heterotrophic efflux (FRT) and mineral-soil horizon efflux (FLR) for June 2009.
Forests 11 00304 g003
Figure 4. Comparison of half-hourly (a) air temperature, (b) soil temperature at 5 cm depth, (c) soil moisture averaged between 0 and 30 cm depths, and (d) ecosystem respiration pre- and post-harvesting.
Forests 11 00304 g004
Figure 5. Comparison of mean daily soil CO2 effluxes measured (1) pre- and (0) post-harvesting for total soil CO2 efflux (Total), heterotrophic efflux (Heterot), and mineral-soil horizon efflux (noLFH). Inset figure shows soil CO2 effluxes for all chambers aggregated by year. Overall there was a decrease in most soil CO2 effluxes post-harvesting.
Forests 11 00304 g005
Figure 6. Comparison of pre- and post-harvesting net ecosystem exchange (NEP) measurements. Range in measurements was similar with post-harvesting median carbon uptake being more positive (less of a sink, with negative values defined as uptake in our sign convention here).
Forests 11 00304 g006
Table 1. Mean soil temperature, mean soil moisture and soil CO2 efflux, from total soil CO2 efflux (FS1, FS2, FS3, FS4 and FS5), heterotrophic respiration (FRT1 and FRT2) and mineral-soil horizon respiration (FLR), for pre- (2008–2011) and post-harvesting (2012–2014) periods, along with the percent difference. * denotes significant difference (α = 0.05) of the normalized daily means for soil temperature and soil moisture and for those soil CO2 efflux measurements taken at 11:00 between pre- and post-harvesting periods.
Environmental VariablePre-Thinning (no. of observations)Post-Thinning (no. of observations)% Difference t-statisticp-value
Soil Temperature9.4 ± 7.5 °C (n = 1274)9.1 ± 7.5 °C (n = 1095)−3%−0.900.37
Soil Moisture0.11 ± 0.03 m3/m3 (n = 1274)0.12 ± 0.03 m3/m3 (n = 1095)3%2.480.01
Mean Soil CO2 Efflux (μmol of C m2·s−1)
FS16.09 ± 3.66 (n = 805)4.01 ± 3.23 (n = 226)−34%−4.69*0.00
FS24.64 ± 3.20 (n = 919)4.03 ± 3.51 (n = 261)−13%−3.48*0.00
FS35.83 ± 3.90 (n = 654)5.71 ± 4.03 (n = 253)−2%−1.350.18
FS45.91 ± 3.78 (n = 578)4.90 ± 3.70 (n = 256)−17%−4.30*0.00
FS56.73 ± 4.68 (n = 409)4.68 ± 4.09 (n = 282)−30%−6.02*0.00
FLR4.06 ± 2.76 (n = 882)3.30 ± 2.77 (n = 313)−19%69.2*0.00
FRT13.84 ± 2.80 (n = 627)2.58 ± 2.63 (n = 214)−33%−7.44*0.00
FRT24.44 ± 2.79 (n = 283)3.65 ± 2.84 (n = 191)−18%−4.81*0.00

