Article

Unveiling the Diversity of Tree Growth Patterns in Boreal Old-Growth Forests Reveals the Richness of Their Dynamics

1
Département des Sciences fondamentales, Université du Québec à Chicoutimi, 555 boul. de l’Université, Chicoutimi, QC G7H 2B1, Canada
2
Centre d’étude de la forêt, Université du Québec à Montréal, P.O. Box 8888, Centre-ville Station, Montréal, QC H3C 3P8, Canada
3
Institut de Recherche sur les Forêts, Université du Québec en Abitibi-Témiscamingue, 445 boul. de l’Université, Rouyn-Noranda, QC J9X 5E4, Canada
*
Author to whom correspondence should be addressed.
Forests 2020, 11(3), 252; https://doi.org/10.3390/f11030252
Submission received: 22 January 2020 / Revised: 20 February 2020 / Accepted: 21 February 2020 / Published: 25 February 2020
(This article belongs to the Section Forest Ecology and Management)

Abstract

:
Research Highlights: Radial growth patterns of trees growing in old-growth boreal forests in eastern Canada can be grouped into a small number of simple patterns that are specific to different old-growth forest types or successional stages. Background and Objectives: Identifying the main radial growth trends in old-growth forests could help to develop silvicultural treatments that mimic the complex dynamics of old-growth forests. Therefore, this study aimed to identify the main radial growth patterns and determine how their frequencies change during forest succession in old-growth forests, focusing on boreal landscapes in eastern Canada. Materials and Methods: We used dendrochronological data sampled from 21 old-growth stands in the province of Quebec, Canada. Tree-ring chronologies were simplified into chronologies of equal length to retain only primary growth trends. We used k-means clustering to identify individual growth patterns and the difference in growth-pattern frequency within the studied stands. We then used non-parametric analyses of variance to compare tree or stand characteristics among the clusters. Results: We identified six different growth patterns corresponding to four old-growth forest types, from stands at the canopy breakup stage to true old-growth stands (i.e., when all the pioneer cohort had disappeared). Secondary disturbances of low or moderate severity drove these growth patterns. Overall, the growth patterns were relatively simple and could be generally separated into two main phases (e.g., a phase of limited radial increment size due to juvenile suppression and a phase of increased radial increment size following a growth release). Conclusions: The complexity of old-growth forest dynamics was observed mainly at the stand level, not at the tree level. The growth patterns observed in true old-growth forests were similar to those observed following partial or stem-selection cuts in boreal stands; thus, these silvicultural treatments may be effective in mimicking old-growth dynamics.

Graphical Abstract

1. Introduction

The development of industrial-scale forestry since the end of the industrial revolution has eroded much of the primary forest coverage around the world [1,2]. The consequences of tree harvesting on forest ecosystems generally differ markedly from those of natural disturbances, and these impacts significantly alter the characteristics of landscapes and stands in managed areas, for example, by rejuvenating or fragmenting these stands [3,4,5]. Such changes can threaten biodiversity [6,7,8] and the provision of ecosystem services in these forests [9,10,11].
To address these problems, new approaches to forest management have been proposed in recent decades, such as emulating natural disturbance regimes [12,13] or mimicking stand-scale natural processes [14,15]. However, recent ecological studies carried out in different biomes have highlighted the complexity of the dynamics and structures of natural forests, and in particular, that of old-growth forests (i.e., stands driven by secondary disturbances) [16,17,18]. Forest managers therefore face a major “complexity challenge” by having to find economically viable silviculture treatments that can reproduce the complexity of natural disturbances observed in old-growth forests [15].
The boreal forests of eastern Canada present good examples of the issues related to the management of old-growth forests. These types of forests are naturally abundant in these regions due to the relatively long cycles of primary disturbance [19,20] and are defined by a high structural complexity [21,22,23]. The process of forest succession, i.e., the replacement of a post-stand-replacing disturbance cohort by an old-growth cohort, is an important process that explains this diversity [24,25,26]. However, the diversity in terms of nature, periodicity, and severity of secondary disturbance also plays an important role in explaining the structural diversity of old-growth forests [21,27,28]. Therefore, boreal old-growth forests in eastern Canada remain structurally dynamic, even after the true old-growth stage has been reached, i.e., when the post-stand-replacing disturbance cohort has disappeared almost entirely.
Industrial-scale forest management has developed significantly during the second half of the 20th century in these territories [29,30]. Clearcutting is the main silvicultural treatment used in this region. This approach is combined with a logging rate that is often superior to the natural rate of stand-replacing disturbances [30,31]. Unlike fires, which burn stands of all ages, clear-cut harvests focus on stands that have reached economic maturity (e.g., >70 years in eastern Canadian boreal forests) [30,32]. Stand volume generally continuously increases up to 120–150 years after the last stand-replacing fire in the boreal forests of eastern Canada [22,33]. However, the annual volume increment starts to decrease after 70 years, which explains this age threshold for logging. Thus, in managed landscapes, the total area of old-growth forests is substantially lower than that observed in landscapes driven only by natural disturbances [29,34]. As a result, maintaining a minimum area of boreal old-growth forest has become a priority for forest management plans in eastern Canada [35]. However, doubts have been raised regarding the ability to maintain the structural diversity of old-growth forests [31]. Silvicultural treatments that are often defined as “close-to-nature,” such as partial cut or stem-selection cut, are therefore often proposed as alternatives to clearcutting [15,36,37]. However, due to the low wood volume per hectare and the remoteness of boreal forests, partial cuts or stem selection cuts are often performed with heavy machinery and need to harvest a significant amount of wood to be cost-effective [38,39,40]. Although numerous experiments have shown that partial cutting can be applicable and beneficial in boreal forests, it has also been demonstrated that logging practices that are poorly adapted to stand characteristics (e.g., a too low retention of pre-harvest basal area) may have negative consequences (e.g., biodiversity loss, high subsequent mortality, or increase in mosses and shrubs competition) [37,41,42]. The use of silvicultural treatments that maintain a part of the canopy after logging is thus not a guarantee per se of a correct imitation of the dynamics observed in old-growth forests [4].
The use of dendrochronological data to reconstruct stand dynamics is a common approach in forest science [43,44,45]. Tree rings are effective indicators of forest disturbance regimes [46,47,48], stand senescence [49], and stand succession and naturalness [50]. As a result, radial growth patterns of a tree, namely the changes in tree-ring width from the pith to the last formed ring, are often accurate indicators of tree and stand dynamics [43,44,51]. Changes in growth also indicate the ways in which disturbances, natural or artificial, can alter stand growth and wood characteristics [39,52,53]. In this way, radial growth patterns may also be relevant indicators for assessing the success of a silvicultural treatment. However, knowledge about radial growth patterns in old-growth forests is still fragmentary. Most previous research that aimed to classify radial growth patterns was at least partially based on subjective decisions during classification [43,44,51]. Modern statistical approaches (e.g., machine learning algorithms like k-means clustering) may greatly reduce subjectivity in the classification of radial growth patterns, as well as the time required to perform such analysis. Hence, an improved understanding of these patterns in boreal old-growth forests can help to evaluate the similarity between the impacts from silvicultural treatments and natural disturbances. This knowledge would contribute toward clarifying the dynamic processes driving old-growth forests, which have often been overlooked by forest managers in favor of static structural indicators, such as the density in large living trees and snags [54,55]. Moreover, the “complexity challenge” related to old-growth forests is not restricted to the boreal forests of eastern Canada. The complexity of old-growth forests has been highlighted in temperate forests in North America [18,56,57], as well as in Europe, in boreal [16,58,59] and temperate forests [60,61,62]. Since old-growth temperate forests in Asia, Oceania, and South America share similar attributes with those in Europe and North America [63], it is also likely that we observe similar dynamic patterns in these regions. Therefore, any improvement in our knowledge of old-growth forests in one biome also benefits the other biomes.
As such, this study aimed to identify the main radial growth patterns in boreal old-growth forests and determine how their frequencies change during forest succession once the old-growth stage has been reached, i.e., from canopy break-up to the true old-growth stage, sensu Oliver [64]. However, boreal landscapes often differ greatly from each other in terms of tree species’ traits or disturbance regimes [20,65]; boreal forest structures and dynamics should therefore be studied at a local scale. Consequently, this study focused on boreal forests situated in the black spruce (Picea mariana Mill.)–feathermoss bioclimatic domain in Quebec, Canada [66]. Specifically, our first objective was to discriminate between the different growth patterns in boreal old-growth forests that are consistent with tree species traits and stand dynamics. We expected that boreal tree growth could be classified into a number of well-defined radial growth patterns, divided between patterns related to both pioneer and old-growth dynamics. Our second objective was to determine whether the identified radial growth patterns were specific to particular old-growth forest structures or successional stages. In fact, we expected that old-growth forests present specific radial growth patterns that depend on the forest structure and successional stage.

2. Materials and Methods
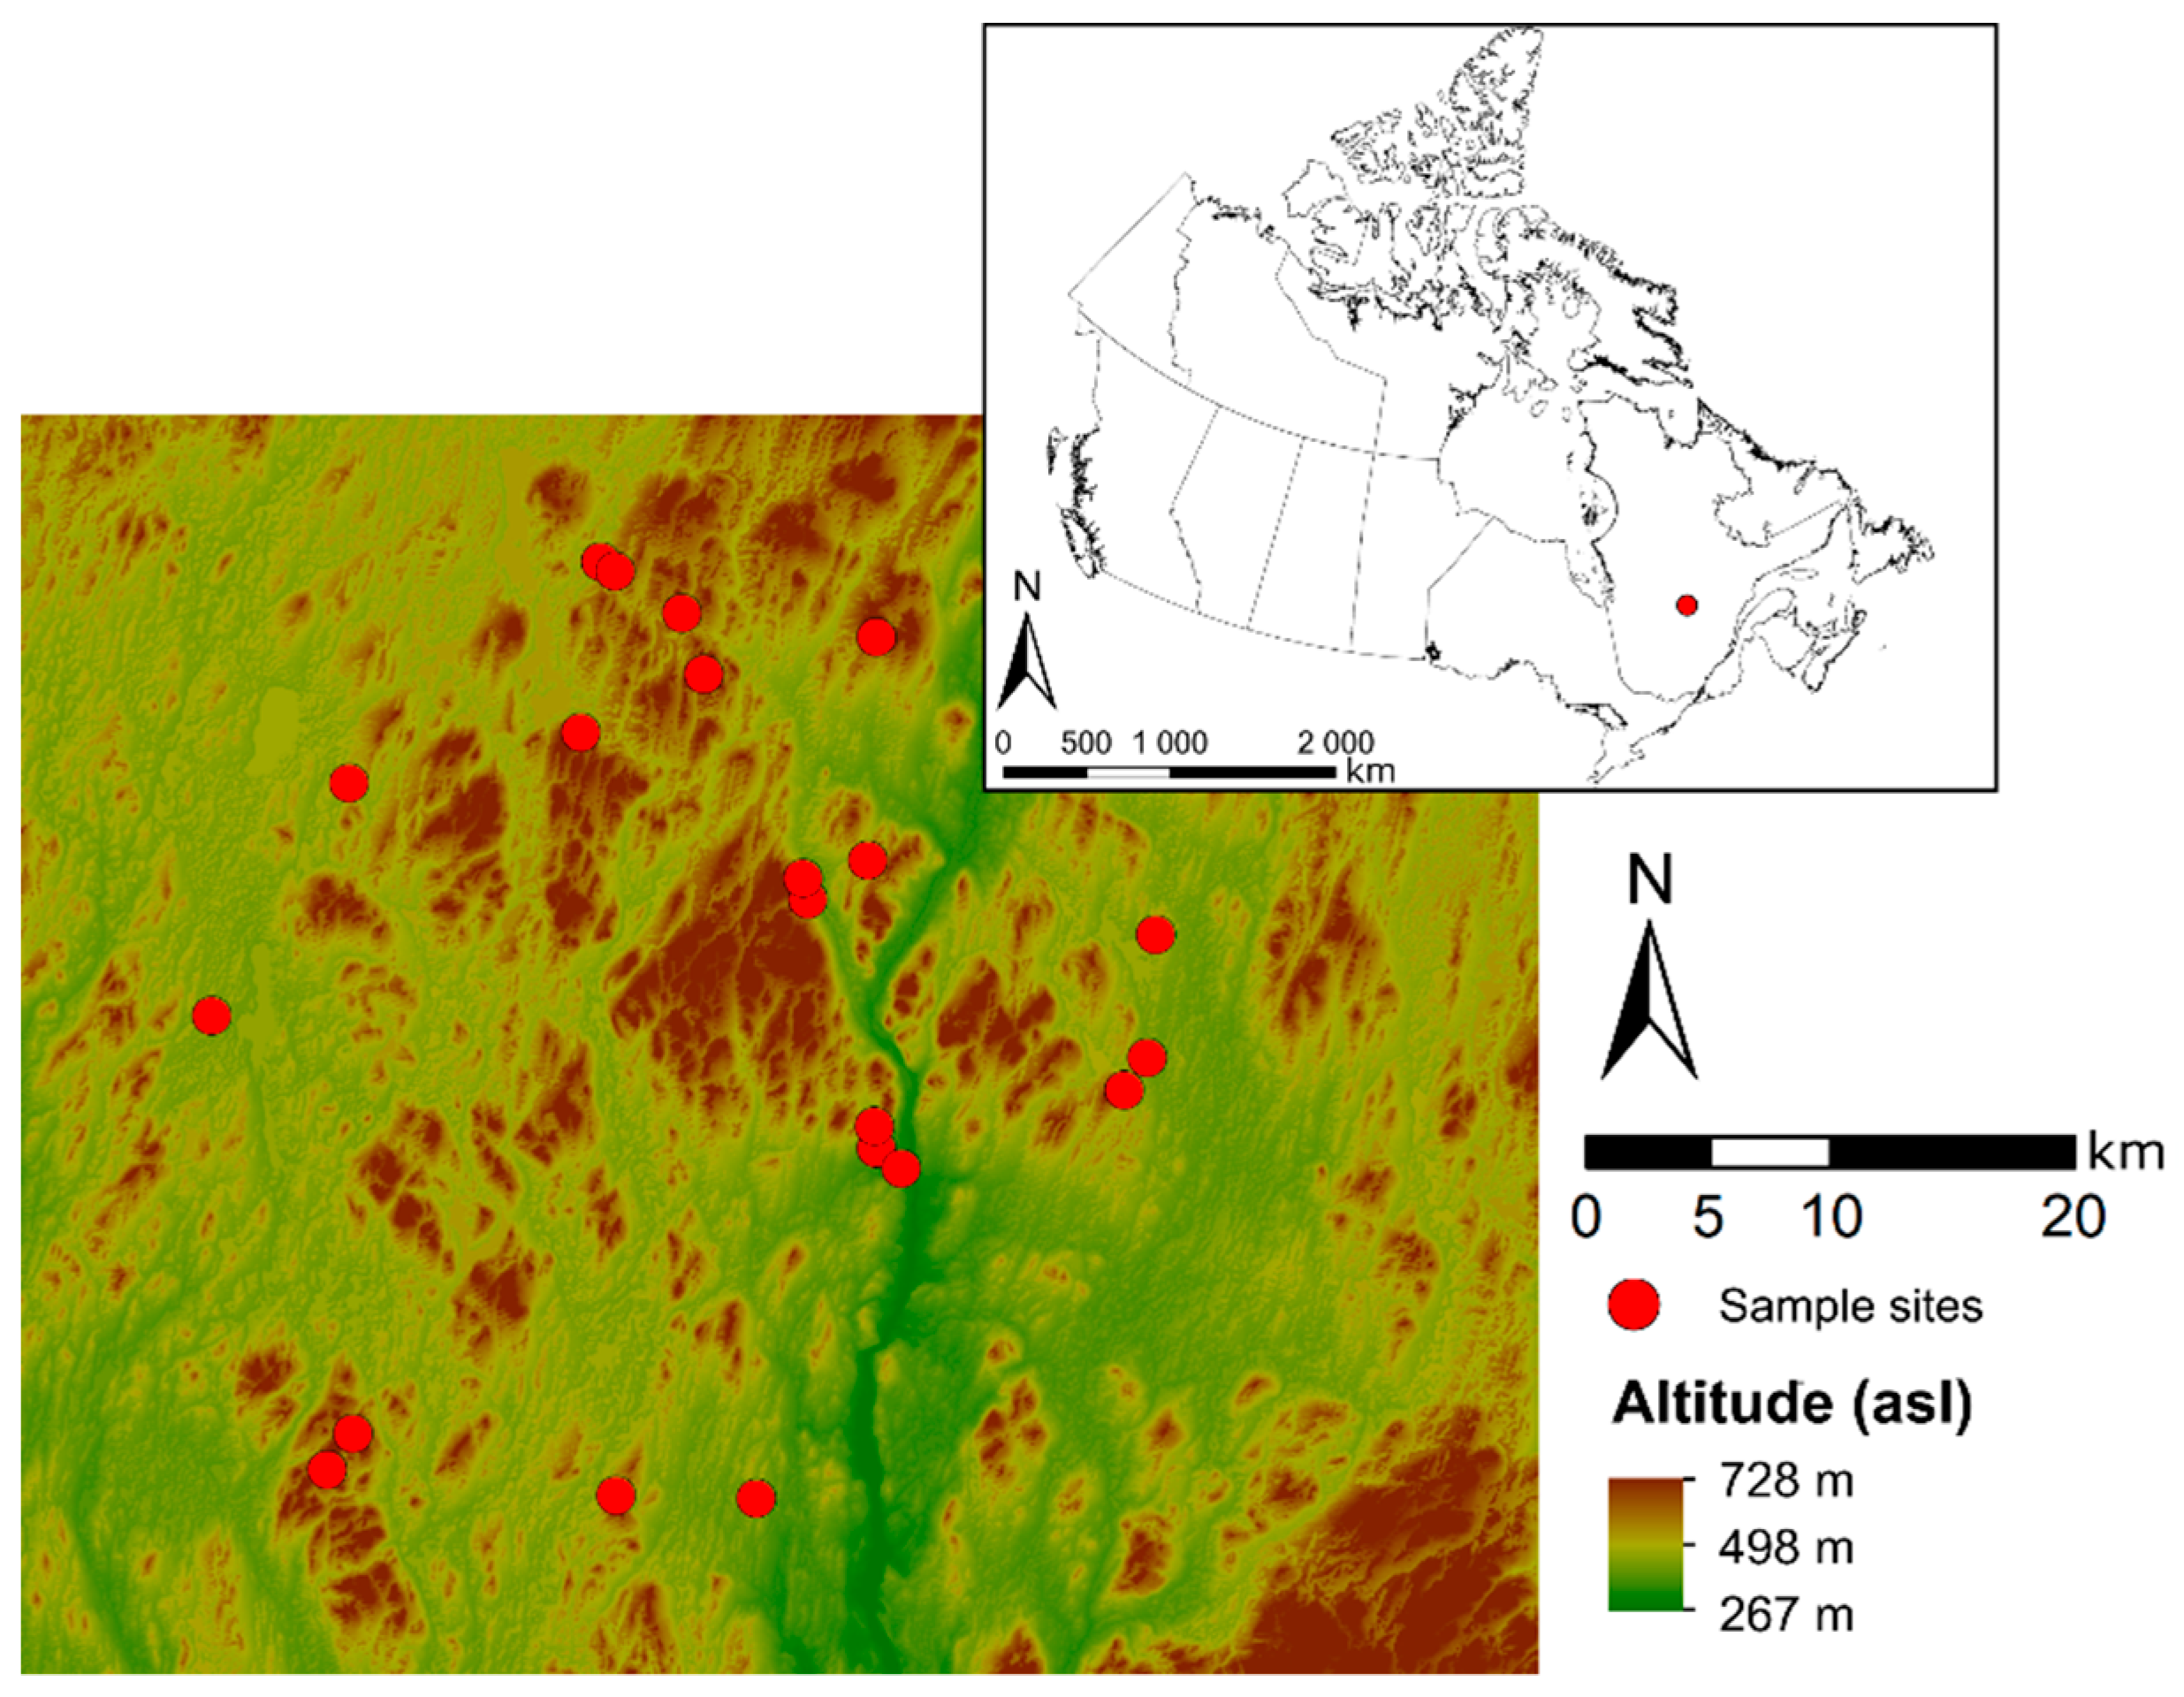
2.1. Sampling

Sampling took place within a 2200-km2 region of public land located southeast of Lake Mistassini, Quebec (72°15′00″–72°30′00′ W, 50°07′23″–50°30′00″ N) (Figure 1), that is part of the black spruce–feathermoss bioclimatic domain [66]. Black spruce and balsam fir (Abies balsamea (L.) Mill.) are the dominant tree species. Jack pine (Pinus banksiana (Lamb.), white spruce (Picea glauca (Moench) Voss), paper birch (Betula papyrifera Marsh.), and trembling aspen (Populus tremuloides) are the other main co-occurring tree species. Several research projects have already been conducted within this territory, with a focus on the primary and secondary disturbance regimes [28,31,67], and the structural diversity of boreal old-growth forests [21,68]. The fire cycle in this region has been estimated at 200–300 years [67]. Old-growth forests are therefore abundant, and the stands are primarily driven by spruce budworm (Choristoneura fumiferana Clemens) outbreaks [28]. Timber exploitation began in 1991 and continued at a low level until 2000 when harvest levels increased.
We sampled 21 sites (Table S1), selected following a stratified random sampling design [28]. We wished to collect samples from sites that were representative of the main successional stages: from the transition toward the old-growth stage (canopy break-up) to the true old-growth stage (first cohort almost completely absent) for the most abundant environmental types across the study territory. We focused on six environmental types based on the Québec’s Ministry of Forests, Wildlife and Parks (MFWP) ecological classification system. These environmental types covered a topographic gradient from organic valley bottoms to hilltops. We then selected sites based on the tree age classes that were the most likely to discriminate among the different old-growth stages in eastern Canadian boreal forests [19,70,71]: 80–100 years (most likely even-aged), 100–200 years (most likely transition old-growth), and >200 years (most likely true old-growth). At each site, we sampled basal disks collected from 20 × 20 m plots situated 125 m from the stand edge; for each plot we aimed to collect 30 living and dead stems having a diameter at breast height (dbh) ≥9 cm (merchantable stems) [28]. We rejected any disks marked by significant amounts of decay that prevented tree-ring analysis. In cases where it was impossible to sample a minimum of 30 merchantable stems per site, we sampled merchantable stems near the plot edge or saplings (i.e., trees with a dbh <9 cm but a height ≥1.3 m) within the plot, depending on the site characteristics. However, we were not able to collect 30 discs of coniferous species in four stands due to very low stand density, high broadleaved species abundance, or a significant amount of rot on the sampled stems. The minimum number of trees sampled in a stand was 15 (36.1 ± 12 trees sampled/site; Table S2). We sampled 756 trees: 623 black spruce, 114 balsam fir, and 19 jack pine.

2.2. Data Preparation

The basal disks were air-dried and mechanically sanded for tree-ring measurements. Tree rings were then measured along two radii (radius series) to the nearest 0.01 mm, using a manual Henson micrometer (Fred C. Henson, Mission Viejo, CA, USA) or a LINTAB measurement table and TsapWin software (Rinntech, Heidelberg, Germany). The radius series were corrected using a combination of visual cross-dating and the COFECHA computer program [72]. We rejected all series that were impossible to date accurately because of significant growth anomalies or a high number of missing rings. We calculated a single series for each tree (tree series) by taking the mean value of each tree ring measured in the radius series of the corresponding tree. The total number of tree series was 756, corresponding to the number of trees [28].
We computed the following growth attributes for each tree based on the tree series: age, mean tree-ring width, ring width standard deviation, ring width 5th percentile (5th percentile of tree-ring width), ring width 95th percentile (95th percentile of tree-ring width), and cumulative radial growth (CRG) using the following formula:
C R G =   T R W × 2
where TRW represents tree-ring width. We considered the cumulative growth to approximate the basal tree diameter.
To identify the tree radial growth patterns, i.e., the main radial growth trends over time, we divided each tree series into 20 segments, each containing a similar number of tree rings (the difference in the number of rings per segment for a same tree never exceeded one ring). The first segment began at the first ring after the pith, and the last segment ended at the last ring produced by the tree. Overall, the mean number of tree rings by segment was equal to 6.8 ± 2.5 rings. These differences in the number of rings per segment results from the wide age range (48 to 286 years) of the sampled trees. We then computed the mean ring width value for each segment of each tree, generating the 20-segment series (Figure S1). These 20-segment series allowed us to compare the trends of radial increments between trees of different ages, where the age of the sampled trees ranged from 48 to 286 years. Second, the 20-segment series was used to smooth any interannual variation in the ring width. We chose 20 segments after a preliminary analysis, where we compared the patterns with 10, 20, 30, or 40 segments; 50 or more segments were not considered because it was above the age of the youngest tree (i.e., 48 years). This preliminary analysis demonstrated that a value of 20 segments offered the best balance between precision and parsimony. In this way, interannual growth changes were smoothed, and only the global trend of the radial increment remained visible.
For each plot, we also computed the following structural, environmental, and successional attributes during fieldwork (Table S1): merchantable tree density, sapling density, basal area, balsam fir proportion in the basal area, coarse woody debris volume, maximum height, cohort basal area proportion (CBAP; sensu Kneeshaw and Gauthier [73]), minimum time since the last fire, slope, and depth of the organic horizon [21]. CBAP represents the replacement of the first cohort after the last primary disturbance (shade-intolerant species) by successive new cohorts of shade-tolerant species. Its value ranges between 0 and 1. A CBAP ≈ 0 indicates a stand where all trees belong to the first cohort, and a CBAP = 1 indicates a stand where the first cohort has been entirely replaced by new cohorts. CBAP is thus an indicator of the stand transition from the even-aged to the true old-growth stage, i.e., the stage where almost all trees from the first cohort have disappeared [21].

2.3. Statistical Analyses
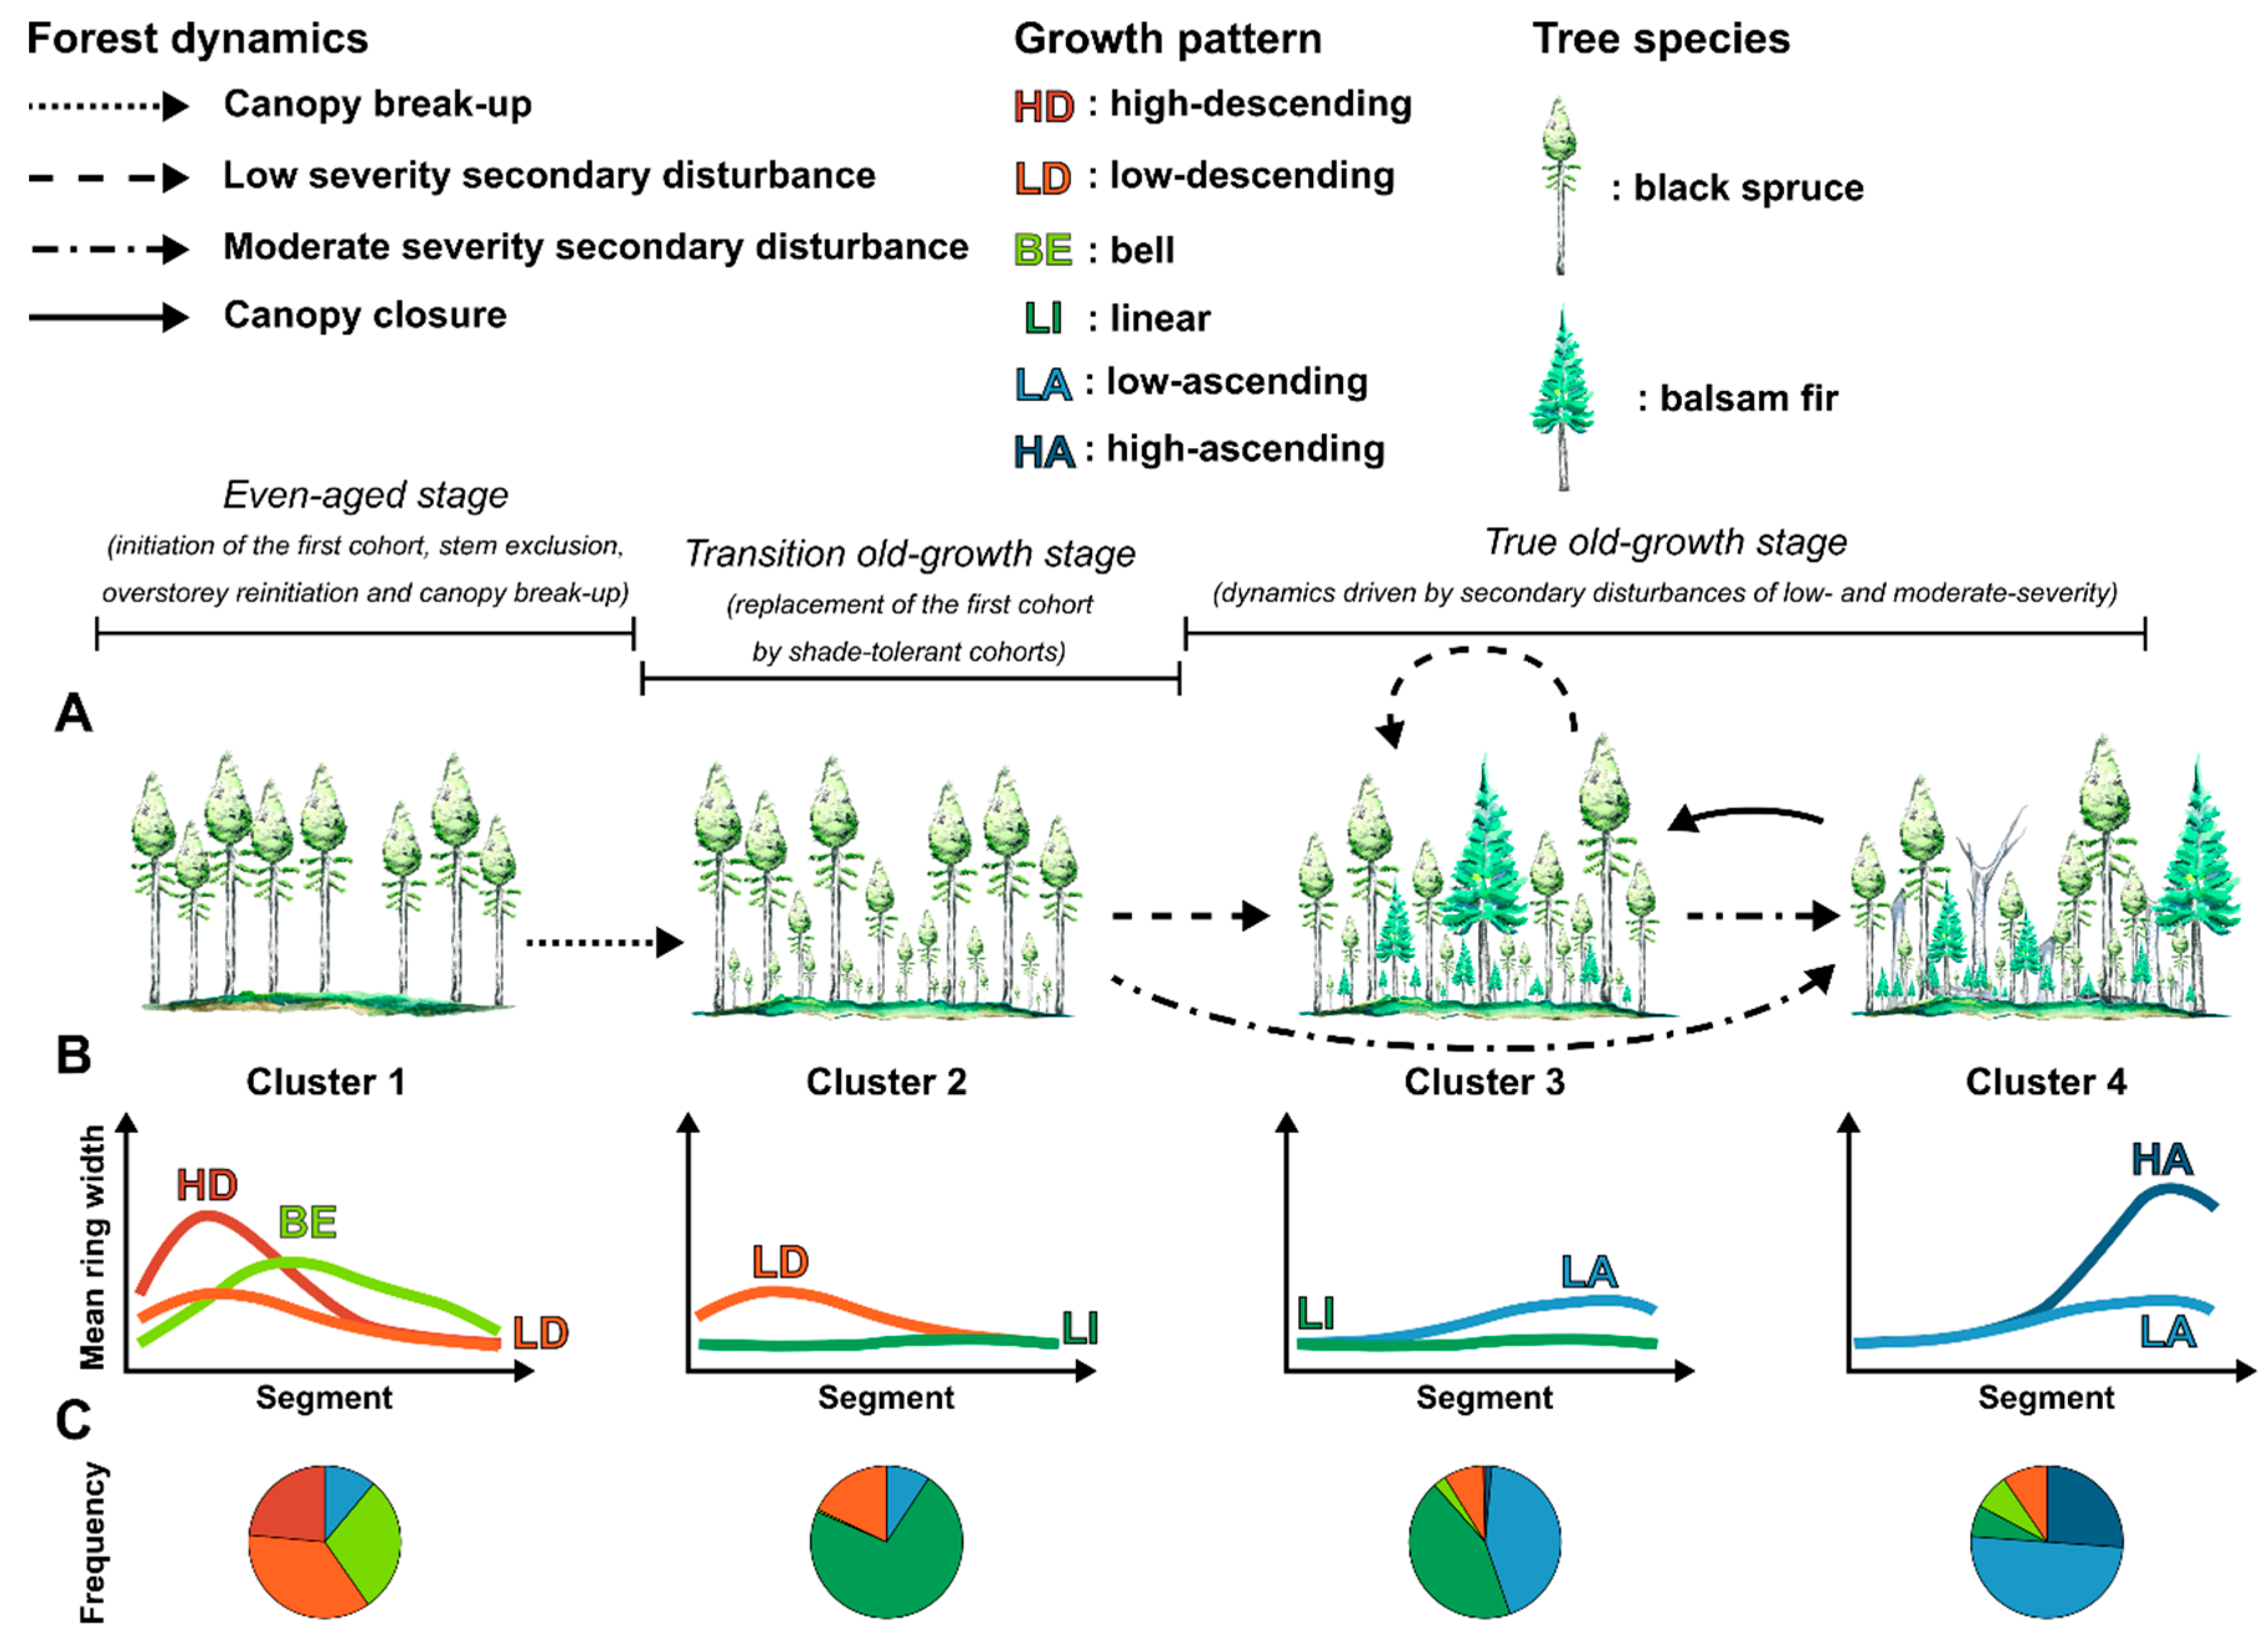
For our first hypothesis, namely that boreal tree growth can be divided into well-defined radial growth patterns, we used a k-means clustering algorithm [74] on the 756 20-segment series to identify the main growth patterns. Clustering was based on the mean ring width for each of the 20 segments, which were scaled and centered, with each segment considered to be a different explanatory variable. To ensure clustering robustness, we performed 1000 iterations of the k-means algorithm. We determined the optimal number of clusters (radial growth patterns) using the simple structure index (SSI; [75]) criterion. We then compared the growth attributes among the different growth radial patterns using a Kruskal–Wallis non-parametric analysis of variance, followed by a non-parametric Fisher’s least significant difference post-hoc test [76]. We also compared the distribution of growth clusters by tree species using Fisher’s exact test. We removed jack pine from this analysis because of the low number of trees sampled.
For our second hypothesis, namely that boreal old-growth forests present specific radial growth patterns corresponding to different old-growth structures or succession stages, we computed the relative frequency of each previously identified radial growth pattern for each site and then performed a second k-means clustering with 1000 iterations. We determined the optimal number of clusters (stand clusters) using the SSI criterion. We then compared the structural, environmental, and temporal characteristics of the different stand clusters using a Kruskal–Wallis non-parametric analysis of variance, followed by a non-parametric Fisher’s least significant difference post-hoc test, with stand clusters being considered as a dependent variable.
For all statistical analyses, we used R-software, version 3.3.1 [77] and the vegan [78] and agricolae [79] packages, applying a p-threshold of significance of 0.05.

3. Results

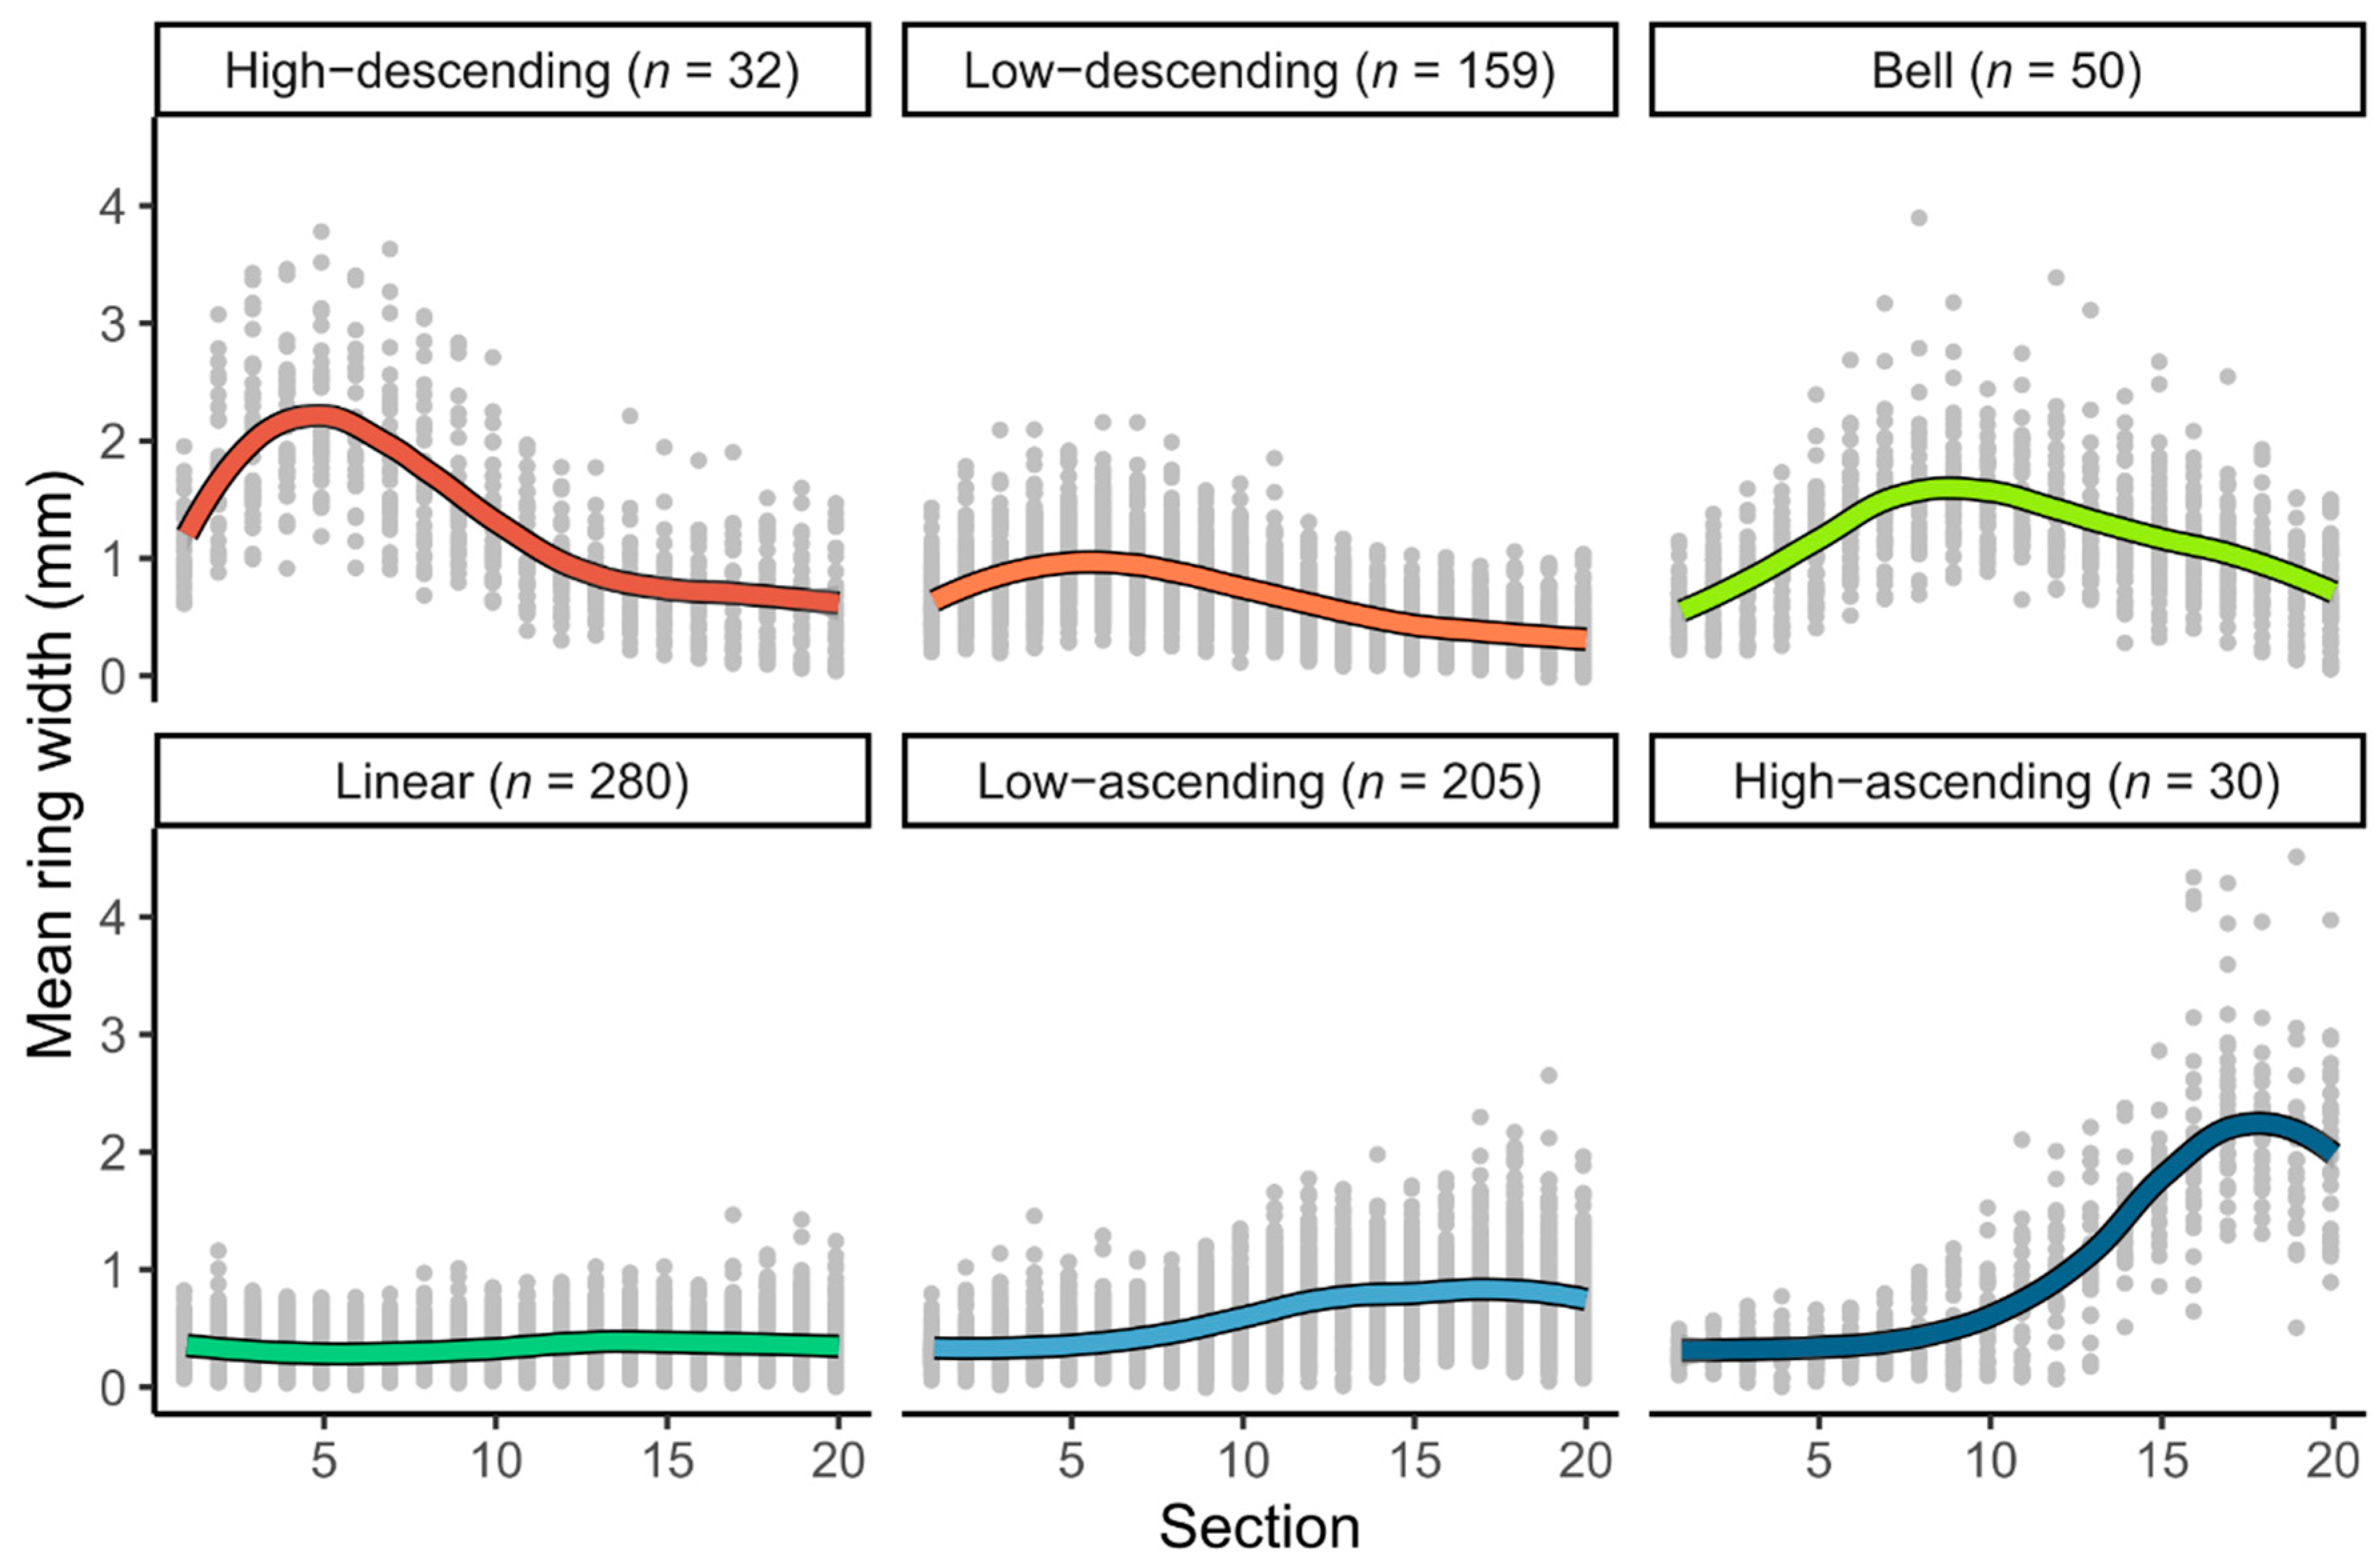
3.1. Radial Growth Patterns

The SSI criterion index reached its maximum at six clusters (SSI criterion = 0.99) for the 20-segment series. We therefore divided the 20-segment series into six clusters to represent the various radial growth patterns: (1) high radial increments on the first half of the chronology, followed by low radial increments on the remaining portion (high-descending); (2) moderately high radial increments on the first half of the chronology, followed by low radial increments on the remaining portion (low-descending); (3) moderately increasing radial increment along the first half of the chronology, followed by moderately decreasing radial increments on the remaining portion (bell); (4) low and constant radial increments along all the sections (linear); (5) low radial increments on the first half of the chronology, followed by moderately higher radial increments on the remaining portion (low-ascending); and (6) low radial increments on the first half of the chronology, then high radial increments on the remaining chronology (high-ascending) (Figure 2).
The number of trees classified to each radial growth pattern varied markedly from 30 trees (high-ascending) to 280 trees (linear). The frequency of black spruce and balsam fir differed significantly among the radial growth patterns (Fisher’s exact test, p-value < 0.001; Table 1). In decreasing order, the most frequent patterns for black spruce were linear (38.8%), low-ascending (24.2%), low-descending (20.5%), and bell (7.5%). In contrast, the most frequent patterns for balsam fir were low-ascending (47.4%), linear (33.3%), and low-descending (14%). For both species, the remaining patterns were observed for <5% of the sampled trees. Tree age, mean ring width, ring width standard deviation, ring width 5th percentile, ring width 95th percentile, and cumulative radial growth differed significantly between the radial growth patterns (Table 2). Overall, the tallest, youngest, and most productive trees were defined mainly by the high-descending, bell, and high-ascending patterns, respectively. In contrast, the linear pattern generally defined the smallest, oldest, and least productive trees, while the low-descending and low-ascending patterns represented an intermediary group between these two types (Figure 3).

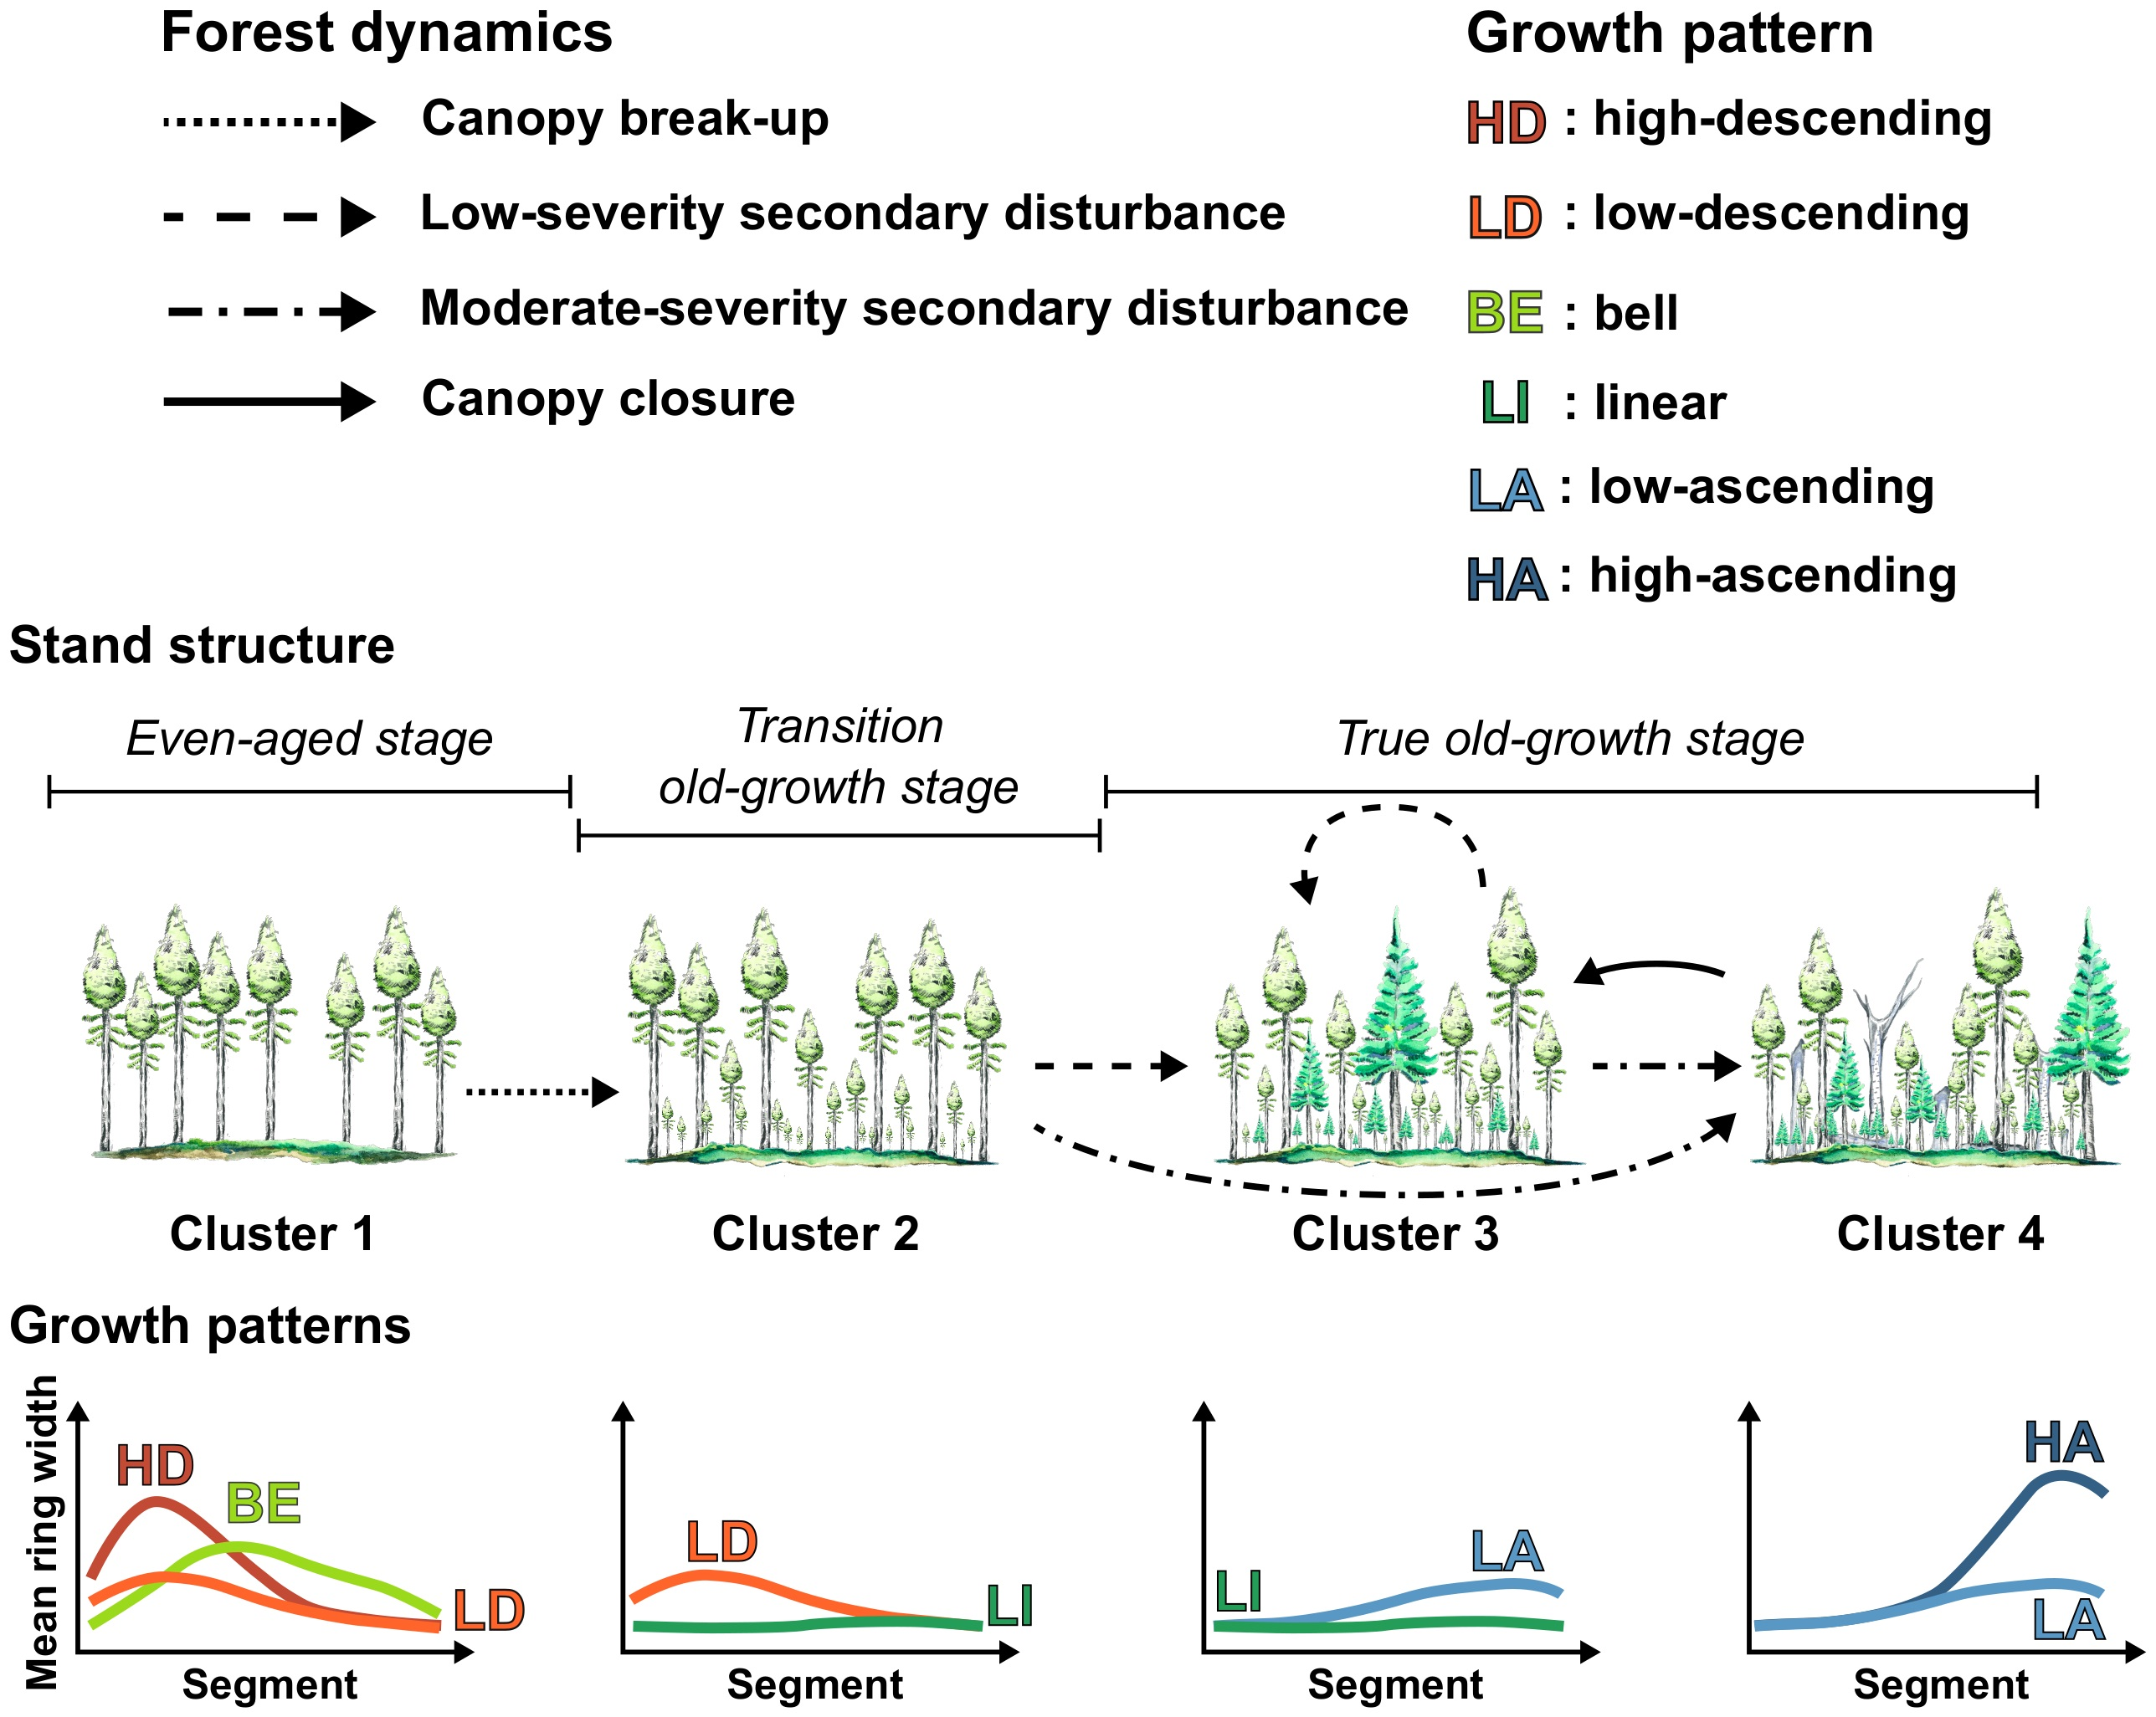
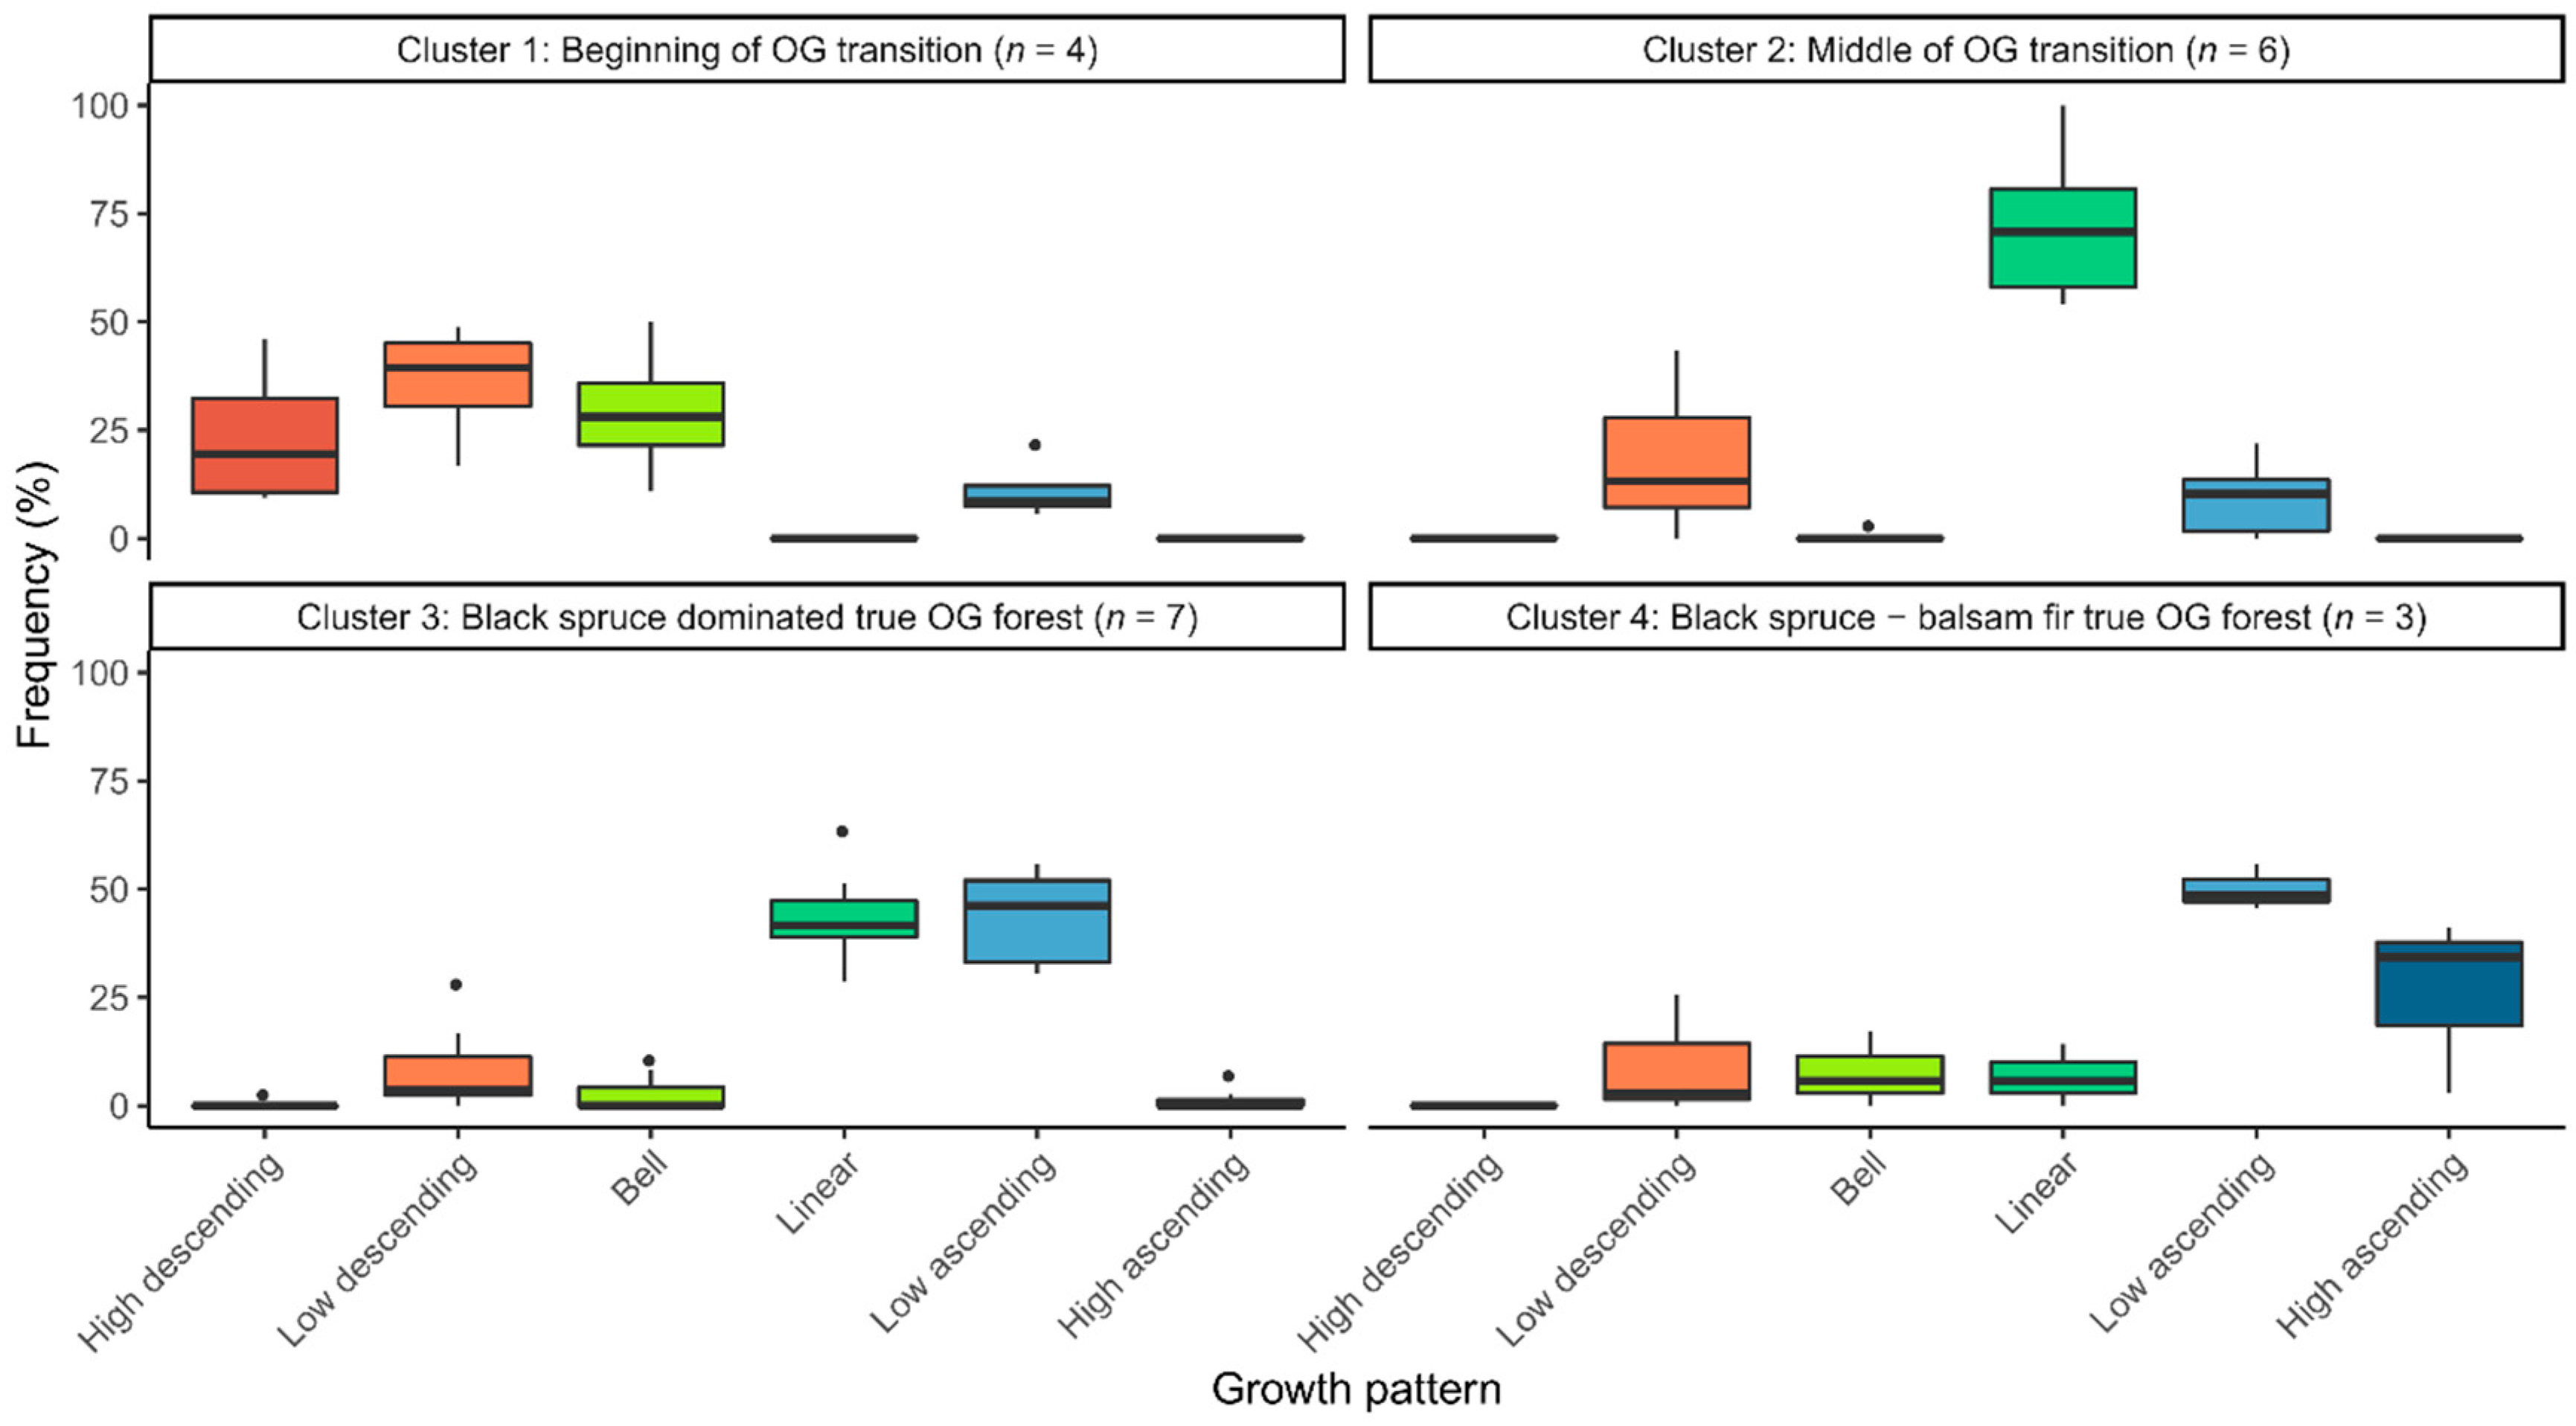
3.2. Distribution of Radial Growth Patterns During Forest Succession

The SSI criterion for stand clusters was the highest for three clusters (SSI criterion = 9.2), but it nonetheless remained quite high for five clusters (SSI criterion = 8.3). As five clusters provided the most details about forest succession dynamics, we divided the studied stands into five clusters. One cluster, however, contained only a single site (Table S3), almost completely defined by a single radial growth pattern (descending-low, 86% of the radial growth patterns). We removed this cluster from subsequent analyses.
The structural, successional, and environmental attributes differed significantly among the stand clusters, except for merchantable tree density, sapling density, and slope (Table 3). CBAP and minimum time since the last fire (MTSLF) indicated that clusters were distributed along a successional gradient: cluster 1 grouped stands at the beginning of the old-growth transition (CBAP = 0.14 ± 0.12 and MTSLF = 106 ± 29.3 years); cluster 2 grouped stands in the middle of the old-growth transition (CBAP = 0.47 ± 0.4 and MTSLF = 191 ± 54.7 years); both clusters 3 and 4 grouped true old-growth stands (respectively: CBAP = 0.8 ± 0.35 and MTSLF = 259 ± 28.2 years; CBAP = 0.82 ± 0.3 and MTSLF = 179 ± 43.2 years). Differences in balsam fir proportions indicated that cluster 3 regrouped black spruce-dominated stands, whereas cluster 4 regrouped mixed black spruce–balsam fir stands. Surprisingly, balsam fir proportions were higher in cluster 1 than in cluster 2 sites; however, this proportion was highest for clusters 3 and 4. Similarly, the basal area was highest in cluster 1, lowest in cluster 2, and did not differ between the remaining clusters. The depth of the organic horizon was lowest for cluster 1, highest for cluster 2, and it did not differ between the remaining clusters. The coarse woody debris and maximum height increased progressively during succession, reaching a maximum for cluster 4 sites. The clusters therefore represented different stages of the old-growth succession process. Nonetheless, compared to the other clusters, cluster 2 regrouped mainly low-productivity stands.
Trees defined by the high-descending, low-descending, and bell patterns dominated stands at the beginning of the old-growth succession (cluster 1) (Figure 4). In stands representing the middle of old-growth succession (cluster 2), the linear pattern dominated, followed by the low-descending and low-ascending patterns. At the end of the old-growth succession, black spruce-dominated true old-growth stands (cluster 3) contained mainly trees belonging to the linear and low-ascending patterns. In contrast, low-ascending and high-ascending patterns had the highest frequency in true old-growth stands dominated by black spruce–balsam fir (Cluster 4). The high-descending, low-descending, and bell patterns therefore dominated at the beginning of the successional process, replaced by the linear, low-ascending, and high-ascending patterns toward the end of this process. The high-descending pattern was specific to cluster 1, while the high-ascending pattern was specific to cluster 4. The remaining radial growth patterns were present in at least three different clusters. The distribution of radial growth patterns therefore changed with the old-growth successional stage.

4. Discussion

4.1. Radial Growth Patterns as Accurate Indicators of Stand Dynamics

The radial growth patterns that we observed were consistent with boreal forest dynamics. The high-descending, low-descending, and bell patterns dominated in stands at the beginning of the old-growth transition; these patterns are typical of boreal trees having germinated after a severe forest fire [80,81]. In contrast, the linear, low-ascending, and high-ascending patterns dominated the radial growth patterns in true old-growth forests. These patterns are typical of suppressed trees in old-growth stands driven by gap dynamics, which are continuous dynamics where understory shade-tolerant trees replace overstory trees that die individually or in small groups due to secondary disturbances. Thus, trees defined by these patterns likely benefitted from an abrupt opening in the canopy to suddenly increase their radial growth [52,81,82].
The identified patterns also match the life-history traits of the studied tree species. Jack pine is a pioneer species, balsam fir is a shade-tolerant species, and black spruce is both a pioneer and shade-tolerant species [83]. Thus, even if only 19 jack pines were sampled in this study, a high-descending or low-descending pattern defined all these samples (Table S4), which is a characteristic of pioneer dynamics. In contrast, we recorded low-ascending and linear patterns, typical of old-growth dynamics, as the most frequently observed patterns in balsam fir (80.7% of sampled balsam firs). Finally, the dominant black spruce radial growth patterns included patterns common to both even-aged (low-descending pattern) and old-growth stages (linear and low-ascending patterns); this is consistent with the presence of black spruce at all stages of forest succession in the boreal forests of eastern Canada [21,83]. The radial growth patterns identified in this study are most likely the main growth trends observed in eastern Canadian boreal forests.
Black spruce and balsam fir longevity are relatively short (often <200 years). It is thus probable that suppressed boreal trees in eastern Canada do not live long enough to experience more than one clearly distinguishable growth change, thereby explaining the relative simplicity of our observed growth trends. The low vertical stratification of the boreal old-growth forest, due to the limited tree heights [19], may also help to explain the absence of highly complex growth patterns. However, numerous growth releases can be observed within boreal trees sampled from old-growth forests, even when they are defined by a low annual radial increment [28,81]. Similarly, radial growth patterns observed in the literature for boreal or alpine trees are often more diverse than those identified in this study, even if the overall trends are similar. For example, bimodal or multimodal trends have been observed in these forests [51,84,85], which are two patterns that are absent from our results. However, the patterns identified in this study are very similar to those highlighted by Trotsiuk et al. [86] in European primary forests dominated by Norway spruce (Picea abies (L.) Karst.). Nevertheless, it is likely that slow-growth patterns, i.e., low-descending, linear, and high-ascending patterns, can be divided into several sub-patterns. However, the diversity within slow-growth patterns was possibly hard to distinguish due to the presence of fast-growth patterns, i.e., high-descending, bell, and high-ascending patterns. Growth changes in slow-growth patterns may be less remarkable than those in fast-growth patterns; for example, an abrupt change in radial growth from 0.1 mm·year−1 to 0.3 mm·year−1 is important at the tree scale, but this change is hard to identify if other trees are defined by a radial growth of 1.5 mm·year−1. For this reason, subsequent analyses focused on stands at the same succession stage or productivity are necessary to provide a more detailed view of the diversity of growth patterns.

4.2. Changes in Dominant Radial Growth Patterns along an Old-Growth Succession

The sampled stands were distributed along an old-growth succession gradient, starting at the beginning of succession (canopy break up; cluster 1) and ending at the true old-growth stage, i.e., the stage where almost all first-cohort trees have disappeared (clusters 3 and 4). Cluster 2 corresponded to the transition between cluster 1 and clusters 3 and 4 (transition old-growth stage; gap dynamics have started but the first cohort remains dominant). Changes in growth pattern frequencies provided relevant information about forest dynamics along the old-growth transition process (Figure 5). It is likely that trees defined by the high-descending and bell patterns are the first trees to die during forest succession, as higher productivity often means reduced longevity [87,88]. As such, most first-cohort trees remaining in the transition old-growth forests were characterized by the low-descending pattern. Meanwhile, trees from newer shade-tolerant cohorts, which progressively replace the first cohort, were defined by either a linear pattern (suppressed trees) or a low-ascending pattern (formerly suppressed trees that benefit from the death of overstory trees).
Once the true old-growth stage was reached, we observed two different combinations of radial growth patterns. Linear and low-ascending patterns were the most frequent in cluster 3, while low-ascending and high-ascending patterns were the most frequent in cluster 4. This implies differences between the secondary disturbance regime of these clusters. Martin et al. [28] highlighted that a combination of low-severity secondary disturbances (i.e., disturbances without a significant influence on the stand’s post-disturbance growth due to low overstory mortality, e.g., the fall of a single tree or a small group of trees because of windthrow) and moderate severity secondary disturbances (i.e., disturbances that significantly and positively influence post-disturbance stand growth due to moderate overstory mortality, e.g., the death of a large group of trees because of an insect outbreak) drive the dynamics within these studied true old-growth stands. Therefore, cluster 4 regrouped stands where trees had benefited from a recent and significant canopy opening (i.e., moderate severity secondary disturbance), as indicated by the significantly higher coarse woody debris volume observed for this cluster. In contrast, cluster 3 regrouped stands where radial increment changes were less striking, implying that these stands were driven by low-severity disturbances. Furthermore, boreal stands remain dynamic once the true old-growth stage is reached, alternating between canopy-opening and canopy-closure phases [21,28,89]. It is therefore likely that the trees defined by the high-ascending pattern observed in cluster 4 will quickly close the canopy due to their significant growth increments. It is therefore conceivable that these trees will die earlier because of their higher growth rate, allowing new suppressed trees to reach the highest canopy layers progressively, thereby resulting in cluster 3. Hence, true old-growth structures would alternate between cluster 3 and 4 structures depending on the secondary disturbance regime in the absence of any stand-replacing disturbance (Figure 5). Interestingly, there were no significant structural differences between the two true old-growth stand clusters, except for a coarse woody debris volume; this similarity implies that they were structurally close in nature. However, only three sites constituted stand cluster 3, and this low sample size may explain these results.
Nevertheless, discriminating tree radial increments in specific radial growth patterns using k-means clustering provided an ecologically consistent and original perspective of forest dynamics within the eastern Canadian boreal old-growth stands and highlighted the diversity of the processes involved. Through this approach, it was possible to easily identify the various processes that drove the dynamics of these stands, which could all be grouped under the same denomination of "old-growth forest," as well as their impact on individual tree growth. In comparison to previous methods for the classification of growth patterns [43,44,51], the use of k-means clustering is less subjective, faster, and does not requires complementary indicators. The consistency of our results with those from research in other regions or biomes also underscores the potential of the methodology used in this study. In this way, k-means clustering could easily be applied to much larger dendrochronological datasets than the one used in this study, covering significantly larger areas. The knowledge obtained from the algorithmic classification of growth patterns is therefore of interest to both ecologists and managers, facilitating the understanding of the functioning of ecosystems recognized for their complexity.

4.3. Implications for Management

Partial and stem-selection cuts have been strongly promoted over the past decade as a means of conserving old-growth forest attributes and dynamics within the boreal landscapes of eastern Canada [37,38,39].
Our results provided different insights on how these treatments can mimic the dynamics observed in the primary forests of this region. For instance, at the true old-growth stage, moderate-severity disturbances can significantly increase the growth of the understory (Cluster 4). In this cluster, around one-quarter of the stems had the high-ascending pattern, implying a significant increase in wood volume in a relatively short time. The age of these trees was generally close to 90 years, with a high growth rate concentrated in the second half of their life. This implies that treatments that effectively imitate moderate-severity disturbances may favor fast-growing trees in true old-growth forests. These trees could then potentially be harvested in the next rotation. CLASS (careful logging around small merchantable stems) is an example of a treatment that has the potential to imitate this dynamic [52]. However, it can be challenging to imitate moderate-severity disturbances. For example, a high logging rate may cause a significant post-harvest mortality, which cancels its benefits [41,42]. It may also increase the competition for tree regeneration with shrubs [41]. On the other hand, silvicultural treatments that aim to imitate a dynamic driven by low-severity disturbances in old-growth forests may limit post-harvest mortality. This could compensate for the smaller increase in growth following disturbance of these stands. Moreover, this strategy could be of interest if forest managers aim to favor the superior wood quality of slow-growing trees rather than solely maximizing wood volume [53,90].
Our results also indicated that the most productive growth patterns in even-aged stands (i.e., high-ascending and bell) are the first to die after the canopy break-up. Prioritizing the harvest of these stems may speed up the transition from even-aged to old-growth structures. When a stand age is under 100 years in the boreal forests of eastern Canada, even overstory trees may significantly increase their growth after the partial harvest of the canopy [39]. In this way, the use of close-to-nature silviculture in mature even-aged stands could enhance both the canopy and regeneration growth. Therefore, by accelerating the transition from the even-aged to the old-growth stage, partial or stem-selection cuts could be an efficient solution to increase the area of forest with a complex structure. This could contribute to restoring boreal landscapes that have been altered by excessive logging of old-growth forests through clearcutting [4,31,91].

5. Conclusions

We grouped the radial growth increments of coniferous trees sampled from stands in the boreal forest of eastern Canada into six dominant patterns that were specific to stand disturbance regimes and species ecology. These results provided insights regarding the radial growth dynamics of trees during and after the transition toward old-growth stages. Recent studies have highlighted the complex dynamics of forest succession within the eastern Canadian boreal forest [21,22,23]; however, the processes explaining these results were poorly known. The radial growth patterns identified in this study could serve to develop forest dynamics models that provide a better description of fine-structural changes in boreal old-growth forests. Overall, the identified radial growth patterns were relatively simple, but their frequencies varied significantly depending on the successional stage and the dominant secondary disturbance regime. This underlines the idea that what is normally called an "old-growth forest" actually embraces a wide variety of structures and disturbance histories. If forest managers wish to mimic the dynamics of old-growth forests, they should be fully aware of the specific type of old-growth forest that they are targeting or trying to emulate before applying the silvicultural treatment. However, it is likely that the different dynamics of old-growth forests highlighted in the study are general trends, with potential sub-trends that should be determined through further research. Similarly, the stands sampled in this study were restricted to black-spruce-dominated old-growth stands, although these stands were sometimes mixed with balsam fir. To obtain a more developed picture for boreal stand dynamics in this region, complementary research should therefore be extended to new sites that include other boreal stand types and successional stages found in eastern Canada, e.g., balsam-fir-dominated true old-growth forests, broadleaf-species-dominated stands, and productive transitional old-growth forests. Moreover, conducting similar studies in other regions, both boreal and temperate, could highlight the specificities and common features in stand dynamics during both the transitional old-growth process and once the true old-growth stages are reached.

Supplementary Materials

The following are available online at https://www.mdpi.com/1999-4907/11/3/252/s1, Figure S1: Examples of raw tree ring-width chronologies (left) and of the corresponding 20-segment chronologies (right) for different forms of radial growth patterns observed for the sampled trees., Table S1: Structural and abiotic attributes of the sampled sites, Table S2: Number of trees sampled per site and species, Table S3: Growth pattern frequencies, structural attributes, successional attributes, and environmental attributes of the site constituting the stand cluster rejected for the analysis., Table S4: Jack pine absolute and relative of frequencies by species and growth pattern.

Author Contributions

Conceptualization, M.M.; methodology, M.M.; software, M.M.; validation C.K., N.J.F., and H.M.; formal analysis, M.M.; investigation, M.M.; resources, H.M.; data curation, M.M.; writing—original draft preparation, M.M.; writing—review and editing, M.M., C.K., N.J.F., and H.M.; visualization, M.M.; supervision, C.K., N.J.F., and H.M.; project administration, H.M.; funding acquisition, H.M. All authors have read and agreed to the published version of the manuscript.

Funding

This research was funded by the Fonds Québécois de la Recherche sur la Nature et les Technologies (FQRNT), Ministère des Forêts de la Faune et des Parcs du Québec, and the Natural Sciences and Engineering Research Council of Canada (NSERC)—Université du Québec à Chicoutimi (UQAC) NSERC Industrial Research Chair “Industrial Research Chair on Black Spruce Growth and the Influence of Spruce Budworm on Landscape Variability in Boreal Forests.”

Acknowledgments

We thank Marie-Josée Tremblay, Audrey Bédard, Alison Gagnon, Jean-Guy Girard, Émilie Chouinard, Miguel Montoro Girona, Anne-Élizabeth Harvey, Aurélie Cuvelier, and Évelyn Beliën for their help during field sampling and tree-ring analysis. Yan Boucher and Pierre Grondin from the Ministry of Forests, Wildlife and Parks (MWFP), Québec, Canada, shared their data collected from the study territory. We also thank Valentina Buttò for her help with several coding steps in R and for providing watercolors for our schematic figures. Finally, we thank the two anonymous reviewers for their helpful comments that greatly improved the quality of the manuscript.

Conflicts of Interest

The authors declare no conflict of interest.

References

  1. FAO. Food and Agriculture Organization of the United Nations. Global Forest Resources Assessment Progress towards Sustainable Forest Management; FAO: Rome, Italy, 2006. [Google Scholar]
  2. Watson, J.E.M.; Evans, T.; Venter, O.; Williams, B.; Tulloch, A.; Stewart, C.; Thompson, I.; Ray, J.C.; Murray, K.; Salazar, A.; et al. The exceptional value of intact forest ecosystems. Nat. Ecol. Evol. 2018, 2, 599–610. [Google Scholar] [CrossRef] [PubMed]
  3. Sarr, D.A.; Puettmann, K.J. Forest management, restoration, and designer ecosystems: Integrating strategies for a crowded planet. Ecoscience 2008, 15, 17–26. [Google Scholar] [CrossRef]
  4. Halme, P.; Allen, K.A.; Auniņš, A.; Bradshaw, R.H.W.; Brumelis, G.; Čada, V.; Clear, J.L.; Eriksson, A.M.; Hannon, G.; Hyvärinen, E.; et al. Challenges of ecological restoration: Lessons from forests in northern Europe. Biol. Conserv. 2013, 167, 248–256. [Google Scholar] [CrossRef]
  5. Kneeshaw, D.D.; Burton, P.J.; De Grandpré, L.; Gauthier, S.; Boulanger, Y. Is Management or Conservation of Old Growth Possible in North American Boreal Forests? In Ecology and Recovery of Eastern Old-Growth Forests; Barton, A.M., Keeton, W.S., Eds.; Island Press: Washington, DC, USA, 2018; pp. 139–157. [Google Scholar]
  6. Tikkanen, O.P.; Martikainen, P.; Hyvarinen, E.; Junninen, K.; Kouki, J. Red-listed boreal forest species of Finland: Associations with forest structure, tree species, and decaying wood. Ann. Zool. Fenn. 2006, 43, 373–383. [Google Scholar]
  7. Schmiegelow, F.K.A.; Monkkonen, M. Habitat Loss and Fragmentation in Dynamic Landscapes: Avian Perspectives From the Boreal Forest. Ecol. Appl. 2002, 12, 375–389. [Google Scholar]
  8. Jonsson, B.G.; Siitonen, J. Dead wood and sustainable forest management. In Biodiversity in Dead Wood; Stokland, J.N., Siitonen, J., Jonsson, B.G., Eds.; Cambridge University Press: New York, NY, USA, 2012; pp. 303–337. [Google Scholar]
  9. Maser, C.; Sedell, J.R. From the Forest to the Sea: The Ecology of Wood in Streams, Rivers, Estuaries and Oceans; St. Lucie Press: Delray Beach, FL, USA, 1994. [Google Scholar]
  10. Gauthier, S.; Bernier, P.; Kuuluvainen, T.; Shvidenko, A.Z.; Schepaschenko, D.G. Boreal forest health and global change. Science 2015, 349, 819–822. [Google Scholar] [CrossRef]
  11. Blumroeder, J.S.; Burova, N.; Winter, S.; Goroncy, A.; Hobson, P.R.; Shegolev, A.; Dobrynin, D.; Amosova, I.; Ilina, O.; Parinova, T.; et al. Ecological effects of clearcutting practices in a boreal forest (Arkhangelsk Region, Russian Federation) both with and without FSC certification. Ecol. Indic. 2019, 106, 105461. [Google Scholar] [CrossRef]
  12. Kuuluvainen, T. Natural variability of forests as a reference for restoring and managing biological diversity in boreal Fennoscandia. Silva Fenn. 2002, 36, 97–125. [Google Scholar] [CrossRef] [Green Version]
  13. Gauthier, S.; Vaillancourt, M.-A.; Leduc, A.; De Grandpré, L.; Kneeshaw, D.D.; Morin, H.; Drapeau, P.; Bergeron, Y. Ecosystem Management in the Boreal Forest; Presses de l’Université du Québec: Québec, QC, Canada, 2009. [Google Scholar]
  14. Vanha-Majamaa, I.; Lilja, S.; Ryömä, R.; Kotiaho, J.S.; Laaka-Lindberg, S.; Lindberg, H.; Puttonen, P.; Tamminen, P.; Toivanen, T.; Kuuluvainen, T. Rehabilitating boreal forest structure and species composition in Finland through logging, dead wood creation and fire: The EVO experiment. For. Ecol. Manag. 2007, 250, 77–88. [Google Scholar] [CrossRef]
  15. Kuuluvainen, T. Forest Management and Biodiversity Conservation Based on Natural Ecosystem Dynamics in Northern Europe: The Complexity Challenge. AMBIO 2009, 38, 309–315. [Google Scholar] [CrossRef]
  16. Kuuluvainen, T.; Aakala, T. Natural Forest Dynamics in Boreal Fennoscandia: A Review and Classification. Silva Fenn. 2011, 45, 823841. [Google Scholar] [CrossRef] [Green Version]
  17. Lorimer, C.G.; Halpin, C.R. Classification and dynamics of developmental stages in late-successional temperate forests. For. Ecol. Manag. 2014, 334, 344–357. [Google Scholar] [CrossRef]
  18. Reilly, M.J.; Spies, T.A.; Peters, D.P.C. Regional variation in stand structure and development in forests of Oregon, Washington, and inland Northern California. Ecosphere 2015, 6, 1–27. [Google Scholar] [CrossRef] [Green Version]
  19. Bergeron, Y.; Harper, K.A. Old-Growth Forests in the Canadian Boreal: The Exception Rather than the Rule? In Old-Growth Forests: Function, Fate and Value; Wirth, C., Gleixner, G., Heimann, M., Eds.; Springer: New York, NY, USA, 2009; pp. 285–300. [Google Scholar]
  20. Kneeshaw, D.D.; Bergeron, Y.; Kuuluvainen, T. Forest Ecosystem Structure and Disturbance Dynamics across the Circumboreal Forest. In Handbook of Biogeography; Millington, A., Ed.; SAGE: London, UK, 2011; pp. 261–278. [Google Scholar]
  21. Martin, M.; Fenton, N.J.; Morin, H. Structural diversity and dynamics of boreal old-growth forests case study in Eastern Canada. For. Ecol. Manag. 2018, 422, 125–136. [Google Scholar] [CrossRef]
  22. Portier, J.; Gauthier, S.; Cyr, G.; Bergeron, Y. Does time since fire drive live aboveground biomass and stand structure in low fire activity boreal forests? Impacts on their management. J. Environ. Manag. 2018, 225, 346–355. [Google Scholar] [CrossRef]
  23. Moussaoui, L.; Leduc, A.; Fenton, N.J.; Lafleur, B.; Bergeron, Y. Changes in forest structure along a chronosequence in the black spruce boreal forest: Identifying structures to be reproduced through silvicultural practices. Ecol. Indic. 2019, 97, 89–99. [Google Scholar] [CrossRef]
  24. Oliver, C.D.; Larson, B.C. Forest Stand Dynamics, 4th ed.; John Wiley & Sons, Inc.: New York, NY, USA, 1996. [Google Scholar]
  25. Bergeron, Y.; Leduc, A.; Harvey, B.D.; Gauthier, S. Natural fire regime: A guide for sustainable management of the Canadian boreal forest. Silva Fenn. 2002, 36, 81–95. [Google Scholar] [CrossRef] [Green Version]
  26. De Grandpré, L.; Gauthier, S.; Allain, C.; Cyr, D.; Périgon, S.; Pham, A.T.; Boucher, D.; Morissette, J.; Reyes, G.; Aakala, T.; et al. Towards an Ecosystem Approach to Managing the Boreal Forest in the North Shore Region: Disturbance Regime and Natural Forest Dynamics. In Ecosystem Management in the Boreal Forest; Presses de l’Université du Québec: Québec, QC, Canada, 2009; pp. 229–255. [Google Scholar]
  27. De Grandpré, L.; Waldron, K.; Bouchard, M.; Gauthier, S.; Beaudet, M.; Ruel, J.C.; Hébert, C.; Kneeshaw, D.D. Incorporating insect and wind disturbances in a natural disturbance-based management framework for the boreal forest. Forests 2018, 9, 20. [Google Scholar] [CrossRef] [Green Version]
  28. Martin, M.; Morin, H.; Fenton, N.J. Secondary disturbances of low and moderate severity drive the dynamics of eastern Canadian boreal old-growth forests. Ann. For. Sci. 2019, 76, 1–16. [Google Scholar] [CrossRef]
  29. Bouchard, M.; Pothier, D. Long-term influence of fire and harvesting on boreal forest age structure and forest composition in eastern Québec. For. Ecol. Manag. 2011, 261, 811–820. [Google Scholar] [CrossRef]
  30. Boucher, Y.; Perrault-Hébert, M.; Fournier, R.; Drapeau, P.; Auger, I. Cumulative patterns of logging and fire (1940–2009): Consequences on the structure of the eastern Canadian boreal forest. Landsc. Ecol. 2017, 32, 361–375. [Google Scholar] [CrossRef]
  31. Martin, M.; Boucher, Y.; Fenton, N.J.; Marchand, P.; Morin, H. Forest management has reduced the structural diversity of residual boreal old-growth forest landscapes in Eastern Canada. For. Ecol. Manag. 2020, 458, 1–10. [Google Scholar] [CrossRef]
  32. Bergeron, Y.; Gauthier, S.; Kafka, V.; Lefort, P.; Lesieur, D. Natural fire frequency for the eastern Canadian boreal forest: Consequences for sustainable forestry. Can. J. For. Res. 2001, 31, 384–391. [Google Scholar] [CrossRef]
  33. Garet, J.; Pothier, D.; Bouchard, M. Predicting the long-term yield trajectory of black spruce stands using time since fire. For. Ecol. Manag. 2009, 257, 2189–2197. [Google Scholar] [CrossRef]
  34. Cyr, D.; Gauthier, S.; Bergeron, Y.; Carcaillet, C. Forest management is driving the eastern North American boreal forest outside its natural range of variability. Front. Ecol. Environ. 2009, 7, 519–524. [Google Scholar] [CrossRef]
  35. [MFFP] Ministère des Forêts de la Faune et des Parcs. Intégration des Enjeux Écologiques Dans les Plans D’aménagement Forestier Intégré de 2018–2023, Cahier 2.1—Enjeux Liés à la Structure d’âge des Forêts; Forestiers, D. de L’aménagement et de L’environnement, Ed.; Gouvernement du Québec: Québec, QC, Canada, 2016. (In Franch)
  36. Bauhus, J.; Puettmann, K.; Messier, C. Silviculture for old-growth attributes. For. Ecol. Manag. 2009, 258, 525–537. [Google Scholar] [CrossRef] [Green Version]
  37. Fenton, N.J.; Imbeau, L.; Work, T.; Jacobs, J.; Bescond, H.; Drapeau, P.; Bergeron, Y. Lessons learned from 12 years of ecological research on partial cuts in black spruce forests of northwestern Québec. For. Chron. 2014, 89, 350–359. [Google Scholar] [CrossRef] [Green Version]
  38. Ruel, J.-C.; Fortin, D.; Pothier, D. Partial cutting in old-growth boreal stands: An integrated experiment. For. Chron. 2013, 89, 360–369. [Google Scholar] [CrossRef] [Green Version]
  39. Montoro Girona, M.; Morin, H.; Lussier, J.; Walsh, D. Radial growth response of black spruce stands ten years after experimental shelterwoods and seed-tree cuttings in boreal forest. Forests 2016, 7, 240. [Google Scholar] [CrossRef] [Green Version]
  40. Kneeshaw, D.D.; Burton, P.J.; De Grandpré, L.; Gauthier, S.; Boulanger, Y. Is management or conservation of old growth possible in North American boreal forests? Ecol. Recover. East. Old-Growth For. 2019, 8, 139–157. [Google Scholar]
  41. Bose, A.K.; Harvey, B.D.; Brais, S.; Beaudet, M.; Leduc, A. Constraints to partial cutting in the boreal forest of Canada in the context of natural disturbance-based management: A review. Forestry 2014, 87, 11–28. [Google Scholar] [CrossRef]
  42. Montoro Girona, M.; Morin, H.; Lussier, J.-M.; Ruel, J.-C. Post-cutting mortality following experimental silvicultural treatments in unmanaged boreal forest stands. Front. For. Glob. Chang. 2019, 2, 4. [Google Scholar] [CrossRef] [Green Version]
  43. Lorimer, C.G.; Frelich, L.E. A methodology for estimating canopy disturbance frequency and intensity in dense temperate forests. Can. J. For. Res. 1989, 19, 651–663. [Google Scholar] [CrossRef]
  44. Frelich, L.E. Forest Dynamics and Disturbance Regimes: Studies from Temperate Evergreen-Deciduous Forests; Cambridge University Press: Cambridge, UK, 2002. [Google Scholar]
  45. Bleicher, N. Four levels of patterns in tree-rings: An archaeological approach to dendroecology. Veg. Hist. Archaeobot. 2014, 23, 615–627. [Google Scholar] [CrossRef]
  46. Nowacki, G.J.; Abrams, M.D. Radial-Growth Averaging Criteria for Reconstruction Disturbance Histories from Presettlement-Origin Oaks. Ecol. Monogr. 1997, 67, 225–249. [Google Scholar] [CrossRef]
  47. Fraver, S.; White, A.S. Identifying growth releases in dendrochronological studies of forest disturbance. Can. J. For. Res. 2005, 35, 1648–1656. [Google Scholar] [CrossRef]
  48. Druckenbrod, D.L.; Pederson, N.; Rentch, J.; Cook, E.R. A comparison of times series approaches for dendroecological reconstructions of past canopy disturbance events. For. Ecol. Manag. 2013, 302, 23–33. [Google Scholar] [CrossRef] [Green Version]
  49. Moreau, G.; Achim, A.; Pothier, D. A dendrochronological reconstruction of sugar maple growth and mortality dynamics in partially cut northern hardwood forests. For. Ecol. Manag. 2019, 437, 17–26. [Google Scholar] [CrossRef]
  50. Di Filippo, A.; Biondi, F.; Piovesan, G.; Ziaco, E. Tree ring-based metrics for assessing old-growth forest naturalness. J. Appl. Ecol. 2017, 54, 737–749. [Google Scholar] [CrossRef]
  51. Niukkanen, L.; Kuuluvainen, T. Radial growth patterns of dominant trees in two old-growth forests in eastern Fennoscandia. J. For. Res. 2011, 16, 228–236. [Google Scholar] [CrossRef]
  52. Lemay, A.; Krause, C.; Achim, A.; Bégin, J. Growth and wood quality of black spruce and balsam fir following careful logging around small merchantable stems (CLASS) in the boreal forest of Quebec, Canada. Forestry 2018, 91, 271–282. [Google Scholar] [CrossRef] [Green Version]
  53. Pamerleau-couture, É.; Rossi, S.; Pothier, D.; Krause, C.; Krause, C. Wood properties of black spruce (Picea mariana (Mill) BSP) in relation to ring width and tree height in even- and uneven-aged boreal stands. Ann. For. Sci. 2019, 76, 43. [Google Scholar] [CrossRef] [Green Version]
  54. Wirth, C.; Messier, C.; Bergeron, Y.; Frank, D.; Fankhänel, A. Old-Growth Forest Definitions: A Pragmatic View. In Old-Growth Forests: Function, Fate and Value; Wirth, C., Gleixner, G., Heimann, M., Eds.; Springer: Berlin, Germany, 2009; pp. 11–34. [Google Scholar]
  55. Pesklevits, A.; Duinker, P.N.; Bush, P.G. Old-growth forests: Anatomy of a wicked problem. Forests 2011, 2, 343–356. [Google Scholar] [CrossRef] [Green Version]
  56. Franklin, J.F.; Spies, T.A.; Van Pelt, R.; Carey, A.B.; Thornburgh, D.A.; Berg, D.R.; Lindenmayer, D.B.; Harmon, M.E.; Shaw, D.C.; Bible, K.; et al. Disturbances and structural development of natural forest ecosystems with silvicultural implications, using Douglas-fir forests as an example. For. Ecol. Manag. 2002, 155, 399–423. [Google Scholar] [CrossRef]
  57. Halpin, C.R.; Lorimer, C.G. Trajectories and resilience of stand structure in response to variable disturbance severities in northern hardwoods. For. Ecol. Manag. 2016, 365, 69–82. [Google Scholar] [CrossRef]
  58. Kuuluvainen, T.; Wallenius, T.H.; Kauhanen, H.; Aakala, T.; Mikkola, K.; Demidova, N.; Ogibin, B. Episodic, patchy disturbances characterize an old-growth Picea abies dominated forest landscape in northeastern Europe. For. Ecol. Manag. 2014, 320, 96–103. [Google Scholar] [CrossRef]
  59. Khakimulina, T.; Fraver, S.; Drobyshev, I. Mixed-severity natural disturbance regime dominates in an old-growth Norway spruce forest of northwest Russia. J. Veg. Sci. 2016, 27, 400–413. [Google Scholar] [CrossRef] [Green Version]
  60. Trotsiuk, V.; Svoboda, M.; Janda, P.; Mikolas, M.; Bace, R.; Rejzek, J.; Samonil, P.; Chaskovskyy, O.; Korol, M.; Myklush, S. A mixed severity disturbance regime in the primary Picea abies (L.) Karst. forests of the Ukrainian Carpathians. For. Ecol. Manag. 2014, 334, 144–153. [Google Scholar] [CrossRef]
  61. Bače, R.; Schurman, J.S.; Brabec, M.; Čada, V.; Després, T.; Janda, P.; Lábusová, J.; Mikoláš, M.; Morrissey, R.C.; Mrhalová, H.; et al. Long-term responses of canopy–understorey interactions to disturbance severity in primary Picea abies forests. J. Veg. Sci. 2017, 28, 1128–1139. [Google Scholar] [CrossRef]
  62. Meigs, G.W.; Morrissey, R.C.; Bače, R.; Chaskovskyy, O.; Čada, V.; Després, T.; Donato, D.C.; Janda, P.; Lábusová, J.; Seedre, M.; et al. More ways than one: Mixed-severity disturbance regimes foster structural complexity via multiple developmental pathways. For. Ecol. Manag. 2017, 406, 410–426. [Google Scholar] [CrossRef]
  63. Burrascano, S.; Keeton, W.S.; Sabatini, F.M.; Blasi, C. Commonality and variability in the structural attributes of moist temperate old-growth forests: A global review. For. Ecol. Manag. 2013, 291, 458–479. [Google Scholar] [CrossRef]
  64. Oliver, C.D. Forest development in North America following major disturbances. For. Ecol. Manag. 1981, 3, 153–168. [Google Scholar] [CrossRef]
  65. Shorohova, E.; Kneeshaw, D.D.; Kuuluvainen, T.; Gauthier, S. Variability and dynamics of old-growth forests in the circumboreal zone: Implications for conservation, restoration and management. Silva Fenn. 2011, 45, 785–806. [Google Scholar] [CrossRef] [Green Version]
  66. Robitaille, A.; Saucier, J.-P. Paysages Régionaux du Québec Méridional; Les Publications du Québec: Montréal, QC, Canada, 1998. [Google Scholar]
  67. Couillard, P.-L.; Frégeau, M.; Payette, S.; Grondin, P.; Lavoie, M.; Laflamme, J. Dynamique et Variabilité Naturelle de la Pessière à Mousses au Nord de la Région du Lac-Saint-Jean; Presses de l’Université du Québec: Québec, QC, Canada, 2016. (In Franch) [Google Scholar]
  68. Martin, M.; Fenton, N.J.; Morin, H. Boreal old-growth forest structural diversity challenges aerial photographic survey accuracy. Can. J. For. Res. 2020, 50, 155–169. [Google Scholar] [CrossRef]
  69. Farr, T.G.; Rosen, P.A.; Caro, E.; Crippen, R.; Duren, R.; Hensley, S.; Kobrick, M.; Paller, M.; Rodriguez, E.; Roth, L.; et al. The Shuttle Radar Topography Mission. Rev. Geophys. 2007, 45, 33. [Google Scholar] [CrossRef] [Green Version]
  70. Uhlig, P.A.; Harris, G.; Craig, C.; Bowling, B.; Chambers, B.; Naylor, B.; Beemer, G. Old-Growth Forest Definitions for Ontario; Ontario Ministry of Natural Resources, Ed.; Queen’s Printer for Ontario: Toronto, ON, Canada, 2001. [Google Scholar]
  71. Gauthier, S.; Boucher, D.; Morissette, J.; De Grandpré, L. Fifty-seven years of composition change in the eastern boreal forest of Canada. J. Veg. Sci. 2010, 21, 772–785. [Google Scholar] [CrossRef]
  72. Holmes, R.l. Computer-assisted quality control in tree-ring dating measurement. Tree-Ring Bull. 1983, 69–78. [Google Scholar]
  73. Kneeshaw, D.D.; Gauthier, S. Old growth in the boreal forest: A dynamic perspective at the stand and landscape level. Environ. Rev. 2003, 11, S99–S114. [Google Scholar] [CrossRef]
  74. Hartigan, J.A.; Wong, M.A. Algorithm AS 136: A k-means clustering algorithm. J. R. Stat. Soc. 1979, 28, 100–108. [Google Scholar] [CrossRef]
  75. Dolnicar, S. Analyzing destination images: A perceptual charting approach. J. Travel Tour. Mark. 1999, 8, 43–57. [Google Scholar] [CrossRef] [Green Version]
  76. Williams, L.J.; Abdi, H. Fisher’s Least Significant Difference Test. In Encyclopedia of Research Design; Salkind, N., Ed.; SAGE: Thousand Oaks, CA, USA, 2010; pp. 1–6. [Google Scholar]
  77. R Core Team. R: A language and environment for statistical computing. Adv. Microbiol. 2019, 9, 8. [Google Scholar]
  78. Oksanen, J.; Blanchet, G.; Friendly, M.; Kindt, R.; Legendre, P.; MCGlinn, D.; Minchin, P.R.B.; O’Hara, B.; Simpson, G.L.; Solymos, P.; et al. vegan: Community ecology package. J. Geosci. Environ. Protect. 2018, 5, 11. [Google Scholar]
  79. De Mendiburu, F. Agricolae: Statistical Procedures for Agricultural Research. R Package Version 1.2-2017. Available online: https://CRAN.R-project.org/package=agricolae (accessed on 22 January 2020).
  80. Rossi, S.; Tremblay, M.J.; Morin, H.; Savard, G. Growth and productivity of black spruce in even- and uneven-aged stands at the limit of the closed boreal forest. For. Ecol. Manag. 2009, 258, 2153–2161. [Google Scholar] [CrossRef]
  81. Tremblay, M.-J.; Rossi, S.; Morin, H. Growth dynamics of black spruce in stands located between the 51st and 52nd parallels in the boreal forest of Quebec, Canada. Can. J. For. Res. 2011, 41, 1769–1778. [Google Scholar] [CrossRef]
  82. Morin, H. Dynamics of balsam fir in relation to spruce budworm outbreaks in the Boreal Zone of Quebec. Can. J. For. Res. 1994, 24, 730–741. [Google Scholar] [CrossRef]
  83. Harvey, B.D.; Leduc, A.; Gauthier, S.; Bergeron, Y. Stand-landscape integration in natural disturbance-based management of the southern boreal forest. For. Ecol. Manag. 2002, 155, 369–385. [Google Scholar] [CrossRef]
  84. Firm, D.; Nagel, T.A.; Diaci, J. Disturbance history and dynamics of an old-growth mixed species mountain forest in the Slovenian Alps. For. Ecol. Manag. 2009, 257, 1893–1901. [Google Scholar] [CrossRef]
  85. Dang, H.; Zhang, K.; Zhang, Y.; Jiang, M.; Zhang, Q. Disturbance dynamics and history of an old-growth subalpine fir (Abies fargesii) forest in central China. Plant Ecol. 2014, 215, 1111–1121. [Google Scholar] [CrossRef]
  86. Trotsiuk, V.; Svoboda, M.; Weber, P.; Pederson, N.; Klesse, S.; Janda, P.; Martin-Benito, D.; Mikolas, M.; Seedre, M.; Bace, R.; et al. The legacy of disturbance on individual tree and stand-level aboveground biomass accumulation and stocks in primary mountain Picea abies forests. For. Ecol. Manag. 2016, 373, 108–115. [Google Scholar] [CrossRef] [Green Version]
  87. Robichaud, E.; Methven, I.R. The effect of site quality on the timing of stand breakup, tree longevity, and the maximum attainable height of black spruce. Can. J. For. Res. 1993, 1514–1519. [Google Scholar] [CrossRef]
  88. Larson, D.W. The paradox of great longevity in a short-lived tree species. Exp. Gerontol. 2001, 36, 651–673. [Google Scholar] [CrossRef]
  89. Pham, A.T.; De Grandpré, L.; Gauthier, S.; Bergeron, Y. Gap dynamics and replacement patterns in gaps of the northeastern boreal forest of Quebec. Can. J. For. Res. 2004, 34, 353–364. [Google Scholar] [CrossRef]
  90. Le Goff, H.; De Grandpré, L.; Kneeshaw, D.D.; Bernier, P. L’aménagement durable des vieilles forêts boréales: Mythes, pistes de solutions et défis. For. Chron. 2010, 86, 63–69. [Google Scholar] [CrossRef] [Green Version]
  91. Kuuluvainen, T.; Gauthier, S. Young and old forest in the boreal: Critical stages of ecosystem dynamics and management under global change. For. Ecosyst. 2018, 5, 26. [Google Scholar] [CrossRef]
Figure 1. Location of the sampled sites in the study territory. The insert map indicates the localization of the study territory in Canada. The topographic raster came from the data of the Shuttle Radar Topography Mission [69].
Forests 11 00252 g001
Figure 2. Scatterplots of the growth patterns identified using a k-means cluster algorithm. Gray dots represent the values of each segment of the 20-segment series of the trees constituting the clusters. We obtained black lines using loess smoothing of the data with a 50% span. “n” indicates the number of sampled trees per cluster.
Forests 11 00252 g002
Figure 3. Scatterplot of the studied trees based on their age, cumulative growth, growth pattern, and mean tree-ring width.
Forests 11 00252 g003
Figure 4. Boxplots of the frequency of growth patterns in the four stand clusters (SCs) identified using a k-means cluster algorithm. OG: old growth. “n” indicates the number of surveyed sites per SC.
Forests 11 00252 g004
Figure 5. Conceptual model of changes in (A) forest structure, (B) growth pattern forms, and (C) growth pattern frequency during and after the transition toward the old-growth stages, depending on forest succession and disturbance dynamics. Water paintings by Valentina Buttò.
Forests 11 00252 g005
Table 1. Absolute and relative frequency of black spruce and balsam fir growth patterns. χ2: chi-square value, df: degrees of freedom.
Growth PatternSpeciesTotal
Black SpruceBalsam Fir
High-descending 26228
4.2%1.8%3.8%
Low-descending12816144
20.5%14%19.5%
Bell47350
7.5%2.6%6.8%
Linear24238280
38.8%33.3%38%
Low-ascending15154205
24.2%47.4%27.8%
High-ascending29130
4.7%0.9%4.1%
Total623114737
100%100%100%
χ2 = 29.688, df = 5, Cramer’s V = 0.201, Fisher’s p < 0.001.
Table 2. Mean and standard error of the growth attributes for each growth pattern.
Growth AttributeHigh-Descending
(n = 32)
Low-Descending
(n = 159)
Bell
(n = 50)
Linear
(n = 280)
Low-Ascending
(n = 205)
High-Ascending
(n = 30)
Tree mean ring width (mm)1.29 ± 0.28 a0.64 ± 0.13 b1.15 ± 0.22 a0.33 ± 0.08 d0.59 ± 0.11 c1.04 ± 0.17 a
Ring width standard deviation (mm·year−1)0.72 ± 0.2 a0.33 ± 0.11 c0.49 ± 0.15 b0.16 ± 0.05 d0.33 ± 0.11 c0.86 ± 0.23 a
Ring width 5th percentile (mm·year−1)0.45 ± 0.25 a0.22 ± 0.12 b0.43 ± 0.19 a0.13 ± 0.05 d0.19 ± 0.09 c0.16 ± 0.07 c
Ring width 95th percentile (mm·year−1)2.59 ± 0.57 a1.24 ± 0.3 c1.97 ± 0.44 b0.64 ± 0.17 d1.21 ± 0.3 c2.64 ± 0.64 a
Age (years)89.1 ± 10.9 d116 ± 34.9 c106 ± 35.2 d167 ± 44.5 a134 ± 47.6 b91.2 ± 36.8 d
Cumulative radial growth (cm)22.8 ± 5.12 a14.7 ± 4.2 c23.6 ± 6.37 a11.1 ± 3.36 d15.6 ± 5.53 c19 ± 8.63 b
Different letters indicate significant differences between growth patterns at a p-value of ≤ 0.05. “n” indicates the number of sampled trees per cluster.
Table 3. Mean and standard error of the structural, successional, and environmental attributes for each cluster.
TypeAttributeCluster 1
(n = 4)
Cluster 2
(n = 6)
Cluster 3
(n = 7)
Cluster 4
(n = 3)
StructuralMerchantable tree density (n·ha−1)1194 ± 314 a688 ± 378 a904 ± 331 a833 ± 151 a
Basal area (m2 ha−1)27.3 ± 9.71 a11.2 ± 7.1 b18.1 ± 8.31 a,b16.6 ± 1.7 a,b
Sapling density (n·ha−1)1238 ± 1359 a2071 ± 1384 a1961 ± 842 a4183 ± 3790 a
Maximum height (m)15.8 ± 2.78 b15.7 ± 4.34 a,b19.5 ± 2.82 a,b20.6 ± 2.57 a
Balsam fir proportion (%)13.1 ± 18.7 b,c0.26 ± 0.64 c16.4 ± 28.5 a,b32.3 ± 16.7 a
Coarse woody debris volume (m3·ha−1)16 ± 14.2 c24.1 ± 20.5 c54.8 ± 26.5 b146 ± 46.8 a
SuccessionalMin. time since the last fire (year)106 ± 29.3 c191 ± 54.7 b259 ± 28.2 a179 ± 43.2 b,c
Cohort basal area proportion0.13 ± 0.12 b0.47 ± 0.4 a,b0.8 ± 0.35 a0.82 ± 0.3 a
EnvironmentalSlope (%)14 ± 14.7 a4 ± 4.05 a14.7 ± 6.66 a14.4 ± 11.7 a
Depth of the organic horizon (cm)20 ± 13.4 b42.2 ± 16.4 a29.4 ± 10.4 a,b27.3 ± 15.4 a,b
Different letters indicate significant differences between stand clusters at a p-value of ≤0.05. “n” indicates the number of surveyed stands per stand cluster.

