Communication

Can Soil Electrical Resistivity Measurements Aid the Identification of Forest Areas Prone to Windthrow Disturbance?

Department of Natural Environment, Faculty of Forestry, Technical University in Zvolen, 960 01 Zvolen, Slovakia
*
Author to whom correspondence should be addressed.
Forests 2020, 11(2), 234; https://doi.org/10.3390/f11020234
Submission received: 17 January 2020 / Revised: 13 February 2020 / Accepted: 17 February 2020 / Published: 20 February 2020
(This article belongs to the Section Forest Ecology and Management)

Abstract

:
This study investigates how certain forest soil properties influence the propensity of beech forests to windthrow disturbances. The field measurements of soil electrical resistivity were carried out in an old-growth natural beech forest where the soil has developed from Cainozoic sedimentary rock with mudstone–claystone stratigraphy. In 2014, the forest was hit by a severe windstorm, and dispersed windthrow occurred at certain plots. Apparent electrical resistivity measurements were performed to investigate whether some soil properties could influence the forest trees’ predisposition to windthrow. The increases in the clay content and soil bulk density below 30 cm were associated with weathered claystone and mudstone, which created a physiological barrier for deeper root penetration. The result of the χ 2 test suggested that the windthrown spots were not distributed evenly over the entire study area. They were mainly concentrated over approximately 50% of the area, and their positions coincided with low resistivity values, indicating low soil skeleton content, high clay content and soil moisture. Therefore, electrical resistivity tomography could be considered a useful predictive tool for reducing the risk of natural disturbances by preventive forest management.

1. Introduction

Forests and their ecosystem services are threatened by increasing natural disturbances in many parts of the world, particularly in relation to climate change (e.g., [1,2,3]). One of the paramount reasons for forest disturbances and the resulting ecosystem and economic damage are strong winds and storms. Wind disturbances have been found to be dominant processes that influence the structure and canopy of old-growth temperate forest ecosystems [4,5]. Therefore, efforts have been made to predict their occurrence in space and time based on abiotic, biotic and anthropogenic factors, such as past land use, and thus enable forest managers to focus on precautionary measures, such as growing more wind-resistant tree mixtures or thinning practices in the most risk-prone areas [6].
Although bedrock and soil properties can influence the forest trees’ root growth and their stability prior to natural disturbances, not enough attention has been paid to variables influencing tree stability, such as root system architecture and the physical and hydrophysical properties of soil [7]. Besides, it is not known whether soil types or root system characteristics influence uprooting the most, because each parameter is dependent on the other. In addition, larger trees are more prone to wind mortality as opposed to subcanopy stems when intermediate wind disturbance has occurred (e.g., [8,9]).
Therefore, investigating the possible association between forests’ vulnerability to windthrow on the one hand and the mechanical and hydrophysical properties of soil on the other hand could cast a fresh light on new opportunities for preventive and climate-smart forest management. Noninvasive electrical resistivity methods are powerful and quick tools for the study of the hydrophysical properties of soil in areas affected by natural disturbances. Electrical resistivity tomography is a nondestructive geophysical method that allows measurements of the subsurface distribution of resistivity by using measurements on the soil surface. The measurement is based on the difference in resistivity of individual rock formations, soil layers, aquifers, etc. Studies of nondestructive soil properties based on geophysical measurements are still rarely used in ecological research, although they have been coming to the forefront in recent years, especially when studying soil properties in the root zone and the study of water movement in the vadose zone. Nondestructive geophysical study methods provide a complementary tool to traditional soil sampling methods and provide a comprehensive overview of soil properties in 2D and 3D space, and possibly over time, by using time-lapse measurements [10]. Monitoring of water movement, saturation and soil water potential at shallow depths in the vadose zone due to tree transpiration was used, for example, by Kurjak et al. [11], Nourtier et al. [12] and Carrière et al. [13]. Nondestructive geophysical methods (electrical resistivity tomography and georadar) in the study of root system distribution in the forest ecosystem were used, for example, by Rodríguez et al. [14]. In addition, the identification of clayey layers based on electrical measurement is rather straightforward due to the negative charge on the clay mineral surface. This negative charge causes very low resistivity between 0 and 100 Ohm·m [15].
In this study, we present measurements of soil and bedrock properties using the electrical resistivity method in light of their potential effect on forest trees’ stability. Despite the fact that electrical resistivity tomography is primarily a method developed and used in the exploration of deeper geological structures, its use in ecological research in recent years provides a prerequisite for its application even in the more shallow layers of soil near the surface. Therefore, the specific objective of the study was to explore opportunities for the application of electrical resistivity tomography (ERT) to identify the areas featuring a high risk of windthrow disturbance according to geological stratigraphy and soil properties. This was done by studying the association between soil electrical resistivity and the incidence of actual windthrow disturbance in a natural old-growth European beech forest affected by windthrow disturbance.

2. Materials and Methods

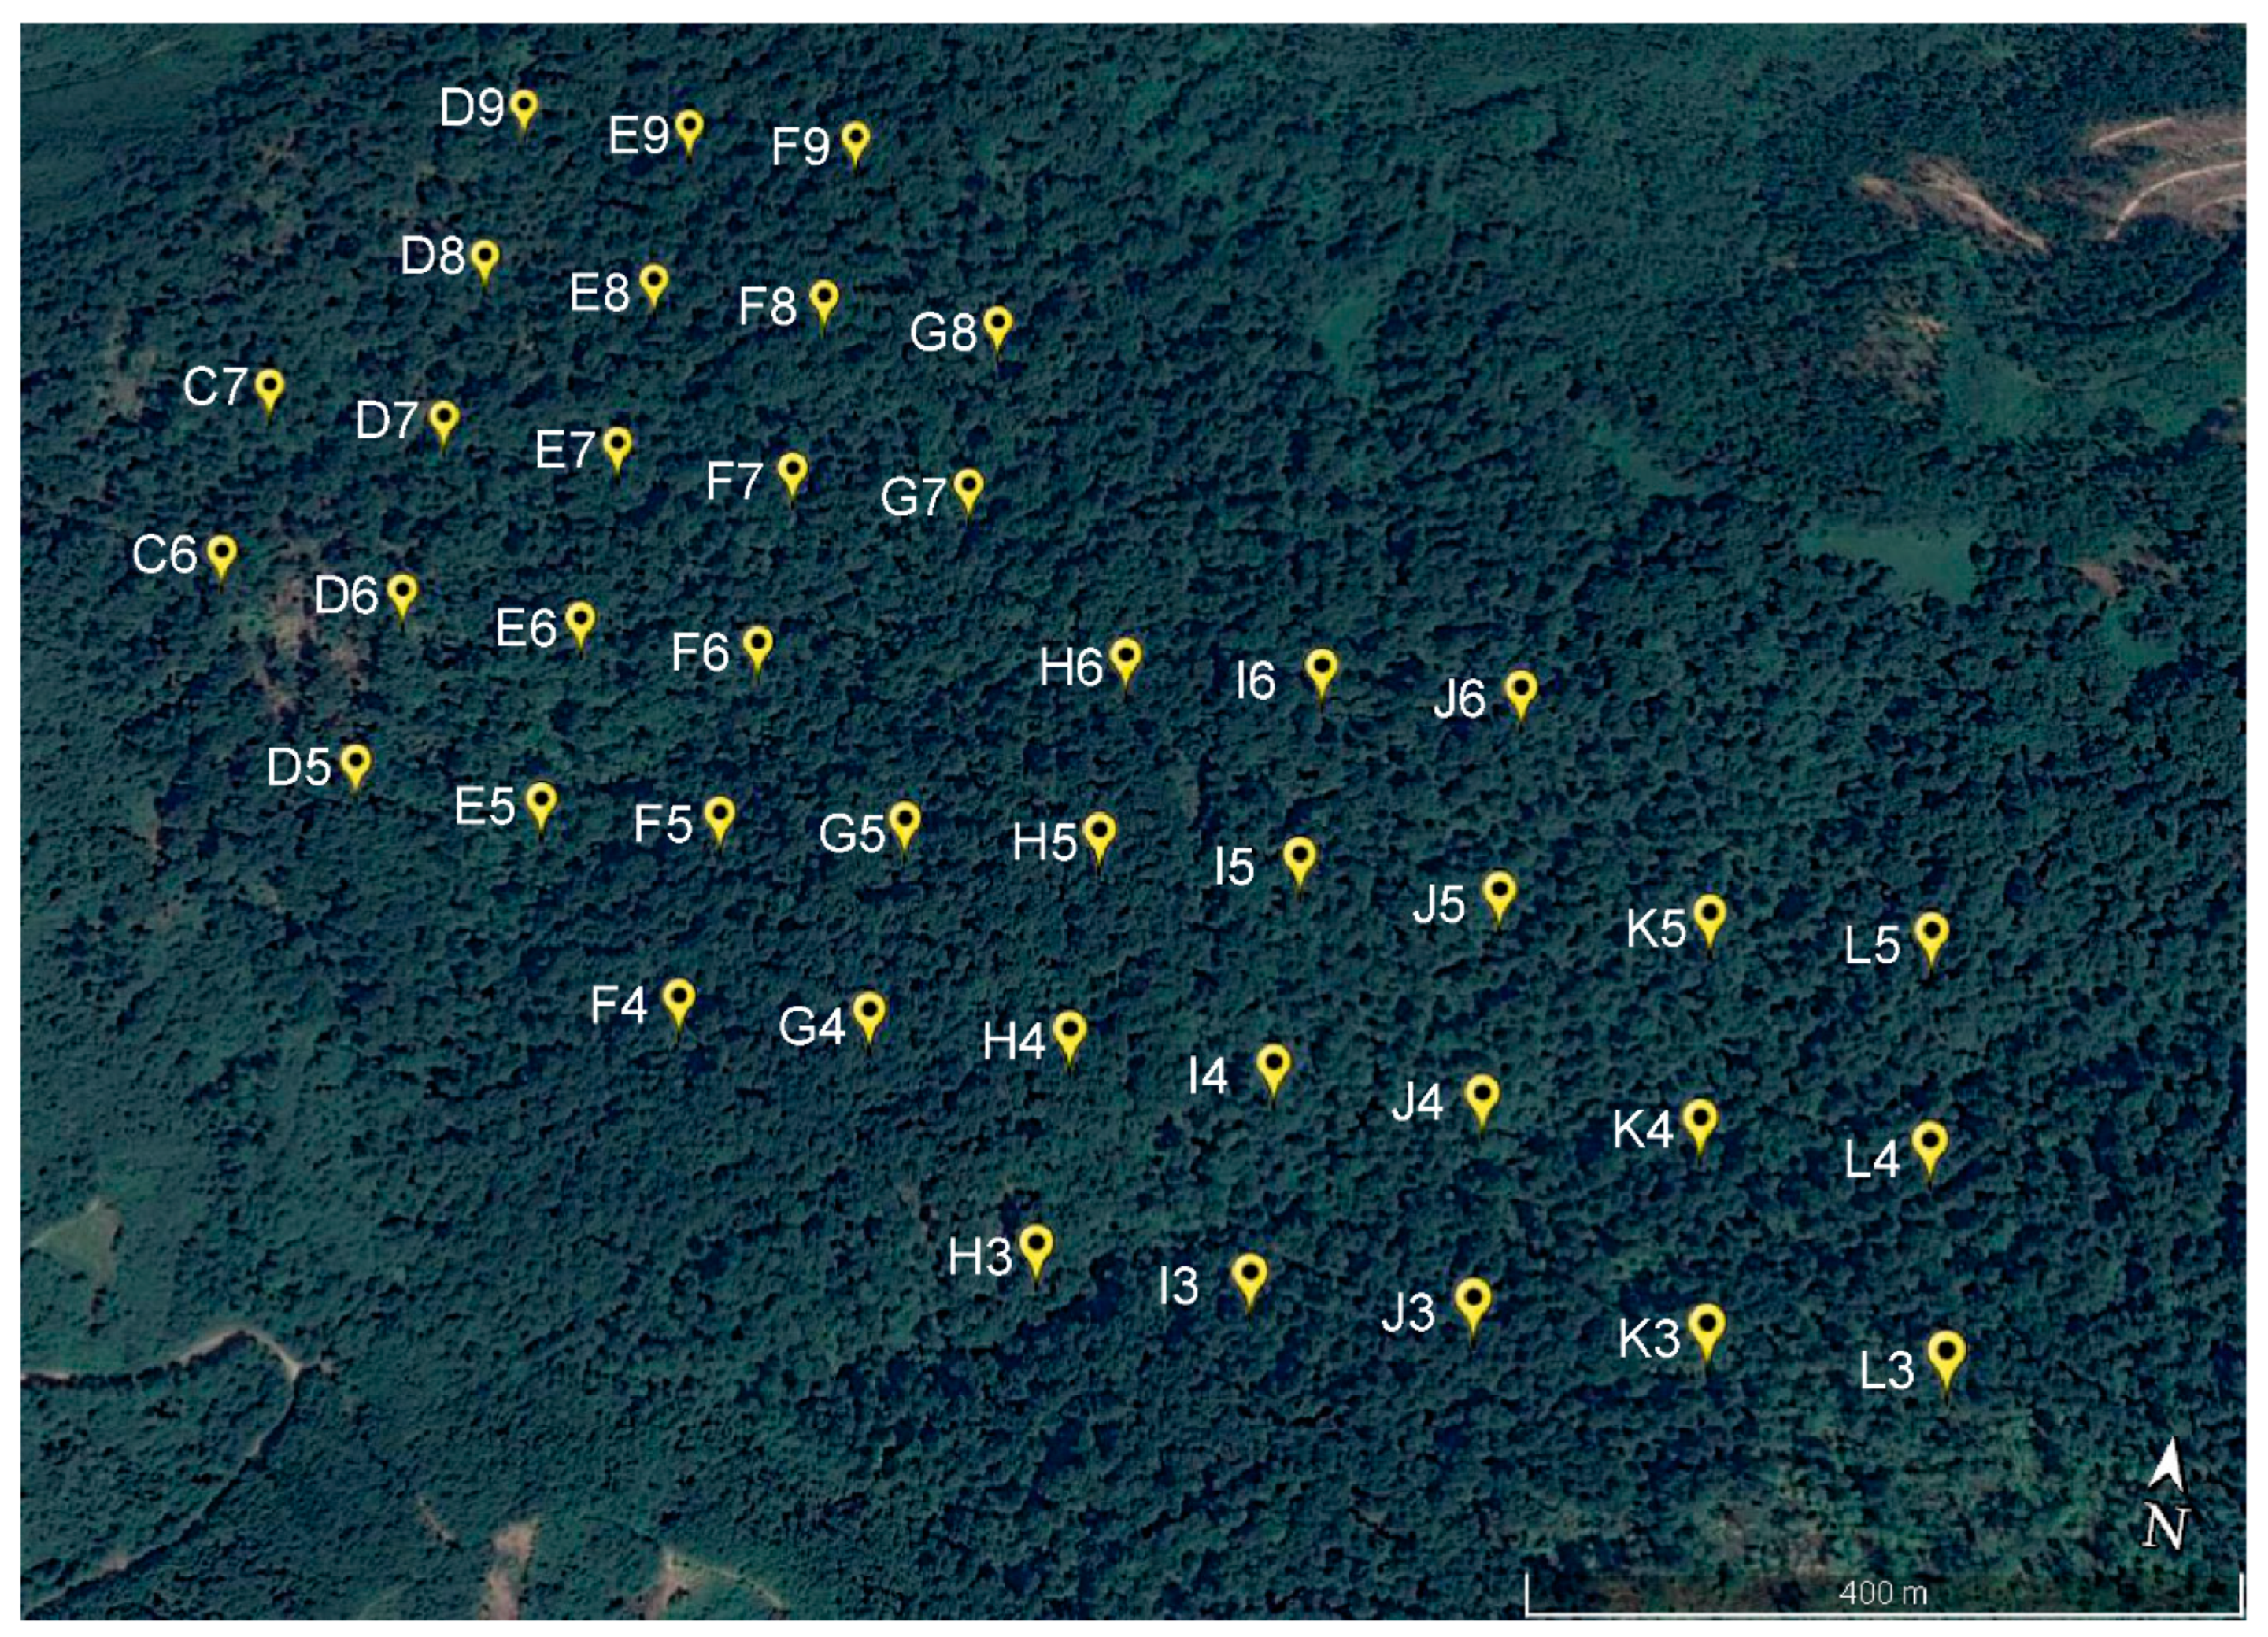
2.1. Site Description

The experimental site was situated in National Preserve (NP) Havešová (Bukovské vrchy Mountains, 49°00′35″ N 22°20′10″ E). Since 2007, NP Havešová has been included on the UNESCO World Nature Heritage list [16]. NP Havešová covers 171.32 ha and is situated between 440 and 741 m above sea level. The forest cover is mainly a 170-year-old European beech forest (Fagus sylvatica L.) with an admixture of sycamore (Acer pseudoplatanus L.), ash (Fraxinus excelsior L.) and elm (Ulmus glabra Huds.). The study site is in the middle warm to middle cool and very humid regions. The mean annual air temperature is 6.0–6.5 °C, and annual precipitation ranges between 800 and 850 mm. The main soil type in this study area is Dystric Cambisol developed on Paleocene sandstone and mudstone (Table 1). The average slope inclination is 15°.
On 14 and 15 May 2014, the territory of the Slovak Republic (mainly the eastern part) was affected by a strong windstorm accompanied by intense rainfall. Intense rainfall also occurred in the days before the windstorm with a total amount of approximately 70 mm. The maximum daily rainfall intensity near the study area, measured on 11 May 2014, was 49.5 mm. The maximum wind speed during the wind storm was up to 100 km·h−1 [17]. Strong wind combined with near-saturated soil caused a forest disaster with a total of more than 4 million m3 of windfall trees volume, mainly broadleaf tree species [18].

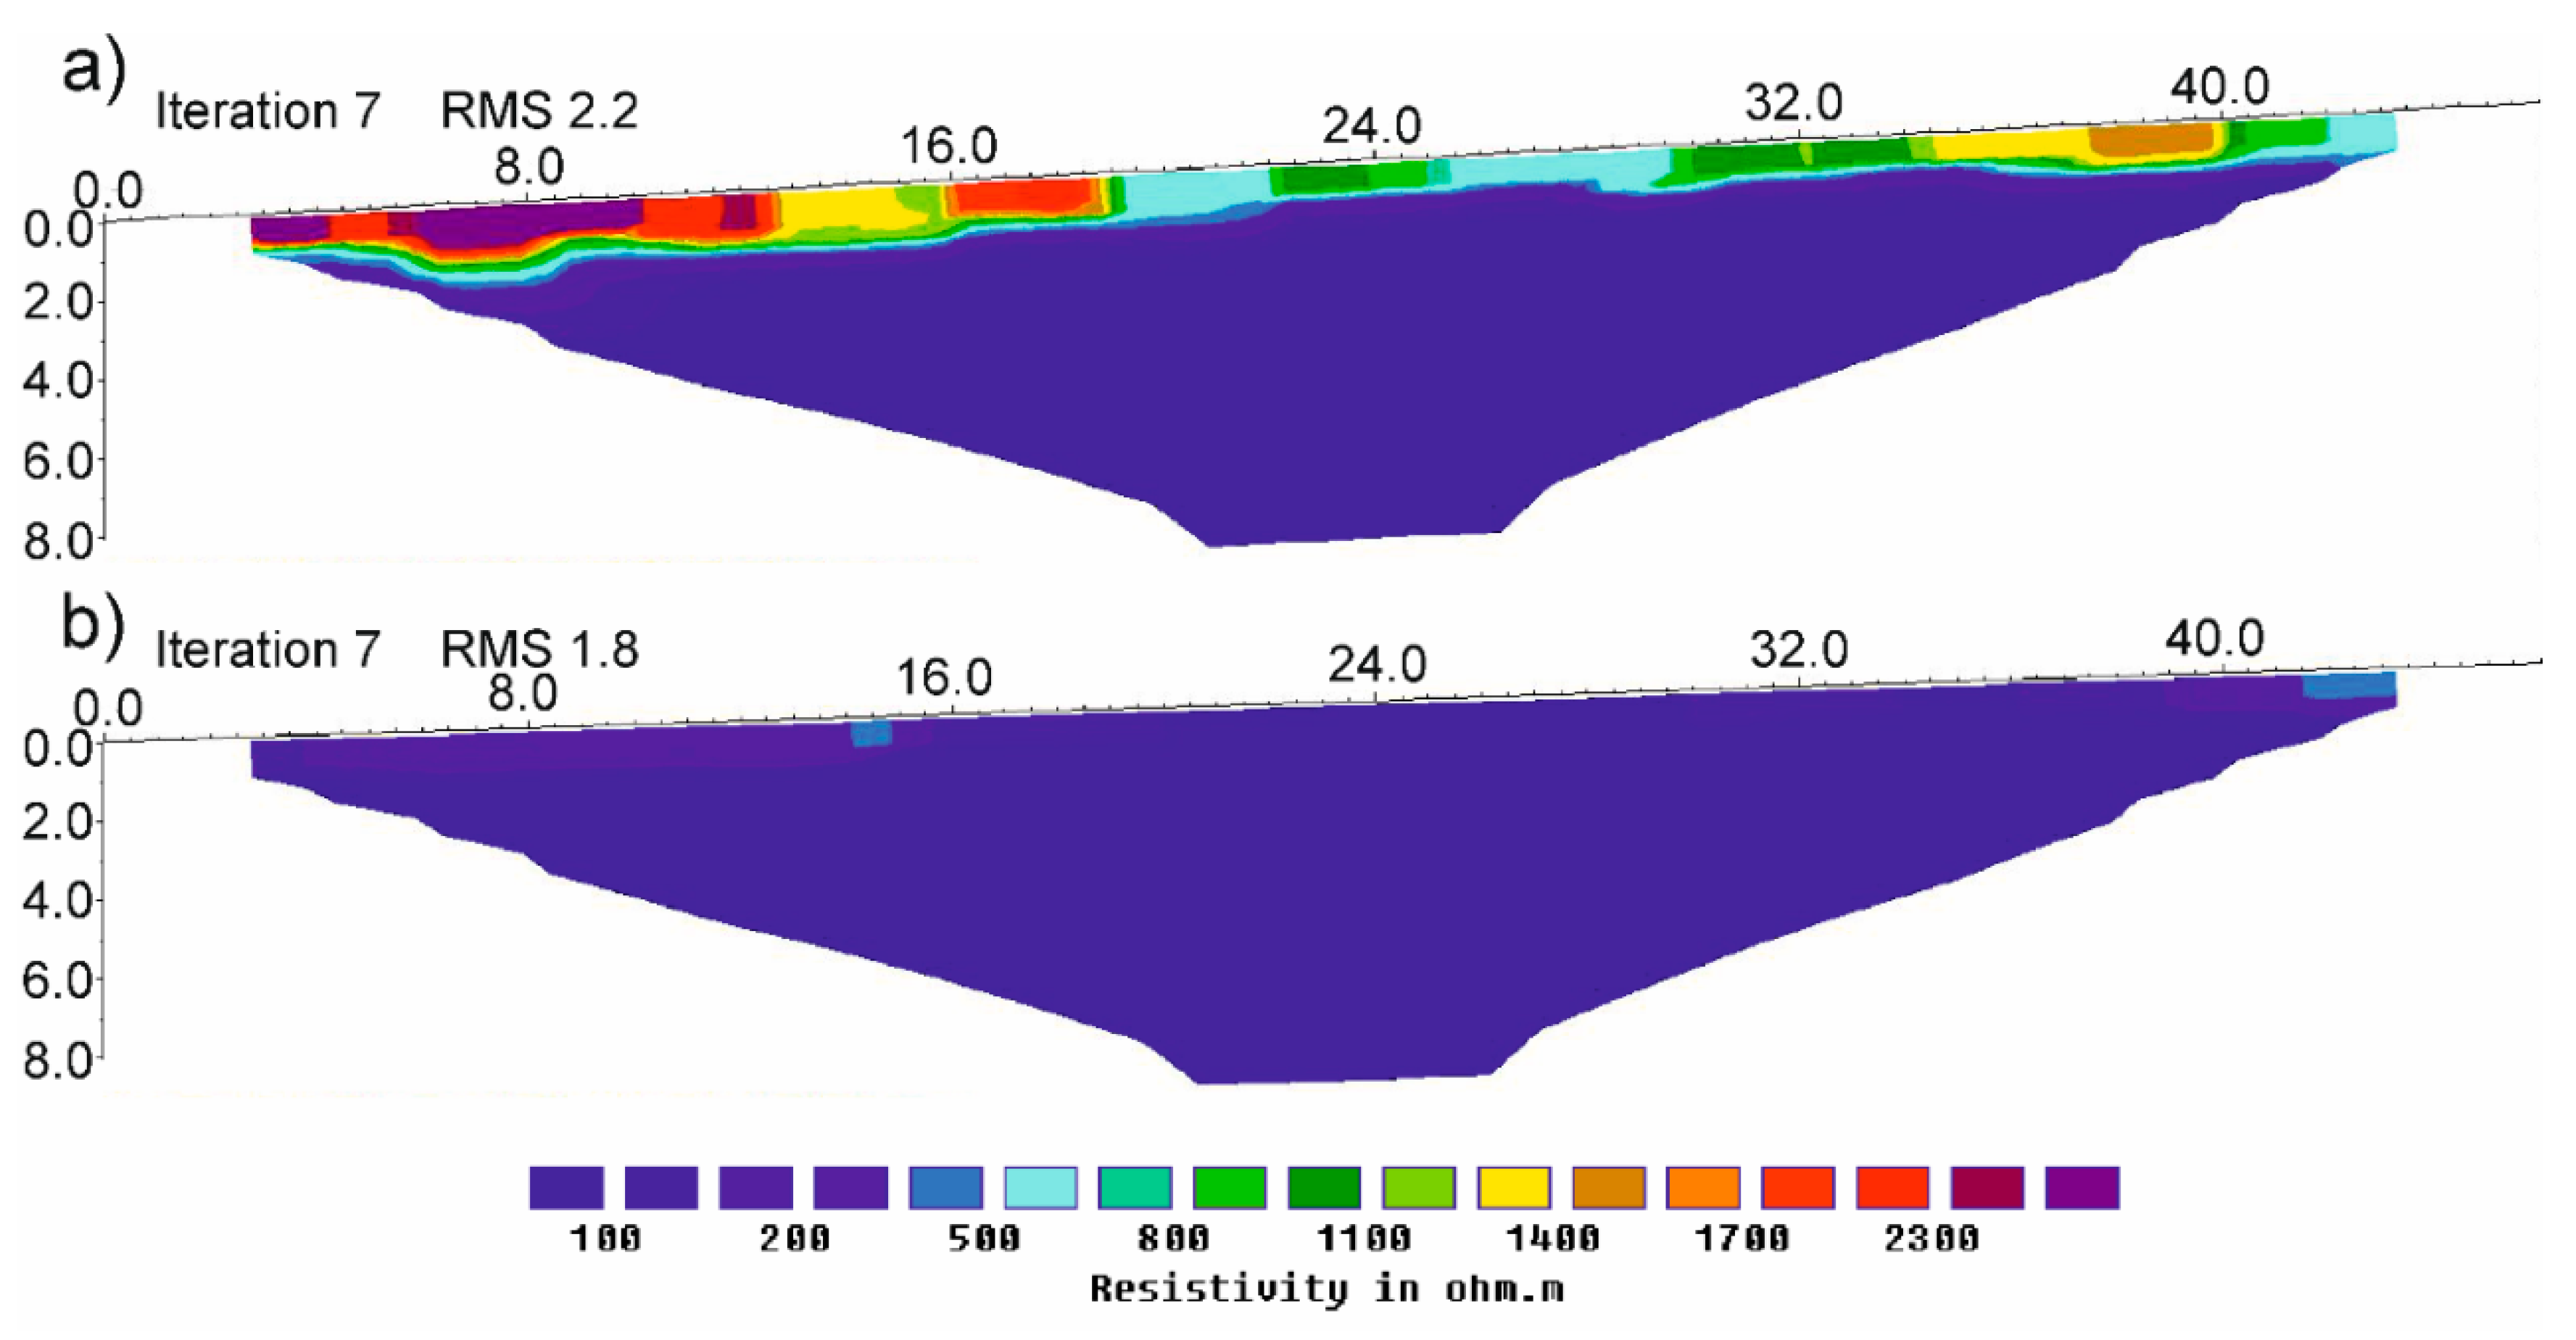
2.2. Resistivity Measurement and Data Processing

Since it was not possible to determine the soil properties related to the occurrence of uprooted trees (depth of potential impermeable layers and shallow water table) by classical methods due to the size of the locality of interest and the intensity of the field work, 2D measurements of electrical resistivity tomography were made for this purpose. This made it possible to perform measurements in a less time-consuming manner and in a relatively shorter time and, after calibration, to interpret the results obtained for the entire study area. A sampling scheme consisting of 40 plots arranged in a 150 × 150 m grid was set up across the area (Figure 1). The electrical resistivity tomography (ERT) of all 40 profiles was measured in August 2014 by ARES, an automatic geophysical system (GF Instruments, Brno, Czech Republic), along 48 m long resistivity profiles with unit electrode spacing 2 m using a Wenner–Schlumberger array. Due to uprooted trees, not all ERT measurements could be performed in the same direction; therefore, 18 profiles were measured along the contour line and 22 profiles were measured down the slope. At the beginning of the measurement, the potential was set to 20 mV, pulse 0.5, measurement stacking 4 (i.e., minimum and maximum pulses were 4) and the number of data points was 121 on every measured profile.
The inversion process on measured data was performed using RES2DINV software [19], employing the least-square method. Apparent resistivity is defined as the resistivity of an electrically homogeneous space, measured from the soil surface between two points represented by potential electrodes (usually called the M and N electrodes). In order to be used for interpretation, the data thus obtained needed to be inverted, which was achieved by a generalized linear inversion theory. Using mathematical and statistical techniques, the apparent resistance data obtained were converted into inverted resistance values, which provided information on the physical properties of the subsurface layers. The inversion was performed by using a standard smoothness-constraint model, and the standard Gauss–Newton method was used to solve the least-squares equation. During the inversion process, the unit electrode spacing was reduced to half (i.e., 1 m) due to better visualization of the depth of interest. Then a map of apparent resistivity distribution at the depths of 0.5, 1 and 2 m across the study area was produced within the SURFER software environment (Golden Software, Golden, Colorado, USA). Electrical resistivity tomography has previously been used for measurement at a shallow depth, e.g., in Samouëlian et al. [20].
The soil profile was excavated at the study area to calibrate soil properties to measured resistivity values. The soil samples were taken from each soil subhorizon, and soil particle size distribution was measured by the sedimentation method. The percentage content of soil skeleton was obtained as a relative area of stones on the profile wall, and the root distribution was specified by the verbal description in each subhorizon during the soil profile field description.

2.3. Statistical Analysis
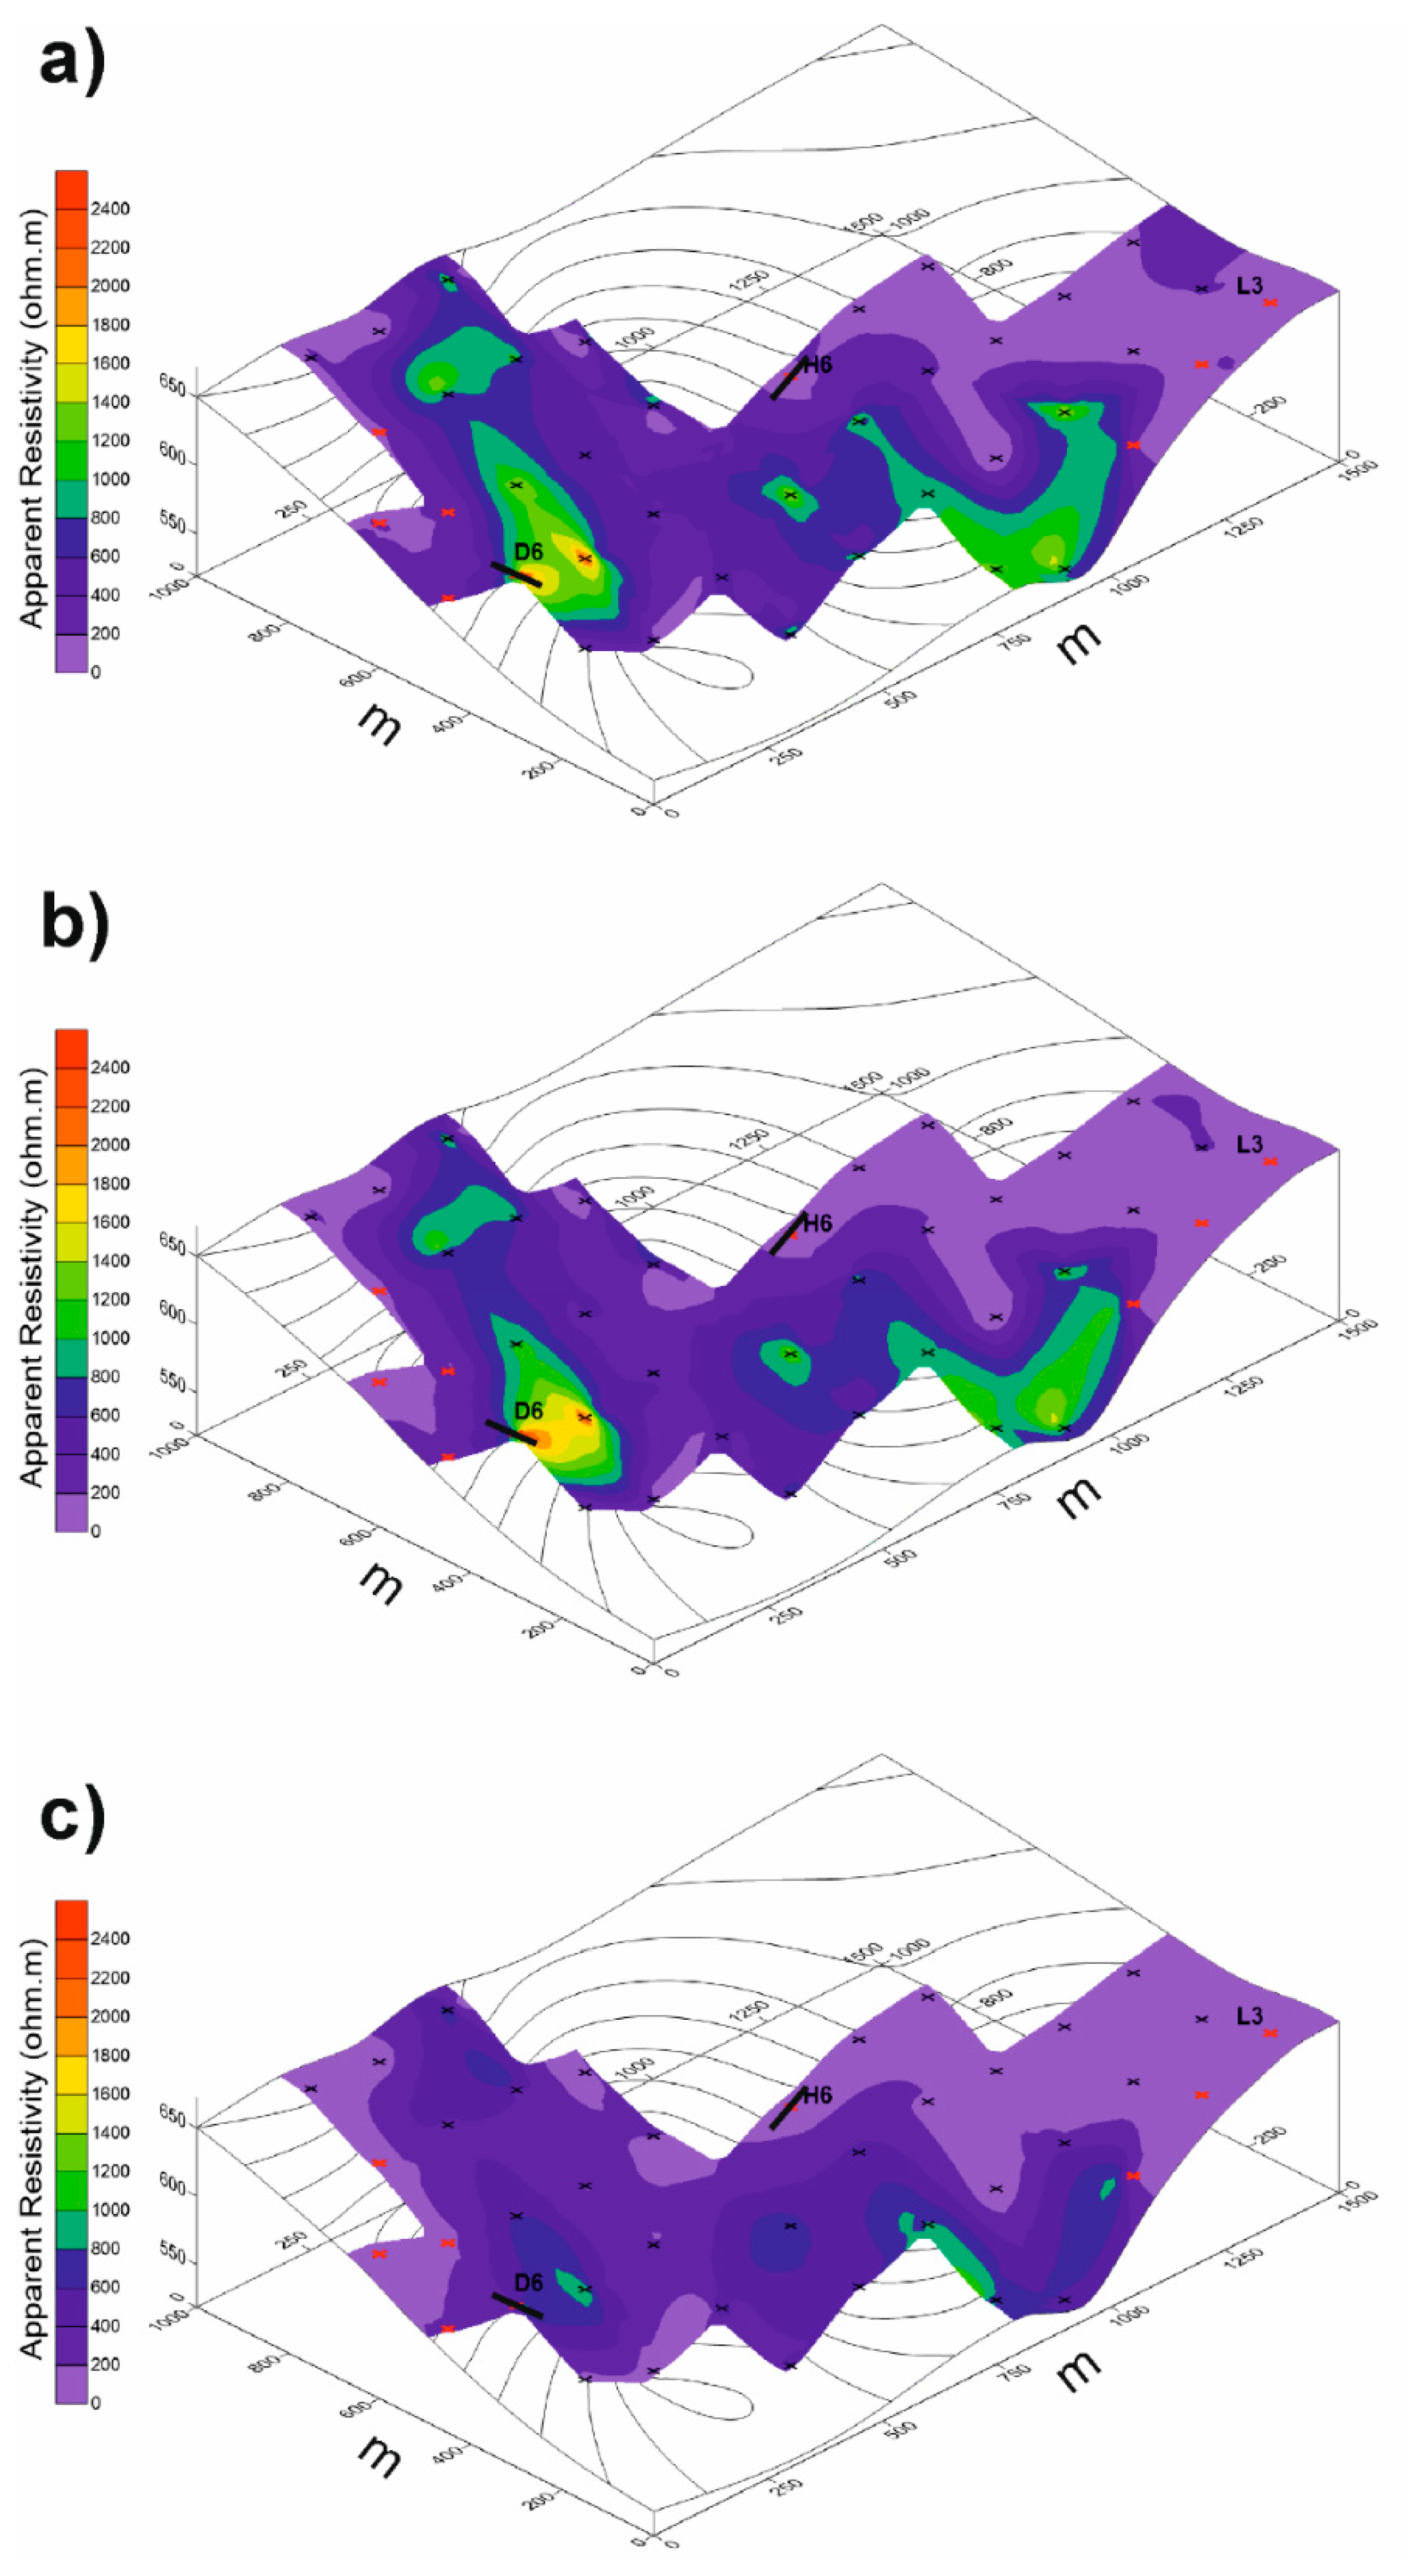
In the field, the number of plots with a presence or absence of windthrow disturbance as manifested by downed uprooted trees were recorded and summed up for the study area and delineated by consecutive soil electrical resistivity, with a 100 Ohm·m increment, i.e., 0–100 Ohm·m, 100–200 Ohm·m and so on.
Thus, the share of areas featuring electrical resistivity <400 Ohm·m and >400 Ohm·m on the total surface is given as fractions of 1, multiplied by the total number of disturbed plots. This produced the expected windthrow frequencies, while the actual windthrown sites occurring within the respective intervals (i.e., 0–400 Ohm·m and >400 Ohm·m) represented the observed frequencies.
Then we used the chi-square test of independence to test the null hypothesis that the total sample of windthrown plots, N, is distributed area-wise only, i.e., evenly across the whole area of interest:
χ 2 = i = 1 k ( O i E i ) 2 E i
where k is the number of attribute categories, Oi are the observed windthrow frequencies and Ei are the expected windthrow frequencies. For this purpose, we investigated whether the number of windthrown plots was scattered randomly, in proportion to the size of a deliberate area, such as that delineated by soil electrical resistivity values below and above a certain cut-off value. This cut-off value was set at 400 Ohm·m, because the electrical resistivity of substrates that contain a considerable amount of wettable clays, such as in claystone or clayey loams, usually vary within the 0–400 Ohm·m range, according to data obtained by various authors. Thus, if the null hypothesis is rejected based on the chi-square test, the alternative hypothesis is that the distribution of windthrown plots is affected by some factor related to the cut-off value. Therefore, soil electrical resistivity (SER) could be considered as a prominent explanatory variable that integrates the amount of soil stony fraction, clay content in the soil and bedrock, as well as soil moisture.

3. Results

The resistivity measurements at 0.5 m and 1 m were very similar and show that apparent resistivity around plots with concentrated uprooted trees at the depth of 0.5–1 m is in the range of 0–500 Ohm·m (Figure 2a,b). Two plots were characterized by resistivity values lower than 100 Ohm·m, indicating higher clay content according to the profile description (Table 1). The resistivity values at the depth of 2 m, in general, decreased at all points with uprooted trees and were in the range of 0–200 Ohm·m (Figure 2c).
As can be seen from the individual 2D resistivity profiles (Figure 3), only one plot with concentrated uprooted trees featured apparent resistivity values >1000 Ohm·m due to a shallow position of sandstone clusters (Figure 3a). The apparent resistivity values measured on a contrasting point were uniformly low across the whole profile (Figure 3b).
Low apparent resistivity values prevailed over the entire study area, especially at 2 m depth, which may indicate increased clay and water content in the subsoil and parent material.
An ocular inspection of the overlap between the areas with low apparent resistivity and windthrown trees was supported by the χ 2 test (Table 2). Based on the evaluation of this result, we rejected the null hypothesis that the windthrown spots were distributed according to the expected frequencies, i.e., evenly over the whole area of interest. Instead, they were mainly concentrated over approximately 50% of the area and their positions coincided with low soil electrical resistivity values ≤400 Ohm·m.
With respect to their spatial arrangement, windthrown plots were concentrated within three clusters coinciding with low soil electrical resistivity in different parts of the area of interest, featuring various terrain relief forms. No further abrupt cut-off values with regard to soil electrical resistivity were observed in the interval 0–400 Ohm·m, and the observed windthrow frequencies were relatively evenly distributed over this range. There were six, five and two windthrown plots in areas with soil electrical resistivity ≤300, ≤200 and ≤100 Ohm·m, respectively. A similar pattern was detected at a depth of 0.5, 1 and 2 m, respectively.

4. Discussion

The claystone layers in the flysch regions can contribute, during their weathering, to the creation of less permeable or even impermeable layers for both tree roots and infiltrating water. In such cases, penetration and growth of tree roots are constrained by growth-limiting bulk density, whose effect varies with soil texture [21]; a perched water table may also form easily, especially during snowmelt and intense rainfall events. Thus, impermeable layers can cause the uprooting of trees, mainly when the soil is saturated. Similar windthrow and uprooting patterns of fir and beech in flysch regions were found by Šamonil et al. [22] and Pawlik et al. [23].
Although European beech, as the most common tree species in the Carpathians, is able to grow in various natural, soil and climatic conditions [24], it is sensitive to waterlogged conditions [25,26]. According to Dobson and Moffat [27], waterlogged soils result in poor gas exchange, which depletes the soil of oxygen and leads to anaerobic conditions and subsequent root death. Such situations develop due to the very low hydraulic conductivity of soils, especially those from flysch rock mass, such as in Havešová (our study site). In these areas, rainfall infiltration is very slow [28]. Soils with permanently high water tables typically cause trees to develop very shallow, widespread rooting systems. In such localities, more intense rotting of beech roots was observed. In addition, in the presence of a high groundwater level, the root systems do not form thick roots, which is an important factor for tree static stability [29]. In addition, tree root growth is limited when bulk density approaches 1.4 and 1.55 g/cm3 for clayey and loamy soils [30], but these values may be lower or higher depending on other factors [31]. Owing to the presence of claystones and their weathering products, the subsoil bulk density in Havešová had a potential to impede the creation of a deeper root system in high-risk areas featuring the lowest electrical resistivity. For example, coarse root (>10 cm) dieback on uprooted trees was observed after the roots were exposed by the windstorm. In addition, the water level in the resulting pits reached 0.5 m below the soil surface, where the clay content increased from 13.5% to approximately 22%. Both factors diminished tree stability, mainly of large trees, during storms.
Thus, as expected, apparent resistivity did not exceed 200 Ohm·m at 0.5–1.0 m depth on plots with concentrated uprooted trees. The resistivity values for clay have been up to 100 Ohm·m in general [20], but also lower values of clay electrical resistivity were reported in previous studies, e.g. 20–40 Ohm·m [32] and 1–12 Ohm·m [33]. The apparent resistivity values measured in our study site were higher than for the clay fraction only, because the parent material in Havešová consists of interlaced layers of claystones and sandstone.
Based on our observations, we believe that soil electrical resistivity can help pinpoint sites with a potentially higher risk of windthrow disturbance, in that low resistivity values indicate a higher clay content, reducing soil permeability and promoting shallow groundwater formation. In connection with reduced oxygen content, both factors lead to shallow root system formation. In this context, the use of electrical resistivity tomography appears to be an effective tool for forest management. Using this noninvasive and relatively rapid method, it is possible to perform a survey of soil properties directly on the stands located in risk areas. The resulting information would enable a timely adjustment of silvicultural interventions to avoid damage to forest stands or to minimize the risk of damage caused by natural disturbance.

5. Conclusions

Our investigation was focused on the direct effect of forest soil properties on forest trees’ stability and dieback in an old-growth natural European beech forest. The resistivity measurement showed low resistivity values below 1 m depth on the individual plots where concentrated uprooted trees were found. These low resistivity values were associated with increases in clay content as a product of weathering of less stable claystone. The results of the direct measurement of apparent resistivity of soil and bedrock and the χ2 test suggested that the spots affected by wind disturbance were not distributed evenly over the whole study area but that they were mainly concentrated on the areas characterized by low resistivity values. These low resistivity values reflected the microscale hydrophysical properties of the soil, such as soil skeleton, clay content and soil moisture. Therefore, noninvasive electrical resistivity tomography could be considered as a useful predictive technique in the forest management system and a tool to reduce the risk of natural hazards and disturbances. Based on the results and conclusions of this study, additional measurements could be made with other geophysical methods (e.g., electromagnetic induction), which would make it possible to predict the risk of unexpected natural disturbances more quickly and on a larger scale.

Author Contributions

M.H.: field measurement, data processing, figures and/or tables preparation and writing—original draft; E.G.: writing—review and editing, funding acquisition and project administration; V.P.: statistical analysis, writing—review and final editing, supervision, project administration and funding acquisition. All authors have read and agreed to the published version of the manuscript.

Funding

This contribution is the result of the project implementation VEGA 1/0836/18 and APVV-15-0176 supported by the scientific grants awarded by the Scientific Grant Agency of Ministry of Education, Science, Research and Sport of the Slovak republic (VEGA) and Slovak Research and Development Agency in the Slovak Republic (APVV).

Acknowledgments

We thank Juraj Bebej for his assistance with field measurement.

Conflicts of Interest

The authors declare no conflict of interest.

References

  1. Schelhaas, M.J.; Nabuurs, G.J.; Schuck, A. Natural disturbances in the European forests in the 19th and 20th centuries. Glob. Chang. Biol. 2003, 9, 1620–1633. [Google Scholar] [CrossRef]
  2. Seidl, R.; Schelhaas, M.; Rammer, W.; Verkerk, P. Increasing forest disturbances in Europe and their impact on carbon storage. Nat. Clim. Chang. 2014, 4, 806–810. [Google Scholar] [CrossRef] [PubMed] [Green Version]
  3. Fleischer, P.; Pichler, V.; Fleisher, P., Jr.; Holko, L.; Máliš, F.; Gömöryová, E.; Cudlín, P.; Holeksa, J.; Michalová, Z.; Homolová, Z.; et al. Forest ecosystem services affected by natural disturbances, climate and land-use changes in the Tatra Mountains. Clim. Res. 2017, 73, 57–71. [Google Scholar] [CrossRef] [Green Version]
  4. Schönenberger, W.; Angst, C.; Bründl, M.; Dobbertin, M.; Duelli, P.; Egli, S.; Frey, W.; Gerber, W.; Kupferschmid Albisetti, A.D.; Lüscher, P.; et al. Vivians Erbe-Waldentwicklung nach Windwurf im Gebirge. Merkbl. Prax. 2003, 36, 1–12. [Google Scholar]
  5. Angst, C.; Bürgi, A.; Duelli, P.; Egli, S.; Heiniger, U.; Hindenlang, K.; Lässig, R.; Lüscher, P.; Moser, B.; Nobis, M.; et al. Waldentwicklung nach Windwurf in Tieferen Lagen der Schweiz. Schlussbericht eines Projektes im Rahmen des Programms «LOTHAR Evaluations- und Grundlagenprojekte»; Eidgenössische Forschungsanstalt für Wald, Schnee und Landschaft: Birmensdorf, Switzerland, 2004. [Google Scholar]
  6. Shabani, S.; Akbarinia, M. Prediction Spatial pattern of windthrow phenomenon in deciduous temperate forests using logistic regression and random forest. Cerne 2017, 23, 387–394. [Google Scholar] [CrossRef] [Green Version]
  7. Dupuy, L.; Fourcaud, T.; Stokes, A. A Numerical Investigation into the Influence of Soil Type and Root Architecture on Tree Anchorage. Plant Soil 2005, 278, 119–134. [Google Scholar] [CrossRef]
  8. Canham, C.D.; Papaik, M.J.; Latty, E.F. Interspecific variation in susceptibility to windthrow as a function of tree size and storm severity for northern temperate tree species. Can. J. For. Res. 2001, 31, 1–10. [Google Scholar] [CrossRef]
  9. Woods, K.D. Intermediate disturbance in a late-successional hemlock-northern hardwood forest. J. Ecol. 2004, 92, 464–476. [Google Scholar] [CrossRef]
  10. Jayawickreme, D.H.; Jobbágy, E.G.; Jackson, R.B. Geophysical subsurface imaging for ecological applications. New Phytol. 2014, 201, 1170–1175. [Google Scholar] [CrossRef]
  11. Kurjak, D.; Střelcová, K.; Ditmarová, Ľ.; Priwitzer, T.; Homolák, M.; Pichler, V. Physiological response of irrigated and non-irrigated Norway spruce trees as a consequence of drought in field conditions. Eur. J. For. Res. 2012, 131, 1737–1746. [Google Scholar] [CrossRef]
  12. Nourtier, M.; Chanzy, A.; Cailleret, M.; Yingge, X.; Huc, R.; Davi, H. Transpiration of silver Fir (Abies alba mill.) during and after drought in relation to soil properties in a Mediterranean mountain area. Ann. For. Sci. 2014, 71, 683–695. [Google Scholar] [CrossRef]
  13. Carrière, S.D.; Martin-StPaul, N.K.; Ruffault, J.; Pimont, F.; Simioni, G.; Doussan, C.; Chalikakis, K.; Limousin, J.-M.; Scotti, I.; Courdier, F.; et al. Assessing inter-individual drought-responses of Quercus ilex to local soil conditions using electrical resistivity tomography. Sci. Total Environ. 2020, 698, 134247. [Google Scholar] [CrossRef] [PubMed]
  14. Rodríguez-Robles, U.; Arredondo Moreno, J.T.; Huber-Sannwald, E.; Ramos-Leal, J.A.; Yepez Gonzalez, E.A. Technical note: Application of geophysical tools for tree root studies in forest ecosystems in complex soils. Biogeosciences 2017, 14, 5343–5357. [Google Scholar] [CrossRef] [Green Version]
  15. Telford, W.M.; Geldart, L.P.; Sheriff, R.E. Applied Geophysics, 2nd ed.; Cambridge University Press: New York, NY, USA, 1990. [Google Scholar]
  16. United Nations Educational, Scientific and Cultural Organization. Beech Primeval Forests of the Carpathians and the Ancient Beech Forests of Germany. 2011. Available online: http://whc.unesco.org/en/list/1133 (accessed on 23 October 2019).
  17. Bulletin Meteorology and Climatology; Slovak Hydrometeorological Institute: Bratislava, Slovakia, 2014.
  18. Gubka, A.; Kunca, A.; Longauerová, V.; Maľová, M.; Vakula, J.; Galko, J.; Nikolov, C.; Rell, S.; Zúbrik, M.; Leontovyč, R. Forest Protection Service Centre Banská Štiavnica; National Forest Center: Zvolen, Slovakia, 2014; p. 8. [Google Scholar]
  19. Loke, M.H. Electrical Imaging Surveys for Environmental and Engineering Studies: A Practical Guide to 2-D and 3-D Surveys. 2000. Available online: www.geometrics.com (accessed on 23 October 2019).
  20. Samouëlian, A.; Cousin, I.; Tabbagh, A.; Bruand, A.; Richard, G. Electrical resistivity survey in soil science: A review. Soil Tillage Res. 2005, 83, 173–193. [Google Scholar] [CrossRef] [Green Version]
  21. Daddow, R.L.; Warrington, G.E. Growth-Limiting Soil Bulk Densities as Influenced by Soil Texture; USDA Forest Service Watershed Systems Development Group: Fort Collins, CO, USA, 1983; p. 17.
  22. Šamonil, P.; Antolík, L.; Svoboda, M.; Adam, D. Dynamics of windthrow events in a natural fir-beech forest in the Carpathians mountains. For. Ecol. Manag. 2009, 257, 1148–1156. [Google Scholar] [CrossRef]
  23. Pawlik, L.; Migoń, P.; Owczarek, P.; Kacprzak, A. Surface processes and interactions with forest vegetation on a steep mudstone slope, Stołowe Mountains, SW Poland. Catena 2013, 109, 203–216. [Google Scholar] [CrossRef]
  24. Leuschner, C. Mechanismen der Konkurrenzüberlegenheit der Rotbuche. Ber. Reinh. Tüxen Ges. 1998, 10, 5–18. [Google Scholar]
  25. Scharnweber, T.; Manthey, M.; Wilmking, M. Differential radial growth patterns between beech (Fagus sylvatica L.) and oak (Quercus robur L.) on periodically waterlogged soils. Tree Physiol. 2013, 33, 425–437. [Google Scholar] [CrossRef]
  26. Kreuzwieser, J.; Rennenberg, H. Molecular and physiological responses of trees to waterlogging stress. Plant Cell Environ. 2014, 37, 2245–2259. [Google Scholar] [CrossRef]
  27. Dobson, M.C.; Moffat, A.J. The Potential for Woodland Establishment on Landfill Sites; Her Majesty’s Stationery Office (HMSO): London, UK, 1993. [Google Scholar]
  28. Peranić, J.; Jagodnik, V.; Arbanas, Ž. Rainfall infiltration and stability analysis of an unsaturated slope in residual soil from flysch rock mass. Reykjavik 2019. [Google Scholar] [CrossRef]
  29. Kodrík, J.; Kodrík, M. Root biomass of beech as a factor influencing the wind tree stability. J. For. Sci. 2002, 48, 549–564. [Google Scholar] [CrossRef]
  30. Coder, K.D. Soil Compaction and Trees: Causes, Symptoms and Effects; University of Georgia School of Forest Resources: Athens, GA, USA, 2000; pp. 1–37. [Google Scholar]
  31. Zhao, Y.; Krzic, M.; Bulmer, C.E.; Schmidt, M.G.; Simard, S.W. Relative bulk density as a measure of compaction and its influence on tree height. Can. J. For. Res. 2010, 40, 1724–1735. [Google Scholar] [CrossRef]
  32. Dahlin, T. 2D resistivity surveying for environmental and engineering applications. First Break 1996, 14, 275–283. [Google Scholar] [CrossRef] [Green Version]
  33. Giao, P.H.; Chung, S.G.; Kim, D.Y.; Tanaka, H. Electric imaging and laboratory resistivity testing for geotechnical investigation of Pusan clay deposits. J. Appl. Geophys. 2003, 52, 157–175. [Google Scholar] [CrossRef]
Figure 1. Position of 40 plots for electrical resistivity measurement (Google Earth, Google LLC).
Forests 11 00234 g001
Figure 2. Apparent resistivity distribution from the electrical resistivity tomography (ERT) dataset on the study site in National Preserve (NP) Havešová (a) at 0.5 m depth, (b) at 1 m depth and (c) at 2 m depth. The plots with concentrated uprooted trees are marked by red crosses.
Forests 11 00234 g002
Figure 3. Apparent resistivity distribution on individual plots with concentrated uprooted trees: (a) the only plot with high resistivity, plot D6; (b) typical plot with low resistivity on plots with uprooted trees, plot H6.
Forests 11 00234 g003
Table 1. Physical and chemical properties of the soil on the study site.
Depth (m)Soil HorizonSkeleton ContentRooting DensitySand (0.05–2.0 mm) (%)Silt (0.002–0.05 mm) (%)Clay (<0.002 mm) (%)Bulk Density (g·cm−3)
0.00–0.04Umbric15% (fine gravel)Intermediate 11.671.516.90.913
0.04–0.10Umbric/Cambic25%–30% (gravel)Intermediate10.171.618.30.934
0.10–0.30Cambic 130% gravel, stones)Intermediate 10.676.013.51.069
0.30–0.61Cambic 220% (stones)Low15.462.921.71.254
0.61–1.00Cambic/Parent rock60% (stones)Low20.457.222.51.266
Table 2. Results of the chi-square test of independence of the windthrown plots occurrence on the soil electrical resistivity spatial distribution.
Surface Area A (55.09% of the Total Area, with Electrical Resistivity ≤400 Ohm·m)Surface Area B (54.91% of the Total Area, With Electrical Resistivity >400 Ohm·m)
Observed frequencies81
Expected frequencies4.964.04
Chi-square: 4.151; Degrees of freedom: 1; p-value: 0.041; Yates’ chi-square: 2.98; Yates’ p-value: 0.089.

