Abstract
Long-term studies have revealed that forest species composition was shifting under environment change and disturbance induced by loss of large trees. Yet, few studies explicitly analyzed their impacts on composition concurrently. To learn more about impacts of environment change and disturbance on driving forest community, we investigated shifts in functional composition over past 24 years in an old-growth subtropical forest in southern China. We analyzed nine traits that are mainly related to leaf nutrients, photosynthetic capacity, hydraulic conductivity, and drought tolerance of plants and examined hypotheses: (1) The functional composition change over time was directional instead of random fluctuation, (2) drought-tolerant species increased their abundance under soil dryness, (3) both environmental change and disturbance related to changes of functional composition significantly, and (4) initial trait values of quadrats strongly influenced their subsequent change rates in quadrat level (10 × 10 m). We found that species composition had shifted to favor species with high leaf nutrient content, high photosynthesis rate, high hydraulic conductivity, low water-use efficiency, and high drought tolerance traits, which was due to soil dryness and disturbance. These two factors explained 47–58% of quadrats’ trait value changes together. Considering rapidly increasing stem density, this pattern may indicate ecological processes of which disturbance provided numerous recruits of resource-acquisition strategy species and soil dryness conducted a selecting effect on shaping composition in the forest. Additionally, quadrats with initial trait values at the far end of change direction shifted faster in three traits, which also indicated that functional composition changes in quadrats were directional and homogenized. Our results implied that environment change and accompanied disturbance events possibly drove species composition change along a different trajectory in the subtropical forest that experienced high climatic variability.
1. Introduction
Climate changes have altered the physical environments (e.g., soil moisture, temperature, and water vapor pressure deficit) of plant communities and shifted community species composition due to the fact that different functional groups, plant genera, and species respond divergently to climate change [1,2,3,4,5]. Based on long-term monitoring forest plots, several recent studies reported that climate change, especially drought, induced community composition to be shifting towards more dry-tolerant individuals and genera in Central American forests [1,6], West African forests [7], Amazon forests [2,8], and some temperate forests [9]. Despite these well-documented changes, disturbance induced by tree mortality almost follows climate change and is possibly one of the most important factors of restructuring forests, but few studies have explicitly analyzed impacts of disturbance and environmental change on functional composition concurrently.
Studies found that drought events would shift community composition. For example, dryness adaptation, high wood density, and canopy species increased their abundance over time in Central American forests [1,6]. This pattern was also observed in more than 100 forest plots in South America [2]. However, other long-term researches reported a distinct pattern that drought favored shorter lifespan, smaller size, fast growing, and rapidly reproducing species in some subtropical and temperate forests [5,9,10,11,12,13]. Why are responses of species composition inconsistent across forests? A rethink of the interaction between environmental change and accompanied disturbance events may contribute to understanding this question.
Disturbance due to loss of massive basal area and biomass has important impacts on community composition. Drought events often induced disturbance by mortality of large trees, but their intensities were very different across forests. For instance, long-term forest-monitoring studies found loss of basal area in some temperate vegetation and subtropical forests [9,11,12,13], nonsignificant change of biomass in Central American forests [1,6], and even increasing basal area in West African forests under drought [7]. These forests’ stem densities increased, showed no change, or decreased, respectively. Disturbance usually increased the recruits of fast-growing species (high leaf nutrients, photosynthesis rate, and hydraulic conductivity) occupying resources left by tree death [6,7]. Therefore, disturbance effects on community composition would be completely different across forests. Nevertheless, we usually dodged disturbance impacts on forest composition in our analyses.
In our study site, previous studies have demonstrated that changes in regional warming and precipitation patterns led to decrease in annual relative humidity and soil water contents within root zone in past decades [14]. Many large trees suffered water stress and were lost from the monsoon evergreen broad-leaved forest. Environmental change and disturbance simultaneously impacted on the forest’ species composition. Species assemblage, abundance, biomass, and demographic rate of the monsoon evergreen broadleaved forest have significantly changed [13]. A population-level study demonstrated that the functional traits determined abundance dynamics of dominant tree species in this forest [10]. Therefore, this monsoon evergreen broad-leaved forest is a good model forest to test disturbance and environmental change impacts by using the matched long-term census, functional trait, and soil moisture dataset. In the present study, we aim to test the following four hypotheses: (1) The species composition change over time was directional instead of random fluctuation, (2) drought-tolerant species increased their abundance under soil dryness, (3) both environmental change and disturbance related to changes of functional composition significantly, and (4) initial trait values of quadrats strongly influenced their subsequent change rates in this old-growth subtropical forest.
2. Materials and Methods
2.1. Study Site
The study was conducted in Dinghushan natural reserve (DHS, 23.17° N, 112.56° E) located in the middle of Guangdong Province in southern China. The site is controlled by a typical monsoon climate. DHS’s mean annual temperature is about 22.5 °C and mean annual precipitation is about 1719 mm with marked seasonality, of which less than 20% falls in dry season (October to March). The mean annual relative humidity is 77.7%. The soil depth usually ranges from 50 to 80 cm. The dominant vegetation is the monsoon evergreen broad-leaved forest, a regional climax of subtropics [13]. The dominant tree species in this forest include Castanopsis chinensis Hance, Gironniera subaequalis Planch, Syzygium acuminatissimum (Blume) DC., Aidia canthioides (Champ. ex Benth.) Masam. and Macaranga sampsonii Hance, etc. Canopy height and coverage are more than 20 m and 95%, respectively. DHS reserve was set up in 1956 to conserve the monsoon evergreen broad-leaved forest.
2.2. Community Surveys
A 1-ha permanent plot was established at the core area of DHS to monitor the regional climax vegetation [13]. According to a 14C dating study [15], the forest ecosystem has not been heavily disturbed for more than 400 years [16]. Community censuses were performed regularly following a standardized protocol and, in total, seven community censuses (1992, 1994, 1999, 2004, 2008, 2010, 2015) were done. Briefly, all living stems ≥1 cm in diameter at breast height (DBH, 1.3 m) were labeled and measured, and the species and status (disease and insect status; suppressed or dominant; health conditions) of each labeled individual were identified during each census.
2.3. Soil Water Content
Studies at the same site demonstrated that soil moisture, especially in the dry season, was possibly the most important climatic variable impacting vegetation under climate change [12,14]. Soil moistures were measured using gravimetric sampling method in soil layers (0–15 cm, 15–30 cm, 30–45 cm, and 45–60 cm) with a 30 mm diameter auger monthly (more information in Zhou et al., 2011). In the present study, we collected and updated dry season soil water content (SW) in main root region (the top 50 cm layer) in DHS plot from 1993 to 2015 (Figure 1).
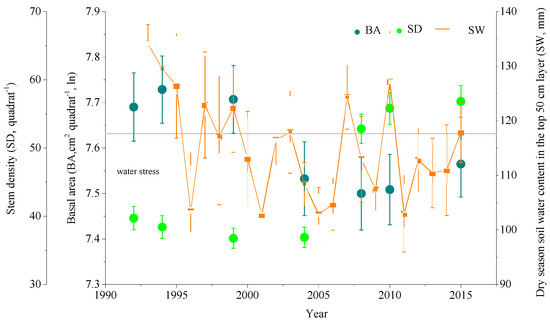
Figure 1.
Temporal changes in quadrats’ basal area (BA, cm2; ln, natural logarithm transformed) and stem density (SD), and dry season soil water content (SW, mm) in the top 50 cm layer in DHS plot. Area of a quadrat is 100 m2. Error bars are standard errors. Trees suffered soil water stress when SW was below gray line (117.64 mm) in DHS plot according to Zhou et al. 2011 [14].
2.4. Functional Traits
Previous studies have measured abundant plant functional traits at this site and full methodological details are given elsewhere [10,17]. In this study, we assembled a database of 9 functional traits of a total 92 tree species from these papers. These functional traits were mainly related to leaf nutrients, light-capturing strategy, hydraulic conductivity, and drought tolerance of plants [18,19,20]. The database embraced about 98.0% individuals and 79.3% species ever appearing and labeled in the plot in the period of 1992–2015. Leaf nitrogen concentration per unit mass (Nmass, mg g−1), leaf phosphorus concentration per unit mass (Pmass, mg g−1), leaf nitrogen to phosphorus ratio per unit mass (N/P), and specific leaf area (SLA, cm2 g−1) are key components of the leaf economics spectrum and could indicate the growth strategy of plants [19,21]. For instance, plants with high leaf nutrients and SLA are acquisitive resource-use species and have a high growth rate. Maximum CO2 assimilation rate per unit mass (Amass, nmol g−1 s−1) indicates photosynthesis rate of plants [20,22]. Sapwood-specific hydraulic conductivity (Ks, kg m−1 s−1 MPa−1) and instantaneous photosynthetic water-use efficiency (WUEi, μmol mol−1) represent important hydraulic characteristics and water use strategy of plants [10,17]. The pressure causing 50% loss of stem hydraulic conductivity (P50, MPa) are key traits in assessing the stem xylem vulnerability to cavitation [10,18,23]. Additionally, sapwood density (WD, g cm−3) is a key trait with wide relationships with other traits. Plants with high WD usually have characteristics like low mortality and growth rate, and conservative resource use [18,24,25].
2.5. Analytical Approach
We subdivided the 1-ha DHS plot into 100 quadrats (10 × 10 m), and calculated the mean trait score of every quadrat at each census weighted by relative abundance. To test whether there were changes in functional composition at DHS plot over the past 24 years, we investigated directional shifts in functional (9 traits) composition by assessing trends over time of these quantities for quadrat-level means. Moreover, to test if these changes were random or if they were associated with disturbance and soil dryness, we assessed trends of quadrats’ functional composition changes over basal area or soil water sequence for quadrat-level means. Quadrats’ initial basal area and trait values were also related to subsequent change rates to assess their effects.
2.5.1. Trends in Functional Composition
To assess changes over time in the trait composition, we used a similar method from papers [2,6,7]. This method included three steps: Calculating quadrat-level trait value for each quadrat at each census, calculating the rate of change in each trait for each quadrat, and finally, determining if the mean rate of change across all quadrats was significant and directional. First, for each trait (Nmass, Pmass, N/P, P50, Ks, WD, SLA, Amass and WUEi), the quadrat-level trait score for each census (j) was calculated as
where S is the species richness of a quadrat; Ti is the functional trait of ith species in the same quadrat; pi is the relative abundance (stems) of species i in the quadrat. Second, the annual change rate of each trait was calculated as:
where qCWM1 is the quadrat-level trait score in initial census, qCWM2 is the quadrat-level trait score in final census, and t is the census interval (years). Considering distinct patterns of community structure and soil water content (Figure 1), we calculated the annual change rate of each trait in 1992–2004, 2004–2015, and 1992–2015, respectively. Third, to test if the change in each trait was significantly different from random fluctuation, we calculated the mean change rate and the corresponding 95% confidence intervals (CI) by bootstrapping across 100 quadrats (5000 resamples) and used binomial test to determine if the change was significant and directional (i.e., number of subplots increasing or decreasing significantly different from 50%) (p value <0.05).
(qCWM2−qCWM1)/t
Additionally, we tested the relationships between quadrats’ initial trait values and subsequent change rates (1992–2015) using simple linear regression to indicate the influence of initial functional composition.
2.5.2. The Influence of Disturbance on Functional Composition
Studies claimed that community or quadrat-level functional composition might be undergoing succession from past and present disturbance, and basal area (BA, area at breast height) and its change could approximately reflect disturbance [6,7]. First, we tested influence of past disturbance by assessing the relationships between quadrats’ initial BA and subsequent rates (1992–2015) of change in trait values using Spearman rank correlations. Second, to test the influence of present disturbance, we assessed trends of quadrats’ functional composition changes over BA sequence for quadrat-level means. Considering possibly cumulative and lag effects, this method involved calculating the change rate of each trait and BA for each quadrat between 1992 and consecutive censuses (i.e., 1992–1994, 1992–1999, 1992–2004, 1992–2008, 1992–2010, and 1992–2015) according to Equations (1) and (2); regressing the change rate of each trait vs. BA for each quadrat; and finally, using idem bootstrapping and binomial test to determine if the slopes were significant and directional (p value <0.05).
2.5.3. The Influence of Environmental Change on Functional Composition
Similarly, to test the influence of environment change, we assessed trends of quadrats’ functional composition changes over dry season soil water content (SW) sequence for quadrat-level means. We followed three steps: Calculating the change rate of each trait for each quadrat between 1992 and consecutive censuses, and averaging dry season SW in corresponding periods; regressing the change rate of each trait vs. averaged SW in the same period for each quadrat; and finally, using idem bootstrapping and binomial test to determine if the slopes were significant and directional (p value <0.05).
2.5.4. Partitioning Effects of Disturbance and Environment Change on Functional Composition
For partitioning effects of disturbance and environment change on functional composition, we firstly calculated pure effect and share effect of SW and BA on trait value changes as derived from adjust R2 (‘0’ replaced negative value) of variation partitioning analysis (using R (R Foundation for Statistical Computing, Vienna, Austria, version 3.5.3) package ‘vegan’) for each quadrat [26], and then we assessed the mean pure effect and share effect of SW and BA for each trait by bootstrapping across 100 quadrats (5000 resamples), respectively.
3. Results
3.1. Community and Soil Water
The DHS plot experienced stem density (SD) increasing and loss of basal area (BA) over the past 24 years and it could be divided into two distinct periods: 1992–2004 and 2004–2015. In the former period, the forest lost BA while SD decreased slightly. In the period of 2004–2015, the forest experienced explosive increasing of stems. Dry season soil water content (SW, mm) in the top 50 cm layer in DHS plot changed and trees were stressed by low SW (less than 117.64 mm) in most of our study period [14] (Figure 1).
3.2. Trends in Functional Composition
According to Figure 2, regardless of periods of 1992–2004, 2004–2015, and 1992–2015, there were significant and directional changes in the leaf nitrogen concentration (Nmass, 1992–2015: mean = 6.49 × 10⁻² mg g−1 yr−1, 95% CI = 5.50 × 10⁻², 7.49 × 10⁻² mg g−1 yr−1), maximum CO2 assimilation rate (Amass, 1992–2015: mean = 0.44 nmol g−1 s−1 yr−1, 95% CI = 0.36, 0.53 nmol g−1 s−1 yr−1), and instantaneous photosynthetic water-use efficiency (WUEi, 1992–2015: mean = −0.30 μmol mol−1 yr−1, 95% CI = −0.35, −0.24 μmol mol−1 yr−1) of quadrats. The changes of leaf phosphorus concentration (Pmass, 1992–2015: mean = 3.30 × 10⁻³ mg g−1 yr−1, 95% CI = 2.50 × 10⁻³, 4.10 × 10⁻³ mg g−1 yr−1), the pressure causing 50% loss of stem hydraulic conductivity (P50, 1992–2015: mean = −1.68 × 10⁻² MPa yr−1, 95% CI = −2.23 × 10⁻², −1.16 × 10⁻² MPa yr−1), sapwood-specific hydraulic conductivity (Ks, 1992–2015: mean = 1.54 × 10⁻² kg m−1 s−1 MPa−1 yr−1, 95% CI = 1.05 × 10⁻², 2.08×10⁻² kg m−1 s−1 MPa−1 yr−1), and sapwood density (WD, 1992–2015: mean = 9.0 × 10⁻⁷ g cm−3 yr−1, 95% CI = 5.0 × 10⁻⁷, 1.4 × 10⁻⁶ g cm−3 yr−1) in quadrats were not significant or directional in 1992–2004 or 2004–2015, while their trends over the entire research period were significant and directional. Both the leaf nitrogen to phosphorus ratio (N/P) and specific leaf area (SLA) had opposite changes between periods of 1992–2004 and 2004–2015 and had nonsignificant and directional trends over the entire research period (Supporting information Figure A1 and Table A1).
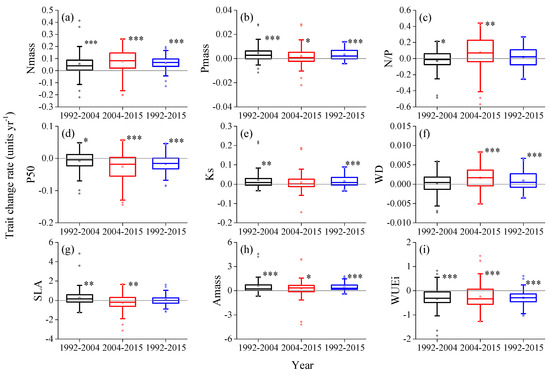
Figure 2.
Annual rates of change in quadrats’ trait values in periods of 1992–2004, 2004–2015, and 1992–2015. (a) leaf nitrogen concentration per unit mass (Nmass, mg g−1); (b) leaf phosphorus concentration per unit mass (Pmass, mg g−1); (c) leaf nitrogen to phosphorus ratio per unit mass (N/P,); (d) the pressure causing 50% loss of stem hydraulic conductivity (P50, MPa); (e) sapwood-specific hydraulic conductivity (Ks, kg m−1 s−1 MPa−1); (f) sapwood density (WD, g cm−3); (g) specific leaf area (SLA, cm2 g−1); (h) maximum CO2 assimilation rate per unit mass (Amass, nmol g−1 s−1); (i) instantaneous photosynthetic water-use efficiency (WUEi, μmol mol−1). Asterisk indicates bootstrapping p values (*, 0.05~0.01; **, 0.01~0.001; ***, <0.001). Binomial test results and other information are provided in Table A1.
3.3. The Influence of Initial Functional Composition
For the relationships between initial functional composition and trait change rates (1992–2015) of quadrats, Nmass (R2 = 0.48, p < 0.001), P50 (R2 = 0.25, p < 0.001), SLA (R2 = 0.11, p < 0.001) and WUEi (R2 = 0.41, p < 0.001) change rates all negatively related to initial trait values, respectively, while the other five traits’ change rate had weak or nonsignificant relation to initial trait values (Figure 3).
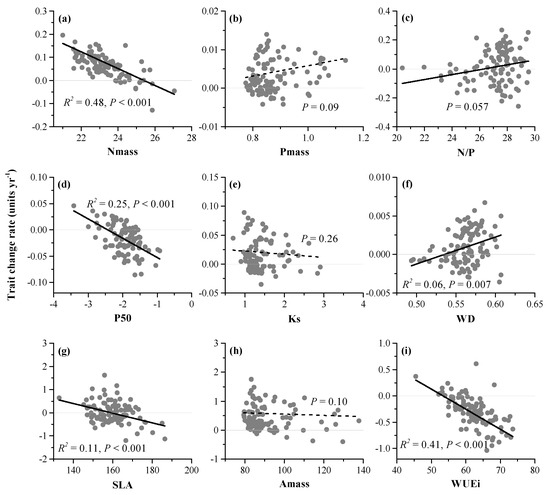
Figure 3.
Linear regression between quadrats’ initial trait values and subsequent change rates (1992–2015) in DHS plot. (a) leaf nitrogen concentration per unit mass (Nmass, mg g−1); (b) leaf phosphorus concentration per unit mass (Pmass, mg g−1); (c) leaf nitrogen to phosphorus ratio per unit mass (N/P,); (d) the pressure causing 50% loss of stem hydraulic conductivity (P50, MPa); (e) sapwood-specific hydraulic conductivity (Ks, kg m−1 s−1 MPa−1); (f) sapwood density (WD, g cm−3); (g) specific leaf area (SLA, cm2 g−1); (h) maximum CO2 assimilation rate per unit mass (Amass, nmol g−1 s−1); (i) instantaneous photosynthetic water-use efficiency (WUEi, μmol mol−1).
3.4. Basal Area and Functional Composition
Correlation analysis shows that quadrats’ initial basal area (BA) had nonsignificant or extremely weak impacts on subsequent change rates of all trait values (Table A2), but BA change in the research period had significant influences on annual change rates of quadrats’ functional composition in six traits. According to Table 1, quadrats’ BA change rates had significant and directional relations with the change rates of Nmass, Pmass, P50, Ks, Amass, and WUEi, while its relations with the change rates of N/P, WD, and SLA were not significant (p > 0.05).

Table 1.
Mean linear slope of regression in annual rates of change in quadrats’ functional composition vs. BA (basal area) in DHS plot.
3.5. Soil Dryness and Functional Composition
Table 2 shows that dry season soil water content in the top 50 cm layer (SW) significantly influenced the annual change rates of quadrats’ trait values. SW had significant and directional relations to the change rates of Nmass, Pmass, P50, Ks, Amass, and WUEi, while its relations to the change rates of N/P, WD, and SLA were not significant (p > 0.05).
Table 2.
Mean linear slope of regression in annual rates of change in quadrats’ functional composition vs. SW (dry season soil water content in the top 50 cm layer) in DHS plot.
3.6. Partitioning Effects of Soil dryness and BA on Functional Composition
According to analysis (Figure 4), SW accounted for 14–21% of total variance, while BA accounted for 10–19% of total trait value variance for nine traits. It is worth noting that BA’s effect (19%) was higher than SW’s effect (14%) for SLA. The shared variation of SW and BA was 12–18%. SW and BA accounted for 47–58% of total variance together.
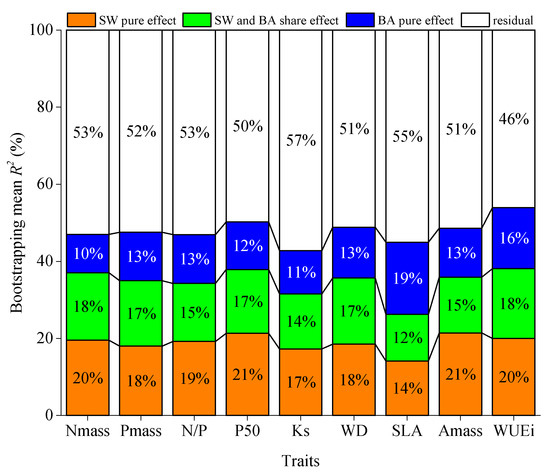
Figure 4.
Bootstrapping mean pure and shared effects of SW (dry season soil water content in the top 50 cm layer) and BA (basal area) on quadrats’ trait value changes as derived from variation partitioning analysis and bootstrapping method. Nmass, leaf nitrogen concentration per unit mass; Pmass, leaf phosphorus concentration per unit mass; N/P, leaf nitrogen to phosphorus ratio per unit mass; P50, the pressure causing 50% loss of stem hydraulic conductivity; Ks, sapwood-specific hydraulic conductivity; WD, sapwood density; SLA, specific leaf area; Amass, maximum CO2 assimilation rate per unit mass; WUEi, instantaneous photosynthetic water-use efficiency. More information is provided in Table A3.
4. Discussion
Here, we report the first functional composition change and its relations to disturbance and environment change in subtropical forest. Over the past 24 years, the species composition in the monsoon evergreen broad-leaved forest in DHS plot has shifted to favor species with high leaf nutrients, photosynthesis rate, hydraulic conductivity, low water-use efficiency, and drought tolerance (lower P50 value) traits (hypothesis 1 and 2). Quadrats with initial trait values in the far end from change direction shifted faster in traits of Nmass, P50 and WUEi (i.e., quadrats with lower initial Nmass have higher subsequent change rate in study period), which was directional and pushed functional composition toward a more homogeneous state in community level (hypothesis 4). Moreover, our study suggests that disturbance and soil dryness under climate change are important in shifting functional composition and they explain 47–58% of quadrats’ trait value changes together (hypothesis 3).
Our results show that the changes of functional trait composition over time are significant and directional. This pattern is unlikely recovery from past disturbance (Table A2) and significant influence of initial trait value (Figure 3) also implies that present stochastic disturbance events in quadrats are not the dominant impacted factor. Increasing drought tolerance (Hypothesis 2) was supported by our result (Figure 2) and it was likely due to soil dryness but not disturbance because decreased BA in study period related to positive change of P50 value (lower drought tolerance, Table 2 and Table A2). This result is consistent with drought-induced mortality pattern across the world [23,27]. Studies in Amazonian and West African forests also observed that community composition shift towards more dry-tolerant individuals [2,6,7].
Moreover, the periods of 1992–2004 and 2004–2015 were distinct and one would expect that disturbance would interrupt or inverse the effect of soil dryness on functional composition in DHS plot. However, six of nine trait values had the same trends in the two periods which indicated that soil dryness had consistent influences on shaping functional composition in the mortality or recruitment dominance periods across disturbance. According to variation partitioning analysis and bootstrapping, soil dryness explained 29–41% (pure and shared effect) variance of trait value changes.
Studies claimed that high Ks and Amass trait values might allow species to have the advantage of photosynthesis in short wet intervals during the dry season [10,28]. Taking it one step further, we hypothesized that environment change forced community-level ecology strategy to shift from conservation (K-strategy) to resource acquisition (r-strategy) with drought tolerance because increasing mortality was adverse to K-strategy species in maintaining population size but r-strategy was good at occupying resource leaved by tree death and benefited from increasing recruitment rate [5,29,30]. This hypothesis could be supported by our observed patterns that r-strategy (high leaf nutrients, photosynthesis rate, hydraulic conductivity, and low water-use efficiency) and drought tolerance species increased their abundance, and disturbance (BA) explained appreciable variance (27–36%) of trait changes. Namely, disturbance provided numerous recruits of r-strategy species and dryness conducted selecting effect on shaping recruits. Many previous studies also found that species with characteristics of resource acquisition, shorter lifespan, and smaller size attained demographic advantage in droughts [5,9,11,12,13]. Nevertheless, disturbance and environment change might have the same or opposite effects. For instance, disturbance and soil dryness had synergy on Nmass while intense disturbance effect could counteract soil dryness effect on change of SLA value in study period (Figure 2, Table 1 and Table 2).
Our results may explain inconsistent responses of species composition to drought across forests in some extent. Continuing mild drought was the main influence pattern in some longer-term forest monitoring study and it was usually observed in sites that experienced decades of low rainfall. If this is the case, temporal shift of community composition under climate change is like spatial change of vegetation along environmental gradient [1,2,6,7]. Community composition would shift towards more conservative, dry-tolerant, deciduous individuals. On the other hand, it is a common phenomenon that many sites like DHS plot met increasing precipitation seasonality and frequency of extreme rainfall events but nondirectional annual rainfall under global changes [14,31,32,33]. Tree species with r strategy and drought tolerance have good performance in these sites with high climatic variability but rich resources. Considering critical points and time lag effects of tree mortality and recruitment [13,34], environment change and accompanied disturbance events possibly drive species composition change along a completely different and non-linear trajectory in these regions.
5. Conclusions
Our study demonstrated that (1) the species composition change over time was significant and directional, (2) drought-tolerant species increased their abundance under soil dryness, (3) both environmental change and disturbance influenced on changes of functional composition significantly, and (4) initial trait values of quadrats strongly impacted their subsequent change rates in this subtropical forest. The forest shifted to a community dominated by drought-tolerant and acquisitive resource-use individuals under changing environment. This pattern is distinct from community shifts in Amazon and African forests and our study provides a perspective insight into the temporal shifts of community composition in subtropical forests that experienced high climatic variability. These changes of the monsoon evergreen broad-leaved forest might affect forest ecosystem services, such as carbon sequestration and biodiversity conservation. Our study contributes to understand composition change of this typical subtropical forest under climate change.
Author Contributions
Conceptualization, S.Z. and G.Z.; data curation, S.Z., Q.Z., S.L., G.C., R.L., Q.Y., D.Z., X.T., J.L., and Y.L.; formal analysis, S.Z.; funding acquisition, G.Z.; investigation, Q.Z., S.L., G.C., R.L., Q.Y., D.Z., X.T., J.L., C.H., Y.L., and Z.M.; methodology, R.L.; project administration, G.Z.; resources, G.Z. and Q.Y.; software, S.Z. and Z.M.; supervision, Q.Z. and G.Z.; validation, G.Z.; visualization, S.Z. and C.H.; writing—original draft, S.Z. and G.Z.; writing—review and editing, Q.Z. and G.Z. All authors have read and agreed to the published version of the manuscript.
Funding
This research was funded by of Nanjing University of Information Science & Technology, the High-end Talents Start-up Project, the National Natural Science Foundation of China, grant number NSFC41430529 and NSFC31670453, and the Chinese Academy of Sciences, grant number QYZDJ-SSW-DQC003. The study also belongs to a part of the Chinese Ecosystem Research Network.
Acknowledgments
Data associated with this manuscript are deposited in Dinghushan forest station at http://dhf.cern.ac.cn/. More detail information please contact with corresponding author. We thank all researchers and students who were involved in the field censuses.
Conflicts of Interest
The authors declare no conflict of interest.
Appendix A

Figure A1.
Temporal trends of quadrats’ functional traits (based on abundance) in the monsoon evergreen broad-leaved forest. Note: Nmass, leaf nitrogen concentration per unit mass (mg g−1); Pmass, leaf phosphorus concentration per unit mass (mg g−1); N/P, leaf nitrogen to phosphorus ratio per unit mass; P50, the pressure causing 50% loss of stem hydraulic conductivity (MPa); Ks, sapwood-specific hydraulic conductivity (kg m−1 s−1 MPa−1); WD, sapwood density (g cm−3); SLA, specific leaf area (cm2 g−1); Amass, maximum CO2 assimilation rate per unit mass (nmol g−1 s−1); WUEi, instantaneous photosynthetic water-use efficiency (μmol mol−1). Error bars are standard errors of quadrats’ functional traits.

Table A1.
Annual rates of change in quadrats’ trait values in periods of 1992–2004, 2004–2015, and 1992–2015.
Table A1.
Annual rates of change in quadrats’ trait values in periods of 1992–2004, 2004–2015, and 1992–2015.
| Traits | Year | Mean Rates (Units yr−1) | Lower 95% CI | Upper 95% CI | Bootstrapping p Values | Ni | Binomial p Values |
|---|---|---|---|---|---|---|---|
| Nmass | 1992–2004 | 0.0544 | 0.0379 | 0.0726 | <0.001 | 79 | <0.001 |
| 2004–2015 | 0.0763 | 0.0574 | 0.0962 | <0.001 | 81 | <0.001 | |
| 1992–2015 | 0.0649 | 0.0550 | 0.0749 | <0.001 | 88 | <0.001 | |
| Pmass | 1992–2004 | 0.0045 | 0.0032 | 0.0058 | <0.001 | 74 | <0.001 |
| 2004–2015 | 0.0019 | 0.0005 | 0.0034 | 0.01 | 56 | 0.27 | |
| 1992–2015 | 0.0033 | 0.0025 | 0.0041 | <0.001 | 73 | <0.001 | |
| N/P | 1992–2004 | −0.0319 | −0.0582 | −0.0068 | 0.02 | 45 | 0.37 |
| 2004–2015 | 0.0741 | 0.0369 | 0.1102 | <0.001 | 68 | <0.001 | |
| 1992–2015 | 0.0188 | −0.0048 | 0.0419 | 0.12 | 56 | 0.27 | |
| P50 | 1992–2004 | −0.0084 | −0.0150 | −0.0022 | 0.01 | 46 | 0.48 |
| 2004–2015 | −0.0260 | −0.0350 | −0.0176 | <0.001 | 30 | <0.001 | |
| 1992–2015 | −0.0168 | −0.0223 | −0.0116 | <0.001 | 28 | <0.001 | |
| Ks | 1992–2004 | 0.0219 | 0.0136 | 0.0311 | <0.001 | 64 | <0.01 |
| 2004–2015 | 0.0084 | −0.0009 | 0.0185 | 0.09 | 54 | 0.48 | |
| 1992–2015 | 0.0154 | 0.0105 | 0.0208 | <0.001 | 65 | <0.01 | |
| WD | 1992–2004 | 0.0002 | −0.0003 | 0.0007 | 0.34 | 57 | 0.19 |
| 2004–2015 | 0.0016 | 0.0010 | 0.0022 | <0.001 | 70 | <0.001 | |
| 1992–2015 | 0.0009 | 0.0005 | 0.0014 | <0.001 | 61 | 0.04 | |
| SLA | 1992–2004 | 0.2514 | 0.1068 | 0.4129 | <0.01 | 65 | <0.01 |
| 2004–2015 | −0.2259 | −0.3779 | −0.0779 | <0.01 | 35 | <0.01 | |
| 1992–2015 | 0.0231 | −0.0650 | 0.1111 | 0.61 | 48 | 0.76 | |
| Amass | 1992–2004 | 0.5953 | 0.4170 | 0.7898 | <0.001 | 78 | <0.001 |
| 2004–2015 | 0.2783 | 0.0611 | 0.4910 | 0.01 | 70 | <0.001 | |
| 1992–2015 | 0.4437 | 0.3657 | 0.5306 | <0.001 | 89 | <0.001 | |
| WUEi | 1992–2004 | −0.3419 | −0.4343 | −0.2549 | <0.001 | 19 | <0.001 |
| 2004–2015 | −0.2479 | −0.3369 | −0.1545 | <0.001 | 31 | <0.001 | |
| 1992–2015 | −0.2969 | −0.3523 | −0.2412 | <0.001 | 14 | <0.001 |
Note: Ni indicates number of quadrats with increasing trait value. Nmass, leaf nitrogen concentration per unit mass (mg g−1); Pmass, leaf phosphorus concentration per unit mass (mg g−1); N/P, leaf nitrogen to phosphorus ratio per unit mass; P50, the pressure causing 50% loss of stem hydraulic conductivity (MPa); Ks, sapwood-specific hydraulic conductivity (kg m−1 s−1 MPa−1); WD, sapwood density (g cm−3); SLA, specific leaf area (cm2 g−1); Amass, maximum CO2 assimilation rate per unit mass (nmol g−1 s−1); WUEi, instantaneous photosynthetic water-use efficiency (μmol mol−1).
Table A2.
Spearman rank correlations between quadrats’ initial BA (basal area) and subsequent rates of change in trait value.
Table A2.
Spearman rank correlations between quadrats’ initial BA (basal area) and subsequent rates of change in trait value.
| Traits | Year | Spearman r | n | p Values |
|---|---|---|---|---|
| Nmass | 1992–2004 | −0.21 | 100 | 0.03 |
| 2004–2015 | 0.10 | 100 | 0.31 | |
| 1992–2015 | −0.10 | 100 | 0.34 | |
| Pmass | 1992–2004 | −0.17 | 100 | 0.10 |
| 2004–2015 | −0.01 | 100 | 0.96 | |
| 1992–2015 | −0.15 | 100 | 0.15 | |
| N/P | 1992–2004 | 0.05 | 100 | 0.61 |
| 2004–2015 | 0.09 | 100 | 0.38 | |
| 1992–2015 | 0.10 | 100 | 0.30 | |
| P50 | 1992–2004 | −0.17 | 100 | 0.09 |
| 2004–2015 | −0.05 | 100 | 0.64 | |
| 1992–2015 | −0.06 | 100 | 0.54 | |
| Ks | 1992–2004 | −0.14 | 100 | 0.16 |
| 2004–2015 | −0.07 | 100 | 0.50 | |
| 1992–2015 | −0.20 | 100 | 0.05 | |
| WD | 1992–2004 | 0.07 | 100 | 0.46 |
| 2004–2015 | 0.06 | 100 | 0.54 | |
| 1992–2015 | 0.12 | 100 | 0.23 | |
| SLA | 1992–2004 | −0.02 | 100 | 0.85 |
| 2004–2015 | −0.03 | 100 | 0.75 | |
| 1992–2015 | −0.05 | 100 | 0.63 | |
| Amass | 1992–2004 | −0.19 | 100 | 0.06 |
| 2004–2015 | −0.11 | 100 | 0.29 | |
| 1992–2015 | −0.23 | 100 | 0.02 | |
| WUEi | 1992–2004 | 0.05 | 100 | 0.61 |
| 2004–2015 | −0.05 | 100 | 0.59 | |
| 1992–2015 | −0.03 | 100 | 0.78 |
Note: Nmass, leaf nitrogen concentration per unit mass; Pmass, leaf phosphorus concentration per unit mass; N/P, leaf nitrogen to phosphorus ratio per unit mass; P50, the pressure causing 50% loss of stem hydraulic conductivity; Ks, sapwood-specific hydraulic conductivity; WD, sapwood density; SLA, specific leaf area; Amass, maximum CO2 assimilation rate per unit mass; WUEi, instantaneous photosynthetic water-use efficiency.
Table A3.
Bootstrapping mean pure and shared effects of SW (dry season soil water content in the top 50 cm layer) and BA (basal area) on quadrats’ trait value changes as derived from variation partitioning analysis and bootstrapping method.
Table A3.
Bootstrapping mean pure and shared effects of SW (dry season soil water content in the top 50 cm layer) and BA (basal area) on quadrats’ trait value changes as derived from variation partitioning analysis and bootstrapping method.
| Traits | Effects | Mean R2 (%) | Lower 95% CI | Upper 95% CI |
|---|---|---|---|---|
| Nmass | a | 21.31 | 15.82 | 27.14 |
| b | 19.10 | 14.65 | 23.96 | |
| c | 10.86 | 6.69 | 15.54 | |
| r | 57.83 | 50.79 | 64.99 | |
| Pmass | a | 19.91 | 14.9 | 25.14 |
| b | 18.77 | 14.50 | 23.27 | |
| c | 13.93 | 9.58 | 18.92 | |
| r | 58.08 | 51.71 | 64.37 | |
| N/P | a | 21.06 | 15.69 | 26.61 |
| b | 16.57 | 12.51 | 20.73 | |
| c | 13.87 | 9.70 | 18.49 | |
| r | 58.23 | 51.36 | 64.88 | |
| P50 | a | 23.04 | 17.23 | 29.14 |
| b | 17.91 | 13.41 | 22.68 | |
| c | 13.34 | 9.14 | 17.74 | |
| r | 53.83 | 47.05 | 60.89 | |
| Ks | a | 18.85 | 14.05 | 23.9 |
| b | 15.58 | 11.97 | 19.39 | |
| c | 12.24 | 8.43 | 16.68 | |
| r | 62.38 | 56.24 | 68.36 | |
| WD | a | 20.20 | 15.34 | 25.27 |
| b | 18.73 | 14.34 | 23.4 | |
| c | 14.40 | 10.25 | 18.88 | |
| r | 55.86 | 49.38 | 62.53 | |
| SLA | a | 15.41 | 10.99 | 20.21 |
| b | 13.15 | 9.31 | 17.25 | |
| c | 20.39 | 14.67 | 26.46 | |
| r | 59.95 | 52.86 | 66.89 | |
| Amass | a | 23.47 | 17.87 | 29.22 |
| b | 15.91 | 12.05 | 20.27 | |
| c | 13.92 | 9.78 | 18.56 | |
| r | 56.38 | 49.40 | 63.03 | |
| WUEi | a | 21.38 | 16.04 | 27.04 |
| b | 19.35 | 14.71 | 24.05 | |
| c | 16.98 | 12.47 | 21.80 | |
| r | 49.23 | 42.41 | 55.98 |
Note: a, SW pure effect; b, SW and BA share effect; c, BA pure effect; r, residual. Nmass, leaf nitrogen concentration per unit mass; Pmass, leaf phosphorus concentration per unit mass; N/P, leaf nitrogen to phosphorus ratio per unit mass; P50, the pressure causing 50% loss of stem hydraulic conductivity; Ks, sapwood-specific hydraulic conductivity; WD, sapwood density; SLA, specific leaf area; Amass, maximum CO2 assimilation rate per unit mass; WUEi, instantaneous photosynthetic water-use efficiency.
References
- Enquist, B.J.; Enquist, C.A.F. Long-term change within a Neotropical forest: assessing differential functional and floristic responses to disturbance and drought. Glob. Chang. Biol. 2011, 17, 1408–1424. [Google Scholar] [CrossRef]
- Esquivel-Muelbert, A.; Baker, T.R.; Dexter, K.G.; Lewis, S.L.; Brienen, R.J.W.; Feldpausch, T.R.; Lloyd, J.; Monteagudo-Mendoza, A.; Arroyo, L.; Alvarez-Davila, E.; et al. Compositional response of Amazon forests to climate change. Glob. Chang. Biol. 2019, 25, 39–56. [Google Scholar] [CrossRef] [PubMed]
- Ge, X.-Y.M.; Scholl, J.P.; Basinger, U.; Huxman, T.E.; Venable, D.L. Functional trait trade-off and species abundance: insights from a multi-decadal study. Ecol. Lett. 2019, 22, 583–592. [Google Scholar] [CrossRef] [PubMed]
- Van Mantgem, P.J.; Stephenson, N.L.; Byrne, J.C.; Daniels, L.D.; Franklin, J.F.; Fule, P.Z.; Harmon, M.E.; Larson, A.J.; Smith, J.M.; Taylor, A.H.; et al. Widespread Increase of Tree Mortality Rates in the Western United States. Science 2009, 323, 521–524. [Google Scholar] [CrossRef]
- Zeppel, M.J.B.; Harrison, S.P.; Adams, H.D.; Kelley, D.I.; Li, G.; Tissue, D.T.; Dawson, T.E.; Fensham, R.; Medlyn, B.E.; Palmer, A.; et al. Drought and resprouting plants. New Phytol. 2015, 206, 583–589. [Google Scholar] [CrossRef] [PubMed]
- Feeley, K.J.; Davies, S.J.; Perez, R.; Hubbell, S.P.; Foster, R.B. Directional changes in the species composition of a tropical forest. Ecology 2011, 92, 871–882. [Google Scholar] [CrossRef] [PubMed]
- Fauset, S.; Baker, T.R.; Lewis, S.L.; Feldpausch, T.R.; Affum-Baffoe, K.; Foli, E.G.; Hamer, K.C.; Swaine, M.D. Drought-induced shifts in the floristic and functional composition of tropical forests in Ghana. Ecol. Lett. 2012, 15, 1120–1129. [Google Scholar] [CrossRef]
- Butt, N.; Malhi, Y.; New, M.; Macia, M.J.; Lewis, S.L.; Lopez-Gonzalez, G.; Laurance, W.F.; Laurance, S.; Luizao, R.; Andrade, A.; et al. Shifting dynamics of climate-functional groups in old-growth Amazonian forests. Plant. Ecol. Divers. 2014, 7, 267–279. [Google Scholar] [CrossRef]
- McIntyre, P.J.; Thorne, J.H.; Dolanc, C.R.; Flint, A.L.; Flint, L.E.; Kelly, M.; Ackerly, D.D. Twentieth-century shifts in forest structure in California: Denser forests, smaller trees, and increased dominance of oaks. Proc. Natl. Acad. Sci. USA 2015, 112, 1458–1463. [Google Scholar] [CrossRef]
- Li, R.H.; Zhu, S.D.; Chen, H.Y.H.; John, R.; Zhou, G.Y.; Zhang, D.Q.; Zhang, Q.M.; Ye, Q. Are functional traits a good predictor of global change impacts on tree species abundance dynamics in a subtropical forest? Ecol. Lett. 2015, 18, 1181–1189. [Google Scholar] [CrossRef]
- Zhang, J.; Huang, S.; He, F. Half-century evidence from western Canada shows forest dynamics are primarily driven by competition followed by climate. Proc. Natl. Acad. Sci. USA 2015, 112, 4009–4014. [Google Scholar] [CrossRef] [PubMed]
- Zhou, G.Y.; Houlton, B.Z.; Wang, W.T.; Huang, W.J.; Xiao, Y.; Zhang, Q.M.; Liu, S.Z.; Cao, M.; Wang, X.H.; Wang, S.L.; et al. Substantial reorganization of China’s tropical and subtropical forests: based on the permanent plots. Glob. Chang. Biol. 2014, 20, 240–250. [Google Scholar] [CrossRef] [PubMed]
- Zhou, G.Y.; Peng, C.H.; Li, Y.L.; Liu, S.Z.; Zhang, Q.M.; Tang, X.L.; Liu, J.X.; Yan, J.H.; Zhang, D.Q.; Chu, G.W. A climate change-induced threat to the ecological resilience of a subtropical monsoon evergreen broad-leaved forest in Southern China. Glob. Chang. Biol. 2013, 19, 1197–1210. [Google Scholar] [CrossRef] [PubMed]
- Zhou, G.Y.; Wei, X.H.; Wu, Y.P.; Liu, S.G.; Huang, Y.H.; Yan, J.H.; Zhang, D.Q.; Zhang, Q.M.; Liu, J.X.; Meng, Z.; et al. Quantifying the hydrological responses to climate change in an intact forested small watershed in Southern China. Glob. Chang. Biol. 2011, 17, 3736–3746. [Google Scholar] [CrossRef]
- Shen, C.D.; Liu, D.S.; Peng, S.L.; Sun, Y.M.; Jiang, M.T.; Yi, W.X.; Xing, C.P.; Gao, Q.Z.; Li, Z.; Zhou, G.Y. C-14 measurement of forest soils in Dinghushan Biosphere Reserve. Chin. Sci. Bull. 1999, 44, 251–256. [Google Scholar] [CrossRef]
- Zhou, G.Y.; Liu, S.G.; Li, Z.; Zhang, D.Q.; Tang, X.L.; Zhou, C.Y.; Yan, J.H.; Mo, J.M. Old-growth forests can accumulate carbon in soils. Science 2006, 314, 1417. [Google Scholar] [CrossRef]
- Zhu, S.D.; Song, J.J.; Li, R.H.; Ye, Q. Plant hydraulics and photosynthesis of 34 woody species from different successional stages of subtropical forests. Plant. Cell Environ. 2013, 36, 879–891. [Google Scholar] [CrossRef]
- Chave, J.; Coomes, D.; Jansen, S.; Lewis, S.L.; Swenson, N.G.; Zanne, A.E. Towards a worldwide wood economics spectrum. Ecol. Lett. 2009, 12, 351–366. [Google Scholar] [CrossRef]
- Diaz, S.; Kattge, J.; Cornelissen, J.H.C.; Wright, I.J.; Lavorel, S.; Dray, S.; Reu, B.; Kleyer, M.; Wirth, C.; Prentice, I.C.; et al. The global spectrum of plant form and function. Nature 2016, 529, 167–171. [Google Scholar] [CrossRef]
- Wright, I.J.; Reich, P.B.; Westoby, M.; Ackerly, D.D.; Baruch, Z.; Bongers, F.; Cavender-Bares, J.; Chapin, T.; Cornelissen, J.H.C.; Diemer, M.; et al. The worldwide leaf economics spectrum. Nature 2004, 428, 821–827. [Google Scholar] [CrossRef]
- Diaz, S.; Hodgson, J.G.; Thompson, K.; Cabido, M.; Cornelissen, J.H.C.; Jalili, A.; Montserrat-Marti, G.; Grime, J.P.; Zarrinkamar, F.; Asri, Y.; et al. The plant traits that drive ecosystems: Evidence from three continents. J. Veg. Sci. 2004, 15, 295–304. [Google Scholar] [CrossRef]
- Reich, P.B.; Ellsworth, D.S.; Walters, M.B.; Vose, J.M.; Gresham, C.; Volin, J.C.; Bowman, W.D. Generality of leaf trait relationships: A test across six biomes. Ecology 1999, 80, 1955–1969. [Google Scholar] [CrossRef]
- Anderegg, W.R.L.; Klein, T.; Bartlett, M.; Sack, L.; Pellegrini, A.F.A.; Choat, B.; Jansen, S. Meta-analysis reveals that hydraulic traits explain cross-species patterns of drought-induced tree mortality across the globe. Proc. Natl. Acad. Sci. USA 2016, 113, 5024–5029. [Google Scholar] [CrossRef] [PubMed]
- Kunstler, G.; Falster, D.; Coomes, D.A.; Hui, F.; Kooyman, R.M.; Laughlin, D.C.; Poorter, L.; Vanderwel, M.; Vieilledent, G.; Wright, S.J.; et al. Plant functional traits have globally consistent effects on competition. Nature 2016, 529, 204–207. [Google Scholar] [CrossRef] [PubMed]
- Poorter, L.; McDonald, I.; Alarcon, A.; Fichtler, E.; Licona, J.-C.; Pena-Claros, M.; Sterck, F.; Villegas, Z.; Sass-Klaassen, U. The importance of wood traits and hydraulic conductance for the performance and life history strategies of 42 rainforest tree species. New Phytol. 2010, 185, 481–492. [Google Scholar] [CrossRef]
- Dalu, T.; Wasserman, R.J.; Magoro, M.L.; Mwedzi, T.; Froneman, P.W.; Weyl, O.L.F. Variation partitioning of benthic diatom community matrices: Effects of multiple variables on benthic diatom communities in an Austral temperate river system. Sci. Total Environ. 2017, 601, 73–82. [Google Scholar] [CrossRef]
- Choat, B.; Jansen, S.; Brodribb, T.J.; Cochard, H.; Delzon, S.; Bhaskar, R.; Bucci, S.J.; Feild, T.S.; Gleason, S.M.; Hacke, U.G.; et al. Global convergence in the vulnerability of forests to drought. Nature 2012, 491, 752. [Google Scholar] [CrossRef]
- Chen, Y.J.; Cao, K.F.; Schnitzer, S.A.; Fan, Z.X.; Zhang, J.L.; Bongers, F. Water-use advantage for lianas over trees in tropical seasonal forests. New Phytol. 2015, 205, 128–136. [Google Scholar] [CrossRef]
- Allen, C.D.; Breshears, D.D.; McDowell, N.G. On underestimation of global vulnerability to tree mortality and forest die-off from hotter drought in the Anthropocene. Ecosphere 2015, 6, 129. [Google Scholar] [CrossRef]
- McDowell, N.G.; Allen, C.D. Darcy’s law predicts widespread forest mortality under climate warming. Nat. Clim. Chang. 2015, 5, 669–672. [Google Scholar] [CrossRef]
- AghaKouchak, A.; Cheng, L.Y.; Mazdiyasni, O.; Farahmand, A. Global warming and changes in risk of concurrent climate extremes: Insights from the 2014 California drought. Geophys. Res. Lett. 2014, 41, 8847–8852. [Google Scholar] [CrossRef]
- Piao, S.L.; Ciais, P.; Huang, Y.; Shen, Z.H.; Peng, S.S.; Li, J.S.; Zhou, L.P.; Liu, H.Y.; Ma, Y.C.; Ding, Y.H.; et al. The impacts of climate change on water resources and agriculture in China. Nature 2010, 467, 43–51. [Google Scholar] [CrossRef]
- Zscheischler, J.; Westra, S.; van den Hurk, B.; Seneviratne, S.I.; Ward, P.J.; Pitman, A.; AghaKouchak, A.; Bresch, D.N.; Leonard, M.; Wahl, T.; et al. Future climate risk from compound events. Nat. Clim. Chang. 2018, 8, 469–477. [Google Scholar] [CrossRef]
- Lewis, S.L.; Brando, P.M.; Phillips, O.L.; van der Heijden, G.M.F.; Nepstad, D. The 2010 Amazon Drought. Science 2011, 331, 554. [Google Scholar] [CrossRef] [PubMed]


© 2020 by the authors. Licensee MDPI, Basel, Switzerland. This article is an open access article distributed under the terms and conditions of the Creative Commons Attribution (CC BY) license (http://creativecommons.org/licenses/by/4.0/).