Article

Tree Regeneration Structure Following Beech Bark Disease-Motivated Harvests: Factors Associated with Patterns and Management Implications

by
Lucas M. Elenitsky
,
Michael B. Walters
* and
Evan J. Farinosi
Department of Forestry, Michigan State University, East Lansing, MI 48824, USA
*
Author to whom correspondence should be addressed.
Forests 2020, 11(2), 180; https://doi.org/10.3390/f11020180
Submission received: 1 December 2019 / Revised: 24 January 2020 / Accepted: 1 February 2020 / Published: 6 February 2020
(This article belongs to the Section Forest Ecology and Management)

Abstract

:
In the northern Appalachian region of North America, mortality of mature American beech (Fagus grandifolia Ehrh.) via the introduced beech bark disease (BBD) can result in dense thickets of beech saplings that inhibit the regeneration of other species. It is unknown if similar structures characterize more recently infested managed forests in the Great Lakes region. If these dense beech sapling layers do exist, management would be aided by knowing which site/regional factors they are associated with and by identifying particular sapling structures that may threaten the sustainability of these forests under current management paradigms. To examine these patterns, we used a natural experiment with sample plots in 69 unevenly aged, selection silviculture-managed, maple (Acer spp.)-dominated northern hardwood stands. Our stands were dispersed across northern Michigan, USA and had undergone BBD-motivated partial harvests favoring beech removal (mean = 5.5 years before measurement). In each stand, we quantified tree regeneration structure in relation to winter deer use (fecal pellet count density), site quality (habitat type), geographic region (Eastern Upper Peninsula and Northern Lower Peninsula), and multiple measures of overstory stand density. We also examined the density effects of taller regeneration strata on subordinate strata. Across sites, the small sapling recruit class (i.e., >137 cm tall and <5 cm diameter at 137 cm tall) was dominated by beech and was often dense (44% of subplots > 2000 stems ha−1 and 16% of subplots > 5000 ha−1) but never exceeded the > 10,000 stems ha−1 reported in the northern Appalachian region. Beech sapling density was higher in the Northern Lower Peninsula, on lower quality sites, at lower postharvest overstory densities, and on sites with higher densities of preharvest overstory beech. In contrast to the beech-dominated small sapling recruit class, seedlings (i.e., <25 cm tall) were generally more species diverse than sapling strata and were dominated by maple species. Although generally dense, seedling density was negatively related to small sapling recruit density, suggesting that saplings may suppress the seedling stratum. The general pattern for the small sapling recruit layer of browsing-insensitive beech (and ironwood, Ostrya virginiana Mill. K. Koch) dominance and low representation of browsing-sensitive species (e.g., Acer spp.) circumstantially supports the notion that regeneration structure is heavily influenced by deer. However, current deer use was generally low in our stands, and relationships with tree regeneration structure were weak. Instead, regeneration structure is likely shaped by a combination of factors operating at long time scales (i.e., legacies of deer browsing pressure, selection silviculture (given beech and ironwood are shade tolerant), overstory composition, and site quality) and by those effects that are more proximal, such as postharvest overstory density. Minimum stocking criteria for species considered desirable for management (e.g., sugar maple and Acer saccharum Marshall) suggest many stands are inadequately stocked in the sapling recruit classes. Although future regeneration dynamics are unclear, current patterns suggest that many stands with high beech/ironwood small sapling recruit densities may require management intervention to overcome insufficient recruitment of species targeted for management.

1. Introduction

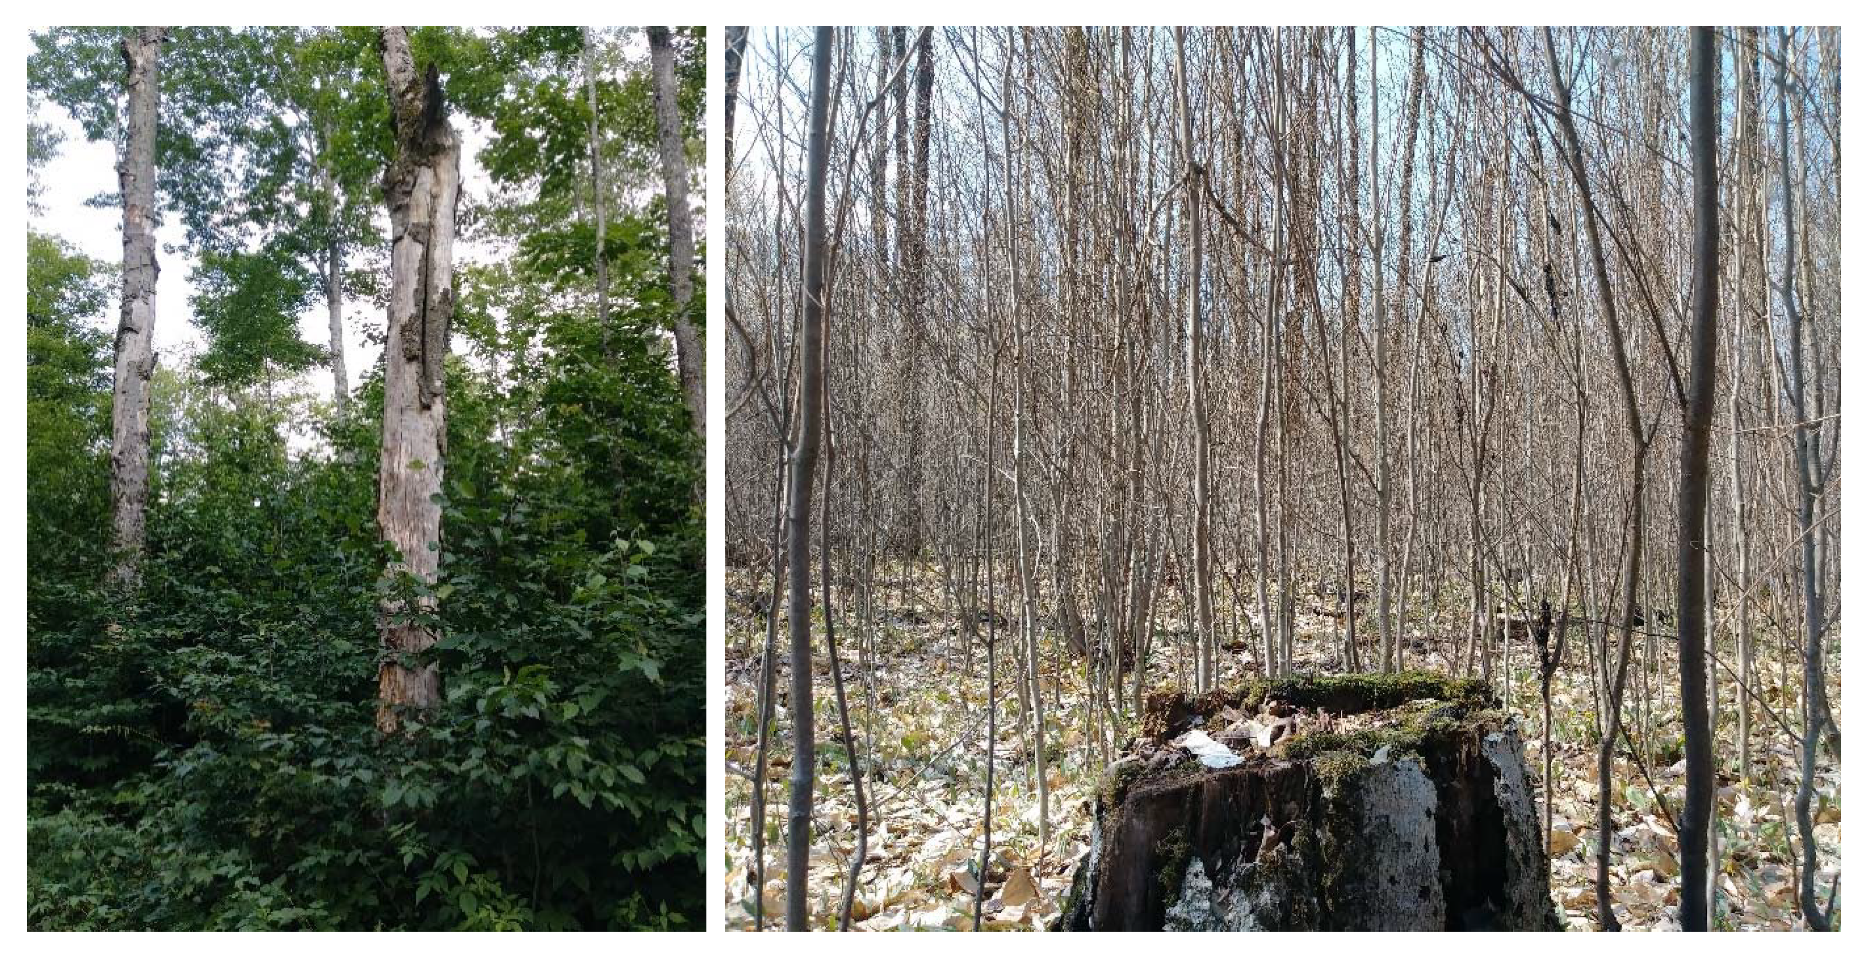
1.1. Beech Bark Disease, Beech Regeneration Responses, and Implications for Forest Dynamics

Beech bark disease (BBD) infects and kills American beech (Fagus grandifolia Ehrh.) trees [1,2]. As mature beech mortality has increased in many mixed-species mesic temperate forests, understory beech density has been shown to increase (in part via root suckering), resulting in dense, competitively dominant beech thickets [3,4,5]. These dense understories may stagnate, may become re-infected, and may sprout again, potentially resulting in long-term beech-dominated understories [6], decreased density and species diversity of other tree regeneration (i.e., seedlings and small saplings) [3], and diminished non-beech sapling recruitment [7,8]. Over time, this cycle may dramatically alter the structure and composition of forests, resulting in decreased forest productivity, timber value, hard mast production for wildlife, and resilience to future pests/pathogens. These patterns have been observed in the northern Appalachian region of North America, where BBD has been present for decades following its accidental introduction to Nova Scotia, Canada in 1929 [1]. Given differences in forest composition, climate, and forest management/exploitation history, patterns may be different in Michigan forests close to the northwestern edge of beech’s natural range, where BBD is relatively new (i.e., first reported in 2000 [9]). Limited data suggest that there are regional differences, as thickets described in northern Appalachian forests [3,10,11] have not been reported in Michigan [12,13]. However, the effects of BBD on regeneration dynamics in Michigan forests are just being realized and warrant continued study.

1.2. Factors Potentially Influencing BBD Effects on Beech Regneration Patterns

Other factors in addition to BBD may affect beech regeneration patterns. Northern hardwood forests with a beech component grow on a relatively broad range of site qualities (i.e., soil moisture/nutrient regimes). Beech also grows over broad geographic-climatic extents; it is found from Nova Scotia to Wisconsin and from Texas to Florida. Sites specific to regional edaphic and climate variation can result in different tree species compositions, productivity potentials, and competitive interactions [14], with implications for beech regeneration dynamics. Selective browsing pressure from white-tailed deer (Odocoileus virginianus Zimmermann) is also spatially variable and can strongly affect regeneration dynamics. In the Great Lakes region, high deer browsing pressure can nearly eradicate browsing-sensitive species including sugar maple (Acer saccharum Marsh.) and eastern hemlock (Tsuga canadensis (L.) Carr) and can increase representation of browsing-insensitive species including American beech, ironwood (Ostrya virginiana (Mill.) K Koch) [15] and black cherry (Prunus serotina Ehrh.) [16]. Frigoletto et al. [17] conducted a long-term experiment in Pennsylvania utilizing deer exclosures and concluded that the absence of deer in BBD-impacted forests reduced the relative importance of beech root sprouts from 60% to 25%, implying that intense deer browsing pressure may exacerbate effects of BBD and further diminish the diversity, resilience, and productivity of northern hardwood forests. In addition, residual stand densities following partial harvesting can vary, creating a range of possible light environments for beech regeneration and its competitors.
Legacies of forest and deer management may also affect current patterns of regeneration. In the Great Lakes region, forests were largely cut over in the late 19th and early 20th centuries: first for conifers and then for hardwoods. This era also included unsustainable rates of white-tailed deer hunting. Since the end of the exploitation era, maple-dominated northern hardwood forests with a beech component have been managed on public and industrial forest lands, starting in the 1950s [18]. On state-owned lands in Michigan, early harvesting concentrated on thinning, including timber stand improvement prescriptions focused on removing less economically desirable and poorly formed trees. This was followed, from the 1980s onward, with single-tree and small group selection silviculture focused on the development and harvesting of high-quality sugar maple stems combined with the removal of less desirable species and overstocked diameter classes (Tim Greco, Michigan Department of Natural Resources, personal communication). Given that many current stands originated following nearly complete cutover, most contemporary stands are thought to be evenly aged and roughly 100–120 years old [19] (C. Henry, unpublished data). Even before BBD-motivated partial harvests (i.e., preferential removal of beech) began in the mid-2000s, the history of selection silviculture and high deer populations (which had rebounded from overhunting via successful protection/regulation [20]) may have already favored beech regeneration. Small, low-light harvest gaps created by selection harvesting are unfavorable environments for shade-intolerant and mid-tolerant species, limiting the potential regeneration pool to shade-tolerant species [21,22,23]. The use of this system in the mesic northern hardwood forests of the Great Lakes region has been intentional, as it is intended to favor shade-tolerant, economically valuable sugar maple. However, selective browsing by deer further reduces the pool of species capable of producing sapling recruits (i.e., >137 cm tall) to the few species that are both shade-tolerant and browsing-insensitive (e.g., ironwood and beech), while eliminating browsing-sensitive species (e.g., Acer spp.) [24]. Furthermore, recent BBD-motivated partial harvesting may further increase beech regeneration density through prodigious root suckering. If a dense beech sapling stratum forms as a result of these factors, it could reinforce its dominance and could persist in the long term by negatively affecting subordinate regeneration classes via light limitation and other mechanisms.
Attributing causality to BBD-motivated harvests vs. past legacies of selection system management and deer is not the motivation of this research. Rather, northern hardwood forests that have or had high admixtures of beech and that have been the target of BBD-motivated partial harvests are reasonably expected to have high beech regeneration densities, possibly rivaling the densities of thickets documented in the northern Appalachian region. Furthermore, these beech sapling densities could potentially pose challenges to continued sustainable management of maple-dominated northern hardwood forests. However, beech densities may not be uniformly high across BBD-motivated partial harvests and may vary with several factors, including variation in residual overstory density, site quality, present deer use, and region. Quantifying these patterns can aid in understanding potential causes of dense beech regeneration layers and the future management of these stands.

1.3. Objectives

In this study, we (1) quantify tree regeneration structure of beech and other species in stands following BBD-motivated partial harvests; (2) assess effects of current deer use, site quality, geographic region, and three different measures of overstory density on tree regeneration structure; (3) examine relationships between taller tree regeneration strata and subordinate strata; and (4) discuss the relevance of our findings to managing regeneration layers with a dense beech component. Data used to accomplish these objectives were collected from 69 stands partially harvested (with prioritization of beech removal) 4–7 years prior to measurement.

2. Materials and Methods

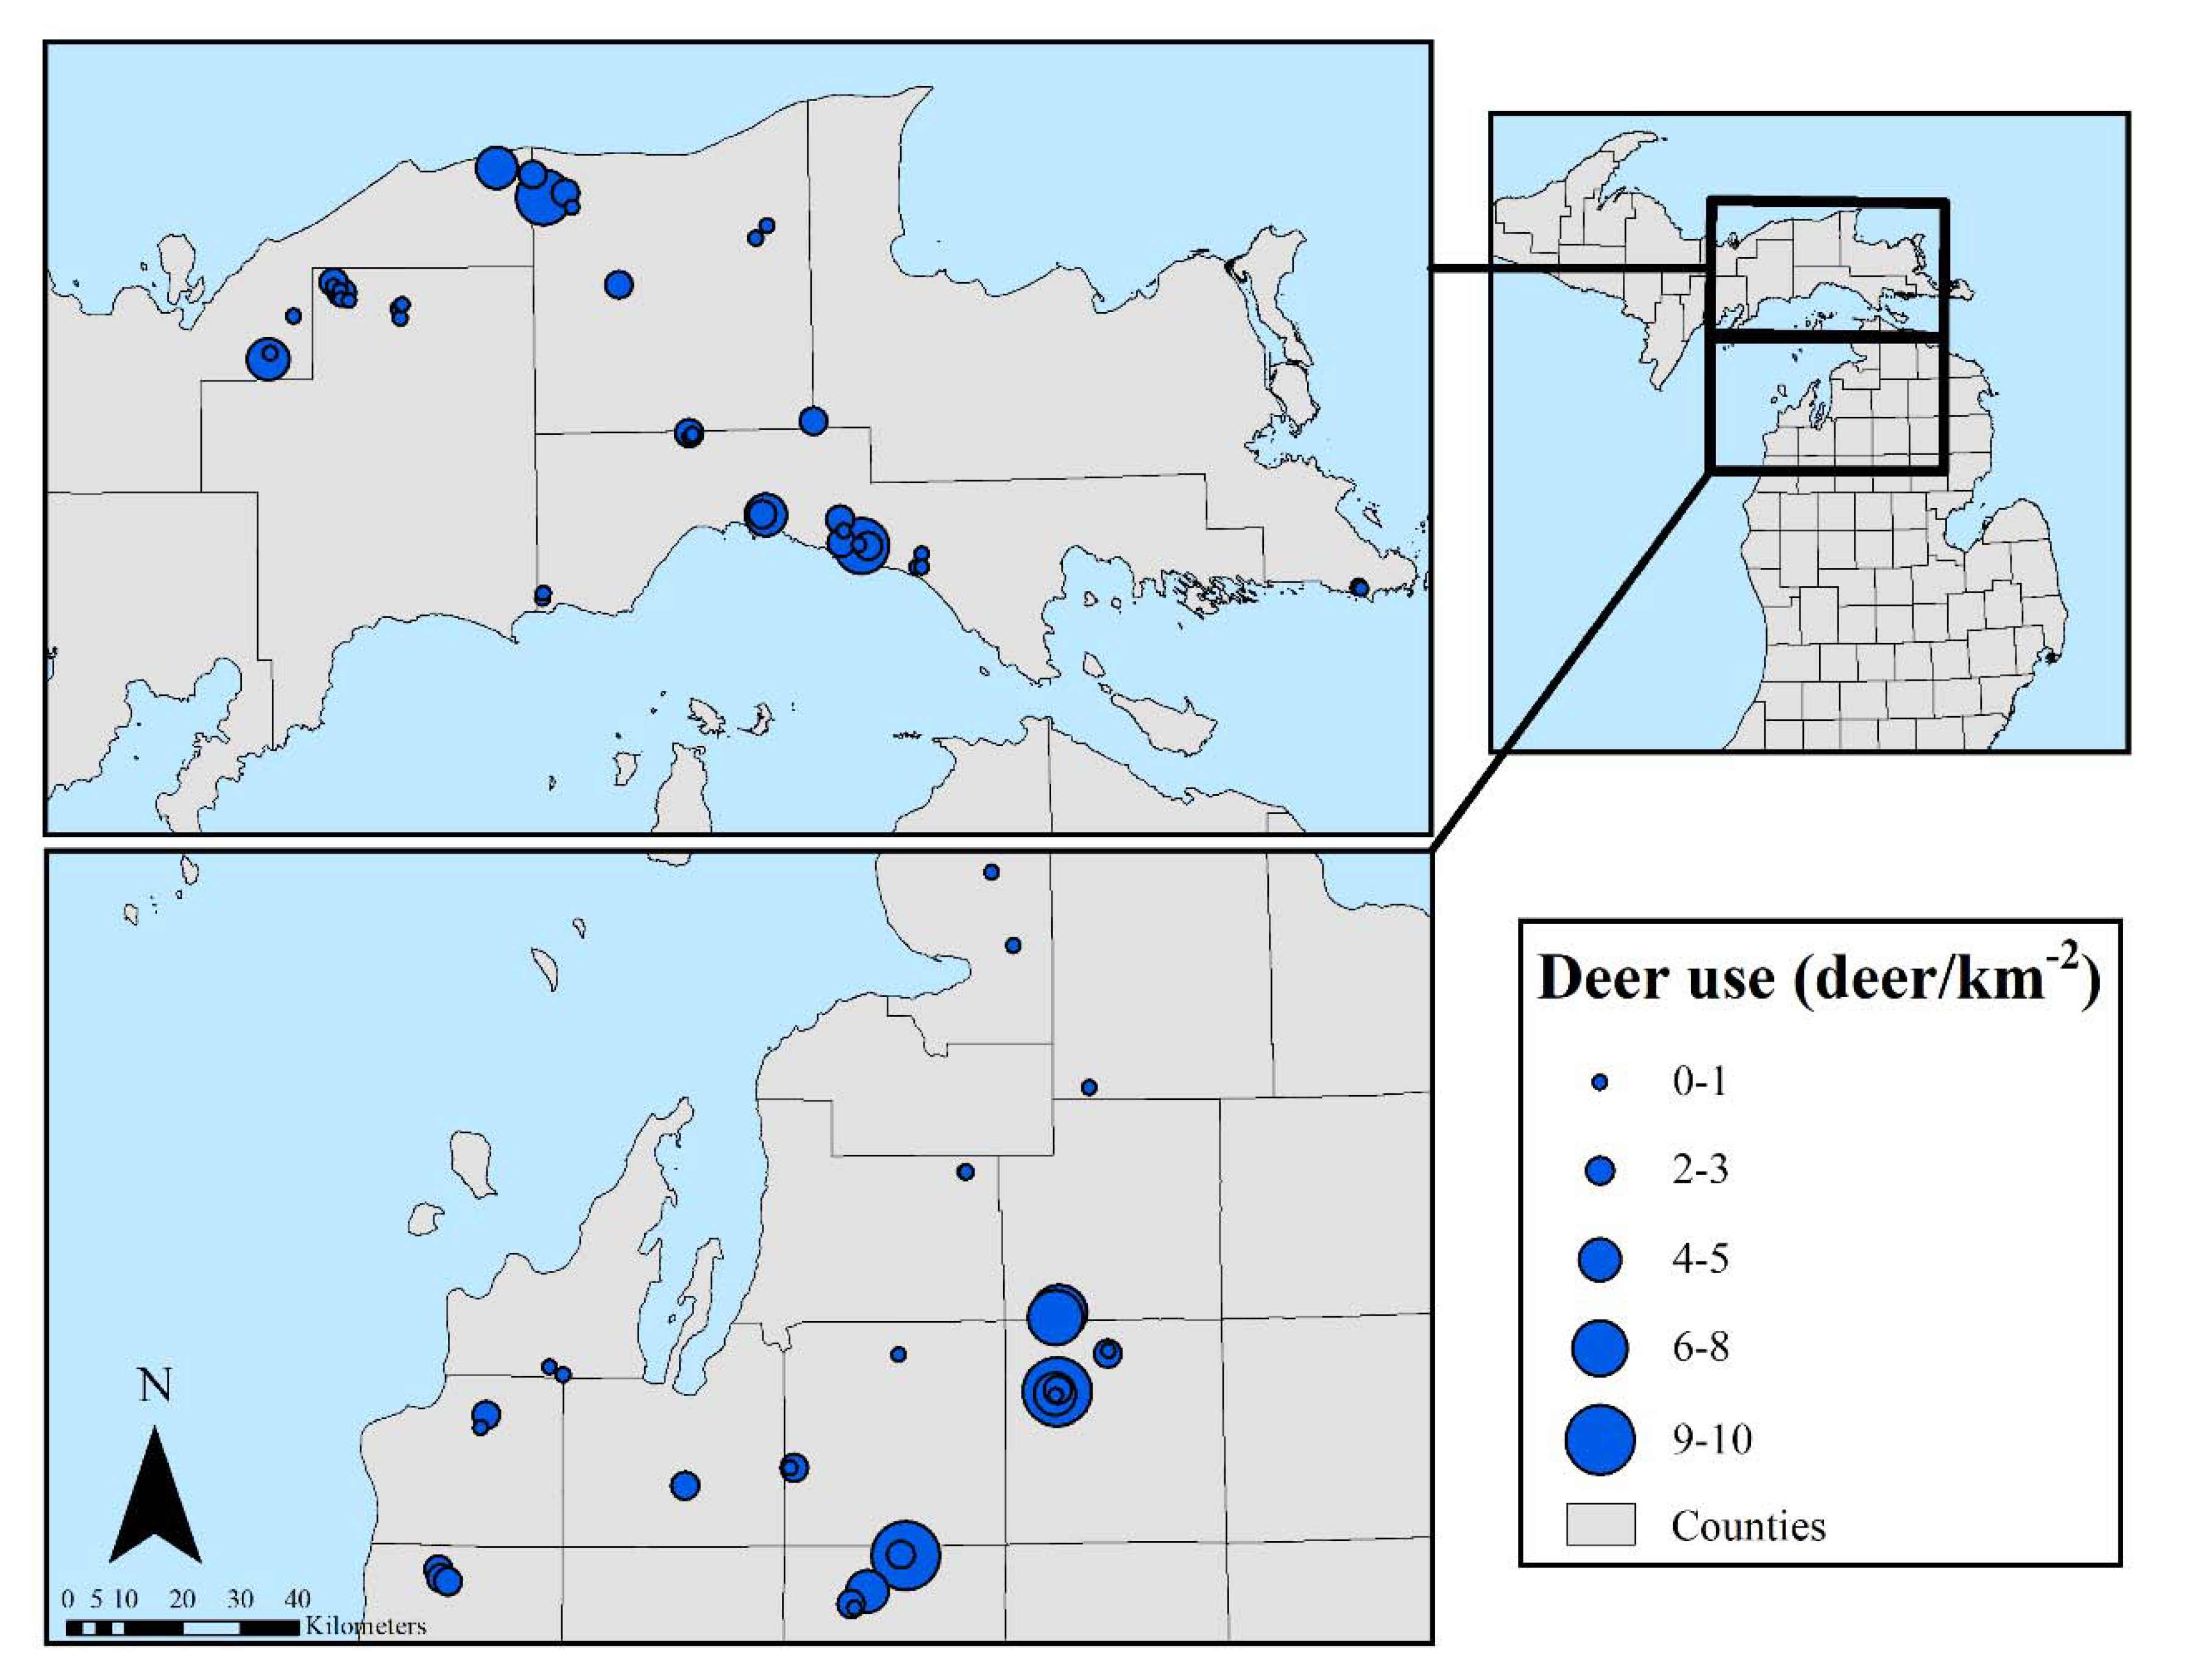
2.1. Study Area and Stand Selection

Our 69 study plots were located in two regions, with 29 in the Northern Lower Peninsula (NLP) and 40 in the Eastern Upper Peninsula (EUP) of Michigan. Each plot was in a unique northern hardwood stand (as defined by management inventory) on state-owned land managed by the Michigan Department of Natural Resources (MDNR). On average, the EUP is colder than the NLP across all seasons, and areas along the Great Lakes shorelines experience warmer temperatures and longer growing seasons in comparison to interior areas [25]. Mean annual temperatures in these regions range from 3.9–7.8 °C, and precipitation ranges from 73.0–95.6 cm (30 year normal, 1981–2010) [26]. Stands (or sites) in this study occurred over a gradient of soil types ranging from excessively well-drained sandy soils to moderately drained sandy loams [14]. Stands in the EUP are typically imbedded within large stretches of continuous forest, while stands in the NLP are in more fragmented forests. Northern hardwood forests on federal, state, and industrial properties in Michigan have predominately been managed since the 1960s by unevenly aged single-tree selection silviculture with a harvest frequency of 10–20 years to a target residual BA ranging from 17–20 m2/ha [27].
Plots were established and measured from June–October 2017 using inventory and sales data and local knowledge from MDNR timber management specialists. Final criteria for plots were their location in stands that, due to a high beech component, were targeted for BBD-motivated partial harvests with timber sales closing between 2006 and 2016. Our original objective was to develop a balanced representation of stands across regions and habitat types and a narrower range of time since timber sales closed. However, even after broadening our time-since-sale-closing range, we could only identify 69 stands and proceeded to use all of them. This resulted in an unbalanced design for regions and habitat types.

2.2. Measurements

In each stand, square 2.02 ha plots (5 acres) composed of a three by three lattice of nine subplots were pre-mapped at a random location (Figure 1). Plots were then located with GPS and visually inspected to ensure presence of overstory beech (live, dead, or harvested) due to the heterogeneous distribution of overstory beech within MDNR-defined stands. If plots did not meet our criteria for beech presence (i.e., overstory trees, stumps, or snags in at least 1/3 of subplots), a new plot was randomly located and the process was repeated until the beech criterion was met. Sites were stratified post hoc over two regions (NLP and EUP) and three habitat types (high, medium, and low soil moisture/nutrient regimes unique to each peninsula) to assess the predictive power of these variables on tree species composition and density.
Habitat type, an indicator of site soil moisture and nutrient regimes (i.e., site quality) [14], was determined in lesser disturbed portions of the forest near each subplot. Using habitat types as a predictor for tree regeneration strata in this research served both to separate forest stand variation into ecologically and functionally meaningful categories (i.e., productivity, composition, or potential composition) and to produce results that can be directly translated and applied by forest managers. Habitat types supporting northern hardwood forest with a beech component in the NLP are Acer saccharum-Fagus grandifolia/Osmorhiza claytonii-Caulophyllum thalictroides (AFOCa, mesic moisture regime; rich to very rich nutrient regime), Acer saccharum-Fagus grandifolia/Osmorhiza claytonii (AFO, mesic; medium to rich), and Pinus strobus-Acer rubrum/Vaccinium-Viburnum acerifolium (PArVVb, dry to dry mesic; poor to medium). Classifications in the EUP include Acer saccharum-Fagus grandifolia/Osmorhiza claytonii-Arisaema atrorubens (AFOAs, mesic; medium to rich), Acer saccharum-Fagus grandifolia/Polygonatum pubescens (AFPo, mesic, medium), and Acer saccharum-Tsuga canadensis-Fagus grandifolia/Dryopteris spinulosa (ATFD, dry-mesic to mesic; poor to medium) (Figure 2).
We estimated deer use by performing fecal pellet count surveys within each site. Pellet counts have inherent limitations, including only quantifying deer use from approximately late October (Autumn deciduous leaf fall) to late April (pellet count date), the loss of pellet groups due to rain or insects, and observer bias. Despite these limitations, pellet count data are reasonably accurate in comparison to other deer density methodologies and can be applied over large landscape level areas [28,29]. We established six 4-m wide transects ranging in length from 47–67 m throughout the grid system of each stand connecting plot centers in all cardinal and intercardinal directions to capture data on overall deer use within study stands (Figure 2). Distribution of transects resulted in a balanced sampling of both subplots making up the outer area (outer-most eight subplots, 89% of transect area, and 88% of total area) and the inner square (inner subplot, 11% of transect area, and 12% of total area) of each site. Total transect area was 0.13 ha (6.4% of total site area) per stand, which was similar, albeit smaller, than samples used to successfully relate deer use to tree regeneration and landscape context (0.2 ha, [30]). Pellet counts were summed for transects at the site level and transformed to a deer per km2 basis following the methods of Hill [31]. This methodology uses pellet density, defecation rate, and time of defecation deposition (autumn leaf fall to census date) to produce an estimate of deer per unit area resulting in a site-level measure of deer use.
Vegetation measurements were taken at the center of all nine subplots using quadrats and nested circular fixed plots designed to efficiently measure stem density [32] and to be consistent with Forest Inventory and Analysis (FIA) plot sizes [33]. Two 1 m2 quadrats were established three meters west (270°) and east (90°) from plot center to avoid sampling vegetation that could be altered due to survey activity at plot center. In quadrats, vegetation density was estimated visually as percent cover to the nearest percent. Broad vegetation categories included grasses and sedges, forbs, ferns, lycophytes, and spring ephemerals. Shrub (any height) and tree seedling (<25 cm tall) percent covers were estimated at the species level. Germination substrate was also visually assessed in quadrats, with categories including coarse woody debris, humus, bare mineral soil, and hardwood litter. For trees > 25 cm tall, we used three concentric circular fixed radius plots (2, 6, and 8 m radii) with a common center point to tally stems by species. Stems > 25 cm tall and <5 cm diameter at 137 cm tall (i.e. diameter at breast height (DBH)) were tallied in the 2-m plot, stems 5.1 to 25.4 cm DBH were tallied in the 6-m radius plot, and stems > 25.4 cm were tallied in the 8-m radius plot. Beech stumps were also tallied within the 8-m radius plot. We split our tree regeneration height classes into two strata: deer browsing vulnerable seedlings and saplings (<137 cm tall) and browsing immune sapling recruits (>137 cm tall) (Table 1). Browsing immune sapling recruits are those that have transcended deer browsing pressure via height growth. Having passed through this potentially narrow demographic bottleneck, they have greatly improved their odds of becoming overstory recruits [34]. Browsing vulnerable/immune strata were subdivided into height class strata (Table 1).

2.3. Statistical Analysis

Given differences between regions in habitat type vegetation descriptions [14] and the expectation that they would differ in other ways (dominant land use pattern, climate, bedrock geology, etc.), we examined the potential, a priori, for splitting our analysis into upper and lower Peninsula data sets. We did this by analyzing differences in vegetation between regions with recursive partitioning and nonparametric variance tests. Recursive partitioning is an exploratory data mining technique that selects optimum splits in data sets through analysis of predictor variables to produce a decision tree [35]. Decision trees were used to assess if habitat types clustered within regions (i.e., unique regional classifications) or by habitat types that overlapped in soil moisture/nutrient regimes between the regions. The three dominant tree species (sugar maple, red maple Acer rubrum L., and American beech; 86% of all stems) were used in this analysis due to their abundance across both regions, unlike regionally specific associate species. Results of recursive partitioning showed clustering of habitat types within regions as opposed to across regions, suggesting unique regional classifications for tree regeneration composition (Appendix A, Figure A1). Nonparametric variance tests with a Bonferroni adjustment (p ≤ 0.0019) were also used to provide further evidence of regionally specific classes. We used nonparametric Wilcoxon exact tests because the distribution of our dataset was non-normal with unequal variance [36]. If regional differences existed, we would expect to see differences between stem-count densities in similar habitat types across regions. Results show that 44% of species-size class-habitat type Wilcoxon test comparisons between regions were significantly different, indicating regional differences in composition at similar soil moisture/nutrient regimes (Appendix A, Table A1). Results of recursive partitioning and Wilcoxon tests, along with the regionally specific habitat classification system in use, led us to separate our data into regional (NLP and EUP) subsets for all further analyses.
For most analyses, stem-count data were summed over the nine subplots by species and size class (Table 1) and analyzed at the plot (stand) scale. Stem-count data were often over-dispersed and zero-inflated, resulting in the decision to model stem counts using generalized regression with a negative binomial distribution and logarithmic link function (fit model platform, JMP Pro 13; SAS Institute, Cary, NC, USA). We began the analysis using the maximum likelihood estimation method; however, it often produced estimates with large and unrealistic variances (e.g., several hundred thousand stems per hectare) due to an imbalance of continuous predictors (basal area and deer use) among habitat types. To alleviate this issue, we used the adaptive elastic net estimation method, a regularized methodology that avoids overfitting and collinearity among parameters [37]. Upon comparison of both methods, the elastic net reduced the problem with inflated variances and resulted in more complex final models which more closely matched ecological expectations for factors influencing stem density. Furthermore, the adaptive elastic net method uses Akaike’s Information Criterion (AICc) validation, removing unimportant effects automatically to arrive at parsimonious model solutions.
For overstory strata, individual species were modelled by region and size class as a function of habitat type. Other predictors (e.g., basal area, deer use, etc.) were not included, as they were irrelevant for larger size classes. In the regeneration strata, species were modelled individually by region and size class as a function of habitat type, deer use, basal area, and their interactions. We considered other predictors, including time since timber sale closing, northing, and annual mean temperature during preliminary analysis, but all were dropped due to lack of predictive power. For individual species, we restricted modeling to only those species contributing > 1% of total composition for the regeneration and overstory strata within a region (11 species). The effect of taller regeneration strata density on seedling density was also examined with a negative binomial generalized regression model.

3. Results

3.1. General Stand Characteristics

Within overstory strata (poletimber and sawtimber), stands across both peninsulas were dominated by sugar maple and/or red maple, averaging 73% of stems, with beech, black cherry, and eastern hemlock as common associates across regions (Appendix A, Figure A2). Regionally specific associates in the NLP included American basswood (Tilia americana L.) on high-quality sites and red oak (Quercus rubra L.) on low-quality sites. With the exception of these two species, overall composition was consistent across habitat types in the NLP. Within the EUP, diversity of species was higher on lower-quality habitat types, with yellow birch (Betula alleghaniensis Britton) and eastern hemlock abundance declining with increasing site quality.
Contrary to recursive partitioning results indicating large differences in tree regeneration composition between regions (Appendix A, Figure A1), several characteristics were similar for NLP and EUP forests (Table 2). The only significant differences between regions was higher preharvest beech basal area (an index, calculated as the sum of basal area of beech stumps, dead trees, and living trees > 10 cm DBH) and current live beech basal area in the NLP than the EUP. In both regions, forest floor substrate was strongly dominated by hardwood litter, and tree seedlings (<25 cm tall) were the best represented cover of forest floor vegetation. Rubus spp. dominated cover in the woody vegetation category (87% of woody vegetation), but mean total woody vegetation cover was low (Table 2). However, while mean plot-level Rubus spp. cover ranged from 0–17%, it ranged from 0–90% at the subplot level, indicating high spatial heterogeneity within stands. Additionally, linear regression of plot data indicated that Rubus spp. cover increased with decreasing current basal area in the EUP (p = 0.0079) but not in the NLP (p > 0.05). Overall, these results indicate that Rubus spp. and other non-tree vegetation was generally low in coverage. Notably, while the range of time since timber sale closing was large, this range was only 4–7 years for 83% of the stands. Furthermore, closing of timber sales lags completion of harvesting, often by a year and sometimes by several years. In particular, the three sites that closed one year before measurements had remained open for several years, with harvesting probably occurring four or more years before data collection based on stump condition (Elenitsky, personal observation).

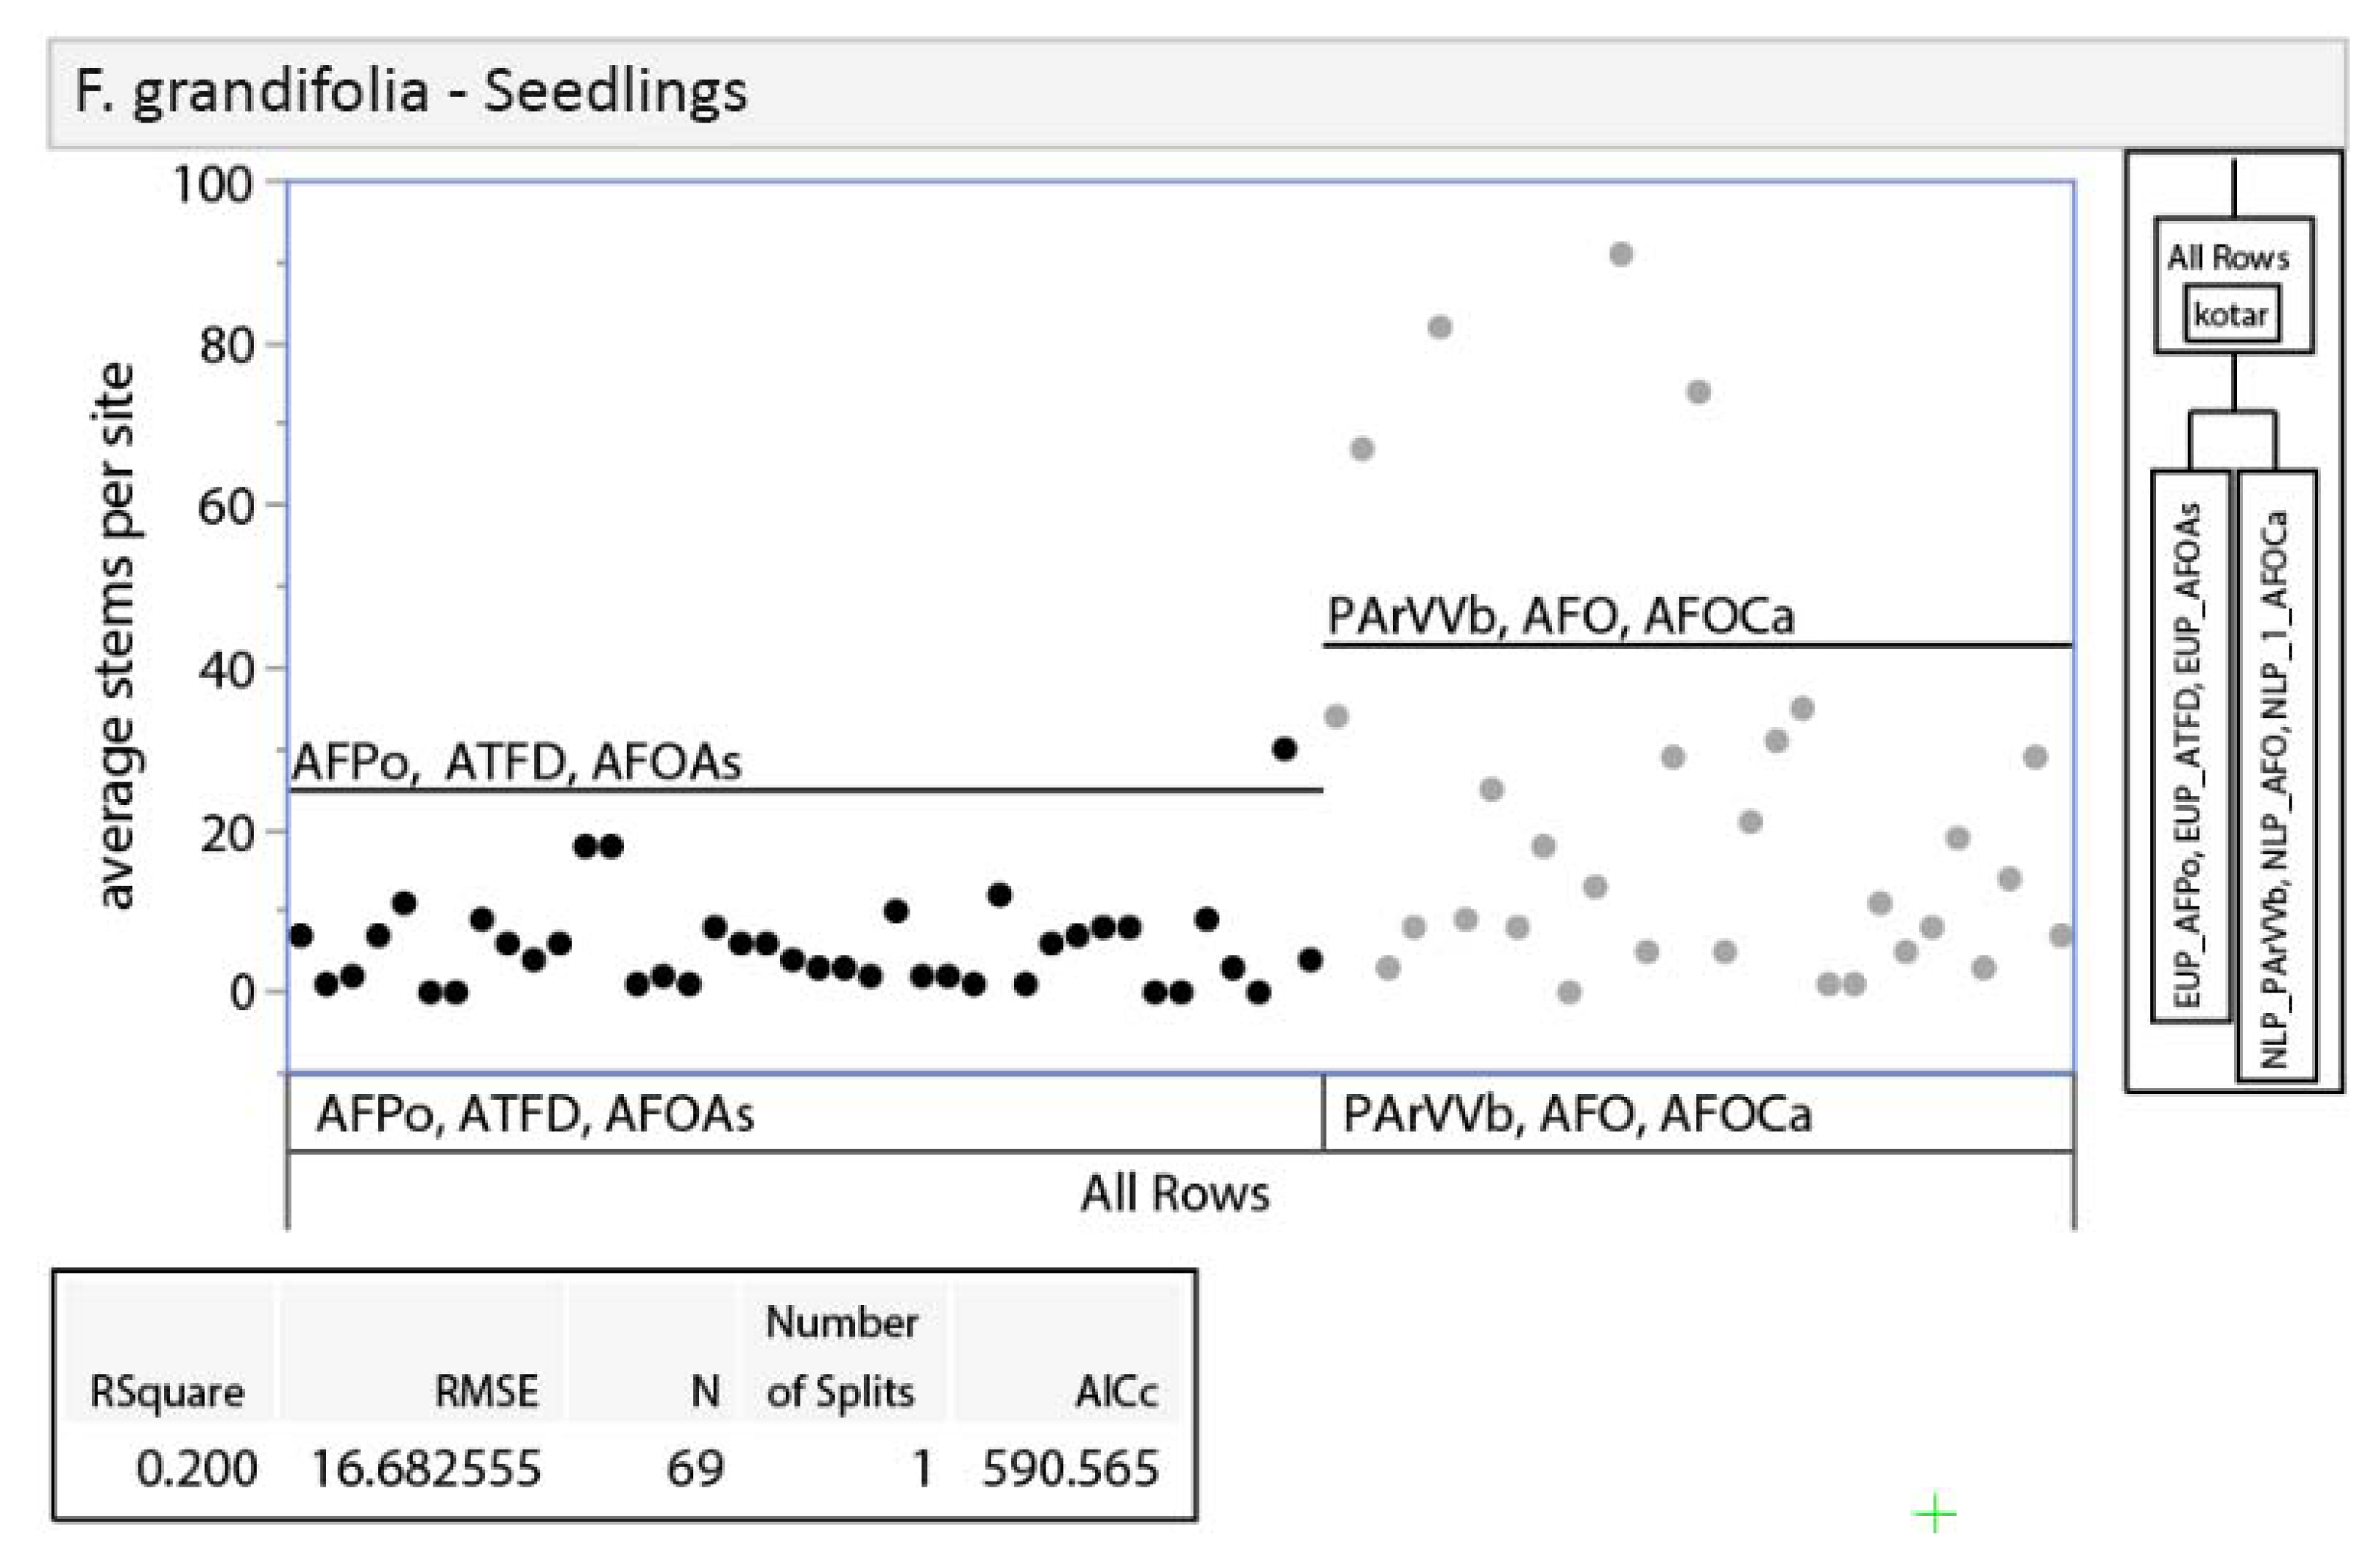
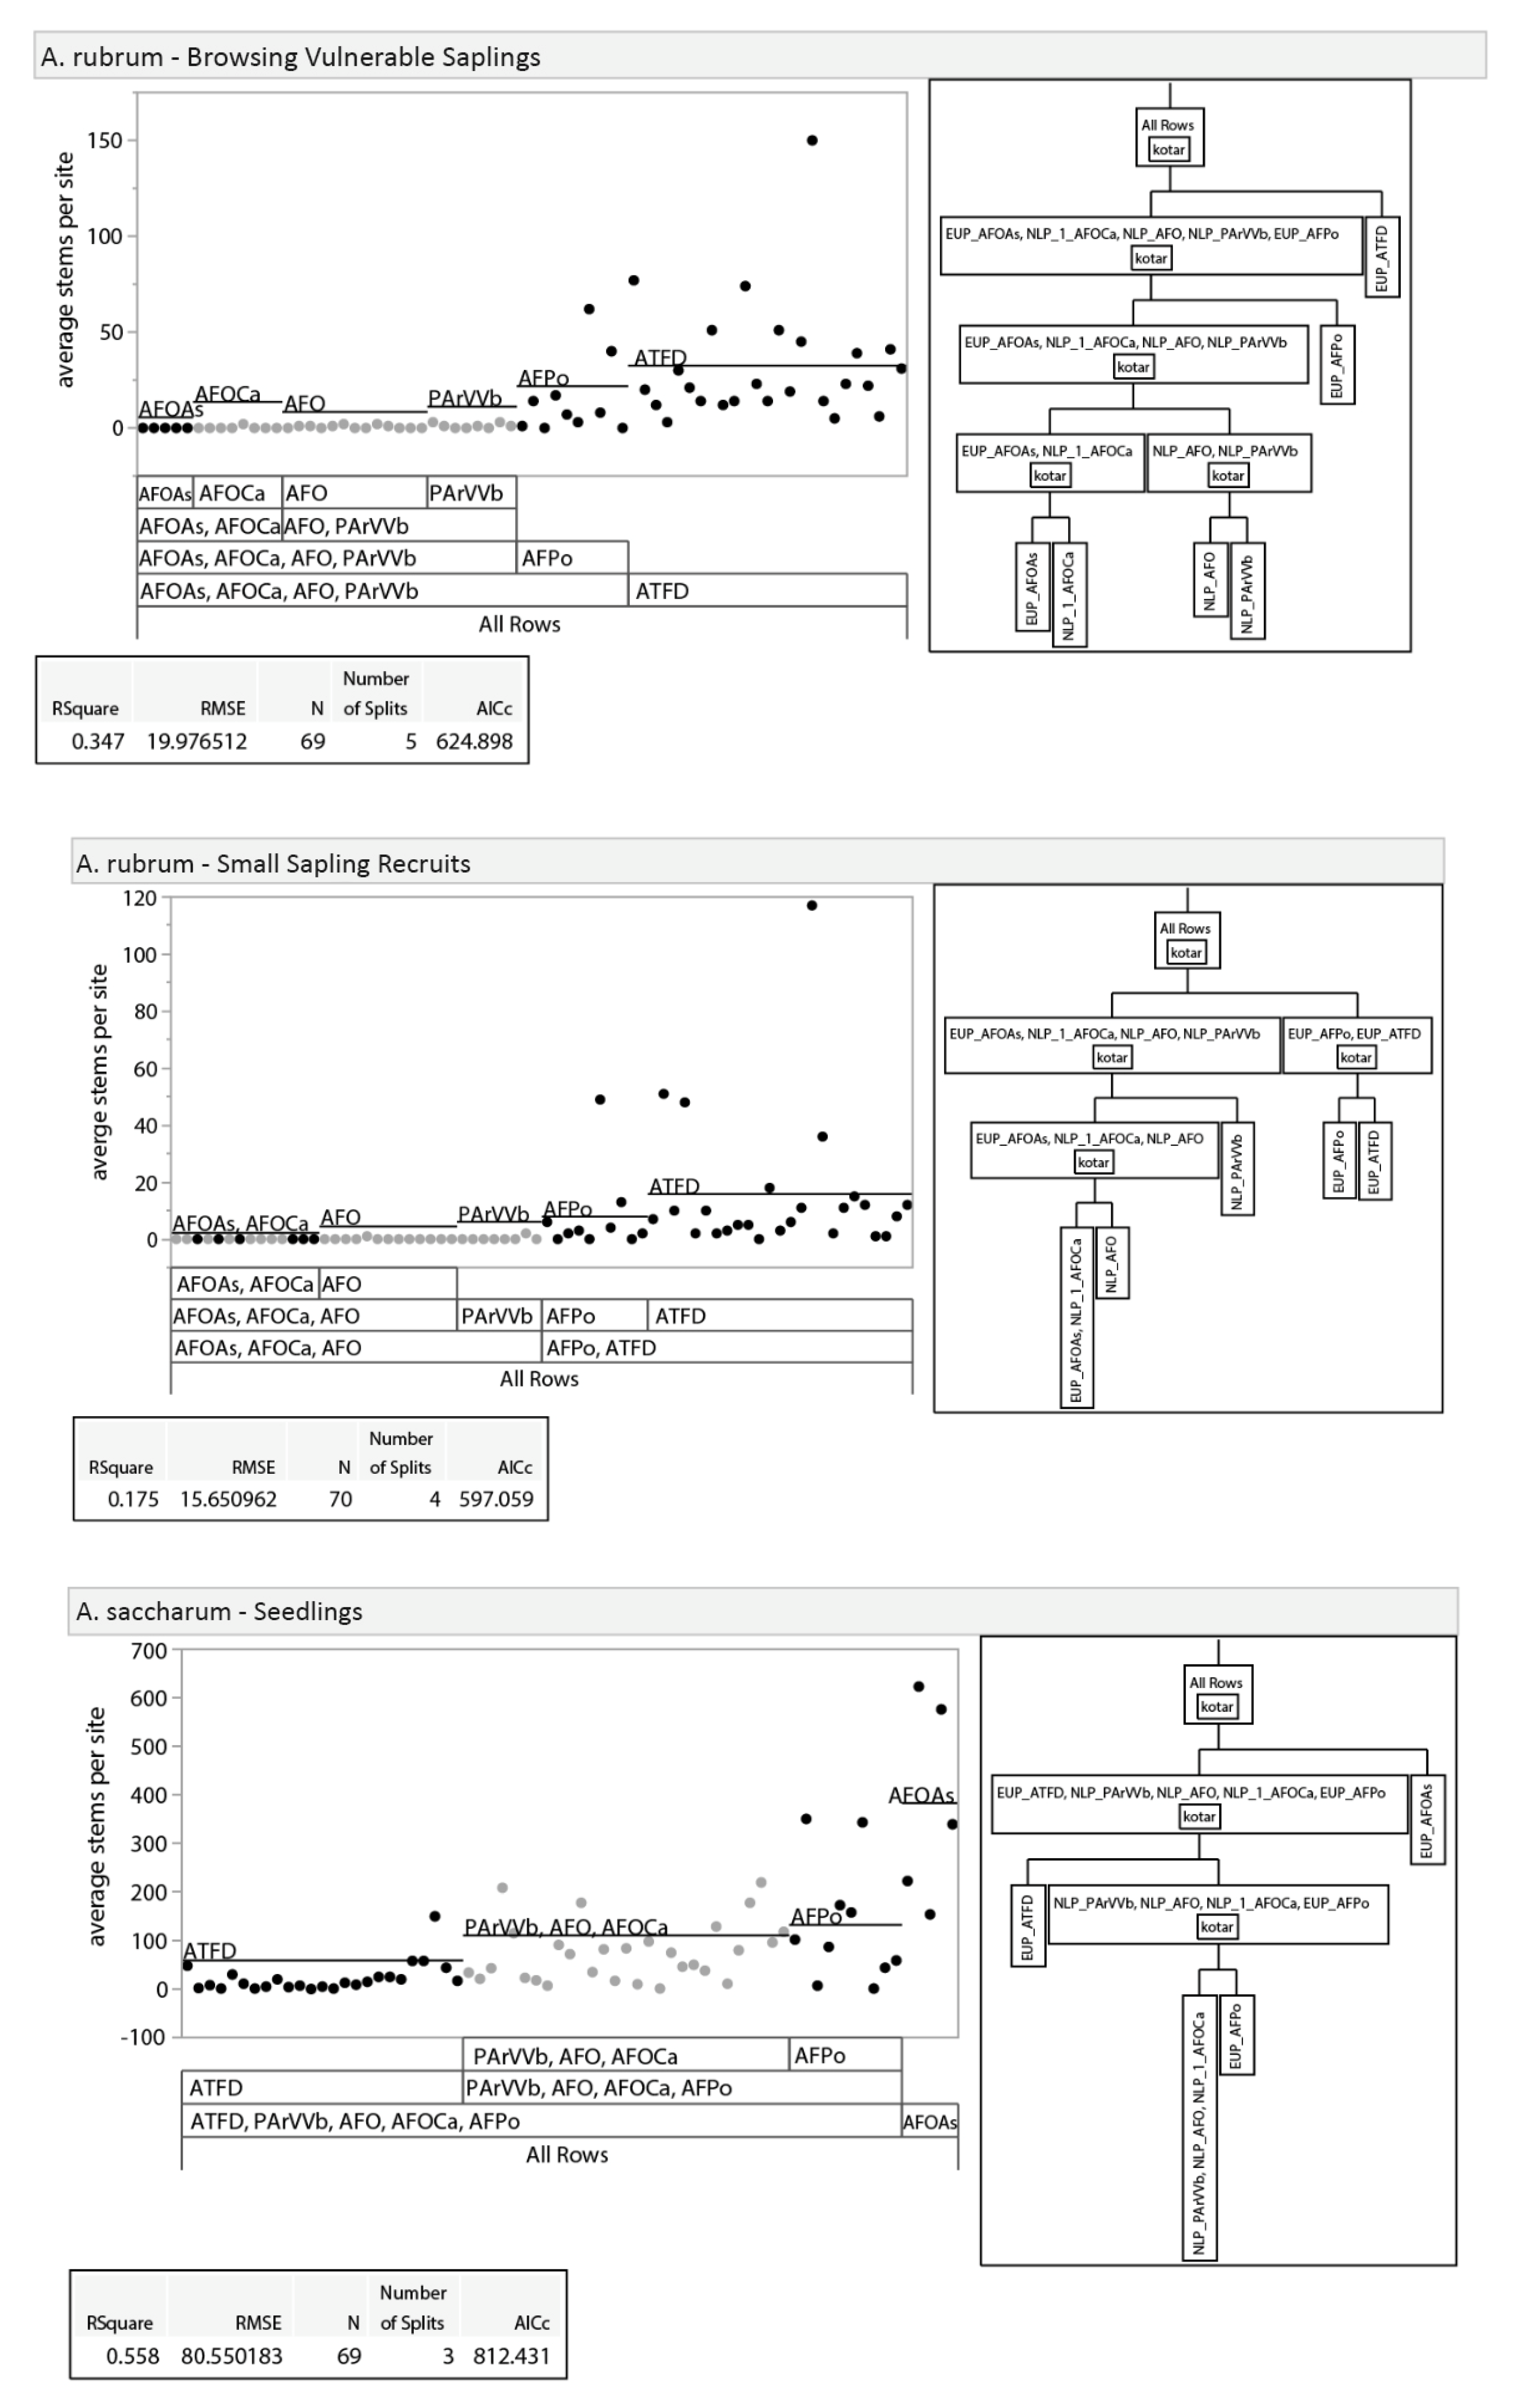
3.2. Tree Regeneration

We recorded 25 species of regeneration size class trees across sites (data not shown). Among stem density models for the eleven most abundant species (60 models total), habitat type (main effect or interaction) was significant in 67% of models, current stand basal area was significant in 40%, and deer use was significant in 35% (Table 3 for the four most abundant species; Appendix A, Table A2 for the remaining 7 species).

3.2.1. Tree Regeneration—Effects of Habitat Type

The density and relative abundance of species varied across habitat types and size classes and between regions (Table 3, Figure 3 and Figure 4; six most abundant species in each region shown). The seedling stratum was dominated by red maple and sugar maple on the lowest-quality sites and by sugar maple on the highest-quality sites in both the EUP and NLP. There were also generally similar changes in composition between size classes across habitat types and regions, with some nuances. The largest difference in size classes was between seedlings (<25 cm tall) and the small sapling recruit class (>137 cm, <5 cm DBH). Compared to maple-dominated seedling layers in both regions, small sapling recruits were dominated by beech and ironwood in the NLP (combined 88% of stems, Figure 3) and by beech in the EUP (59% of stems, Figure 4). In the NLP, the combination of red maple and sugar maple small sapling recruits averaged 78 stems ha−1 over all sites compared to 2540 stems ha−1 for beech and ironwood combined. In both regions and all habitat types, mean beech small sapling densities exceed 2000 stems ha−1, with the highest values of ~8000 ha−1 on the poorest habitat type in the NLP. In the large sapling recruit class (5–10 cm DBH), sugar maple and beech had the highest densities and similar proportional representation. However, density in the large sapling recruit stratum was two to three orders of magnitude lower than in the small sapling recruit stratum. Based on physical appearance (i.e., small, flat crowns, and furrowed rough bark [38]), many sugar maples in the large sapling recruit class may have been suppressed and had low vigor stems (Elenitsky, personal observation). Given these large sapling recruit characteristics and the relative dominance of sugar maple, red maple, American beech, and ironwood across regions and habitat types, further presentation will focus on those four species and will generally exclude the large sapling recruit class.

3.2.2. Tree Regeneration—Effects of Basal Area

Given our data collection design, we were able to examine the effects of current basal area and basal area of seed trees (e.g., basal area of beech predicts beech regeneration density, and trees were restricted to >25.4 cm for all species except ironwood at >10 cm) on regeneration stem densities for the four predominant species, plus preharvest beech basal area for beech. Preliminary models revealed that, in factorial combination with habitat type and deer use, current basal area was the best predictor in 39% of models, basal area of seed trees was the best predictor in 28% of models, and models were similar in 33% of cases. Thus, we focus on the current basal area (Table 3) except for beech, where we compare all three measures of basal area (Table 4).
Current basal area was negatively related to stem counts for red maple and beech in the small sapling recruit stratum and for sugar maple, red maple, and beech in the browsing vulnerable sapling stratum, but current basal area was unrelated to seedling counts for any species (Table 3). This suggests that greater canopy openness, which should scale negatively with basal area in partially harvested stands, drives height growth/sapling recruitment but not seedling establishment. Comparing different measures of basal area for beech, beech seed tree basal area (STBA) was a relatively poor predictor of beech stem counts. In contrast, preharvest beech basal area (PBBA) was a superior predictor for browsing vulnerable saplings (and small sapling recruits in the NLP), whereas current basal area tended to be more important for larger classes (Table 4). Given most stands were harvested at least 4–7 years before measurements, these patterns suggest that beech regeneration density, whether by seed or suckering, increases with PBBA but that subsequent recruitment then depends on canopy openness. The magnitude of influence of total basal area on beech small sapling recruits was large. Our model predicts beech densities of >6000 stems ha−1 at 11.7 m−2 current basal area (10th percentile of BA) in both regions, which is about three times greater than at 22.4 m−2 current basal area (90th percentile of BA). Similarly (although opposite in sign), the magnitude of the PBBA was large in the EUP (although insignificant in the NLP). Our model estimated 1476 ha−1 small sapling recruit stems at 4.6 m2 ha−1 (10th percentile of preharvest beech basal area) vs. 6127 ha−1 at 26.1 m2 ha−1 (90th percentile).

3.2.3. Tree Regeneration–Effects of Deer Use

On average, winter deer use in the stands was low: 2.5 deer/km−2, with a range of 0–10.4 deer/km−2. We expected deer use to be low in the northern half of the EUP due to greater winter snow depth, but no spatial trend was evident (Figure 5). In the NLP, deer use generally appears lower in areas of deep lake effect snow near Lake Michigan.
Among less well-represented tree species (Appendix A, Table A2), higher deer use negatively affected small sapling recruit density for two species (p. pensylvanica and B. alleghaniensis). However, for the four most abundant species, effects of current deer use were modest, with deer use increasing sugar maple seedling and browsing vulnerable sapling density in the EUP and decreasing ironwood seedling density in both regions (Table 3).

3.2.4. Tree Regeneration—Effects of Taller Regeneration Strata on Seedling Density

Models that included all classes of taller strata as predictors of seedling density reveal strong negative effects of small and large sapling recruits, positive effects of browsing vulnerable saplings, and no effect of overstory pole and sawtimber density (Figure 6 and data not shown). The positive effect of the browsing vulnerable sapling stratum is unsurprising, given adjacent height strata and an arbitrary boundary (25 cm tall) between them. The effect of a dense small sapling recruit class was particularly strong. Holding browsing vulnerable sapling and large sapling recruit densities constant at their experimental means (1059 and 28 stems ha−1, respectively), our model predicts a seedling density of 148,476 ha−1 at a small sapling recruit density of 200 ha−1 versus 23,287 ha−1 at a small sapling recruit density of 4500 ha−1.

4. Discussion

4.1. Factors Related to Regeneration Size Class Structure

Tree regeneration structure in northern hardwood stands following BBD-motivated partial harvesting varied for beech and its three most abundant associates: sugar maple, red maple, and ironwood. Nearly ubiquitously, the seedling stratum was dominated by maples. This suggests adequate seed availability and germination/establishment conditions for these key species. However, the maple species decrease sharply in both absolute and relative terms from smaller to larger size classes, becoming a minor to nearly absent component in the small sapling recruit class. In contrast, the relative abundances of ironwood and beech increase with tree regeneration size class and thoroughly dominate the small sapling size class, i.e., the stratum just taller than the threshold for successfully escaping deer browsing pressure [34]. Related, Acer spp. are more browsing-sensitive than ironwood and beech [24,39]. In combination and consistent with similar studies from the region, these patterns suggest that deer browsing asserts strong pressure on regeneration structure in northern hardwood forests [24,40]. Although our pellet count data do not support this suggestion, McWilliams et al. [41] report especially high deer browsing pressure in the southern portion of the NLP region where beech saplings were most dense and lower browsing pressure in the EUP where maples comprised a greater proportion of small sapling recruits.
Counterintuitively, positive associations between deer use and sugar maple seedlings support the notion that deer influence regeneration structure patterns. Randall and Walters [16] show that higher long-term deer browsing pressure increased Acer rubrum seedling density, perhaps because chronic browsing maintains trees at smaller, seedling-sized statures [42]. Alternatively, in this study, higher densities of palatable maple seedlings may have attracted more deer. However, current deer use was not negatively related to small sapling recruit density for our four most abundant species as would be expected if current deer use is limiting recruitment of small sapling recruits from the browsing vulnerable stratum. One possible explanation is that our data only captured winter deer use in 2018 and failed to characterize deer use further back in time. The shift from a dominance of browsing-sensitive species in the browsing vulnerable strata to browsing-insensitive species in the sapling recruit strata would more likely be the product of several years (or decades) of deer browsing pressure, which may vary considerably over time.
Negative effects of total basal area and positive effects of preharvest beech basal area in the small sapling recruit and/or browsing vulnerable strata suggests that beech regeneration potential (i.e., seedlings and browsing vulnerable saplings) is shaped by beech overstory density, with sapling recruitment stimulated by low postharvest basal area (i.e., high resource availability). Although these factors can drive average stand densities of beech small sapling recruits to >6000 stems ha−1, it is important to reiterate that beech small sapling recruit densities were high in general and dominated the small sapling recruit layer. At the subplot scale (i.e., 2-m radius plots within stands), 44% exceeded 2000 stems ha−1 and 13% exceeded 5000 stems ha−1. Densities we quantified do not match the densities observed and arbitrarily defined as thickets (i.e., > 10,000 stems ha−1) in the northern Appalachian region by Cale et al. [3]. However, the beech densities we observed, especially if considering the sum of the browsing vulnerable and small sapling recruit layers, likely dominate growing space (Figure 7) and inhibit the growth of smaller size class stems of other species, thus reinforcing their dominance (Figure 6). Possible negative effects of the dense beech small sapling recruit layer on the subordinate seedling and browsing vulnerable sapling stratum could occur via light limitation and/or suppression of seedling establishment from the accumulation of a deep, recalcitrant beech leaf litter layer [3,43,44].
In addition to the effects of deer, a high historical mature beech component, and the most recent harvest, other factors may contribute to the regeneration structure of beech and its associates. Among these is longer term management history. We were not able to obtain consistent long-term management history for our study sites; however, we know that all or nearly all of our study stands have been managed since the 1950s–1960s, first by thinning (mostly timber stand improvement) and then, since the 1980s, by single-tree and small group selection silviculture (Tim Greco, MDNR, and personal communication). Studies have shown that repeated selection harvests can result in low diversity sapling layers and in high proportions of beech saplings [45,46,47] and/or ironwood [24] and that beech-dominated understories have been found in managed northern hardwood stands prior to BBD infection [48]. Thus, BBD and BBD-motivated harvesting are not exclusive triggers for beech understory establishment. Instead, we suggest that they likely amplify beech regeneration components already encouraged by harvest practices and deer browsing preferences. Our data showing the positive effects of preharvest beech density and negative effects of postharvest stand basal area on beech regeneration density support this notion.
Finally, our data show regional differences not only between Michigan and the northern Appalachian region but also between the EUP and NLP. Concerning Michigan, both regions generally had an Acer spp.-dominated seedling stratum and beech-dominated sapling recruit strata. However, the EUP had many more species in the browsing vulnerable strata (i.e., <137 cm tall) and a greater proportion of desirable stems (e.g., Acer) in the sapling recruit strata. In addition, ironwood sapling recruit densities were much greater in the NLP. There may be several reasons for differences between regions. In addition to unquantified long-term differences in deer browsing pressure (as previously discussed and in McWilliams et al. [41]), factors include differences in landscape contexts, site-climate differences (for which we have no data), and more advanced progression of BBD in the EUP than the NLP [13] (Elenitsky unpublished data).
An important caveat to our discussion of the patterns and relationships we observed is that they are based on a natural “snapshot in time” experiment and subject to the limitations of this type of experiment [49]. Our discussions about future tree regeneration dynamics and legacy effects (e.g., past deer browsing pressure), while grounded in data, theory, and other empirical work, is largely speculative. In addition, significance for the factors we examined merely suggests their importance as causal factors. Factors other than those we measured could have been the actual causal factors driving variation in vegetation structure among sites. The inability to pinpoint causality is a weakness of natural experiments relative to manipulative field experiments. However, per effort, natural snapshot in time experiments, because they can be deployed efficiently on many sites over broad extents, are a strong experimental approach for gaining scope, generality, and realism. Our experiment allowed us to consider multiple factors varying over large extents, including site quality, deer browsing pressure, and overstory structure following regionally ubiquitous operational harvests. Importantly, our sites are georeferenced, subplots are physically marked, and sites are preserved from further treatments, with the goal to periodically remeasure plots. Developing a trajectory based one remeasurement will strengthen our ability to develop long-term predictions of forest dynamics and to gain greater inference on causes. Due to the limitations of our current experiment, we urge caution in interpreting and applying our results. An additional caveat is that, given our priority to maximize the number of stands sampled, the intensity of sampling within sites for deer pellet counts and vegetation characterization was relatively low, which decreased the precision of plot estimates compared to sampling at greater intensity.

4.2. Management Implications

Given dense beech or beech/ironwood small sapling recruit layers and their negative association with maple-dominated seedling layers, it is obvious that continued management for maple-dominated northern hardwood forests by current practices could be problematic in some areas. We evaluated the potential for adequate stocking of sapling recruits in our study stands by developing stocking criteria for sapling recruits of desirable species based on the following assumptions: (1) beech, ironwood, and a few other minor species (e.g., F. americana) are considered undesirable for management due to low economic value or insect/pathogen problems currently limiting overstory recruitment, while desirable species with high economic value include sugar maple, red maple, and several minor species (e.g., B. alleghaniensis and P. serotina); (2) minimum stocking of small sapling recruits of desirable species is considered an acceptable measure of success; and (3) well-stocked small sapling recruit layers effectively capture growing space by inhibiting subordinate regeneration layers (as suggested by Figure 6).
Based on these assumptions, we developed two different stocking standards: one based on standards for even-aged northern hardwood stands [50], and the other based on Arbogast’s postharvest residual stocking standards for selection-managed northern hardwoods [51]. For our evenly aged standards, we defined adequate stocking as >950 small sapling recruits ha−1. This density achieves full stocking (i.e., intersects the b-line on stocking guide [50]) at approximately 12.5 cm. We assume low mortality as trees grow from small sapling recruit to 12.5 cm DBH. Given that small sapling recruits have transcended both deer browsing and most non-tree vegetation competition [15,52,53], this assumption is likely sound. We also assume that stocking standards for evenly aged stands apply to partially harvested stands with relatively low overstory residual basal area. Following this rationale, we evaluated stocking in the 57 (out of 69) stands that had a current basal area (>10 cm DBH) of <16 m2 ha−1. This value is lower than recommended by Arbogast [51] for securing natural regeneration in selection managed stands (19 m2). We assessed stocking by subplot and considered a stand (plot) stocked if at least six of nine subplots met our stocking criteria (desirable species and adequate density). Given current tree regeneration structures in our study stands, we found only 5% of our stands adequately stocked with desirable species in the small sapling recruit layer. Alternatively, Arbogast’s postharvest residual stocking standards expect >422 stems ha−1 for sufficient stocking in the two smallest size classes they consider (i.e., 2- and 3-inch DBH size classes (3.8–8.9 cm)). Applying this stocking threshold to small sapling recruits (0–5 cm DBH) using mean values for all 69 of our stands, 55% was insufficiently stocked with maple species and 38% was insufficiently stocked considering all species except beech and ironwood. Although our focus is on the small sapling recruit stratum, it is noteworthy that, for our large sapling recruit layer (5–10 cm DBH), applying Arbogast stocking standards for the 3.8–8.9-cm size class revealed that 10% of stands was stocked if all species was considered and 0% was stocked if beech and ironwood were excluded. Clearly, regeneration expectations for unevenly aged selection silviculture management are not being met in many of our stands.
Although BBD-motivated partial harvests were not generally considered regeneration harvests, given the focus on mature tree removal and resulting residual basal areas, these harvests were essentially selection system regeneration harvests whether by prescription or proxy. Historically, our study stands have been managed by selection silviculture, yet nearly all of our stands fail to meet small sapling recruit stocking standards for species considered targets for management, as would reasonably be expected from this silvicultural system. Presently, northern hardwood management in Michigan relies solely on overstory harvesting to create adequate conditions for stocking of desirable natural regeneration. Planting or understory treatments are rarely used to foster regeneration, and guidelines informing managers when to use understory treatments are not well developed. Donoso and Nyland [52] suggest understory management if 30–40% of the stand is dominated by undesirable stems. Hannah [53] recommends site preparation when beech or other undesirable species comprise >50% of advance regeneration. Bohn and Nyland [54] indicate regeneration failure when any undesirable stem reaches “tallest of plot” status in milacre plots.
Our results and the findings of these studies suggest that understory management should be considered as part of an overall strategy to achieve adequate regeneration of species desirable for management. Currently, mechanical means of removing undesirable species in smaller size classes include imbedding the destruction of small sapling stems with logging equipment into overstory harvest contracts. This practice reduces undesirable stems in the short term; however, beech saplings may rebound vigorously via root suckering [55]. Harvests are usually done in winter to reduce damage to shallow root systems, which can increase root suckering given higher reserve carbohydrates in root systems in winter [56,57]. Other techniques of reducing undesirable stems in small size classes include girdling, stem herbicide injections, basal bark herbicide application, and prescribed fire [7]. However, these treatments are not cost effective for most timber managers and fire has been shown to be largely ineffective at killing beech saplings [58,59]. In contrast, foliar herbicide application has been shown to successfully control beech-dominated understories and can be applied with relative cost efficiency over large areas.
In addition to understory management, deer browsing pressure may need to be reduced to recruit desirable stems. Most studies advocate the use of deer fencing or reducing deer herds; however, the former is often not economically viable and the latter not socially viable. Novel silvicultural treatments that aim to reduce deer use within stands while maintain populations of deer in the surrounding landscape show some promise but are little explored. Walters et al. [39] found that patch cuts >0.5 acre decreased the probability of browsing on planted seedlings via high non-tree vegetation densities that overwhelm browsing deer, act as physical deterrents, and/or make desirable seedlings more difficult to find, suggesting that alternatives to single-tree and small group selection silviculture are worth evaluating for northern hardwood forest management. In addressing the combined problems of high deer populations and beech sapling dominance, we suggest that more intense overstory harvesting be combined with understory treatments aimed at reducing dense beech sapling strata. This combination may increase the likelihood of securing regeneration of species favored by managers and of increasing species diversity and, thus, resilience.
Our results illustrate the importance of regeneration monitoring and protocols, including explicit consideration of sapling recruit classes and novel management techniques that address modern barriers to regeneration (e.g., deer browsing, pests/pathogens, legacies of past management, etc.). Traditional overstory management techniques that rely on advance regeneration will likely not be effective in restoring BBD-impacted forests. Although our study was only conducted in Michigan, northern hardwood forests cover millions of hectares from Minnesota to the Canadian Maritimes. Furthermore, many temperate mesic forests worldwide are similarly characterized by high ungulate populations and reduced tree recruitment [60,61]. Even larger extents of forest may be affected by insects and pathogens, that are often introduced and that create widespread overstory mortality and a dense regeneration layer with little chance of overstory recruitment. As such, the patterns we identified and the silvicultural/restoration tools we suggest could be applicable to other forest systems.

Author Contributions

M.B.W., L.M.E., and E.J.F. developed the presented idea and created the project design. L.M.E. lead the data collection process. M.B.W. and L.M.E. performed the analysis. L.M.E. led development of the initial manuscript and M.B.W. the revisions. All authors contributed to and reviewed all aspects of the original submission and revisions. All authors have read and agreed to the published version of the manuscript.

Funding

This research was funded by the Michigan Department of Natural Resources and Michigan State University.

Acknowledgments

We thank Jason Hartman and forestry staff at the Michigan Department of Natural Resources for providing logistical support and initial data for our study stands. We thank Delaney Gibbs, Shannon Poon, and Megan Machusko for all their efforts in collecting field data. We thank Deborah McCullough and Gary Roloff for their helpful editorial comments. Support for this project was provided by the Michigan Department of Natural Resources, Forest Resources Division. Partial personal support for this study was provided by an Academic Achievement Graduate Award and a Summer Fellowship from Michigan State University.

Conflicts of Interest

The authors declare no conflict of interest.

Appendix A

Figure A1. Results of recursive partitioning. Recursive partitioning was used to visually compare stem densities of the three smallest size classes of the three most dominant species (sugar maple, red maple, and American beech) to assess regional separation. Black dots represent data points from EUP, while grey dots represent data points from NLP.
Forests 11 00180 g0a1aForests 11 00180 g0a1bForests 11 00180 g0a1cForests 11 00180 g0a1d
Table A1. Results of nonparametric Wilcoxon tests. Results of nonparametric Wilcoxon tests comparing stem densities of the three smallest size classes of the three most dominant species across similar habitat types between regions: High compares the two high classes between regions (NLP–AFOCa and EUP–AFOAs), Medium compares the two medium classes (NLP–AFO and EUP–AFPo), and Low compares the two low classes (NLP–PArVVb and EUP–ATFD). Bold values indicate significance after Bonferroni correction (p ≤ 0.0019).
SpeciesSize ClassHabitat TypeProb > S
F. grandifoliaSeedlingsHigh0.2098
Medium0.0006
Low0.0017
Browsing vulnerable saplingsHigh0.2028
Medium0.0002
Low< 0.0001
Small sapling recruitsHigh0.4858
Medium0.0038
Low0.0146
A. rubrumSeedlingsHigh0.0163
Medium0.0276
Low0.0034
Browsing vulnerable saplingsHigh0.6154
Medium0.003
Low< 0.0001
Small sapling recruitsHigh1.0000
Medium0.0005
Low< 0.0001
A. saccharumSeedlingsHigh0.0031
Medium0.1753
Low0.0007
Browsing vulnerable saplingsHigh0.0085
Medium< 0.0001
Low0.1831
Small sapling recruitsHigh0.0010
Medium0.0005
Low0.028
Figure A2. Overstory poletimber and sawtimber strata by species and habitat type in the EUP and NLP. Site quality (via habitat type (Burger and Kotar, 2003) increases from left to right. Values are model estimated means ± 95% confidence intervals. Species shown contributed > 1% of the total composition in any one site quality × size class × peninsula combination.
Forests 11 00180 g0a2
Table A2. Summary of generalized negative binomial models of regeneration strata counts. The elastic net estimation method and AICc validation. Models are for species, regeneration size class, and region combinations for combinations with sufficient data for modeling. H = habitat type, D = deer use, BA = current basal area. Models shown are those with best support. H = Habitat Type, D = Deer Use, BA = Basal Area.
SpeciesRegionSize ClassAICcR2Prob > ChiSquare
F. americanaNLPSeedlings148.00.36H = 0.0003
Browsing vulnerable saplings 156.20.48H < 0.0001, D = 0.0190, H × D = 0.0075 (D-)
Small sapling recruits 64.70.68H ≤ 0.0001, (H × D) ≤ 0.0001, (H × BA) ≤ 0.0001
Large sapling recruits--
P. serotinaNLPSeedlings72.50.00
Browsing vulnerable saplings 108.90.00
Small sapling recruits 59.00.00
Large sapling recruits--
P. pensylvanicaEUPSeedlings16.80.00
Browsing vulnerable saplings 13.30.06
Small sapling recruits 110.10.41H ≤ 0.0001, D ≤ 0.0001, BA ≤ 0.0001H × BA = 0.0002, D × BA ≤ 0.0001 (BA-, D-)
Large sapling recruits107.00.27H ≤ 0.0001, D = 0.0072, D × BA = 0.0022 (BA-, D-)
B. alleghaniensisEUPSeedlings163.30.15H = 0.0002
Browsing vulnerable saplings101.10.27H ≤ 0.0001, BA = 0.0374, H × D = 0.0034
(BA+)
Small sapling recruits 55.90.22H ≤ 0.0001, D = 0.0013, BA = 0.0091
(BA+, D-)
Large sapling recruits74.10.2H = 0.0009, D × BA = 0.0233
T. canadensisEUPSeedlings57.90.24H ≤ 0.0001, BA = 0.0104 (BA+)
Browsing vulnerable saplings 34.50.00
Small sapling recruits 56.40.2H ≤ 0.0001, BA = 0.0357 (BA+)
Large sapling recruits51.00.00
A. balsameaEUPSeedlings49.50.00
Browsing vulnerable saplings 79.50.33H ≤ 0.0001, BA = 0.0085, H × D = 0.0006
(BA+)
Small sapling recruits 101.30.31H ≤ 0.0001, H × D = 0.0034
Large sapling recruits147.10.19H ≤ 0.0001
A. pensylvanicumEUPSeedlings80.60.28H ≤ 0.0001, D ≤ 0.0001 (D+)
Browsing vulnerable saplings111.20.27D ≤ 0.0001 (D+)
Small sapling recruits171.70
Large sapling recruits102.70

References

  1. Ehrlich, J. The Beech Bark Disease a Nectria Disease of Fagus, Following Cryptococcus Fagi (Baer.). Can. J. Res. 1934, 10, 593–692. [Google Scholar] [CrossRef]
  2. Cale, J.A.; Teale, S.A.; Johnston, M.T.; Boyer, G.L.; Perri, K.A.; Castello, J.D. New ecological and physiological dimensions of beech bark disease development in aftermath forests. For. Ecol. Manag. 2015, 336, 99–108. [Google Scholar] [CrossRef]
  3. Cale, J.A.; McNulty, S.A.; Teale, S.A.; Castello, J.D. The impact of beech thickets on biodiversity. Biol. Invasions 2013, 15, 699–706. [Google Scholar] [CrossRef]
  4. Houston, D.R. Beech Bark Disease—The Aftermath Forests are Structured for a New Outbreak. J. For. 1975, 73, 660–663. [Google Scholar]
  5. Shigo, A.L. The Beech Bark Disease Today in the Northeastern, U.S. J. For. 1972, 70, 286–289. [Google Scholar]
  6. Giencke, L.M.; Dovčiak, M.; Mountrakis, G.; Cale, J.A.; Mitchell, M.J. Beech bark disease: spatial patterns of thicket formation and disease spread in an aftermath forest in the northeastern United States. Can. J. Res. 2014, 44, 1042–1050. [Google Scholar] [CrossRef]
  7. Nyland, R.D.; Bashant, A.L.; Bohn, K.K.; Verostek, J.M. Interference to Hardwood Regeneration in Northeastern North America: Controlling Effects of American Beech, Striped Maple, and Hobblebush. North. J. Appl. For. 2006, 23, 122–132. [Google Scholar] [CrossRef]
  8. Hane, E.N. Indirect effects of beech bark disease on sugar maple seedling survival. Can. J. For. Res. 2003, 33, 807–813. [Google Scholar] [CrossRef]
  9. O’Brien, J.G.; Ostry, M.E.; Mielke, M.E.; Mech, R.; Heyd, R.L.; McCullough, D.G. First Report of Beech Bark Disease in Michigan. Plant Dis. 2001, 85, 921. [Google Scholar] [CrossRef]
  10. Houston, D.R. Major new tree disease epidemics: beech bark disease. Annu. Rev. Phytopathol. 1994, 32, 75–87. [Google Scholar] [CrossRef]
  11. Le Guerrier, C.; Marceau, D.J.; Bouchard, A.; Brisson, J. A modelling approach to assess the long-term impact of beech bark disease in northern hardwood forest. Can. J. Forest Res. 2003, 33, 2416–2425. [Google Scholar] [CrossRef] [Green Version]
  12. Kearney, A.; Mccullough, D.G.; Walters, M. Impacts of Beech Bark Disease on Understory Composition in Michigan. In Beech Bark Disease; Michigan State University: East Lansing, MI, USA, 2004; pp. 58–60. [Google Scholar]
  13. Wieferich, J. Beech Bark Disease in Michigan: Distribution, Impacts and Dynamics. Master’s Thesis, Michigan State University, East Lansing, MI, USA, 2013. [Google Scholar]
  14. Burger, T.L.; Kotar, J. A Guide to Forest Communities and Habitat Types of Michigan; Department of Forest Ecology and Management, University of Wisonsin-Madison: Madison, WI, USA, 2003. [Google Scholar]
  15. Rooney, T.P.; Waller, D.M. Direct and indirect effects of white-tailed deer in forest ecosystems. For. Ecol. Manag. 2003, 181, 165–176. [Google Scholar] [CrossRef]
  16. Randall, J.A.; Walters, M.B. Deer density effects on vegetation in aspen forest understories over site productivity and stand age gradients. For. Ecol. Manag. 2011, 261, 408–415. [Google Scholar] [CrossRef]
  17. Frigoletto, E.; Wylie, P.; Pasquini, S.C.; Carson, W.P. Excluding deer increases the proportion of beech saplings originating from seed versus those of root sprout origin. J. Torrey Bot. Soc. 2017, 144, 379–384. [Google Scholar] [CrossRef] [Green Version]
  18. Kern, C.; Erdmann, G.; Kenefic, L.; Palik, B.; Strong, T. Development of the Selection System in Northern Hardwood Forests of the Lake States: An 80-Year Silviculture Research Legacy; USDA For. Serv. Exp. For. Ranges, Ed.; Springer: New York, NY, USA, 2014; pp. 201–223. [Google Scholar]
  19. Eyre, F.H.; Zillgitt, W.M. Partial Cuttings in Northern Hardwoods of the Lake States: Twenty-Year Experimental Results; Technical Bulletin LS-1076; USDA, For. Serv., Lake States Forest Experiment Station: Broomall, PA, USA, 1953; p. 124.
  20. McShea, W.J.; Underwood, H.B.; Rappole, J.H. The Science of Overabundance; Smithsonian Institution Press: Washington, DC, USA, 1997; ISBN 1560986816. [Google Scholar]
  21. McClure, J.W.; Lee, T.D. Small-scale disturbance in a northern hardwoods forest: Effects on tree species abundance and distribution. Can. J. For. Res. 1993, 23, 1347–1360. [Google Scholar] [CrossRef]
  22. Webster, C.R.; Lorimer, C.G. Minimum opening sizes for canopy recruitment of midtolerant tree species: A retrospective approach. Ecol. Appl. 2005, 15, 1245–1262. [Google Scholar] [CrossRef]
  23. Kneeshaw, D.D.; Prévost, M. Natural canopy gap disturbances and their role in maintaining mixed-species forests of central Quebec, Canada. Can. J. For. Res. 2007, 37, 1534–1544. [Google Scholar] [CrossRef]
  24. Matonis, M.S.; Walters, M.B.; Millington, J.D.A. Gap-, stand-, and landscape-scale factors contribute to poor sugar maple regeneration after timber harvest. For. Ecol. Manag. 2011, 262, 286–298. [Google Scholar] [CrossRef]
  25. Handler, S.; Duveneck, M.J.; Iverson, L.; Peters, E.; Scheller, R.M.; Wythers, K.R.; Brandt, L.; Butler, P.; Janowiak, M.; Shannon, P.D.; et al. Michigan Forest Ecosystem Vulnerability Assessment and Synthesis: A Report from the Northwoods Climate Change Response Framework Project; Gen. Tech. Rep. NRS-129; USDA, For. Serv., Northern Research Station: Newtown Square, PA, USA, 2014; p. 229.
  26. PRISM Climate Group. Oregon State University. 2016. Available online: http//prism.oregonstate.edu (accessed on 10 August 2018).
  27. Neumann, D. Silvics and Management Guidance Manual; Neumann, D., Ed.; Michigan Department of Natural Resources Forest Resources and Wildlife Division: Lansing, MI, USA, 2015; p. 4111.
  28. Neff, D.J. The Pellet-Group Count Technique for Big Game Trend, Census, and Distribution: A Review. J. Wildl. Manag. 1968, 32, 597–614. [Google Scholar] [CrossRef]
  29. Marques, F.F.C.; Buckland, S.T.; Goffin, D.; Dixon, C.E.; Borchers, D.L.; Mayle, B.A.; Peace, A.J. Estimating deer abundance from line transect surveys of dung: Sika deer in southern Scotland. J. Appl. Ecol. 2003, 38, 349–363. [Google Scholar] [CrossRef] [Green Version]
  30. Millington, J.D.A.; Walters, M.B.; Matonis, M.S.; Liu, J. Effects of local and regional landscape characteristics on wildlife distribution across managed forests. For. Ecol. Manag. 2010, 259, 1102–1110. [Google Scholar] [CrossRef]
  31. Hill, H.R. The 2001 Deer Pellet Group Surveys; Report No. 3349; Michigan Department of Natural Resources Wildlife Division: Lansing, MI, USA, 2001.
  32. Henttonen, H.M.; Kangas, A. Optimal plot design in a multipurpose forest inventory. For. Ecosyst. 2015, 2, 31. [Google Scholar] [CrossRef] [Green Version]
  33. U.S. Department of Agriculture, Forest Service. Forest Iventory and Analysis National Core Field Guide Volume I: Field Data Collection Procedures for Phase 2 Plots. Version 8.0; U.S. Department of Agriculture, Forest Service: Washington, DC, USA, 2018.
  34. Walters; Farinosi; Willis. Deer browsing and shrub competition set sapling recruitment height and interact with light to shape recruitment niches for temperate forest tree species. For. Ecol. Man. 2020. submitted. [Google Scholar]
  35. Mulekar, M.S.; Mauromoustakos, A. More powerful but still easy to use data analysis with JMP© version 5. In Proceedings of the 2002 Annual Meeting of American Statistical Association, New York, NY, USA, 10–13 August 2002. [Google Scholar]
  36. SAS Institute Inc. JMP® 13 Basic Analysis; SAS Institute Inc.: Cary, NC, USA, 2016. [Google Scholar]
  37. Crotty, M.; Barker, C. Penalizing Your Models: An Overview of the Generalized Regression Platform; SAS Insitute: Cary, NC, USA, 2014. [Google Scholar]
  38. OMNR. Ontario Tree Marking Guide, Version 1.1; Ont. Min. Nat. Resour., Queen’s Printer for Ontario: Toronto, ON, Canada, 2004; p. 252. [Google Scholar]
  39. Walters, M.B.; Farinosi, E.J.; Willis, J.L.; Gottschalk, K.W. Managing for diversity: Harvest gap size drives complex light, vegetation, and deer herbivory impacts on tree seedlings. Ecosphere 2016, 7, 1–29. [Google Scholar] [CrossRef]
  40. Kern, C.C.; Reich, P.B.; Montgomery, R.A.; Strong, T.F. Do deer and shrubs override canopy gap size effects on growth and survival of yellow birch, northern red oak, eastern white pine, and eastern hemlock seedlings? For. Ecol. Manag. 2012, 267, 134–143. [Google Scholar] [CrossRef]
  41. McWilliams, W.H.; Westfall, J.A.; Brose, P.H.; Dey, D.C.; D’Amato, A.W.; Dickinson, Y.L.; Fajvan, M.A.; Kenefic, L.S.; Kern, C.C.; Laustsen, K.M.; et al. Subcontinental-Scale Patterns of Large-Ungulate Herbivory and Synoptic Review of Restoration Management Implications for Midwestern and Northeastern Forests; Gen. Tech. Rep. NRS-182; U.S. Dep. Agric. For. Serv. North. Res. Station: Newtown Square, PA, USA, 2018; pp. 1–24. [CrossRef] [Green Version]
  42. Kern, C.C.; Burton, J.I.; Raymond, P.; D’amato, A.W.; Keeton, W.S.; Royo, A.A.; Walters, M.B.; Webster, C.R.; Willis, J.L. Challenges facing gap-based silviculture and possible solutions for mesic northern forests in North America. For. Int. J. For. Res. For. 2017, 90, 4–17. [Google Scholar] [CrossRef]
  43. Melillo, J.M.; Aber, J.D.; Muratore, J.F. Nitrogen and lignin control of hardwood leaf litter decomposition dynamics. Ecology 1982, 63, 621–626. [Google Scholar] [CrossRef]
  44. Molofsky, J.; Augspurger, C.K. The effect of leaf litter on early seedling establishment in a tropical forest. Ecology 1992, 73, 68–77. [Google Scholar] [CrossRef]
  45. Nolet, P.; Bouffard, D.; Doyon, F.; Delagrange, S. Relationship between canopy disturbance history and current sapling density of Fagus grandifolia and Acer saccharum in a northern hardwood landscape. Can. J. For. Res. 2008, 38, 216–225. [Google Scholar] [CrossRef]
  46. Angers, V.A.; Messier, C.; Beaudet, M.; Leduc, A. Comparing composition and structure in old-growth and harvested (selection and diameter-limit cuts) northern hardwood stands in Quebec. For. Ecol. Manag. 2005, 217, 275–293. [Google Scholar] [CrossRef] [Green Version]
  47. Leak, W.B. Species composition and structure of a northern hardwood stand after 61 years of group/patch selection. North. J. Appl. For. 1999, 16, 151–153. [Google Scholar] [CrossRef]
  48. Roy, M.È.; Nolet, P. Early-stage of invasion by beech bark disease does not necessarily trigger American beech root sucker establishment in hardwood stands. Biol. Invasions 2018, 20, 3245–3254. [Google Scholar] [CrossRef]
  49. Diamond, J. Overview: Laboratory Experiments, Field Experiments, and Natural Experiments. In Community Ecology; Diamond, J., Case, T.J., Eds.; Harper & Row: New York, NY, USA, 1986; pp. 3–22. [Google Scholar]
  50. Solomon, D.S.; Leak, W.B. Simulated Yields for Managed Northern Hardwood Stands; Res. Pap. NE578; U.S. Dep. Agric. For. Serv. Northeast. For. Exp. Station: Broomall, PA, USA, 1986; p. 24.
  51. Arbogast, C.J. Marking Guides for Northern Hardwoods under the Selection System; Station Paper LS-56; U.S. Department of Agriculture, Forest Service, Lake States Forest Experiment Station: St. Paul, MN, USA, 1957; p. 20.
  52. Donoso, P.J.; Nyland, R.D. Interference to hardwood regeneration in northeastern North America: The effects of raspberries (Rubus spp.) following clearcutting and shelterwood methods. North. J. Appl. For. 2006, 23, 288–296. [Google Scholar] [CrossRef] [Green Version]
  53. Hannah, P.R. Potential of beech and striped maple to dominate regeneration on eastern hardwood sites. In Proceedings of the 6th Central Hardwood Forest Conference; Knoxville, TN, USA, 24–26 Febraury 1987; Hay, R.L., Gottschalk, K.W., Eds.; University of Tennessee: Knoxville, TN, USA, 1987; Abstract Number 526. [Google Scholar]
  54. Bohn, K.K.; Nyland, R.D. Forecasting development of understory American beech after partial cutting in uneven-aged northern hardwood stands. For. Ecol. Manag. 2003, 180, 453–461. [Google Scholar] [CrossRef]
  55. Mallik, A.; Wood, K.; Hollstedt, C.; MCLaughlan, M. Cut Stump Herbicide Treatments to Reduce Sprouting and Root Suckering; Note TN-39; Ont. Min. Natur. Resourc., Northwest. Sci. and Technol.: Thunder Bay, ON, Canada, 1997; p. 12. [Google Scholar]
  56. Mallett, A.L. Management of Understory American Beech by Manual and Chemical Control Methods. Master’s Thesis, SUNY Coll. Environ. Sci. and For., Syracuse, NY, USA, 2002; 152p. [Google Scholar]
  57. Farrar, A.; Ostrocsky, W.D. Dynamics of American Beech Regeneration 10 Years following Harvesting. North. J. Appl. For. 2006, 23, 192–196. [Google Scholar] [CrossRef] [Green Version]
  58. Swan, F. Post-Fire Response of Four Plant Communities in South-Central New York State Author. Ecology 1970, 51, 1074–1082. [Google Scholar] [CrossRef]
  59. Johnson, K.S. Composition of Two Oak-Northern Hardwood Stands 18 Years after Springtime Prescribed Burning. Master’s Thesis, SUNY Coll. Environ. Sci. and For., Syracuse, NY, USA, 2000. [Google Scholar]
  60. Ramirez, J.I.; Jansen, P.A.; Poorter, L. Effects of wild ungulates on the regeneration, structure and functioning of temperate forests: A semi-quantitative review. For. Ecol. Manag. 2018, 424, 406–419. [Google Scholar] [CrossRef]
  61. Ramirez, J.I.; Jansen, P.A.; den Ouden, J.; Goudzwaard, L.; Poorter, L. Long-term effects of wild ungulates on the structure, composition and succession of temperate forests. For. Ecol. Manag. 2019, 432, 478–488. [Google Scholar] [CrossRef]
Figure 1. Plot design for vegetation measurements and deer pellet transect layout. DBH = diameter at breast height (137 cm).
Forests 11 00180 g001
Figure 2. Distribution of 69 sites by habitat type indicating high, medium, and low site quality within the northern hardwood forest cover type [14]: Types are unique to each peninsula. High (i.e., high quality and the highest nutrient and moisture regime) types are AFOCa and AFOA, medium types are AFO and AFPo, and low types are PArVVb and ATFD in the NLP and EUP, respectively.
Forests 11 00180 g002
Figure 3. Tree regeneration strata by species and habitat type in the NLP: See Figure 1 legend for habitat types corresponding to site quality classes. Values are model estimated means ± 95% confidence intervals. Species shown contributed > 1% of the total composition in any one site quality × size class × peninsula combination.
Forests 11 00180 g003
Figure 4. Tree regeneration strata by species and habitat type in the EUP: See Figure 1 legend for habitat types corresponding to site quality classes. Values are model estimated means ± 95% confidence intervals. Species shown contributed > 1% of the total composition in any one site quality × size class × peninsula combination.
Forests 11 00180 g004
Figure 5. Spatial distribution of deer use (deer/km−2) across study sites (n = 69).
Forests 11 00180 g005
Figure 6. Estimates of seedling density from a negative binomial model including all three larger regeneration strata as predictors: Prediction profiles are shown for each stratum with other factor sets and their mean values, i.e., browsing-sensitive saplings = 1059 ha−1, small sapling recruits = 848.5 ha1, and large sapling recruits = 28 ha−1. Effects of poletimber and sawtimber density were insignificant (p > 0.10) in preliminary models and, thus, were not included in this final model.
Forests 11 00180 g006
Figure 7. Beech-dominated small sapling recruit layers on study sites.
Forests 11 00180 g007
Table 1. Size classes of tree regeneration and strata used for stem count data.
StrataHeight ClassDefinition
Browsing vulnerableSeedlings<25 cm tall
Browsing vulnerable saplings>25–137 cm tall
Sapling recruitSmall sapling recruits>137 cm tall, <5 cm DBH
(i.e., browsing immune)Large sapling recruits>5–10 cm DBH
OverstoryPoletimber>10–25.4 cm DBH
Sawtimber>25.4 cm DBH
Table 2. Forest stand characteristics: t-tests were used to compare regions (** p < 0.01, *** p < 0.001, ns = not significant). NLP = Northern Lower Peninsula and EUP = Eastern Upper Peninsula.
ParameterMean (Range)Significance
NLP
(n = 29)
EUP
(n = 40)
Current basal area (m2 ha−1)17.9 (8.9–25.7)16.5 (7.6–25.2) ns
Time since timber sale closing (years)5 (3–11)6 (1–11) ns
Preharvest beech basal area (m2 ha−1)15.5 (2.0–31.4)10.9 (1.0–22.4) **
Live beech basal area (m2 ha−1)5.5 (0–16.7)2.0 (0–10.5) ***
Seedlings (% cover)12 (2–41)16 (5–35) ns
Herbaceous (% cover)7 (0–23)6 (0–18) ns
Non-tree woody (% cover)3 (0–17)4 (0–16) ns
Leaf litter (% cover)87 (63–95)89 (72–97) ns
Table 3. Models of tree regeneration counts by size class for the four most abundant species using generalized negative binomial regression: Models are for species, regeneration size class, and region combinations with sufficient data for modeling. H = habitat type, D = deer use, BA = current basal area. Model summaries shown are those with the best supports. Factors shown are those retained in final models using elastic net estimation and AICc validation with Prob > ChiSquare < 0.10. Signs of main effects (+ or -) are in parentheses.
SpeciesRegionSize ClassAICcR2Prob > ChiSquare
(Sign of Effects)
A. saccharumEUPSeedlings396.40.63H < 0.0001, D = 0.0004 (D+)
Browsing vulnerable saplings280.70.49H < 0.0001, (D × BA) < 0.0001
Small sapling recruits219.60.50H < 0.0001
Large sapling recruits209.30.27H = 0.0035, H × BA = 0.0002,
H × D = 0.0036
NLPSeedlings317.60.00
Browsing vulnerable saplings130.60.32BA (0.0216), BA × H (0.0053), (BA-)
Small sapling recruits59.30.28
Large sapling recruits155.00.24D = 0.0009 (D-)
A. rubrumEUPSeedlings434.50.71H < 0.0001, BA × H = 0.0070
Browsing vulnerable saplings309.60.58H < 0.0001, BA = 0.0019 (BA-)
Small sapling recruits245.60.52H < 0.0001, BA = < 0.0001 (BA-)
Large sapling recruits154.60.36H = 0.0001, H × BA = 0.0188
NLPSeedlings307.70.28H < 0.0001
Browsing vulnerable saplings68.70.08
Small sapling recruits24.30.04
Large sapling recruits25.20.00
F. grandifoliaEUPSeedlings222.40.31H = 0.0009, H × D 0.0104
Browsing vulnerable saplings333.60.29H = 0.0012, BA = 0.0898 (BA-)
Small sapling recruits380.20.35H = 0.0073, BA < 0.0001 (BA-)
Large sapling recruits278.70.62H < 0.0001, (H × D) < 0.0001,
(H × BA) = 0.0513
NLPSeedlings244.20.26H × BA = 0.0700
Browsing vulnerable saplings306.00.00
Small sapling recruits282.20.35BA< 0.0001, BA × H < 0.0001 (BA-)
Large sapling recruits158.50.41D × BA = 0.0261
O. virginianaEUPSeedlings60.30.08D = 0.0088 (D-)
Browsing vulnerable saplings79.50.30H < 0.0001, (H × BA) < 0.0001
Small sapling recruits104.70.25H = 0.0011
Large sapling recruits30.60.21H = 0.0006, H × D = 0.0134
NLPSeedlings156.60.16D = 0.0186 (D-)
Browsing vulnerable saplings230.00.05
Small sapling recruits221.60.02
Large sapling recruits79.20.00
Table 4. Summary of generalized negative binomial models of F. grandifolia stem counts: H = habitat type, D = deer use, BA = current basal area, STBA = (beech) seed tree basal area, PBBA = preharvest beech basal area. To minimize overfitting, each of the three estimates of the basal area (i.e., BA, STBA, PBBA) was combined in a complete factorial with habitat type and deer use for modelling. Model summaries shown are those with the best support. Factors shown are those retained in final models using elastic net estimation and AICc validation with Prob > ChiSquare < 0.10. Signs of main effects (+ or -) are in parentheses.
Region
Size Class
AICcR2Model Terms = p > ChiSquare (Sign of Effect)
EUP
Seedlings220.5.0.45H = 0.0003, H × D = 0.0027
Browsing vulnerable saplings324.00.40PBBA < 0.0001 (+)
Small sapling recruits379.90.26BA < 0.0018 (-)
Large sapling recruits273.30.60H < 0.0001, H × D < 0.0001,
(H × BA) = 0.0037
NLP
Seedlings244.20.26BA × H = 0.0700
Browsing vulnerable saplings296.50.45PBBA = 0.0102 (+)
Small sapling recruits265.30.75H = 0.0004, PBBA = 0.0002 (+),
PBBA × H < 0.0001
Large sapling recruits159.10.39D = 0.0007 (−)

