Article

Comparative Analysis Reveals the Metabolic Characteristics of Astringent Seeds of Chinese Fir (Cunninghamia lanceolata (Lamb) Hook) during Astringent Compounds Accumulation Stages

1
College of Forestry, Fujian Agriculture and Forestry University, Fuzhou 350002, China
2
State Forestry and Grassland Administration Engineering Research Center of Chinese Fir, Fuzhou 350002, China
3
Key Laboratory for Forest Adversity Physiological Ecology and Molecular Biology, Fuzhou 350002, China
4
College of Computer and Information Science, Fujian Agriculture and Forestry University, Fuzhou 350002, China
*
Author to whom correspondence should be addressed.
Forests 2020, 11(11), 1206; https://doi.org/10.3390/f11111206
Submission received: 12 October 2020 / Revised: 10 November 2020 / Accepted: 13 November 2020 / Published: 16 November 2020

Abstract

:
Research Highlights: The present study firstly reported the metabolic dynamics of astringent seed, a special type of abortion in Chinese fir, during the astringent material stages. The results provide a reference for further study on its occurrence mechanism and enrich the understanding of the plant seed developmental physiology. Background and Objectives: Astringent seed is a type of abortive phenomenon in Chinese fir, which significantly reduces the yield and quality of elite seeds for its high-incidence and indistinguishableness in seed orchard. Embryo defects can be observed in the astringent seed, accompanied with rapid accumulation of secondary metabolites. However, types of those metabolites in astringent seed, dynamic changes during seed growth process, and different accumulative characteristics compared to germinable seed have not been explained. Materials and Methods: Astringent and germinable seed samples were collected at four stages aim to determine the differences in their metabolic patterns. A liquid chromatography-mass spectrometry (LC-MS) detection was used to generate the raw metabolic peaks. Bioinformatics statistical strategies were used to further investigation. Results: A total of 421 metabolites were screened and 112 metabolites were identified as the different expressive metabolites including 68 up-regulated and 44 down-regulated metabolites. Those different expressive metabolites were grouped into 26 classes. Flavone, flavonol, and amino acid derivatives compounds were the most varied metabolites. Four subcategories which could represent the diverse basic expressive patterns or accumulative activity in different sample groups were further clustered. Moreover, pathways related to biosynthesis/degradation/metabolism of flavonoid-like compounds, amino acid/nucleotides derivatives, zeatin, and IAA were clearly enriched. Conclusions: Significant metabolic differences were observed across and between astringent and germinable seeds 105 d after pollination. Massive accumulation of flavonoids-like compounds, significant reduction of amino acids/nucleotides and their derivatives, and the abnormal expression of phytohormones, lipids and other secondary metabolites are the main metabolic characteristics in astringent seeds.

1. Introduction

Chinese fir (Cunninghamia lanceolata (Lamb) Hook) is well known as one of the most important timber species in China [1]. For its fast growing and excellent quality, it has become the most widely commercially cultivated wooden species. Chinese fir has the largest plantation area in China [2]. Every year, hundreds of millions of elite seeds are harvested from seed orchards and cultivated for the afforestation [3,4]. Therefore, the yield and quality of elite seeds are crucial for the wood production of Chinese fir. However, a special type of abortion called astringent seed (AS) severely limits the yield and quality of elite seeds.
The occurrence of AS includes two periods, the embryo abortion and the astringent compounds accumulation. About 100 days after pollination, the embryo tissue shrivels near the orifice in the AS and expands gradually. About 10 days later, it is filled with granular metabolites from the base and becomes plump again [5]. Therefore, the mature AS is very similar to common germinable seed (GS) in size, weight, and color. It is very difficult to distinguish them by simple methods. Besides, the occurrence probability of AS is also at a high level (over 30% in the third generation seed orchards of Chinese fir) [6]. Thus, a great economic and resource waste is evaluated yearly in the seedling cultivation.
Seed abortion is not uncommon in plants. Previous researches have summarized four mainly embryological mechanisms including male sterility [7] caused by anther degeneration [8,9], pollen abortion [10,11] or abnormal tapetum cell structure [9,12,13]; female sterility caused by megasporocyte [14], female reproductive organ or vegetative organ degeneration [15]; poor pollination and/or fertilization which mainly manifested as incompatibility in self-crossing or out-crossing [16,17,18]; and the abortion in the embryonic development process after the formation of the normal zygote [19,20]. Stress from external environment, deficiency of mineral element, uncommon accumulation of endogenous hormone, and the expression of embryo defective genes may fail seed development [7,19,21,22], too. However, in most of those abortive seeds, the endosperm usually degenerates with the embryo and forms a cavity eventually. By contrast, the mature AS has a defective embryo, a dark reddish-brown endosperm, which is filled with secondary metabolites and a seed coat similar to that of GS, which gave them semblable extrinsic appearances.
However, the semblable but abortive AS provides a clue as to what fills the seed cavity of AS, and how this differs from that of normal GS growth and development. It may be the necessary basis allowing further understanding of the AS occurrence mechanism. Currently, although lots of studies about AS have been reported, most of them mainly focused on the morphological characteristics [5], environmental factors [23,24,25], oxidase activity [26], or various rules under different ecological conditions [27]. Only a few previously published data suggested that the tannin-like compounds may be the main components in the AS [26,28]. Even so, these suggestions are still lacking in convincing experimental evidence. Thus, the qualitative and quantitative information about the metabolomic profiling in AS are still missing.
Low molecular weight metabolites are the final products of cellular regulatory processes. Changes of them are regarded as the ultimate response to the environmental signal or the involved gene expression [29]. Comprehensive quantitative analysis of these metabolites, both on dynamic and static basis, plays an important role in current biological research to obtain metabolomics data which provide opportunities to investigate the metabolic changes during the accumulative process, understand the role of different metabolites in specific growing or developmental events, and profile the metabolic regulatory patterns responding to the environmental changes. Metabolomics technology have been widely used in plant physiological explorations. In plant seed developmental files, they have also been carried out in many species, such as soybean [30], barley [31], purple falsebrome [32], and mangosteen [33]. These studies allow researchers to obtain an overview about the dynamic accumulation of the essential metabolites, such as sugars, fatty acids, amino acids, nucleic acids, or plant hormones, during the physiological development of plant seed [30,33,34,35].
Unfortunately, neither seed development nor abortion has been reported from the metabolomics perspective in Chinese fir. The different patterns of metabolic changes or dynamic compounds accumulation between AS and GS are still unclear. It limits the further understanding of this special abortive seed. Therefore, the AS and GS samples were collected from four different stages according to their morphological characters for the metabolomics spectrum screening by using liquid chromatography-mass spectrometry (LC-MS) method in this study. Types, contents, diverse changes of the different expressive metabolites, and the metabolic pathways which could reflect the variable biological functions, are mainly focused on. From the results of this work, basic clues and preliminary information should be provided for further joint multiple omics studies. In addition, it could also offer a theoretical basis for the improvement of the current construction strategy in seed orchard of Chinese fir.

2. Materials and Methods

2.1. Samples Collection, Processing, and Storage

The samples were collected from the third-generation seed orchard of Chinese fir in Youxi National Forest Farm in 2017. This orchard is located in Youxi County, Sanming City, Fujian Province, China, with the geographical coordinates of 25°50′–26°26′ N, 117°48′–118°39′ E. The average annual temperature ranges from 15.8–19.6 °C, the highest temperature in July ranges from 27.9 °C to 40.5 °C, and the lowest temperature in January ranges from 8.9 °C to −7.6 °C. The annual precipitation is about 1400–1488 mm, the annual sunshine intensity ranges from 95–105 kcal/cm2, and the annual sunshine duration is 1764.6 tJ. Since its establishment in 2008, 70 excellent Chinese fir families have been collected.
The sampling stages were determined referring to Zhang’s observation [5]. The artificial supplementary pollination time of the seed orchard in 2017 (1st March) was recorded as 0d, and at 105d, 115d, 125d, and 135d, samples were collected, respectively. Ten individuals growing in the same district with robust growth, similar height and diameter at breast height (DBH) were randomly selected as materials. At each sampling stage, one plump and healthy cone was collected from those individuals and mixed as a sample pool. Each mixed pool was repeated three times.
After the seeds were taken out from the cones, the seed coat was dissected carefully and the embryo was placed under a microscope to determine whether it was an AS of a GS according to its color, luster, or hardness. Thus, there were 24 samples, namely the AS and GS group in 4 different sampling stages and with 3 duplications. Then, they were collected quickly into the sterilizing centrifuge tubes and stored in a −80 °C refrigerator.
Samples were sent to BioMarker Co., Ltd. (http://www.biomarker.com.cn/technology-services, Beijing, China) for further metabolomics analysis.

2.2. Samples Preparation and Extraction

All the freeze-dried AS/GS samples were crushed using a mixer mill (MM 400, Retsch) with a zirconia bead for 1.5 min at 30 Hz. Then, 100 mg powder of each samples was weighted and extracted overnight at 4 °C with 1.0 mL 70% aqueous methanol. Following centrifugation at 10,000× g for 10 min, the extracts were absorbed (CNWBOND Carbon-GCB SPE Cartridge, 250 mg, 3 mL; ANPEL, Shanghai, China, www.anpel.com.cn/cnw) and filtrated (SCAA-104, 0.22 μm pore size; ANPEL, Shanghai, China, http://www.anpel.com.cn/) before LC-MS analysis.

2.3. HPLC and ESI-Q TRAP-MS/MS Conditions

The sample extracts were analyzed using an LC-ESI-MS/MS system (HPLC, Shim-pack UFLC SHIMADZU CBM30A system, www.shimadzu.com.cn/; MS, Applied Biosystems 4500 Q TRAP, www.appliedbiosystems.com.cn/). The analytical conditions were as follows. HPLC: column, Waters ACQUITY UPLC HSS T3 C18 (1.8 µm, 2.1 mm × 100 mm); solvent system, water (0.04% acetic acid): acetonitrile (0.04% acetic acid); gradient program,95:5 v/v at 0 min, 5:95 v/v at 11.0 min, 5:95 v/v at 12.0 min, 95:5 v/v at 12.1 min, 95:5 v/v at 15.0 min; flow rate, 0.40 mL/min; temperature, 40 °C; injection volume: 5 μL. The effluent was alternatively connected to an ESI-triple quadrupole-linear ion trap (QTRAP)-MS.
LIT and triple quadrupole (QQQ) scans were acquired on a triple quadrupole-linear ion trap mass spectrometer (Q TRAP), API 4500 Q TRAP LC/MS/MS System, equipped with an ESI Turbo Ion-Spray interface, operating in a positive ion mode and controlled by Analyst 1.6 software (AB Sciex). The ESI source operation parameters were as follows: ion source, turbo spray; source temperature 550 °C; ion spray voltage (IS) 5500 V; ion source gas I (GSI), gas II(GSII), curtain gas (CUR) were set at 55, 60, and 25.0 psi, respectively; the collision gas (CAD) was high. Instrument tuning and mass calibration were performed with 10 and 100 μmol/L polypropylene glycol solutions in QQQ and LIT modes, respectively. QQQ scans were acquired as MRM experiments with collision gas (nitrogen) set to 5 psi. DP and CE for individual MRM transitions was done with further DP and CE optimization. A specific set of MRM transitions were monitored for each period according to the metabolites eluted within this period [36].

2.4. Qualitation and Quantitation of Metabolites

Based on the self-built database and the public databases (HMDB, http://www.hmdb.ca/; METLIN, https://metlin.scripps.edu/; and KEGG, http://www.kegg.jp/kegg/compound/.), the qualitative analysis was carried out according to the secondary spectral information. The isotope signal, the repeated signal containing K+ ion, Na+ ion, and NH4+ ion, as well as the repeated signal of fragment ions with other larger molecular weight substances were removed.
Quantification was accomplished by using the multiple reaction monitoring (MRM) model of tripe four-stage rod mass spectrometry. After obtaining the metabolite spectrum analysis data of different samples, the peak area integral was performed for all the mass spectrum peaks and the integral correction was performed for the mess spectrum peaks of the same metabolite in different samples [37].

2.5. Identification and Verification of Different Expressive Metabolites

Analyst v1.6.1 software was used to process the raw data of mass spectrometry. The MultiaQuant software was used to integrate and correct the chromatographic peaks. The peak area of each chromatographic peak represented the relative content of the corresponding compounds. Finally, all the chromatographic peak area integral data were derived. Principal component analysis (PCA), orthogonal partial least squares discriminant analysis (OPLS-DA), and Pearson correlation coefficient calculation were performed by RStudio software (www.r-project.org/).
Subsequently, the metabolites of different groups were preliminarily screened by the variable importance in project (VIP) value obtained from the OPLS-DA model. The fold change (FC) value was combined to further screen out the different expressive metabolite (DEM). The metabolites with the FC ≥ 2.0 or FC ≤ 0.5 were considered to differ more than twice or less than 0.5 between the AS and GS group, while with VIP value ≥ 1.0 was considered to have significant influence on the classification of samples in each group in the OPLS-DA model. Metabolites that fit both of the conditions were selected as the DEMs.
To verify the accuracy of the relative quantificational results generated from the LC-MS signals, 16 metabolites were selected randomly for further HPLC quantification. The HPLC condition was the same as that described in Section 2.3. Standards of those selected metabolites were bought from the Shinemro chemical platform (http://www.shinemro.com, Shanghai, China). The real concentrations were calculated using the methods reported by Lin [28].

2.6. KEGG Enrichment Analysis

To further understand the biological connection associated with the dynamic expression of the metabolites, all of the DEMs were mapped to the KEGG database (http://www.genome.jp/KEGG/pathway.html) using MetaboAnalyst online tools (http://www.metaboanalyst.ca/). Basic information including KEGG ID of DEMs, mapped pathways ID, mapping rate of each pathway, p-value of the metabolic pathway, false discovery rate corrected p-value, −log10 (p-value), and rich factor were obtained or calculated. The visualization of the enrichment results was completed by the ggplot2 package of RStudio software.

3. Results

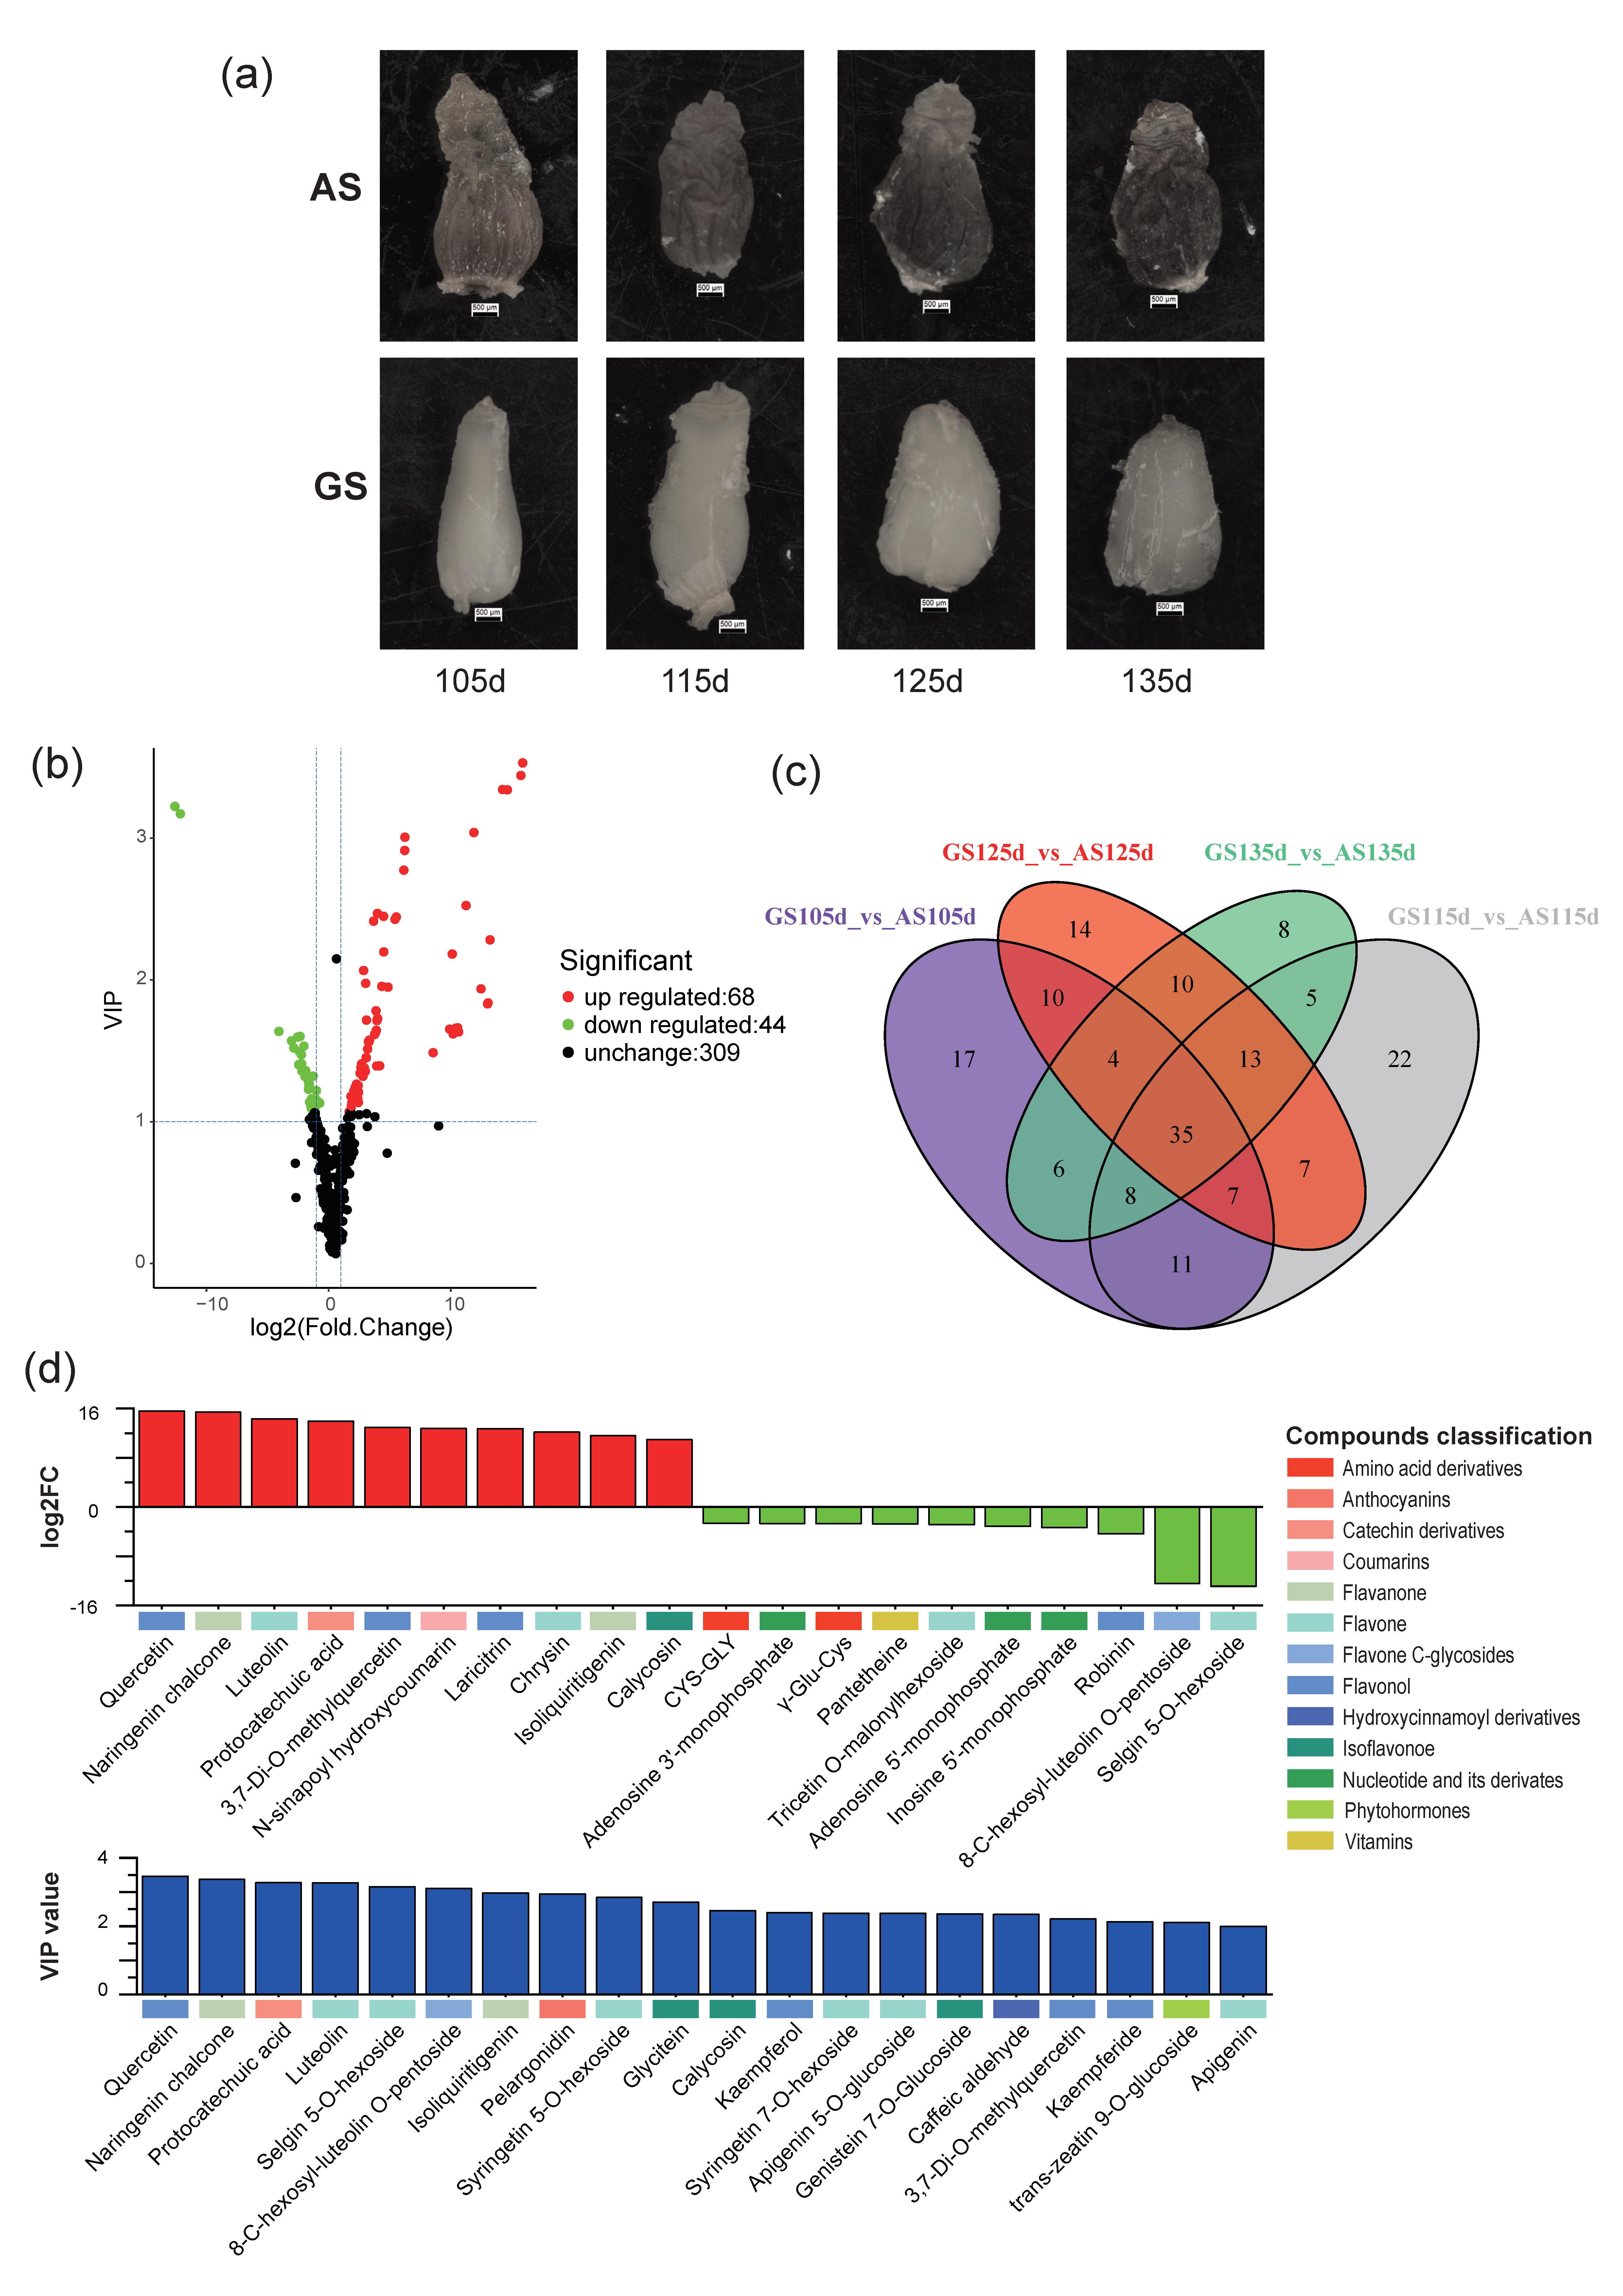
3.1. Status of Astringent and Germinable Seeds

The difference between AS and GS in appearance was obviously observed after removing the seed coat in Figure 1a. From 105d to 135d after the pollination, the embryo of GS exhibited a high level of plumpness, whereas that of AS wrinkled and dried up on the surface. Besides, the color of AS was distinctly darker than that of GS. However, there was no significant difference in size. It suggests that the AS is different from common abortive seed.

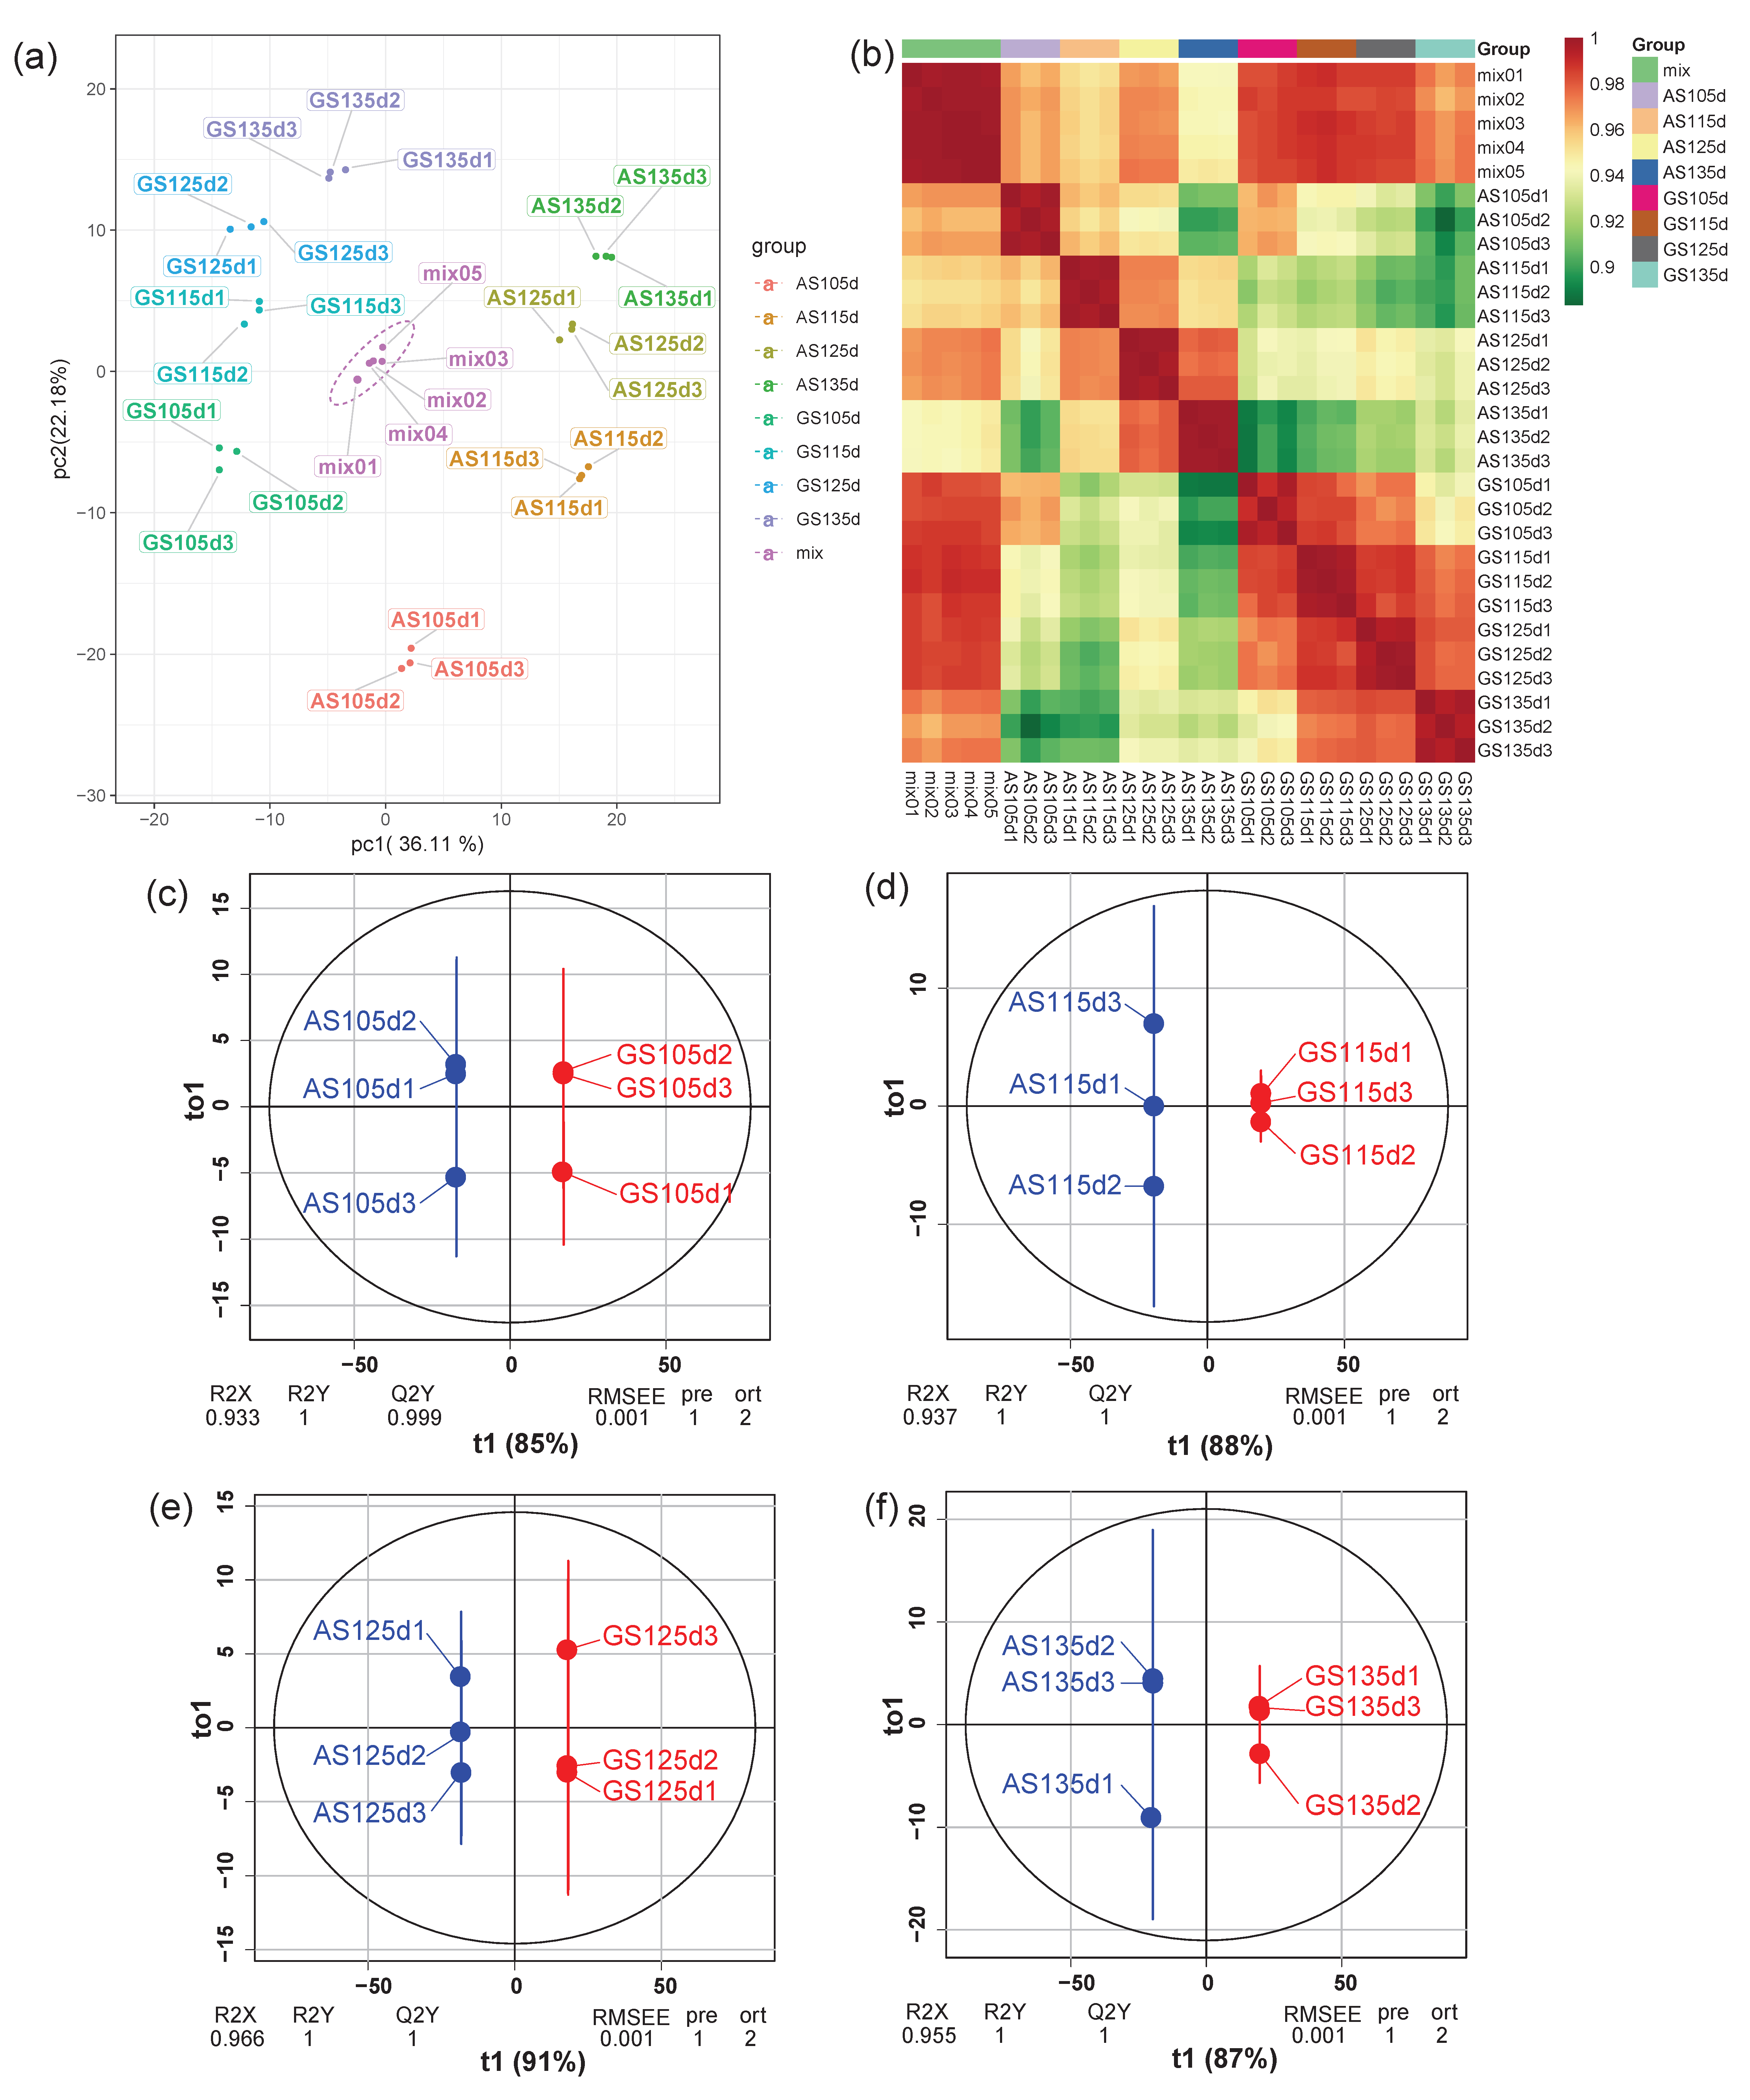
3.2. Samples Reliability Analysis

A principal component analysis (PCA) was used to evaluate the variation level among and within those sample groups. Obvious intergroup separation and intragroup aggregation were observed in Figure 2a, which reflected the representative metabolic changes between AS and GS at different stages. The Pearson correlation estimation (Figure 2b) showed that the r2 value in each group, which is used to assess the reliability of biological duplication, was observed close to 1.00. It indicated that the samples within each group had a strong correlation and good repeatability for further statistics. Additionally, based on the results of orthogonal partial least squares-discriminant analysis (OPLS-DA), samples from AS and GS group at different stages were separated spectrally, while the R2X, R2Y, and Q2Y values in each model were equal/close to 1.00 (Figure 2c–f), suggesting a statistically significant difference between their metabolomics profilies.

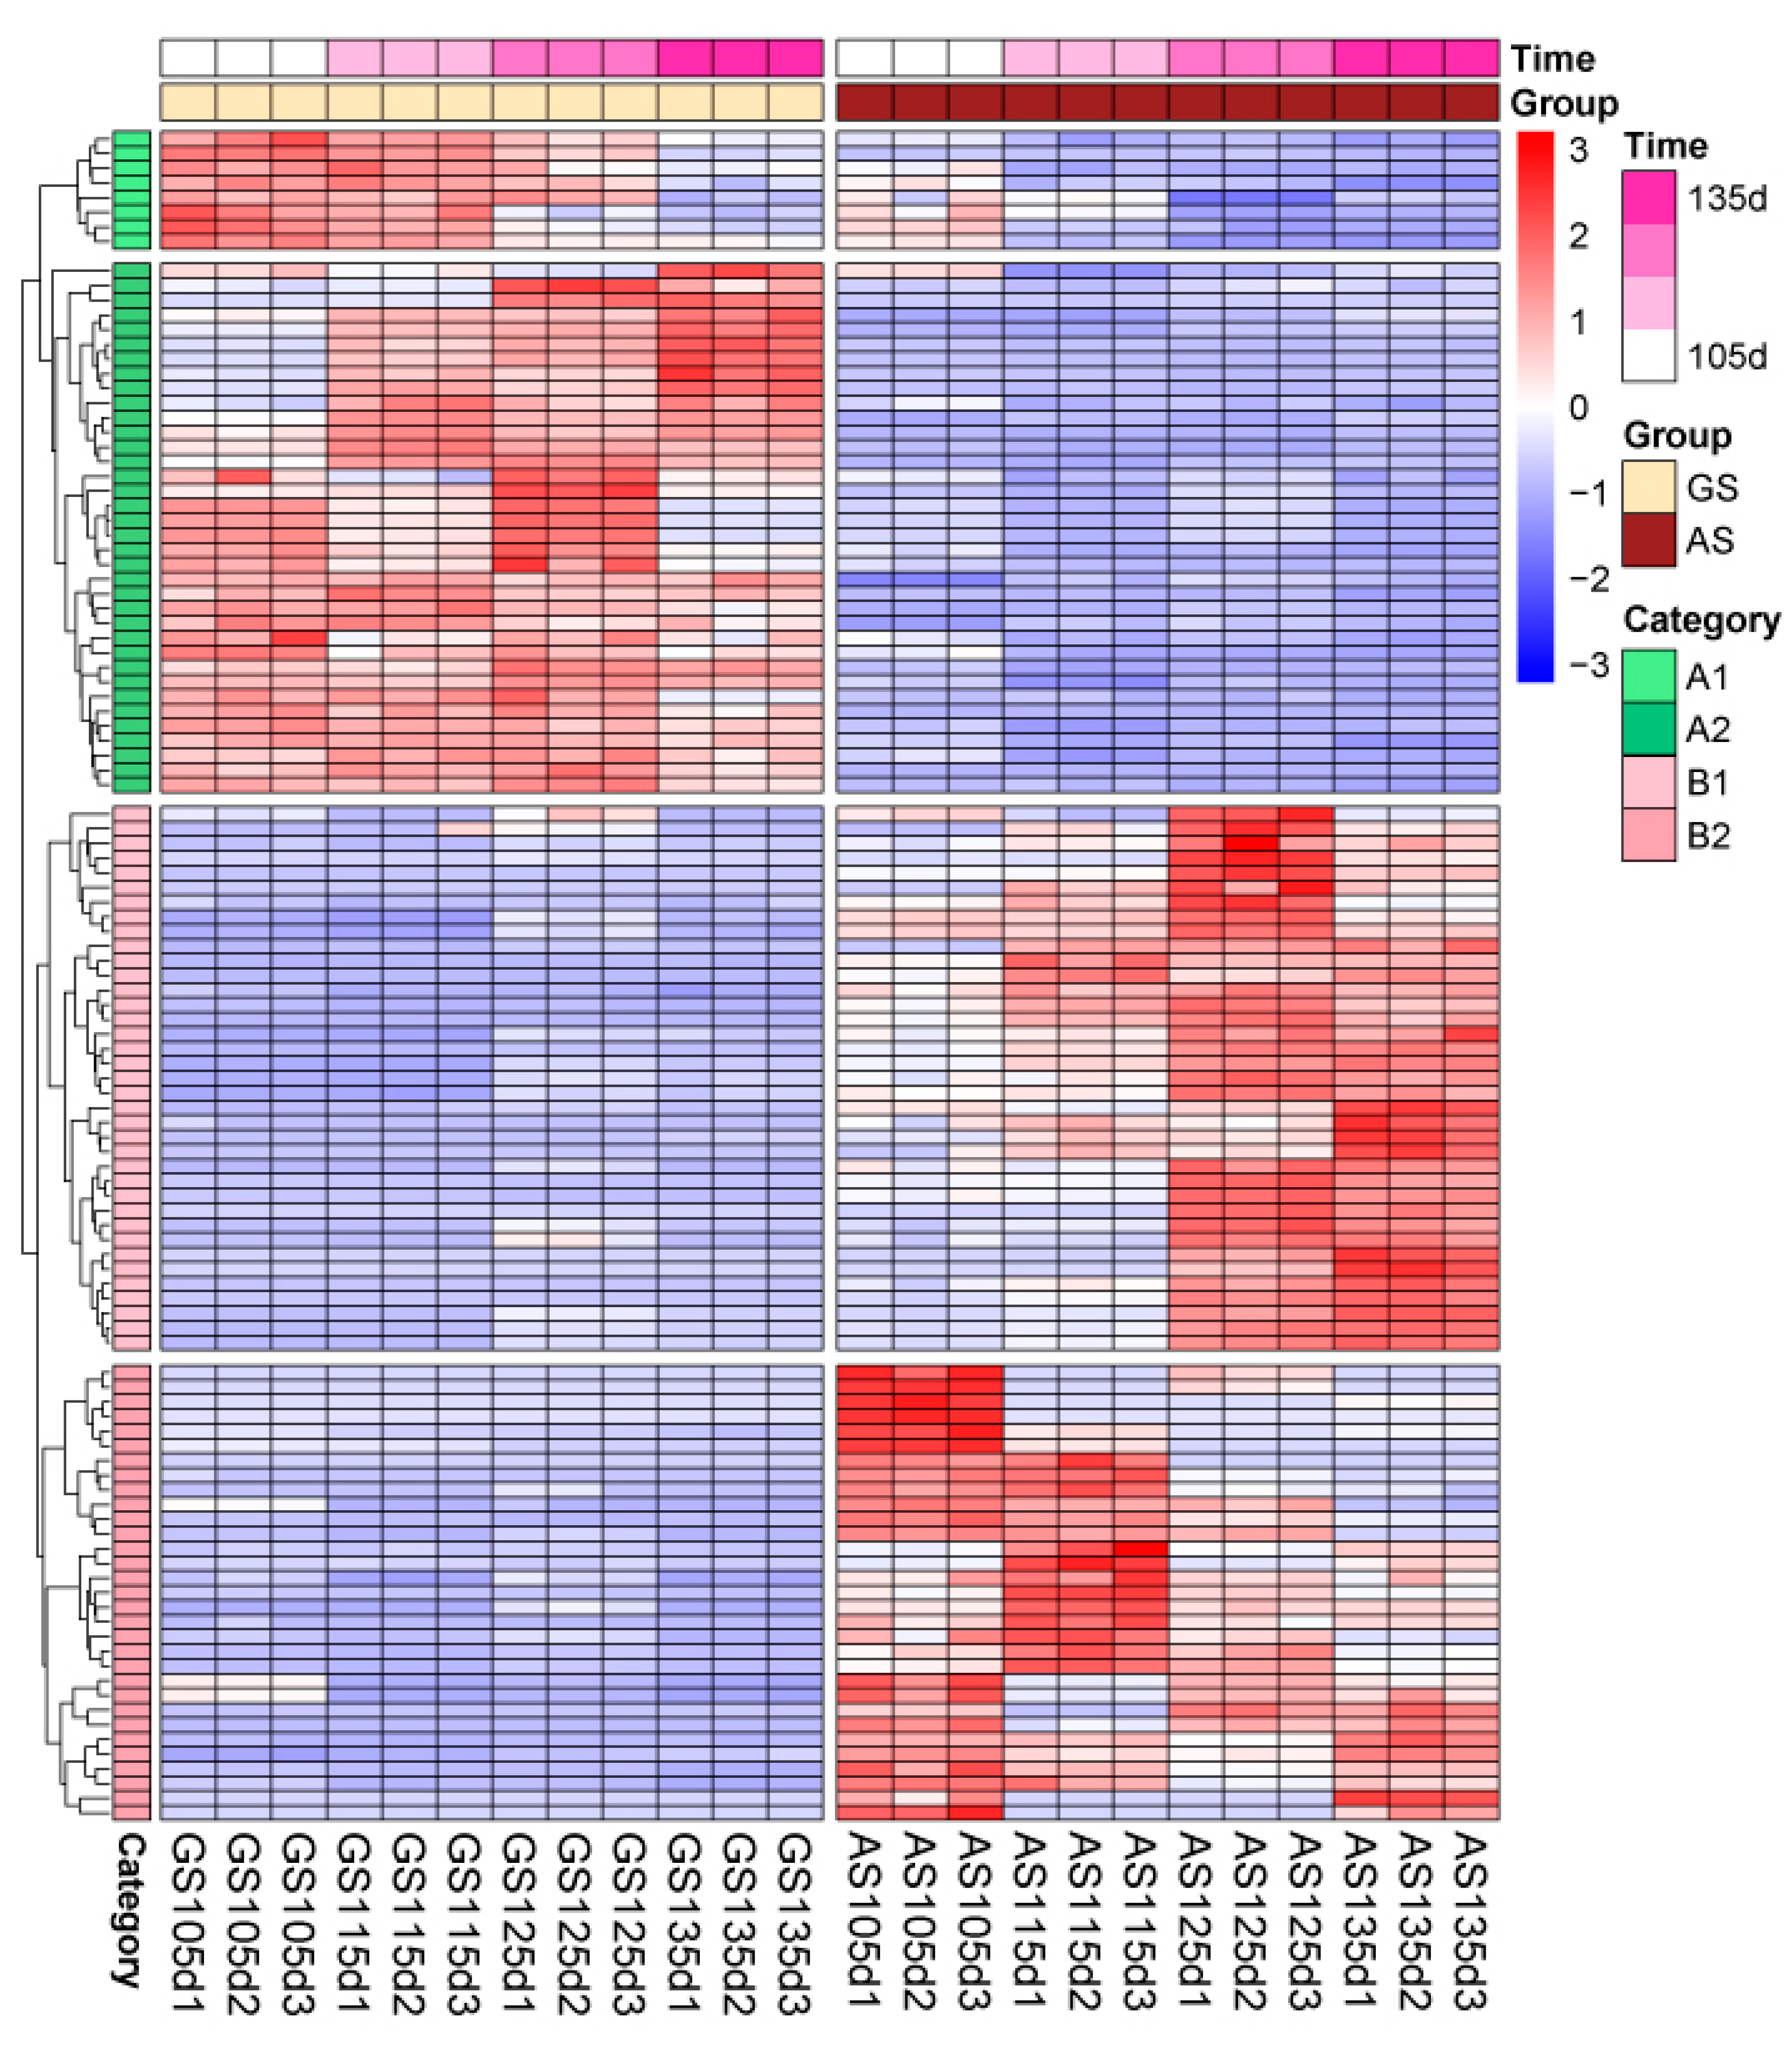
3.3. Selection and Classification of Different Expressive Metabolites

A total of 421 metabolites were screened (Table S1), out of which 112 metabolites (Table S2), including 68 up-regulated and 44 down-regulated metabolites, were further identified to have significant difference between AS and GS group (Figure 1b), accounting for 26.60% of the total metabolites. The DEMs were further grouped into 26 classes and classified information was shown in Table 1. Flavone (18 flavone metabolites were screened accounting for 16.07% of all DEMs) was the most abundant class, followed by flavonol (15 flavonol metabolites, 13.39%), and amino acid derivatives (10 amino acid derivatives, 8.93%).
DEMs performed differently at different stages. Based on Figure 1c, 35 DEMs were found to be shared over all stages, whereas 17, 22, 14, and 8 DEMs were found exclusively in 105d, 115d, 125d, and 135d, respectively. The top 20 significant DEMs, including the top 10 up-regulated and top 10 down-regulated metabolites, as well as the top 20 metabolites with the highest VIP value, were shown in Figure 1d. The most evident different metabolite between AS and GS was guercetin, which expressed the highest level of log2FC (15.59) and VIP value (3.46) and was followed by Naringin chalcone (log2FC = 15.44, VIP = 3.37). On the other hand, Selgin 5-O-hexoside and 8-C-hexosyl-luteolin O-pentoside showed the minimum log2FC values (−12.88 and −12.43, respectively) and their VIP values were also at high levels (3.16 and 3.10, respectively), uncovering their serious deficiency in AS.

3.4. Expressive and Accumulative Change of Different Expressive Metabolites

In order to demonstrate the variation of metabolic expressive patterns between the two types of seed samples, the expression of those metabolites during the developmental process were shown in Figure 3. Based on the cluster result, all the DEMs were classified into two major categories. Forty-four lower content or down-regulated accumulative metabolites were clustered into category (A), whereas 68 metabolites which showed the opposite trend were clustered into category (B). Further, both categories (A) and (B) were divided into two subcategories.
Eight DEMs including Quinine, Pantetheine, Indole 3-acetic acid (IAA), etc., were recorded in subcategory (A1). Phytohormones, alkaloids, amino acid derivatives, and other four types of metabolites mainly constitute this subcategory (Table 1). In GS group, these metabolites exhibited a high level of expression at 105d, and then decreased slowly. Meanwhile, a relatively high expression was also observed in the AS group at 105d, and, similarly, decreased subsequently but more rapidly.
There were 36 DEMs in subcategory (A2) including Nα-Acetyl-L-arginine, N’-p-Coumaroyl putrescine, Kaempferol-3-O-robinoside-7-O-rhamnoside, etc. Metabolites in this subcategory were mainly amino acid derivatives, glycerophospholipids and nucleotide derivates (Table 1). The expression of them in AS and GS group were significantly different during all of the four stages. In GS group, contents of these metabolites were at high levels, and increased gradually with the developmental process. In contrast, extremely low expressions of them were showed in the AS group.
The metabolites of subcategory (B1) comprises 37 DEMs including 8-Methyl-2-oxo-4-phenyl-2H-chromen-7-yl 4-(hexyloxy) benzoate, Tricin 4′-O-β-guaiacylglycerol, Spiraeoside, etc. Most of them were flavonol or flavanone compounds (Table 1). At 105d, the expressive levels of thses metabolites both in AS and GS group were very low. Subsequently, their contents in AS group increased rapidly, but similar changes did not occur in GS group.
In subcategory (B2), 31 DEMs were classified including MAG (18:4) isomer2, Rhamnetin, Biochanin A, etc., and flavone accounted for the largest proportion (Table 1). As the regulated pattern in subcategory (B1), metabolites in this subcategory showed a low accumulative content during all of the four stages in GS group. However, contrary to the (B1), those metabolites decreased in AS group during except a few of them.
To verify the accuracy of the relative metabolomics data, 16 DEMs were selected randomly, and their real concentrations in the AS and GS samples were further determined by high-performance liquid chromatography (HPLC) method. Among them, Quinine, Dihydrozeatin, and 5-hydroxy-l-tryptophan were selected from subcategory (A1) metabolites; Robinin, H-homoarg-OH, Methyl nicotinate, and 3-indoleacetonitrile were selected from subcategory (A2) metabolites; Quercetin, Kaempferol, Apigenin, Octadecadien-6-ynoic acid, and Protocatechuic acid were selected from subcategory (B1) metabolites; and Myricetin, (R)-lipoic acid, Dodecanedioic acid and L-asparagine were selected from subcategory (B2) metabolites. The results were shown in Figure 4. The changes of these selected metabolites in different stages supported the conclusion from the expressive analysis.

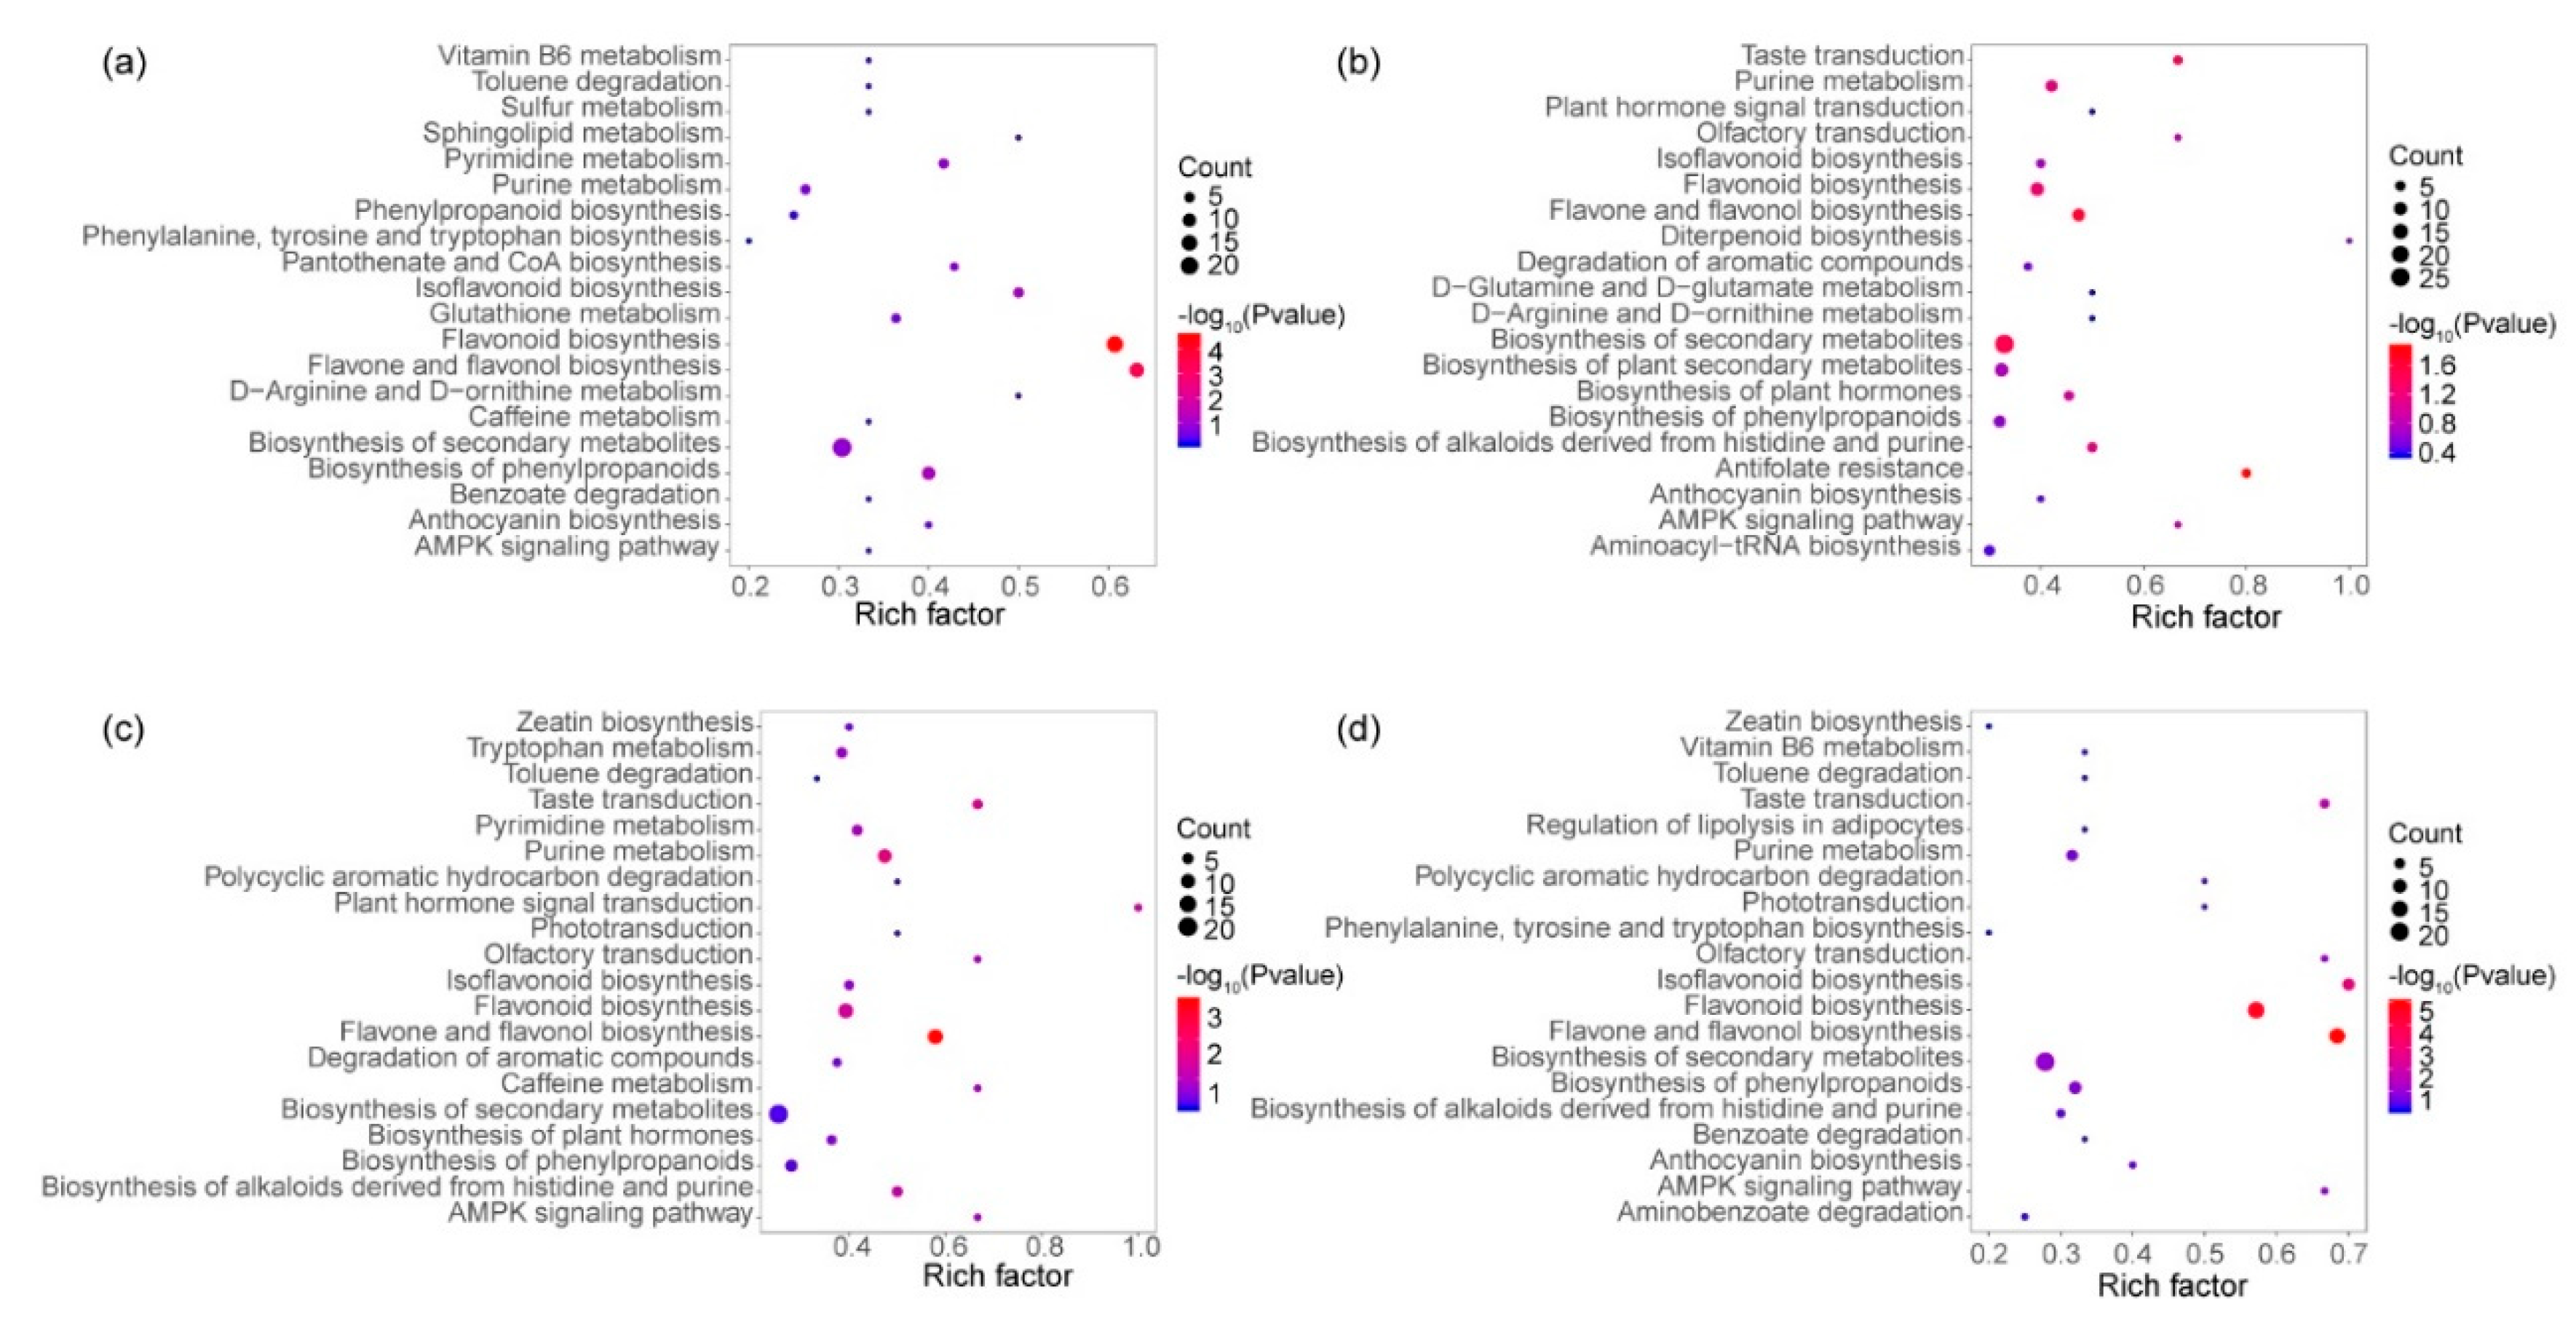
3.5. KEGG Enrichment of Different Expressive Metabolites

To further understand the biological function of those DEMs, they were mapped into the KEGG database for the enrichment analysis. The enrichment results and pathways evaluation were showed in Figure 5 and Table S3. DEMs in flavonoid biosynthesis pathway and flavone and flavonol biosynthesis pathway were significantly enriched at p < 0.05 level in all four stages, implying that metabolites in these two pathways existed a significant difference between certain groups. Actually, most pathways which have a strong relationship with the metabolism of flavonoids and their derivatives showed relatively obvious enrichment effect. Isoflavonoid biosynthesis pathway, down-stream to the flavonoid biosynthesis pathway, for example, was significantly enriched in 135d (p = 0.001). Similar results were also found in the biosynthesis of phenylpropanoids pathway or the anthocyanin biosynthesis pathway (Figure S2). It agreed with the results in Figure 1c, and suggested that the flavonoid-like compounds may play an irreplaceable role in the occurrence of AS.
Pathways related to amino acid metabolism, for example, glutathione metabolism; D-arginine and D-ornithine metabolism; D-glutamine and D-glutamate metabolism; tryptophan metabolism; phenylalanine, tyrosine and tryptophan biosynthesis; etc., were enriched during the process, highlighted the difference in amino acid metabolism between AS and GS. Similarly, the enrichment results of pyrimidine metabolism and especially the purine metabolism pathway, which was significantly enriched in 125d (p = 0.017), also explained the similar trend of nucleotide metabolism.
The plant hormone signal transduction pathway was relatively enriched at 115d and 125d. However, the zeatin biosynthesis pathway and the tryptophan metabolism pathway which related to IAA biosynthesis were enriched at 125d or 135d. From the details of these two pathways (Figure S3), some involved metabolites displayed significantly lower contents in AS than in GS, indicating that their accumulation was insufficient in AS.

4. Discussion

The physiological maturation of a plant seed is not only a process of tissue development and function improvement, but also the process of nutrient accumulation [38]. Nutrients in the vegetative organs are transported to seeds in the form of soluble substances, such as sucrose and amino acids, and further transformed into insoluble polymer compounds like starch, protein, and fatty acids gradually, to form the main components of seeds and prepare for the future germination [39,40]. Thus, the gradual growth of size from is a common phenomenon during seed maturation.
In this study, the AS of Chinese fir were observed to have a similar size to GS as well. However, from the perspective of the metabolites accumulative variation, there are several obvious basic differences between them during the astringent compounds accumulated stages. Firstly, the contents of flavonoid compounds and their derivatives, including flavones, flavonols, flavanones, isoflavones, and anthocyanins, are significantly higher in AS (Figure S2). On the other hand, the accumulations of nucleotides, amino acids, and other soluble nutrients in AS are significantly lower. Furthermore, phytohormones, lipids, organic acids, and other important metabolites related to seed development in AS are abnormally metabolized, too. This indicates that the increase of the AS volume should be attributed to the excessiveness of flavonoids and their derivatives, rather than normal nutrient accumulation.
Flavonoid compounds are the precursors for the biosynthesis of tannins [41]. Due to the strong reactive oxygen species’ (ROS) binding ability, flavonoids are well known as the antioxidant metabolites involved in the defense system of the living cells [42,43]. The biosynthesis and accumulation of flavonoid compounds in plant seeds have been widely reported [44,45]. In grape, flavonoid compounds have already been extracted, developed, and utilized in the food and medical fields [46]. In AS of the Chinese fir, flavonoid metabolites were found to be significantly up-regulated and excessively accumulated. It strongly indicated that the cells in AS may suffer the attack from the ROS. On the other hand, the decrease of polyphenol oxidase (PPO) activity in AS [26,28] means that the ROS binding function used initiated from this catalyst is no longer available, and may further lead to reduce of flavonoids consumption. However, the origin of the ROS in AS is still unclear. From the anatomical evidence, the damaged embryo may trigger and exacerbate the overproduction of ROS. The severely climatic factors, such as high temperature, precipitation, and typhoon may also make the seeds subjected to environmental stress [24,25], and further affecting the ROS activity.
Flavonoids can also affect the biosynthesis of phytohormones. Over-expressed flavonoids could induce the embryonic abortion via breaking the metabolic balance of indole 3-acetic acid (IAA), which plays an essential role in embryo growth [47]. In this paper, multiple intermediate compounds in IAA biosynthesis pathway, such as 5-hydroxy-l-tryptophan, 3-indoleacetonitrile, and IAA, were also observed to show a significant decrease in accumulation or down-regulated (Figure S3). Therefore, it can be inferred that the embryonic abortion in AS may also be related to the disordered regulation between flavonoids and IAA. Glycosylation of flavonoid compound has been proved to impact the accumulation of carbohydrate during the seed developmental process [48]. Flavone C-glycosides metabolites were also found to be different expressed significantly in AS. For example, the 8-C-hexosyl-luteolin O-pentoside, which ranked the second in log2FC value and the sixth in VIP value (Figure 1d), was strongly regulated. This indicated that the glycosylation of flavonoids may also involve in the abnormal accumulation of flavonoids.
Nucleotides and amino acids are the raw materials for the biosynthesis of nucleic acids and proteins, respectively. In GS, the contents of nucleotide and amino acid metabolites increased gradually with the developmental process, which reflected a normally physiological activity in cells and tissues [39]. This is consistent with the growth of seeds, and in line with the general physiological activities and change rules [30]. However, extremely low contents of nucleotides and amino acids were found in AS, which illustrated the inhibited basic cellular activities and the reduced genetic substances biosynthesis. This illuminated the inactivation and death of cells in the embryonic tissue of AS. More importantly, it suggested that the size increase of AS is not a general physiological development.
A variety of phytohormones play crucial roles in the development of seeds. Different phytohormones and their interactions constitutes a complex regulative network for embryo maturity. In this study, IAA and zeatin in AS were found to displaymajor differences in accumulated phytohormones (Figure S3).
IAA is an essential plant growth regulator. It has been proved that IAA involves in a series of regulative biological processes, affects the formation of different organs in developing embryo, and ultimately determines the polarized growth since the dormant zygote has been activated [49,50]. Aberrant cell division or disordered arrangement in tissues of the radicle, apical, suspensor, cotyledon, and vascular bundle can be observed in Arabidopsis thaliana after the metabolic disturbance of IAA [50,51,52]. Base on the expressive data in this work, the IAA performed the strongest down-regulated level among all of the phytohormones in AS. At the same time, a mass of key metabolites in the three major IAA biosynthesis pathways including indolepyruvate pathway, indoleacetonitril pathway, and tryptamine pathway, also expressed lower content. It indicated that the synthesis of IAA was restrained. Moreover, the deficiency of IAA, which was affected by the accumulation of flavonoids as mentioned above, may further defect the embryo in AS [53].
Zeatin is evidently reported to present almost all cell divisive processes involved in plant growth or development. In plant seed maturity, zeatin mediates the accumulation of assimilative products, and influence the cell division or tissue development in ovule and endosperm [54]. The cell cycle regulatory factors, such as cyclin-dependent kinases, will be enhanced by the zeatin, and further promote the cellular transformation from the G1/S phase to G2/M [55]. In 105d of AS, the content of dihydrozeatin was relatively high but still significantly lower than that in GS. Subsequently, it decreased rapidly both in the AS and GS samples. This illustrated that dihydrozeatin worked as a regulator in the early embryonic developmental stage [56]. Interestingly, the storage form (trans-zeatin 9-O-glucoside, up-regulated in AS) of trans-zeatin performed an opposite trend to the deactivation form (trans-zeatin N-glucoside, down-regulated in AS), and both of them were up-regulated after the down-regulation of dihydrozeatin (Table S2). This emphasized the different form changes of zeatin in AS and GS.
Lipid metabolites mainly showed low content level or down-regulation in AS samples. Three major types of lipids, including fatty acids, glycerolipids, and glycerophospholipids (Table 1) were listed in the DEMs. Among them, nine metabolites of glycerophospholipids, which accounted for the largest proportion in lipids, were detected and clustered into the subcategory (B2), highlighting the serious lack of those compounds in AS. As the basic structural elements of cellular membrane systems, lipids display a crucial role in cell signal transduction for the intercellular communicative and interactive function [57]. It also serves as the major form of energy reserve in plant seeds to ensure the germination [58]. The significant down-regulative accumulation of lipid metabolites in AS reflected the destruction of the membrane systems, or the decrease of the viable cell caused by the damaged embryonic tissue after the defective activity.
More interestingly, the enrichment analysis of DEMs suggested that the taste transduction pathway was significantly enriched from 115d, indicating that the astringent seeds may bring different taste experience to animals who feed on plant seeds from the middle stage of its occurrence. A plant cheating behavior has been reported in pomegranates [59] and sorghum [60]. Seeds of them sometimes accumulate excessive condensed tannin-like compounds, and thus protects them from being eaten by rodents or birds. In contrast, seeds full with aromatic and fatty acid-derived volatiles should be more consistent with the predatory accessions of the animals such as birds or rodents [60]. In this study, a variety of flavonoids and scarce of fatty acid (Table 1) in AS implies a similar hypothesis. As a gymnosperm species, Chinese fir has a semi-open cone. The seed coat is too thin to protect the embryo, too. So the defensive systems seems to be not efficient enough to protect them from predation. Moreover, the growth of AS consumes energy without providing any retribution to their parent individuals or populations. Considering these paradoxes, it cannot be ruled out that the existence of AS in Chinese fir seems to have a similar protective effect from the biological co-evolutionary view.

5. Conclusions

The present study provided an overview about the comparative metabolomics characteristics between astringent and germinable seed of Chinese fir during the astringent compounds accumulation stages. The significantly different expressive metabolites were identified and classified, and their accumulative activities and changes during the occurrence were demonstrated. Further, the different metabolic patterns, and the most evident characteristics between them were summarized. The expanding of the astringent seed was not the normal growth as that in germinable seed, but caused by the abnormal accumulation of the flavonoids metabolites and their derivatives after embryo abortion. Nucleotides, amino acids, phytohormones, lipids, and other metabolites were also involved into the occurrence of the astringent seed. This preliminary study offered baseline and tentative clues from the metabolomics perspective for the further omics exploration to reveal the mechanism of the astringent seeds in the near future.

Supplementary Materials

The following are available online at https://www.mdpi.com/1999-4907/11/11/1206/s1, Figure S1: MRM detection of multimodal maps, Figure S2: Metabolites changes in flavonoids and derivatives biosynthesis pathways, Figure S3: Metabolites changes in IAA and Zeatin biosynthesis pathways, Table S1: Raw data, Table S2: Details of the 112 DEMs, Table S3: Evaluation of the KEGG enrichment.

Author Contributions

Conceptualization, S.L. and Y.C.; methodology, Y.C.; formal analysis, Y.C.; investigation, Y.C. and C.W.; data curation, Y.C. and Y.W.; writing—original draft preparation, Y.C.; writing—review and editing, S.L.; visualization, C.W. All authors have read and agreed to the published version of the manuscript.

Funding

This research was funded by Chinese Fir Engineering Technology Research Center of the State Forestry and Grassland Administration, grant number Ptjh 1300002.

Acknowledgments

Experimental Materials Support: Great help from the Third-generation Seed Orchard of Chinese fir, Youxi National Forest Farm with offering all the samples in this work. Grateful acknowledgements are announced from all the authors.

Conflicts of Interest

The authors declare no conflict of interest.

References

  1. Bian, L.M.; Zheng, R.H.; Su, S.D.; Lin, H.Z.; Xiao, H.; Wu, X.M.; Shi, J. Spatial analysis increases efficiency of progeny testing of Chinese fir. J. For. Res. 2017, 28, 445–452. [Google Scholar] [CrossRef] [Green Version]
  2. Shi, J.S. The present situation of Chinese fir genetic improvement in Fujian Province and the technical countermeasures of developing it. J. Fujian For. Sci. Technol. 1994, 21, 28–31, (Chinese with English abstract). [Google Scholar]
  3. Zhang, Z.W. Studies on the pollination characteristics and pollination level of Chinese fir seed orchard. Silvae Genet. 2004, 53, 7–11. [Google Scholar]
  4. Zheng, R.H.; Shi, J.S.; Su, S.D.; Lin, H.Z.; Lin, J.C.; Fang, L.M.; Ye, D.Q. The establishment technique and application of the third generation seed orchard of Chinese fir. J. For. Environ. 2018, 38, 406–413, (Chinese with English abstract). [Google Scholar]
  5. Zhang, Y.; Zuo, D.D.; Chen, Y.; Xiong, S.; Wang, Z.; Lin, S.Z. Anatomical observation of ovule of Cunninghamia lanceolata. J. For. Environ. 2017, 37, 142–147, (Chinese with English abstract). [Google Scholar]
  6. Guan, K.L.; Huang, J.Q.; He, F.J. Cone seed-extracting percentage and full seed percentage for seed orchard of Chinese fir. J. Zhejiang For. Coll. 1997, 14, 127–133, (Chinese with English abstract). [Google Scholar]
  7. Chang, Z.Y.; Chen, Z.F.; Wang, N.; Xie, G.; Lu, J.W.; Yan, W.; Zhou, J.; Tang, X.; Deng, X.W. Construction of a male sterility system for hybrid rice breeding and seed production using a nuclear male sterility gene. Proc. Natl. Acad. Sci. USA 2016, 113, 14145–14150. [Google Scholar] [CrossRef] [Green Version]
  8. Sander, P.M.; Bui, A.Q.; Weterings, K.; Mcintire, K.N.; Hsu, Y.C.; Lee, P.Y. Anther developmental defects in Arabidopsis thaliana male-sterile mutants. Sex. Plant Reprod. 1999, 11, 297–322. [Google Scholar] [CrossRef]
  9. Suzuki, K.; Takeda, H.; Tsukaguchi, T.; Egawa, Y. Ultrastructural study on degeneration of tapetum in anther of snap bean (Phaseolus vulgaris L.) under heat stress. Sex. Plant Reprod. 2001, 13, 293–299. [Google Scholar] [CrossRef]
  10. Kong, X.K.; Khan, A.; Li, Z.L.; You, J.Y.; Munsif, F.; Kang, H.D.; Zhou, R. Identification of chalcone synthase genes and their expression patterns reveal pollen abortion in cotton. Saudi J. Biol. Sci. 2020. [Google Scholar] [CrossRef]
  11. Pavlova, D.K.; Bani, A. Pollen biology of the serpentine-endemic Orobanche nowackiana (Orobanchaceae) from Albania. Aust. J. Bot. 2019. [Google Scholar] [CrossRef]
  12. Ku, S.; Yoon, H.; Suh, H.S.; Chung, Y.Y. Male-sterility of thermosensitive genic male-sterile rice is associated with premature programmed cell death of the tapetum. Planta 2003, 217, 559–565. [Google Scholar] [CrossRef] [PubMed]
  13. Pacini, E.; Franchi, G.G.; Hesse, M. The tapetum: Its form, function, and possible phylogeny in Embryophyta. Plant Syst. Evol. 1985, 149, 155–185. [Google Scholar] [CrossRef]
  14. Pettitt, J. Developmental mechanisms in heterospory: I. Megasporocyte degeneration in Selaginella. Bot. J. Linn. Soc. 2010, 64, 237–246. [Google Scholar] [CrossRef]
  15. Pannell, J.; Voillemot, M. Plant mating systems: Female sterility in the driver’s seat. Curr. Biol. 2015, 25, R511–R514. [Google Scholar] [CrossRef] [Green Version]
  16. Ortega-Olivencia, A.; Paredes, J.A.; Rodríguez-Riaño, T.; Alcaraz, J.A. Modes of self-pollination and absence of cryptic self-incompatibility in Drosophyllum (Droseraceae). Plant Biol. 2015, 111, 474–480. [Google Scholar] [CrossRef]
  17. Butcher, A. The relationship between sexual outcrossing and heterokaryon incompatibility in Aspergillus nidulans. Heredity 1968, 23, 443–452. [Google Scholar] [CrossRef]
  18. Liu, K.W.; Liu, Z.J.; Huang, L.Q.; Li, L.Q.; Chen, L.J.; Tang, G.D. Self-fertilization strategy in an orchid. Nature 2006, 441, 945–946. [Google Scholar] [CrossRef]
  19. Zhang, S.S. Insights on seed abortion (endosperm and embryo development failure) from the transcriptome analysis of the wild type plant species Paeonia lutea. Bioinformation 2020, 16, 638–651. [Google Scholar] [CrossRef]
  20. Hwang, Y.J.; Okubo, H.; Fujieda, K. Pollen tube growth, fertilization and embryo development of camellia japonica L.*C. chrysantha (Hu) tuyama. J. Jpn. Soc. Hortic. Sci. 2008, 60, 955–961. [Google Scholar] [CrossRef]
  21. Bennell, M.R.; Cleugh, H.; Leys, J.; Hein, D. The effect of hot dry wind on the pod set of faba bean (Vicia faba) cv. Fiord: A preliminary wind tunnel study. Aust. J. Exp. Agric. 2007, 47. [Google Scholar] [CrossRef]
  22. Meinke, D. Genome-wide identification of EMBRYO—DEFECTIVE (EMB) genes required for growth and development in Arabidopsis. New Phytologist. 2019, 226, 226. [Google Scholar] [CrossRef] [PubMed] [Green Version]
  23. Guan, K.L. Comprehensive analysis on causes for hollow, kernel and woody seeds of Chinese fir cones. J. Zhejiang For. Coll. 1997, 14, 88–93, (Chinese with English abstract). [Google Scholar]
  24. Lin, S.Z.; Song, S.X. A study on the trend of geographic epidemic of Chinese fir sterile seed. Acta Phytoecol. Geobot. Sin. 1990, 14, 40–45, (Chinese with English abstract). [Google Scholar]
  25. Wu, C.Z.; Hong, W.; Lin, S.Z. Study on spatial variability of Chinese fir sterile seeds. Chin. J. Appl. Environ. Biol. 1998, 4, 15–19, (Chinese with English abstract). [Google Scholar]
  26. Huang, L.Z. The peroxidase isozymes activity and lipid peroxidation in relation to aborted embryo in aborted seed of Chinese-fir. Acta Bot. Boreal. Occident. Sin. 1996, 16, 83–88, (Chinese with English abstract). [Google Scholar]
  27. Lin, S.Z.; Zhuang, Z.R.; Yu, X.T. Analysis of the epidemic of the Chinese fir sterile seed in the zones and its application on choice of the habital of the seed garden. J. Fujian Coll. For. 1989, 9, 310–314, (Chinese with English abstract). [Google Scholar]
  28. Lin, X.Q.; Ma, Z.H.; He, Z.M.; Chen, Y.; Peng, Y.R.; Lin, S.Z. Optimization of ultrasonic-assisted extraction process for polyphenols from the seeds of Chinese fir. J. For. Environ. 2017, 37, 47–53, (Chinese with English abstract). [Google Scholar]
  29. Zürcher, P.; Sokolov, M.; Brühlmann, D.; Ducommun, R.; Stettler, M.; Souquet, J.; Jordan, M.; Broly, H. Cell culture process metabolomics together with multivariate data analysis tools opens new routes for bioprocess development and glycosylation prediction. Biotechnol. Prog. 2020. [Google Scholar] [CrossRef]
  30. Clarke, J.D.; Alexander, D.C.; Ward, D.P.; Ryals, J.A.; Mitchell, M.W.; Wulff, J.E.; Guo, L.N. Assessment of Genetically Modified Soybean in Relation to Natural Variation in the Soybean Seed Metabolome. Sci. Rep. 2013, 3, 3082. [Google Scholar] [CrossRef]
  31. Khakimov, B.; Rasmussen, M.A.; Kannangara, R.M.; Jespersen, B.M.; Munck, L.; Engelsen, S.B. From metabolome to phenotype: GC-MS metabolomics of developing mutant barley seeds reveals effects of growth, temperature and genotype. Sci. Rep. 2017, 7, 8195. [Google Scholar] [CrossRef] [PubMed] [Green Version]
  32. Onda, Y.; Inoue, K.; Sawada, Y.; Shimizu, M.; Takahagi, K.; Uehara-Yamaguchi, Y.; Hirai, M.Y.; Garvin, D.F. Genetic variction for seed metabolite levels in Brachypodium distachyon. Int. J. Mol. Sci. 2019, 20, 2348. [Google Scholar] [CrossRef] [PubMed] [Green Version]
  33. Mazlan, O.; Aizat, W.M.; Baharum, S.N.; Azizan, K.A.; Noor, N.M. Metabolomics anaylsis of developing Garcinia mangostana seed reveals modulated levels of suguars, organic acids and phenylpropanoid compounds. Sci. Hortic. 2018, 233, 323–330. [Google Scholar] [CrossRef]
  34. Wang, L.; Fu, J.L.; Li, M.; Fragner, L.; Weckwerth, W.; Yang, P.F. Metabolomic and proteomic profiles reveal the dynamics of primary metabolism during seed development of Lotus (Nelumbo nucifera). Front. Plant Sci. 2016, 7, 750. [Google Scholar] [CrossRef] [Green Version]
  35. Tan, H.L.; Xie, Q.J.; Xiang, X.E.; Li, J.Q.; Zheng, S.N.; Xu, X.Y.; Guo, H.; Ye, W. Dynamic metabolic profiles and tissue-specific source effects on the metabolome of developing seeds of Brassica napus. PLoS ONE 2015, 10, e0124794. [Google Scholar] [CrossRef] [Green Version]
  36. Chen, W.; Gong, L.; Guo, Z.L.; Wang, W.S.; Zhang, H.Y.; Liu, X.Q.; Yu, S.; Xiong, L.; Luo, J. A novel integrated method for large-scale detection, identification, and quantification of widely targeted metabolites: Application in the study of rice metabolomics. Mol. Plant 2013, 6, 1769–1780. [Google Scholar] [CrossRef] [Green Version]
  37. Fraga, C.G.; Clowers, B.H.; Moore, R.J.; Zink, E.M. Signature-discovery approach for sample matching of a nerve-agent precursor using liquid chromatography-mass spectrometry, XCMS, and chemometrics. Anal. Chem. 2010, 82, 4165–4173. [Google Scholar] [CrossRef]
  38. Amri, N.E.; Errachidi, F.; Bour, A.; Bouhaddaoui, S.; Chabir, R. Morphological and nutritional properties of Moroccan Capparis spinosa Seeds. Sci. World J. 2019. [Google Scholar] [CrossRef] [Green Version]
  39. Yin, S.Y.; Li, P.C.; Xu, Y.; Liu, J.; Yang, T.T.; Wei, J.; Xu, S.; Yu, J.; Fang, H.; Xue, L.; et al. Genetic and genomic analysis of the seed-filling process in maize based on a logistic model. Heredity 2020, 124, 122–134. [Google Scholar] [CrossRef]
  40. Morton, K.J.; Jia, S.G.; Zhang, C.; Holding, D.R. Proteomic profiling of maize opaque endosperm mutants reveals selective accumulation of lysine-enriched proteins. J. Exp. Bot. 2015, 67, 1381–1396. [Google Scholar] [CrossRef] [Green Version]
  41. Rousserie, P.; Rabot, A.; Geny-Denis, L. From Flavanols Biosynthesis to Wine Tannins: What Place for Grape Seeds? J. Agric. Food Chem. 2019, 67, 1325–1343. [Google Scholar] [CrossRef] [PubMed]
  42. L’hadj, I.; Azzi, R.; Lahfa, F.; Koceir, E.; Omari, N. The nutraceutical potential of Lepidium sativum L. seed flavonoid-rich extract in managing metabolic syndrome components. J. Food Biochem. 2018, 42, e12725. [Google Scholar] [CrossRef] [PubMed]
  43. De Jesús Uribe-Gómez, J.; Zamora-Natera, J.F.; Bañuelos-Pineda, J.; Kachlicki, P.; Stobiecki, M.; García-López, P.M. Flavonoid profile of Lupinus mexicanus germinated seed extract and evaluation of its neuroprotective effect. Histol. Histopathol. 2014, 29, 1415–1421. [Google Scholar] [CrossRef]
  44. Song, Y.E.; Wang, X.; Shen, Z.W.; Xu, Y.; Li, J.Y. Expressing the maize anthocyanin regulatory gene Lc increased flavonoid content in the seed of white pericarp rice and purple pericarp rice. Genetika 2013, 49, 1127–1133. [Google Scholar] [CrossRef]
  45. Ogo, Y.; Ozawa, K.; Ishimaru, T.; Murayama, T.; Takaiwa, F. Transgenic rice seed synthesizing diverse flavonoids at high levels: A new platform for flavonoid production with associated health benefits. Plant Biotechnol. J. 2013, 11, 734–746. [Google Scholar] [CrossRef] [PubMed]
  46. Gupta, M.; Dey, S.; Marbaniang, D.; Pal, P.; Ray, S.; Mazumder, B. Grape seed extract: Having a potential health benefits. J. Food Sci. Technol. 2020, 57, 1205–1215. [Google Scholar] [CrossRef]
  47. Chen, W.; Lu, L.X. Relationship between Litchi embryo abortion and phenolic inhibitors. Acta Bot. Sin. 2002, 44, 168–172. [Google Scholar]
  48. Zhan, X.Q.; Shen, Q.W.; Wang, X.M.; Hong, Y.Y. The Sulfoquinovosyltransferase-like enzyme SQD2.2 is involved in flavonoid glycosylation, regulating sugar metabolism and seed setting in rice. Sci. Rep. 2017, 7, 4685. [Google Scholar] [CrossRef]
  49. Zažímalová, E.; Křeček, P.; Skůpa, P.; Petrášek, J. Polar transport of the plant hormone auxin—the role of PIN-FORMED (PIN) proteins. Cell. Mol. Life Sci. 2007, 64, 1621–1637. [Google Scholar] [CrossRef]
  50. Bayer, M.; Slane, D.; Jurgens, G. Early plant embryogenesis-dark ages or dark matter? Curr. Opin. Plant Biol. 2017, 35, 30–36. [Google Scholar] [CrossRef]
  51. Robert, H.S.; Park, C.; Gutièrrez, C.L.; Barbara, W.; Pěnčík, A.; Novák, O.; Chen, J.; Grunewald, W.; Dresselhaus, T.; Friml, J.; et al. Maternal auxin supply contributes to early embryo patterning in Arabidopsis. Nat. Plants 2018, 4, 548–553. [Google Scholar] [CrossRef] [PubMed]
  52. Teale, W.D.; Paponov, I.A.; Palme, K. Auxin in action: Signalling, transport and the control of plant growth and development. Nat. Rev. Mol. Cell Biol. 2006, 7, 847–859. [Google Scholar] [CrossRef] [PubMed]
  53. Li, S.; Zachgo, S. TCP3 interacts with R2R3-MYB proteins, promotes flavonoid biosynthesis and negatively regulates the auxin response in arabidopsis thaliana. Plant J. 2013, 76, 901–913. [Google Scholar] [CrossRef] [PubMed]
  54. Ashikari, M.; Sakakibara, H.; Lin, S.Y.; Yamamoto, T.; Takashi, T.; Nishimura, A.; Angeles, E.R.; Qian, Q.; Kitano, H.; Matsuoka, M. Cytokinin oxidase regulates rice grain production. Science 2005, 309, 741–745. [Google Scholar] [CrossRef]
  55. Bhushan, P.B.; Sudhanshu, S.; Kumar, D.S.; Lamboder, B.; Prasad, S.B. Biochemical and molecular characterisation of exogenous cytokinin application on grain filling in rice. BMC Plant Biol. 2018, 18, 89. [Google Scholar] [CrossRef] [Green Version]
  56. Vondrakova, Z.; Dobrev, P.I.; Pesek, B.; Fischerova, L.; Vagner, M.; Motyka, V. Profiles of endogenous phytohormones over the course of norway spruce somatic embryogenesis. Front. Plant Sci. 2018, 9, 1283. [Google Scholar] [CrossRef]
  57. Wang, L.P.; Shen, W.Y.; Kazachkov, M.; Chen, G.Q.; Chen, Q.L.; Carlsson, A.S.; Stymne, S.; Weselake, R.J.; Zou, J. Metabolic interactions between the lands cycle and the Kennedy pathway of glycerolipid synthesis in Arabidopsis developing seeds. Plant Cell 2012, 24, 4652–4669. [Google Scholar] [CrossRef] [Green Version]
  58. Hu, X.L.; Yu, X.M.; Chen, H.Y.; Li, W.Q. Turnover of glycerolipid metabolite pool and seed viability. Int. J. Mol. Sci. 2018, 19, 1417. [Google Scholar] [CrossRef] [Green Version]
  59. Zhang, T.K.; Liu, C.Y.; Huang, X.B.; Zhang, H.Y.; Yuan, Z.H. Land-plant phylogenomic and pomegranate transcriptomic analyses reveal an evolutionary scenario of cyp75 genes subsequent to whole genome duplications. J. Plant Biol. 2019, 62, 48–60. [Google Scholar] [CrossRef]
  60. Xie, P.; Shi, J.Y.; Tang, S.Y.; Chen, C.X.; Khan, A.; Zhang, F.X.; Xiong, Y.; Li, C.; He, W.; Wang, G.; et al. Control of bird feeding behavior by Tannin1 through modulating the biosynthesis of polyphenols and fatty acid-derived volatiles in sorghum. Mol. Plant 2019, 1–10. [Google Scholar] [CrossRef] [Green Version]
Figure 1. Microscopic observation of astringent seed/germinable seed (AS/GS) and major profiling of metabolites. (a) From 105d to 135d, the AS wrinkled and darkened on the surface, whereas the GS showed normal growth. (b) The variable importance in project (VIP) and log2FC values of all the metabolites were displayed in the volcano diagram with the red dots represented the up-regulated metabolites, the greed dots represented the down-regulated metabolites, while the black dots represent the metabolites showed no significant difference between AS and GS. (c) The numbers of overlapping and stage-specific differential metabolites from the four stages were showing in the Venn diagram. (d) The top 20 metabolites with the highest log2FC or VIP value were exhibited in the histogram with the classification of each metabolite was marked in different colors under the corresponding bars.
Forests 11 01206 g001
Figure 2. Multivariate statistical analysis for the reliability of samples. (a) Principal component analysis (PCA). Samples were grouped by different colors; (b) Pearson correlation estimation. The color in the cell represented the r2 value which is used to estimate the relationship between two samples. The closer the r2 value is to 1.00, the more similar the two samples are; (cf) the results of orthogonal partial least squares discriminant analysis (OPLS-DA) at 105d, 115d, 125d, and 135d, respectively. Clear separations between AS and GS were shown in all of the 4 stages.
Forests 11 01206 g002
Figure 3. Expressive heatmap of different expressive metabolites (DEMs) in AS and GS during the growth process. The color in each cell represented the relative expression level of the DEMs. Yellow represented high expression level, whereas blue represented low expression level. The sub-maps on the left showed the clustering results which clearly divided the DEMs into two major categories and four subcategories.
Forests 11 01206 g003
Figure 4. Concentrations of the 16 selected DEMs in AS and GS at different stages. Metabolites including quinine (a), dihydrozeatin (b), 5-hydroxy-L-tryptophan (c), robinin (d), H-homoarg-OH (e), methyl nicotinate (f), 3-indoleacetonitrile (g), quercetin (h), kaempferol (i), apigenin (j), octadecadien-6-ynoic acid (k), protocatechuic acid (l), myricetin (m), (R)-lipoic acid (n), dodecanedioic acid (o), and L-asparagine (p) were selected randomly. Darker bars indicated the concentrations of the corresponding metabolites in GS group, while the lighter bars indicated that of in AS group. Asterisks above the bars represented the significant level of the difference. Significance at p < 0.01 level was marked with “***”; at p < 0.05 level it was marked with “*”; while at p > 0.05 level it was marked with “NS” which meant no significant difference between those samples.
Forests 11 01206 g004
Figure 5. KEGG enrichment analysis of DEMs at different stages. DEMs in 105d (a), 115d (b), 125d (c), and 135d (d) were mapped into the KEGG database, and the top 20 enriched metabolic pathways in different stages were showed in the bubble diagram. The color of the bubble represented the −log10 (p-value) of the corresponding pathway, the closer to red color the bubble was, the more significant the corresponding pathway performed. The size of the bubble represented the number of metabolites which were enriched in the corresponding pathway.
Forests 11 01206 g005
Table 1. Classification statistics of different expressive metabolites.
Metabolites ClassAmountPercentage (%)Amount in Different Categories 1
A1A2B1B2
Alkaloids10.891000
Amino acid derivatives108.931810
Amino acids21.790101
Anthocyanins32.680003
Benzoic acid derivatives10.890010
Catechin derivatives21.790011
Coumarins32.681011
Flavanone76.251033
Flavone1816.070297
Flavone C-glycosides54.460212
Flavonol1513.3901104
Flavonolignan10.890010
Hydroxycinnamoyl derivatives32.680012
Indole derivatives10.890100
Isoflavone43.570031
Lipids_Fatty acids21.790020
Lipids_Glycerolipids21.790101
Lipids_Glycerophospholipids98.040900
Nucleotide and its derivatives87.140512
Organic acids21.790002
Others32.681110
Phenolamides10.890100
Phytohormones43.572110
Pyridine derivatives10.890001
Tryptamine derivatives21.790200
Vitamins21.791100
Grand total112100.00
1 Different categories were based on the cluster result shown on the Figure 3.
Publisher’s Note: MDPI stays neutral with regard to jurisdictional claims in published maps and institutional affiliations.

