Are Agrarian Areas in Mediterranean Mountain Regions Becoming Extinct? A Methodological Approach to Their Conservation


Abstract
1. Introduction
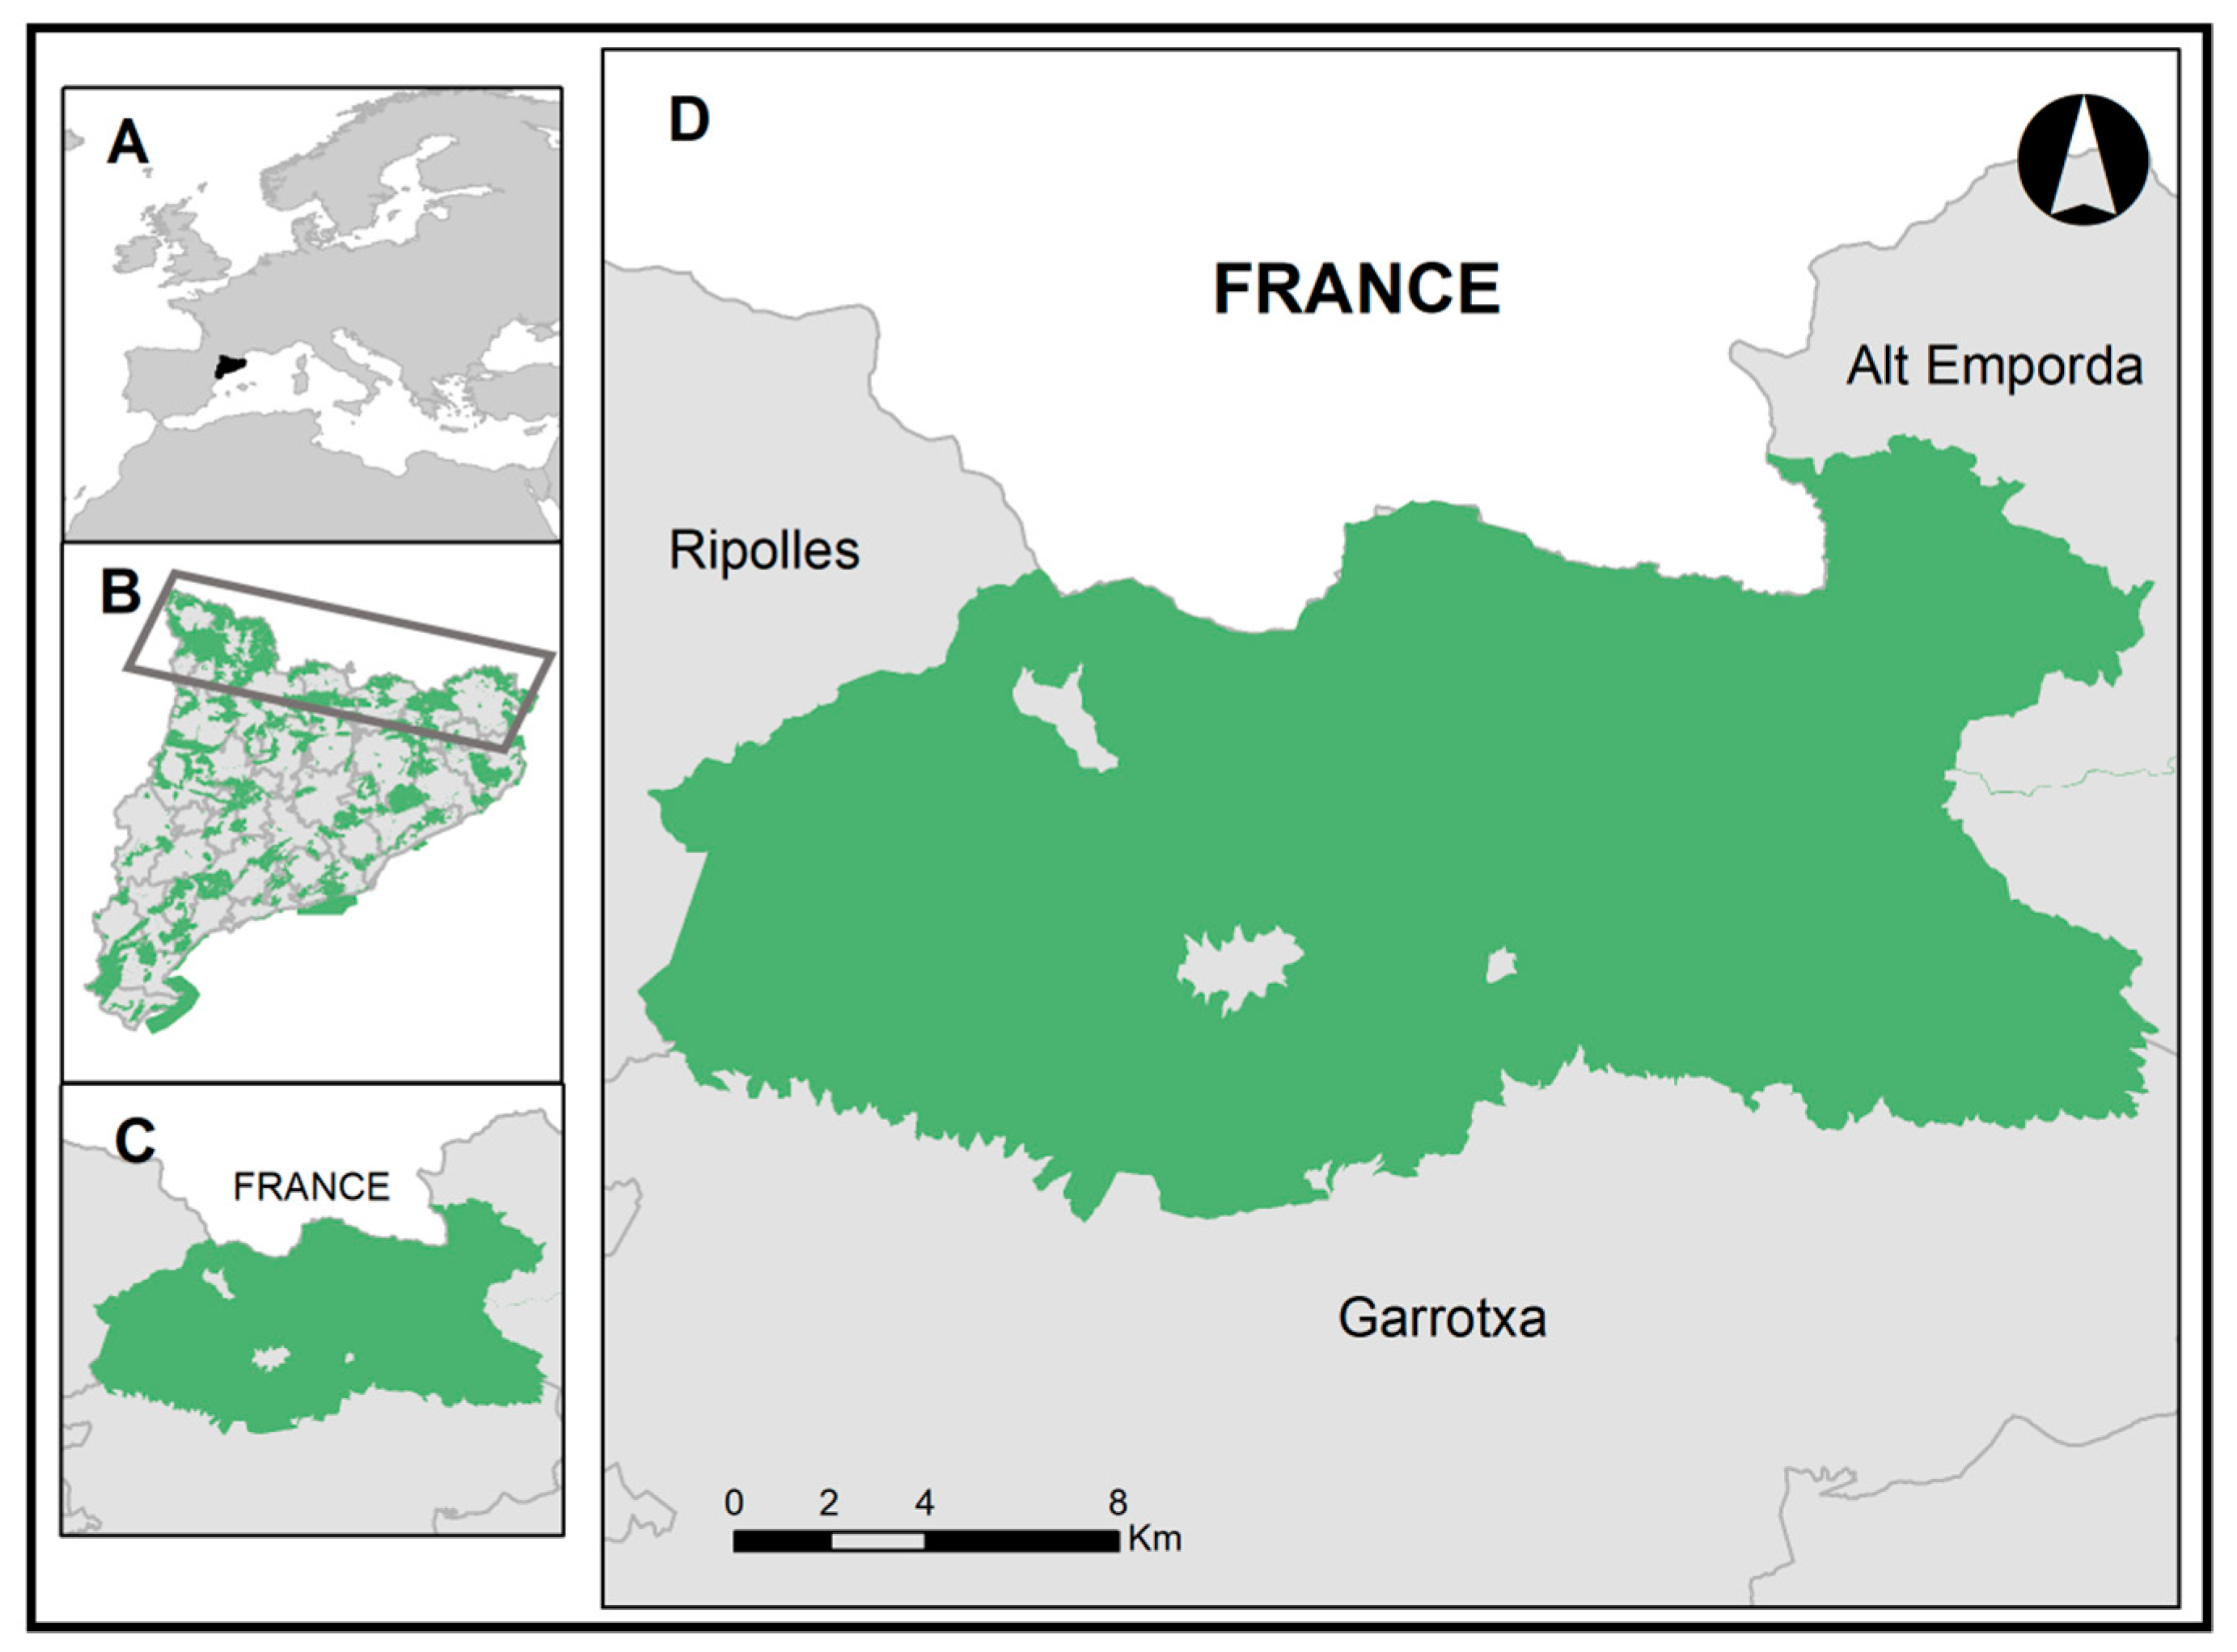
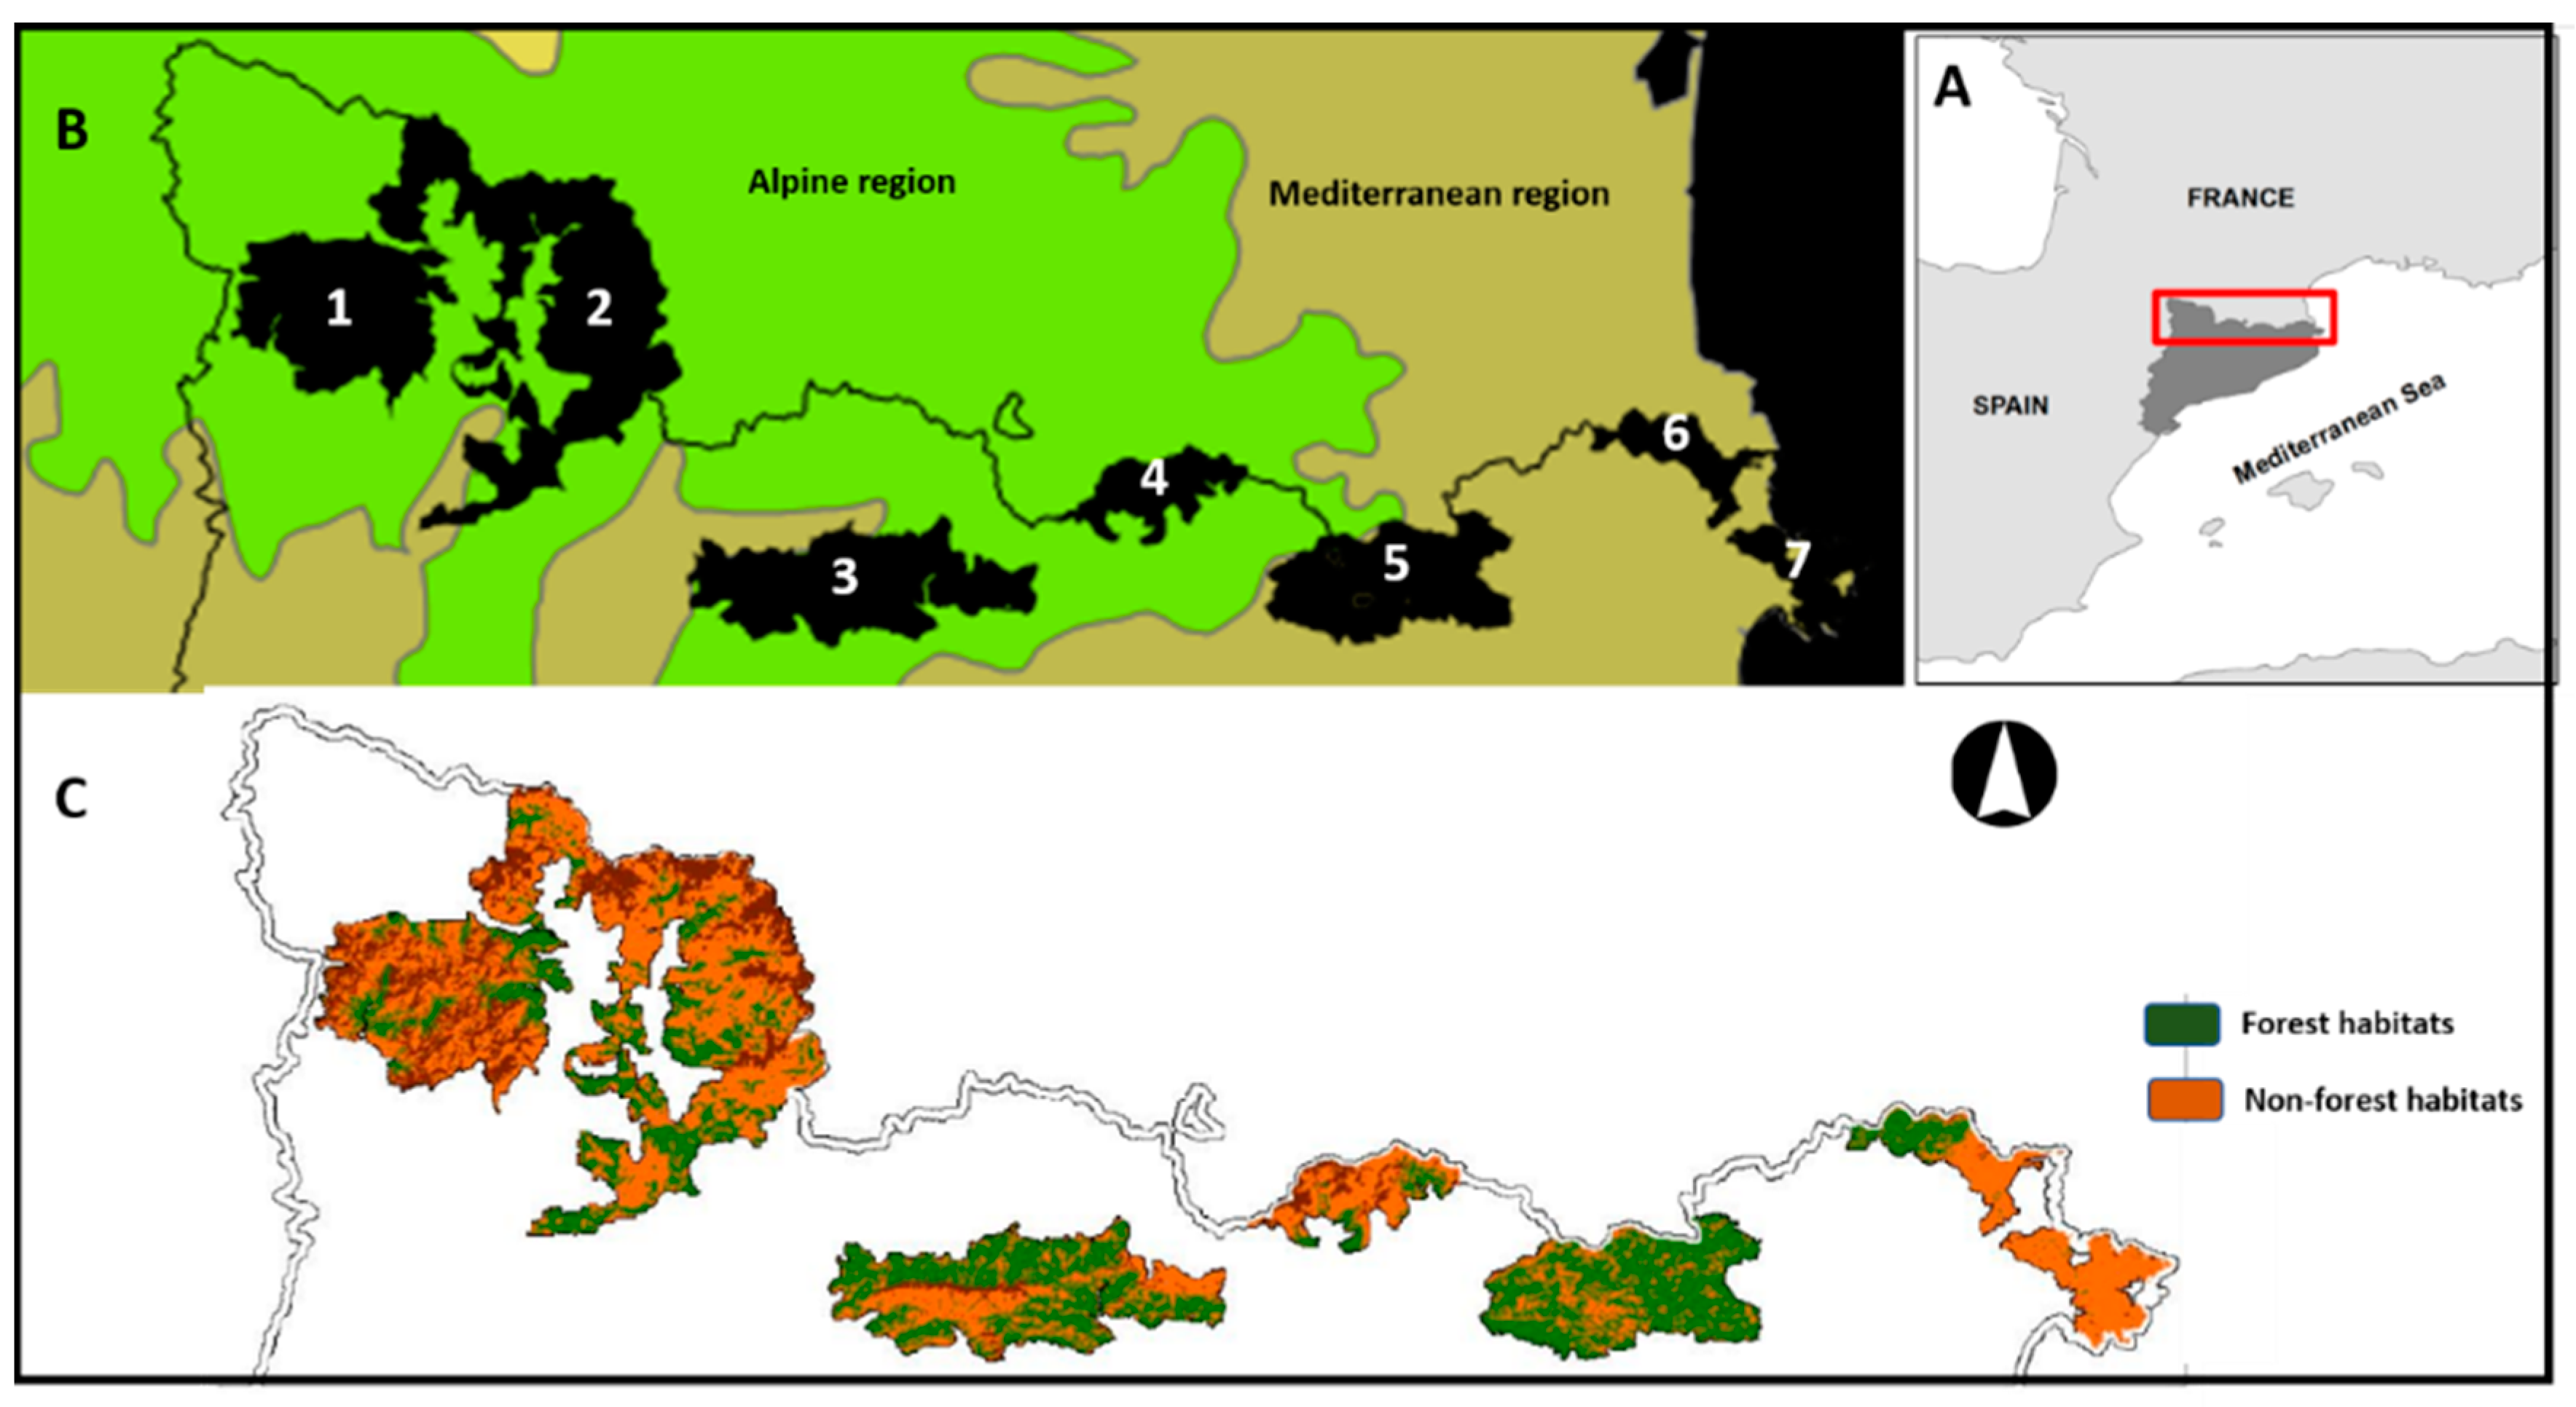
2. Study Area
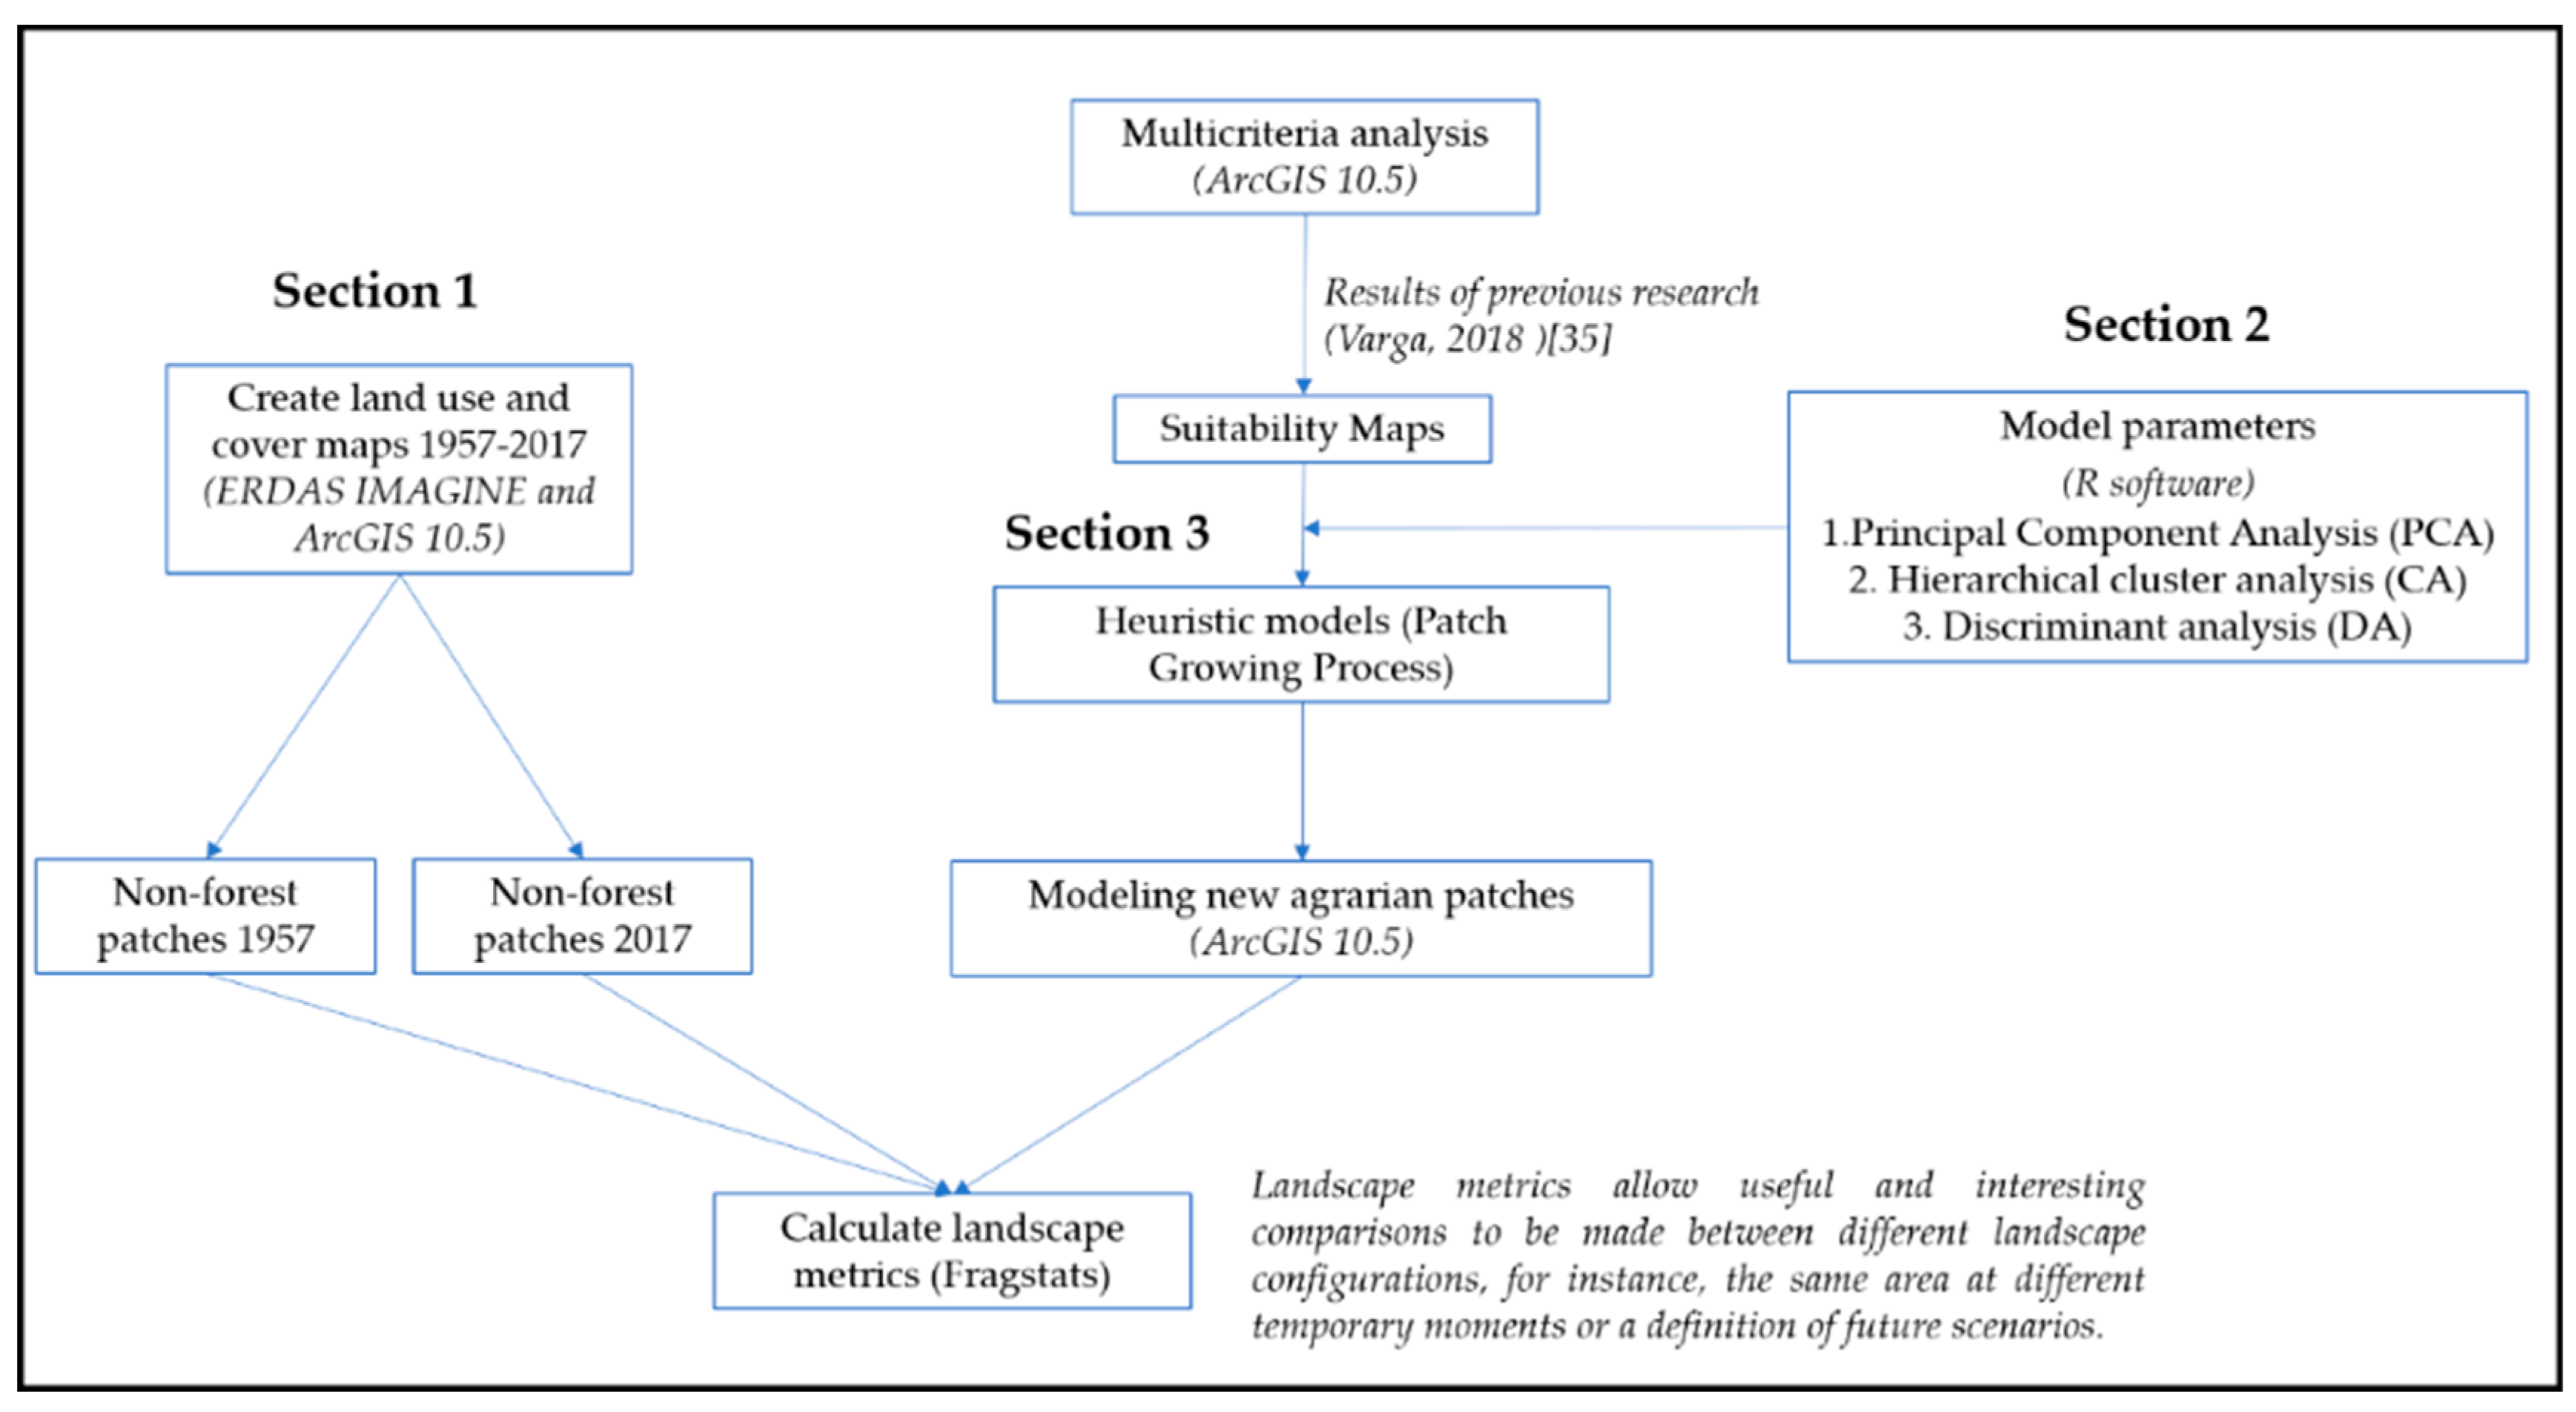
3. Methods
3.1. Analysis Prior to Modeling
3.2. Model Parameters
3.3. Heuristic Models
- Defining the parameters: in this first section, users enter parameters such as the suitability value for the seed cell, the shape of the initial neighborhood matrix (W), the importance of compactness (N), acceptance percentage, size and number of patches. These parameters are described in detail in the next section.
- Selecting a seed cell that meets the previously selected suitability value. In the event that the cell is close to the edge of the study area, the model will choose another one farther from the edge so that the generated patch does not extend beyond the study area.
- Depending on the selected radius of activity (neighborhood matrix), the next step will be to adhere neighboring cells to the seed cell.
- Calculating the final suitability value (CSi) of the adjoining neighboring cells:
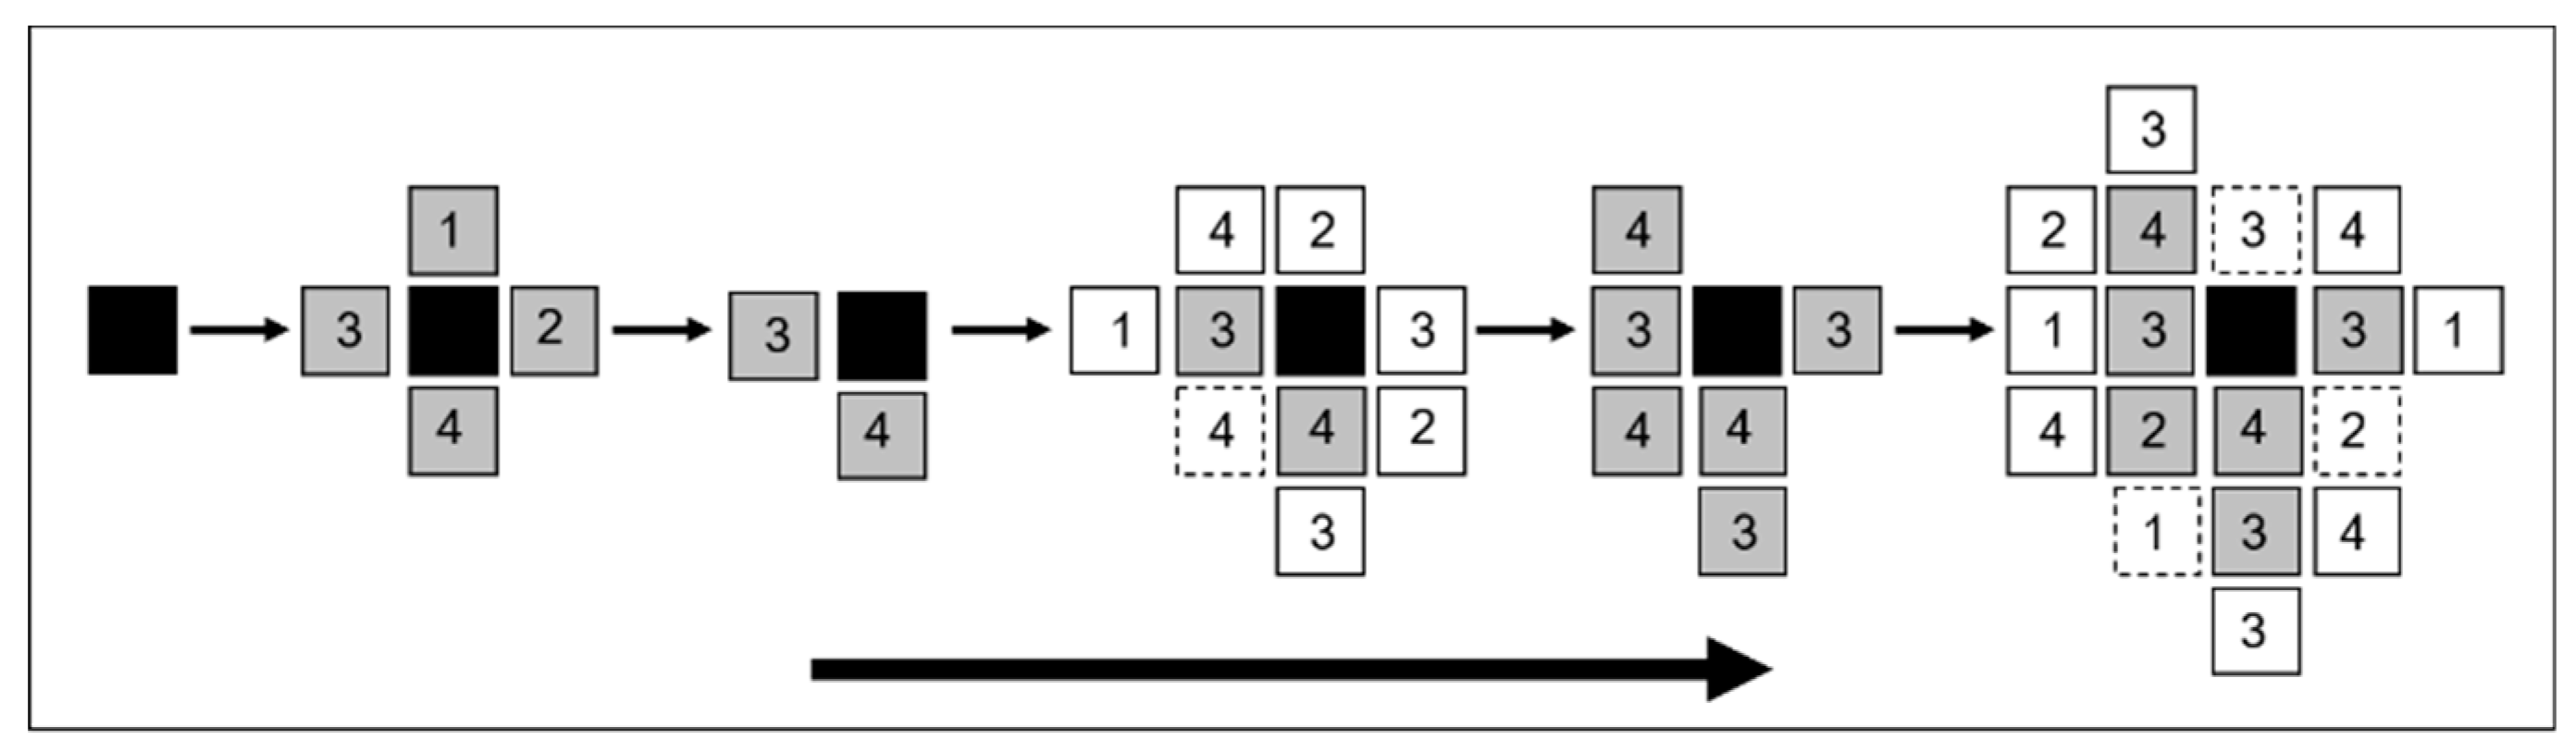
- Arrangement of neighboring cells and selection: values are ordered from highest to lowest and the cells that will take part in the second iteration are selected from the percentage of acceptance X. In Figure 5, the final suitability values (CSi) for the four neighboring cells are 1, 2, 4 and 3. With X = 0.5, then 50% of the cells will be selected in order of more to less suitability. In the example, this would be cells 4 and 3. These cells adhere to the seed cell and the previous steps are repeated. Neighboring cells are then sought and the final suitability values (CSi) for each cell are recalculated. As Figure 5 shows, the new neighboring cells have the values 2, 3, 2, 3, 4 (the margin is displayed with dashed lines because, unlike the others, this cell shares two edges), 1 and 4. The cells to be incorporated in this case will be 3, 3, 4 and 4.
- This process will be repeated until the area or minimum suitability value of the patch to be generated are complete.
4. Results
4.1. Evaluation of the Open Space Fragmentation Process
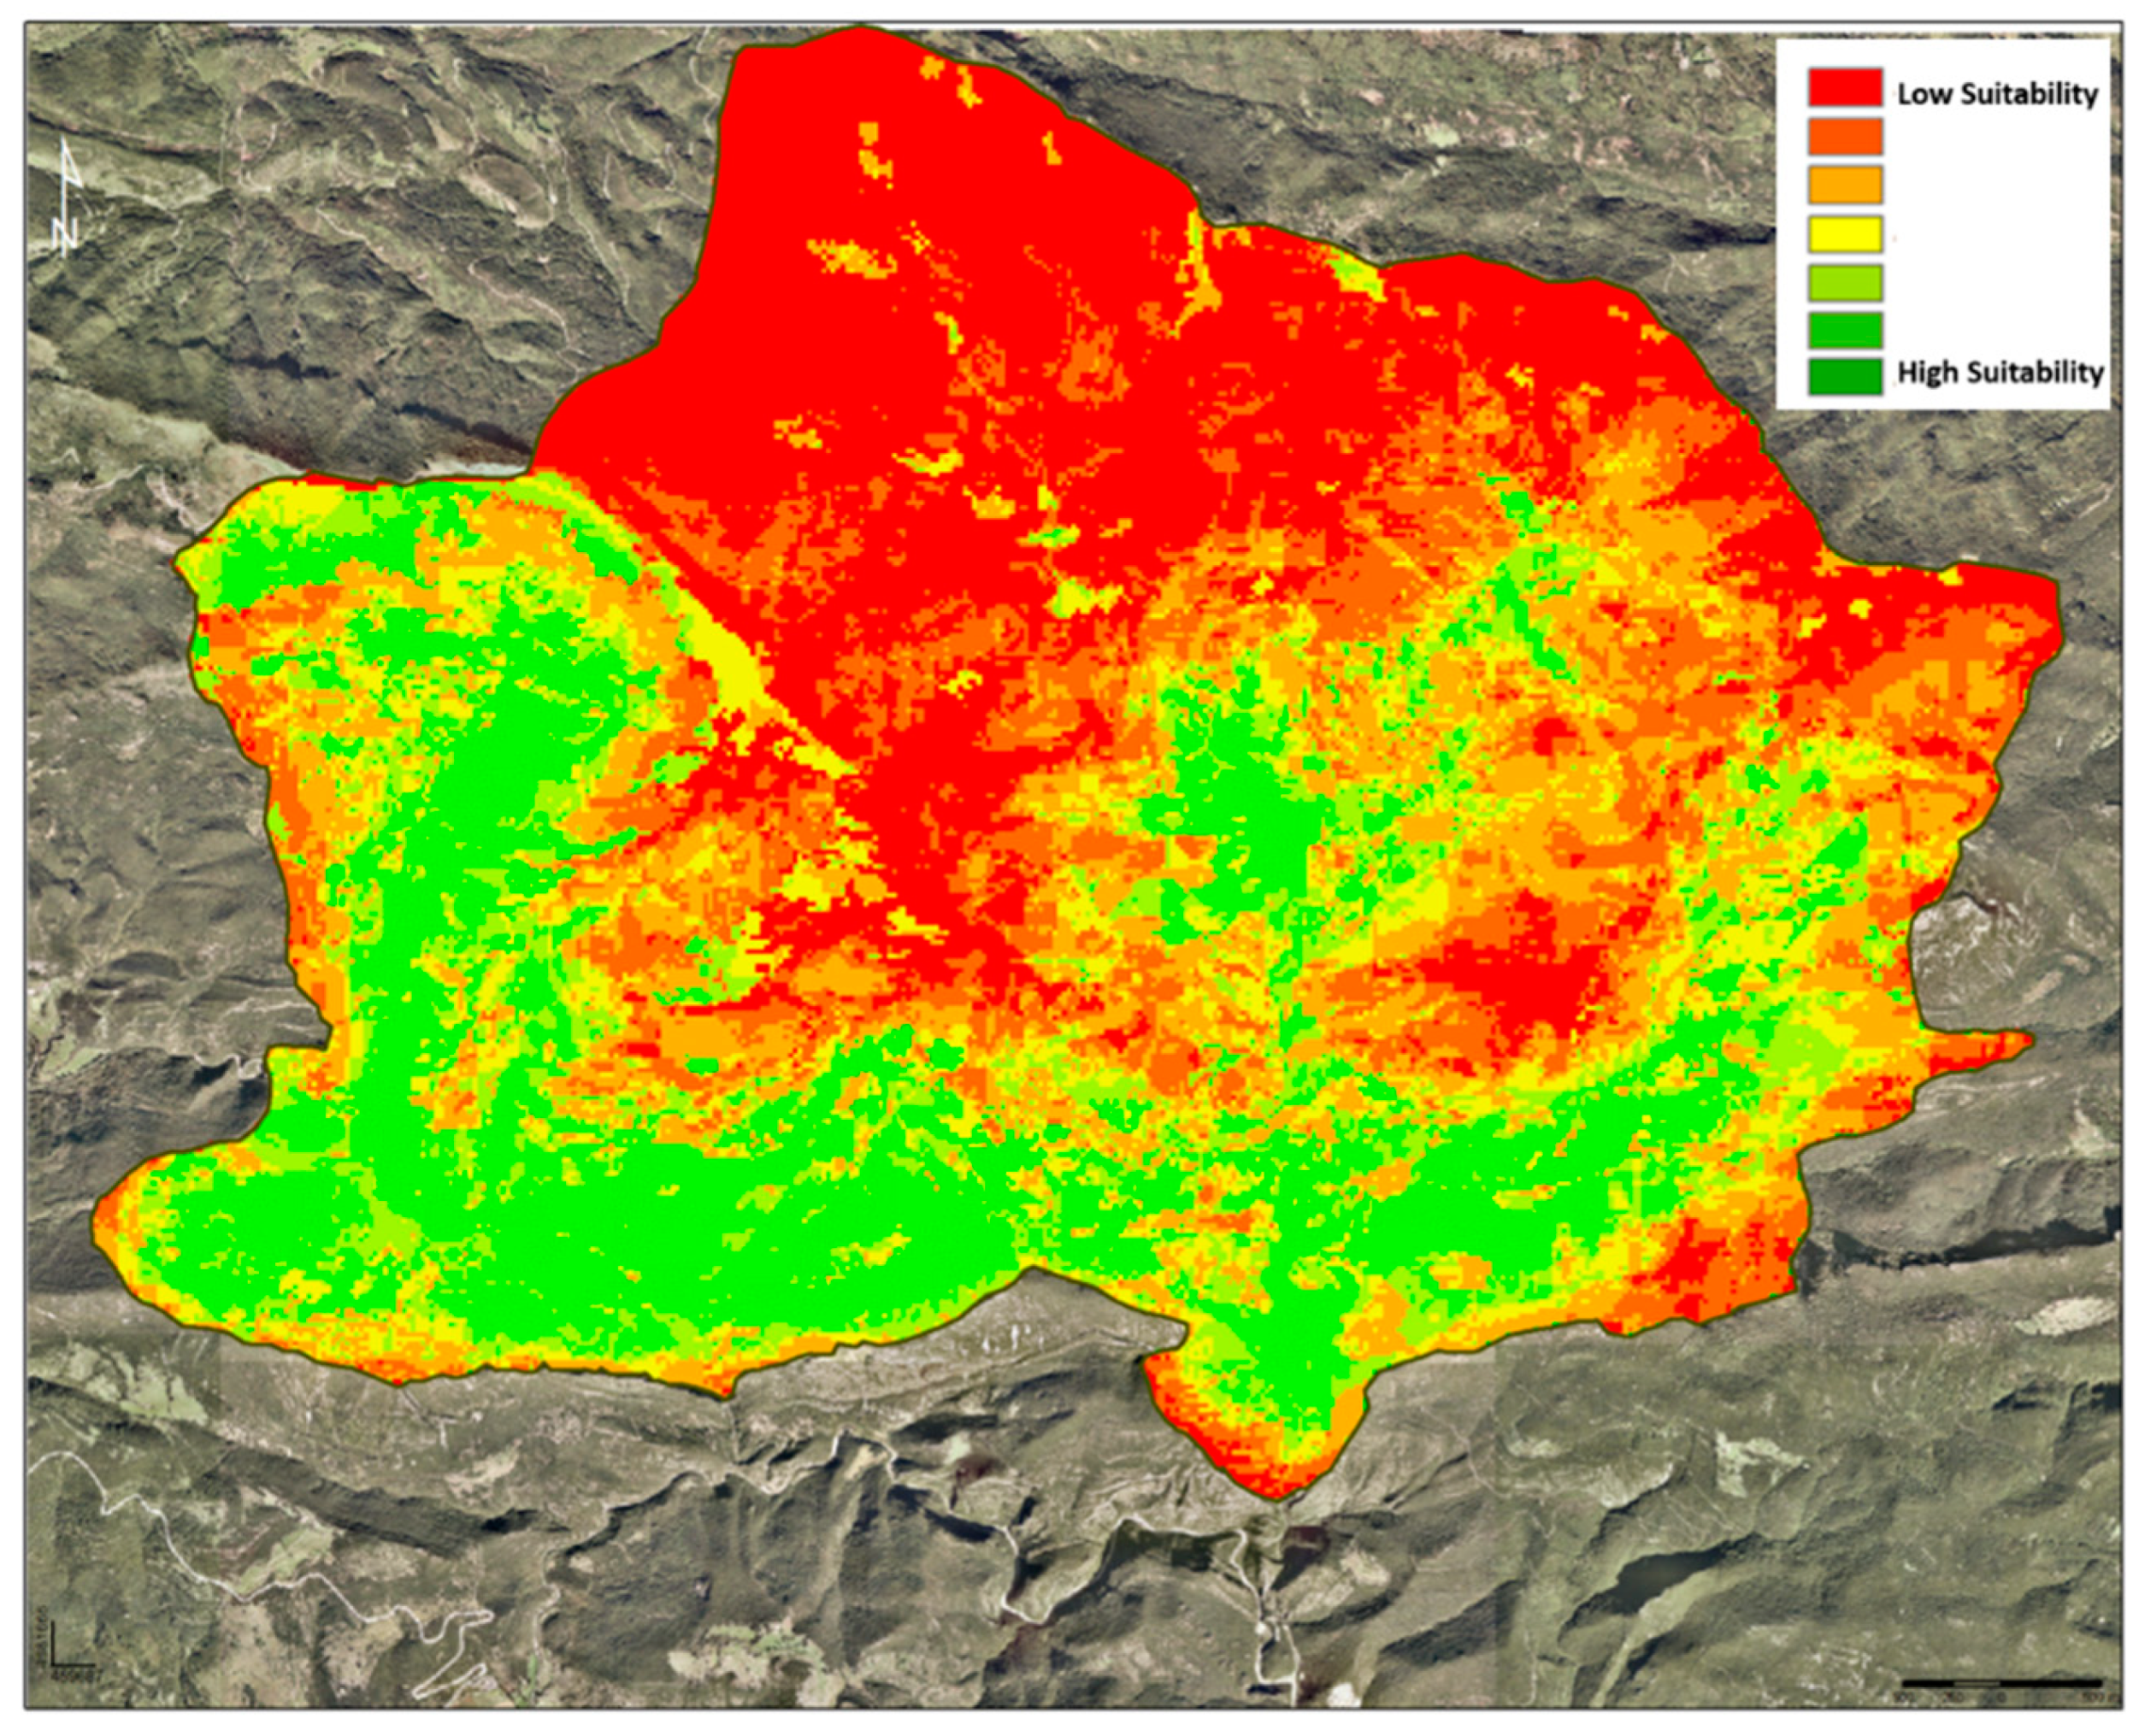
4.2. Model Parameters
4.3. Heuristic Models (Patch-Growing Process)
4.4. Impacts and Improvements of the Model Proposed Using PGP (Patch-Growing Process) on the Current Landscape Structure
5. Discussions and Conclusions
Funding
Conflicts of Interest
Appendix A

| Landscape Metrics | Definition | Calculation |
|---|---|---|
| Largest Patch Index (LPI) | Quantifies the percentage of total landscape area comprised by the largest patch. | |
| Edge Density (ED) | Equals the sum of the lengths (m) of all edge segments in the landscape, divided by the total landscape area (m2), multiplied by 10,000 (to convert to hectares). | |
| Landscape Shape Index (LSI) | Provides a standardized measure of total edge or edge density that adjusts for the size of the landscape. | |
| Perimeter-Area Fractal Dimension (PAFRACT) | Equals 2 divided by the slope of regression line obtained by regressing the logarithm of patch area (m2) against the logarithm of patch perimeter (m). | |
| Contagion (CONTAG) | Equals minus the sum of the proportional abundance of each patch type multiplied by the proportion of adjacencies between cells of that patch type and another patch type, multiplied by the logarithm of the same quantity, summed over each unique adjacency type and each patch type; divided by 2 times the logarithm of the number of patch types; multiplied by 100 (to convert to a percentage). | |
| Cohesion (COHESION) | Equals 1 minus the sum of patch perimeter (in terms of number of cell surfaces) divided by the sum of patch perimeter times the square root of patch area (in terms of number of cells) for patches of the corresponding patch type, divided by 1 minus 1 over the square root of the total number of cells in the landscape, multiplied by 100 to convert to a percentage. | |
| Shannon’s Diversity Index (SHDI) | Equals minus the sum, across all patch types, of the proportional abundance of each patch type multiplied by that proportion. Note, Pi is based on total landscape area (A) excluding any internal background present. | |
| Shannon’s Evenness Index (SHEI) | Equals minus the sum, across all patch types, of the proportional abundance of each patch type multiplied by that proportion, divided by the logarithm of the number of patch types. In other words, the observed Shannon’s Diversity Index divided by the maximum Shannon’s Diversity Index for that number of patch types. Note, Pi is based on total landscape area (A) excluding any internal background present. | |
| Patch Richness Density (PRD) | Equals the number of different patch types present within the landscape boundary divided by total landscape area (m2), multiplied by 10,000 and 100 (to convert to 100 hectares). Note, total landscape area (A) includes any internal background present. | |
| Patch Density (PD) | Equals the number of patches of the corresponding patch type divided by total landscape area (m2), multiplied by 10,000 and 100 (to convert to 100 hectares). Note, total landscape area (A) includes any internal background present. | |
| Radius of Gyration (GYRATE) | Equals the mean distance (m) between each cell in the patch and the patch centroid. | |
| Fractal Dimension (FRAC) | Equals 2 times the logarithm of patch perimeter (m) divided by the logarithm of patch area (m2); the perimeter is adjusted to correct for the raster bias in perimeter. | |
| Euclidean Nearest Neighbor Distance (ENN) | Equals the distance (m) to the nearest neighboring patch of the same type, based on shortest edge-to-edge distance. Note that the edge-to-edge distances are from cell center to cell center. |
References
- Lasanta-Martínez, T.; Vicente-Serrano, S.M.; Cuadrat-Prats, J.M. Mountain Mediterranean landscape evolution caused by the abandonment of traditional primary activities: A study of the Spanish Central Pyrenees. Appl. Geogr. 2005, 25, 47–65. [Google Scholar] [CrossRef]
- Tilzey, M. Natural Areas, the whole countryside approach and sustainable agriculture. Land Use Policy 2000, 17, 279–294. [Google Scholar] [CrossRef]
- McNeill, J.R. El Mundo De Las Montañas Del Mediterráneo; Fundació Territori i Paisatge; Caixa Catalunya: Barcelona, Spain, 2004. [Google Scholar]
- Poyatos, R.; Latron, J.; Llorens, P. Land use and land cover change after agricultural abandonment. Mt. Res. Dev. 2003, 23, 362–368. [Google Scholar] [CrossRef]
- Lasanta, T.; González-Hidalgo, J.C.; Vicente-Serrano, S.M.; Sferi, E. Using landscape ecology to evaluate an alternative management scenario in abandoned Mediterranean mountain areas. Landsc. Urban. Plan. 2006, 78, 101–114. [Google Scholar] [CrossRef]
- García-Ruiz, J.M.; Lasanta, T.; Ruiz-Flano, P.; Ortigosa, L.; White, S.; González, C.; Martí, C. Land-use changes and sustainable development in mountain areas: A case study in the Spanish Pyrenees. Landsc. Ecol. 1996, 11, 267–277. [Google Scholar] [CrossRef]
- Molinillo, M.; Lasanta, T.; García-Ruiz, J.M. RESEARCH: Managing mountainous degraded landscapes after farmland abandonment in the central Spanish Pyrenees. Environ. Manag. 1997, 21, 587–598. [Google Scholar] [CrossRef]
- Debussche, M.; Escarré, J.; Lepart, J.; Houssard, C.; Lavorel, S. Changes in Mediterranean plant succession: Old-fields revisited. J. Veg. Sci. 1996, 7, 519–526. [Google Scholar] [CrossRef]
- Macdonald, D.; Crabtree, J.; Wiesinger, G.; Dax, T.; Stamou, N.; Fleury, P.; Lazpita, J.G.; Gibon, A. Agricultural abandonment in mountain areas of Europe: Environmental consequences and policy response. J. Environ. Manag. 2000, 59, 47–69. [Google Scholar] [CrossRef]
- Terradas, J. Ecologia del Foc; Proa: Barcelona, Spain, 1996; pp. 203–208. ISBN 978-84-8256-132-5. [Google Scholar]
- Boada, M. Boscos de Catalunya. In Història i Actualitat del món Forestal; Brau Edicions: Figueres, Spain, 2003; p. 188. ISBN 84-95946-20-3. [Google Scholar]
- Forman, R.T.T.; Godron, M. Landscape Ecology; Wiley and Sons: New York, NY, USA, 1986; p. 619. ISBN 978-0-471-87037-1. [Google Scholar]
- O’Neill, R.V.; Milne, B.T.; Turner, M.G.; Gardner, R.H. Resource utilization scales and landscape pattern. Landsc. Ecol. 1988, 2, 63–69. [Google Scholar] [CrossRef]
- Turner, M.G.; Gardner, R.H.; O’neill, R.V. Landscape Ecology in Theory and Practice; Springer: New York, NY, USA, 2001; Volume 401, ISBN 978-1-4939-2793-7. [Google Scholar]
- McGarigal, K.; Cushman, S.A.; Ene, E. FRAGSTATS v4: Spatial Pattern Analysis Program for Categorical and Continuous Maps. Computer Software Program Produced by the Authors at the University of Massachusetts, Amherst. 2012. Available online: http://www.umass.edu/landeco/research/fragstats/fragstats.html (accessed on 19 October 2020).
- Fahrig, L.; Arroyo-Rofdríguez, V.; Bennett, J.R.; Boucher-Lalonde, V.; Cazetta, E.; Currie, D.J.; Eigenbrod, F.; Ford, A.T.; Harrison, S.P.; Jaeger, J.A.; et al. Is habitat fragmentation bad for biodiversity? Biol. Conserv. 2019, 230, 179–186. [Google Scholar] [CrossRef]
- Riitters, K.H. Pattern metrics for a transdisciplinary landscape ecology. Landsc. Ecol. 2019, 34, 2057–2063. [Google Scholar] [CrossRef]
- Wu, J. Linking landscape, land system and design approaches to achieve sustainability. J. Land Use Sci. 2019, 14, 173–189. [Google Scholar] [CrossRef]
- Farina, A. Principles and Methods in Landscape Ecology: Towards A Science of the Landscape; Springer Science & Business Media: London, UK, 2008; Volume 3, ISBN 978-1-4020-3327-8. [Google Scholar]
- Frazier, A.E. Emerging trajectories for spatial pattern analysis in landscape ecology. Landsc. Ecol. 2019, 34, 2073–2082. [Google Scholar] [CrossRef]
- Gurung, A.B.; Von Dach, S.W.; Price, M.F.; Aspinall, R.; Balsiger, J.; Baron, J.S.; Sharma, E.; Greenwood, G.; Kohler, T. Global change and the world’s mountains—Research needs and emerging themes for sustainable development. Mt. Res. Dev. 2012, 32, 47–54. [Google Scholar] [CrossRef]
- Vialatte, A.; Barnaud, C.; Blanco, J.; Ouin, A.; Choisis, J.-P.; Andrieu, E.; Sheeren, D.; Ladet, S.; Deconchat, M.; Clément, F.; et al. A conceptual framework for the governance of multiple ecosystem services in agricultural landscapes. Landsc. Ecol. 2019, 34, 1653–1673. [Google Scholar] [CrossRef]
- Antrop, M. Why landscapes of the past are important for the future. Landsc. Urban. Plan. 2005, 70, 21–34. [Google Scholar] [CrossRef]
- Geri, F.; Amici, V.; Rocchini, D. Human activity impact on the heterogeneity of a Mediterranean landscape. Appl. Geogr. 2010, 30, 370–379. [Google Scholar] [CrossRef]
- Fund, C. European Agricultural Fund for Rural Development (EAFRD); European Maritime & Fisheries Fund (EMFF): Brussels, Belgium, 2019. [Google Scholar]
- Koemle, D.; Lakner, S.; Yu, X. The impact of Natura 2000 designation on agricultural land rents in Germany. Land Use Policy 2019, 87, 104–113. [Google Scholar] [CrossRef]
- De Montis, A.; Martín, B.; Ortega, E.; Ledda, A.; Serra, V. Landscape fragmentation in Mediterranean Europe: A comparative approach. Land Use Policy 2017, 64, 83–94. [Google Scholar] [CrossRef]
- Etienne, R.S. On optimal choices in increase of patch area and reduction of interpatch distance for metapopulation persistence. Ecol. Model. 2004, 179, 77–90. [Google Scholar] [CrossRef]
- Moilanen, A. On the limitations of graph-theoretic connectivity in spatial ecology and conservation. J. Appl. Ecol. 2011, 48, 1543–1547. [Google Scholar] [CrossRef]
- With, K.A.; King, A.W. Extinction thresholds for species in fractal landscapes. Conserv. Biol. 1999, 13, 314–326. [Google Scholar] [CrossRef]
- Saunders, D.A.; Hobbs, R.J.; Margules, C.R. Biological consequences of ecosystem fragmentation: A review. Conserv. Biol. 1991, 5, 18–32. [Google Scholar] [CrossRef]
- Blondel, J. The ‘design’ of mediterranean landscapes: A millennial story of humans and ecological systems during the historic period. Hum. Ecol. 2006, 34, 713–729. [Google Scholar] [CrossRef]
- Bogaert, J.; Sun-Kee, H. Landscape Ecology: Monitoring Landscape Dynamics Using Spatial Pattern Metrics. Ecological Issues in A Changing World; Springer: Dordrecht, Germany, 2004; pp. 109–131. [Google Scholar]
- Forman, R.T.T. Urban ecology principles: Are urban ecology and natural area ecology really different? Landsc. Ecol. 2016, 31, 1653–1662. [Google Scholar] [CrossRef]
- Varga, D.; Vila-Subirós, J.; Barriocanal, C.; Pujantell, J. Landscape transformation under global environmental change in mediterranean mountains: Agrarian lands as a guarantee for maintaining their multifunctionality. Forests 2018, 9, 27. [Google Scholar] [CrossRef]
- Malczewski, J. GIS-based multicriteria decision analysis: A survey of the literature. Int. J. Geogr. Inf. Sci. 2006, 20, 703–726. [Google Scholar] [CrossRef]
- Vázquez-Quintero, G.; Prieto-Amparán, J.A.; Pinedo-Alvarez, A.; Valles-Aragón, M.C.; Nieto, C.R.M.; Villarreal-Guerrero, F. GIS-based multicriteria evaluation of land suitability for grasslands conservation in Chihuahua, Mexico. Sustainability 2019, 12, 185. [Google Scholar] [CrossRef]
- Diamond, J.M. The island dilemma: Lessons of modern biogeographic studies for the design of natural reserves. Biol. Conserv. 1975, 7, 129–146. [Google Scholar] [CrossRef]
- Diamond, J.T.; Wright, J.R. Efficient land allocation. J. Urban. Plan. Dev. 1989, 115, 81–96. [Google Scholar] [CrossRef]
- Van Langevelde, F.; Claassen, F.; Schotman, A. Two strategies for conservation planning in human-dominated landscapes. Landsc. Urban. Plan. 2002, 58, 281–295. [Google Scholar] [CrossRef]
- Ramezanian, R.; Hajipour, M. Integrated framework of system dynamics and meta-heuristic for multi-objective land use planning problem. Landsc. Ecol. Eng. 2020, 16, 1–21. [Google Scholar] [CrossRef]
- Schwaab, J.; Deb, K.; Goodman, E.; Lautenbach, S.; Van Strien, M.J.; Grêt-Regamey, A. Improving the performance of genetic algorithms for land-use allocation problems. Int. J. Geogr. Inf. Sci. 2017, 32, 907–930. [Google Scholar] [CrossRef]
- Brookes, C.J. A parameterized region-growing programme for site allocation on raster suitability maps. Int. J. Geogr. Inf. Sci. 1997, 11, 375–396. [Google Scholar] [CrossRef]
- Church, R.L.; Gerrard, R.A.; Gilpin, M.; Stine, P. Constructing cell-based habitat patches useful in conservation planning. Ann. Assoc. Am. Geogr. 2003, 93, 814–827. [Google Scholar] [CrossRef]
- Pressey, R.L.; Watts, M.E.; Barrett, T.W. Is maximizing protection the same as minimizing loss? Efficiency and retention as alternative measures of the effectiveness of proposed reserves. Ecol. Lett. 2004, 7, 1035–1046. [Google Scholar] [CrossRef]
- Williams, J.C.; Revelle, C.S. Applying mathematical programming to reserve selection. Environ. Model. Assess. 1997, 2, 167–175. [Google Scholar] [CrossRef]
- Sidiropoulou, A.; Karatassiou, M.; Galidaki, G.; Sklavou, P. Landscape pattern changes in response to transhumance abandonment on Mountain Vermio (North Greece). Sustainability 2015, 7, 15652–15673. [Google Scholar] [CrossRef]


| Landscape Metrics | 1987 | 1992 | 2002 | 2017 |
|---|---|---|---|---|
| LPI | X | X | X | X |
| PD | _ | _ | X | X |
| LSI | X | X | X | X |
| PAFRACT | X | X | X | X |
| GYRATE | _ | _ | _ | X |
| ED | X | X | X | X |
| ENN | X | _ | _ | _ |
| CONTAG | X | X | X | X |
| COHESION | X | X | X | X |
| SHDI | X | X | X | X |
| SHEI | X | X | X | X |
| PRD | X | _ | _ | _ |
| FRAC | X | X | _ | _ |
| USES | Area (ha) 1957 | Area (ha) 2017 | % 1957 | % 2017 |
|---|---|---|---|---|
| Agricultural Lands | 2389.08 | 634.07 | 46.43 | 12.34 |
| Open Forest Scree | 153.89 | 156.34 | 2.99 | 3.04 |
| Denuded Land | 119.47 | 118.80 | 2.32 | 2.31 |
| Total Non-Forest Habitats | 2662.45 | 1193.84 | 51.74 | 17.69 |
| Biogeographic Region | PATCH | PLAND | PD | MPS | GYRATE | ENN |
|---|---|---|---|---|---|---|
| Mediterranean Pyrenees | S | 7.33 | 9.15 | 0.75 | 41.46 | 515.19 |
| M | 47.13 | 10.11 | 10.35 | 156.07 | 377.49 | |
| L | 45.54 | 1.25 | 23.97 | 285.36 | 1035.14 |
| PD | ED | MPS | GYRATE | PAFRAC | ENN | COHESION | |
|---|---|---|---|---|---|---|---|
| 1957 | 6.34 | 164.53 | 7.88 | 79.17 | 1.33 | 23.07 | 99.85 |
| 2017 | 1.84 | 25.29 | 3.45 | 70.52 | 1.50 | 135.22 | 98.52 |
| PGP | 3.52 | 45.12 | 4.63 | 75.40 | 1.42 | 97.44 | 98.60 |
| CA (Ha) | CA (%) | CONTAG | SHDI | SHEI | |
|---|---|---|---|---|---|
| 1957 | 2400 | 47 | 47.61 | 0.69 | 0.89 |
| 2017 | 600 | 13 | 80.49 | 0.23 | 0.34 |
| PGP | 1100 | 21 | 63.66 | 0.44 | 0.64 |
Publisher’s Note: MDPI stays neutral with regard to jurisdictional claims in published maps and institutional affiliations. |
© 2020 by the author. Licensee MDPI, Basel, Switzerland. This article is an open access article distributed under the terms and conditions of the Creative Commons Attribution (CC BY) license (http://creativecommons.org/licenses/by/4.0/).
Share and Cite
Varga, D. Are Agrarian Areas in Mediterranean Mountain Regions Becoming Extinct? A Methodological Approach to Their Conservation. Forests 2020, 11, 1116. https://doi.org/10.3390/f11101116
Varga D. Are Agrarian Areas in Mediterranean Mountain Regions Becoming Extinct? A Methodological Approach to Their Conservation. Forests. 2020; 11(10):1116. https://doi.org/10.3390/f11101116
Chicago/Turabian StyleVarga, Diego. 2020. "Are Agrarian Areas in Mediterranean Mountain Regions Becoming Extinct? A Methodological Approach to Their Conservation" Forests 11, no. 10: 1116. https://doi.org/10.3390/f11101116
APA StyleVarga, D. (2020). Are Agrarian Areas in Mediterranean Mountain Regions Becoming Extinct? A Methodological Approach to Their Conservation. Forests, 11(10), 1116. https://doi.org/10.3390/f11101116