Article

Biodiversity of the Cocoa Agroforests of the Bengamisa-Yangambi Forest Landscape in the Democratic Republic of the Congo (DRC)

1
Faculty of Renewable Natural Resources Management, The University of Kisangani, Avenue Kitima 5110400, PO Box 2012 Kisangani, Democratic Republic of Congo
2
Center for International Forestry Research (CIFOR), Yaoundé PO Box 2008 Messa, Cameroon
3
Faculty of Science, University of Goma, Avenue de la Paix 6110103, PO Box 204 Goma, Democratic Republic of Congo
4
Faculty of Science, University of Kisangani, Avenue Kitima 5110400, PO Box 2012 Kisangani, Democratic Republic of Congo
*
Author to whom correspondence should be addressed.
Forests 2020, 11(10), 1096; https://doi.org/10.3390/f11101096
Submission received: 9 August 2020 / Revised: 24 September 2020 / Accepted: 25 September 2020 / Published: 15 October 2020

Abstract

:
Cocoa agroforestry has evolved into an accepted natural resource conservation strategy in the tropics. It is regularly proposed as one of the main uses for REDD+ projects (Reducing Emissions from Deforestation and forest Degradation and the role of conservation, sustainable management of forests, and enhancement of forest carbon stocks in developing countries) in the Democratic Republic of the Congo. However, few studies have characterized the cocoa agroforestry systems in this country. Hence, this research proposes to determine the impact of distance from Kisangani (the unique city in the landscape) and land-use intensity on the floristic composition of cocoa agroforests in Bengamisa-Yangambi forest landscape in the Congo Basin. The results revealed that species diversity and density of plants associated with cocoa are influenced by the distance from Kisangani (the main city in the landscape and province). Farmers maintain/introduce trees that play one or more of several roles. They may host caterpillars, provide food, medicine, or timber, or deliver other functions such as providing shade to the cocoa tree. Farmers maintain plants with edible products (mainly oil palms) in their agroforests more than other plants. Thus, these agroforests play key roles in conserving the floristic diversity of degraded areas. As cocoa agroforestry has greater potential for production, biodiversity conservation, and environmental protection, it should be used to slow down or even stop deforestation and forest degradation.

1. Introduction

Land-use activities, such as clearing tropical forests, practicing subsistence agriculture, and intensifying farmland production, are the most important drivers of biodiversity loss and the associated ecosystem services on the local- and landscape-scale [1,2]. Although the rate of tropical forest loss is alarming, some agricultural systems offer a glimmer of hope. Systems using shade species offer greater potential for production, biodiversity conservation, and long-term environmental protection [3]. Thus, agroforestry is proposed as one of the strategies for conserving natural resources in the tropics [4]. The agroforestry practice provides a potentially valuable conservation tool that can be useful for reducing land-use pressure and enhancing income from rural livelihoods in tropical countries [5]. Several examples across the tropics have shown that agroforests represent a substantial proportion of biodiversity of forest reserves [3,6,7].
Cocoa is one of the most important crops in agroforests [8]. Cocoa farming has played an important role in the conservation of lowland tropical forest landscapes in Latin America, Africa and Asia over the past centuries and continues to do so today [9]. It helps to reduce land-use pressure through the availability of useful tree species and other non-timber forest products (NTFPs) and to improve rural livelihoods [10]. Shade tree systems provide habitat diversity for plant and animal species that do not strictly depend on natural forest. They also connect otherwise disjunctive fragments of the remaining forest patches in the landscape [11]. Cocoa agroforests systems with a mixture of diverse tree species provide more functions than other land-uses in forest landscapes. These functions include maintenance of carbon stocks, biodiversity conservation, and locally relevant ecosystem services, such as protection of the soil [12] and better water management [13]. The introduction of sustainable shade tree management can make cocoa agroforestry an important agent of reforestation [14]. Shade tree management has positive effects on pest outbreaks that may hold the key to breaking cocoa production cycles and helping conserve valuable tropical biodiversity in agroforestry systems [15,16].
Despite the benefits of agroforestry practices, cocoa agroforestry in natural habitats is an important driver of forest degradation and deforestation [14,17]. Land-use planning is needed to reduce further deforestation for the expansion of cocoa land. Such planning can determine areas to preserve under forest cover for ecological reasons and also areas where cocoa might be planted [18].
Introduced in Africa more than a century ago, cocoa production is a major contributor to the economies of many African countries [19]. The continent supplies more than two-thirds of the world’s cocoa, the majority being produced by Côte d’Ivoire and Ghana [20]. Full-sun systems are found mostly in the Lower Guinean forest systems of Liberia, Ghana, Côte d’Ivoire and Nigeria; the more complex systems are in the Congo Basin countries, mainly in Cameroon and the Democratic Republic of the Congo (DRC) [21]. As cocoa production increases in DRC, the sector can learn a lot from its West African neighbours about mistakes to avoid and priorities to emphasize, including the importance of sustainable and climate-smart practices and good governance [22]. In DRC, cocoa agroforests are frequently proposed in projects for REDD+ (reducing emissions from deforestation and forest degradation and the role of conservation, sustainable management of forests, and enhancement of forest carbon stocks in developing countries). The Wildlife Conservation Society, for example, has adopted the idea of growing cocoa as a tool in forest conservation. In the Mambasa region, 1250 hectares (ha) of forest-cover cocoa has planted within the context of the national REDD+ program [23].
In DRC, conflicts and political instability have deeply affected the agricultural sector. For example, there are insufficient data on initiatives in the cocoa sector [20]. Cocoa is generally cultivated by small farmers, most often alongside other crops [22]. However, the quantities produced are small in comparison to West Africa [24]. On the other hand, in Tshopo province, cocoa has been promoted since the colonial era when it was planted under controlled forest cover from which cocoa pest species had been eliminated [23]. However, cocoa cultivation has never been fully developed. Today, most farmers spontaneously plant cocoa in the region by sourcing from former plantations in response to market signals and rumors of market development in the east of DRC [25]. With adequate assistance, cocoa can be produced sustainably without clearing new forest land and can help reduce household poverty [21]. Further efforts are needed to rehabilitate existing cocoa farms to develop sustainable cocoa agroforestry [25].
In cocoa agroforests, species richness and vegetation structure are key components of structural complexity and form the basis of biodiversity [26]. Therefore, good knowledge is needed of the plants associated with cocoa trees in cocoa agroforests in DRC. However, no study on the contributions of cocoa agroforests to the conservation of floristic diversity has focused on DRC.
The choice of Tshopo province, more specifically the Bengamisa-Yangambi landscape, is based on its inclusion of the Yangambi Biosphere Reserve. The United Nations Educational, Scientific and Cultural Organization (UNESCO) declared Yangambi a biosphere reserve in 1977 [27]. Thus, to preserve the important biodiversity of the Yangambi reserve, agroforestry systems in the Bengamisa-Yangambi forest landscape should be studied to understand their influence on the conservation of floristic diversity.
This study paid special attention to how distance from Kisangani (The main city in the landscape) and thus the related disturbance and land-use intensity have affected the floristic composition of cocoa agroforests in the forest landscape. The study is based on the hypothesis that native forest cover, disturbance, land-use intensity, and market access influenced floristic composition of cocoa agroforests. We thus recorded floristic composition of cocoa agroforest in four zones of 15 km each, defined along the main road, from Kisangani city to Yangambi forest reserve landscape, via Bengamisa village.

2. Materials and Methods
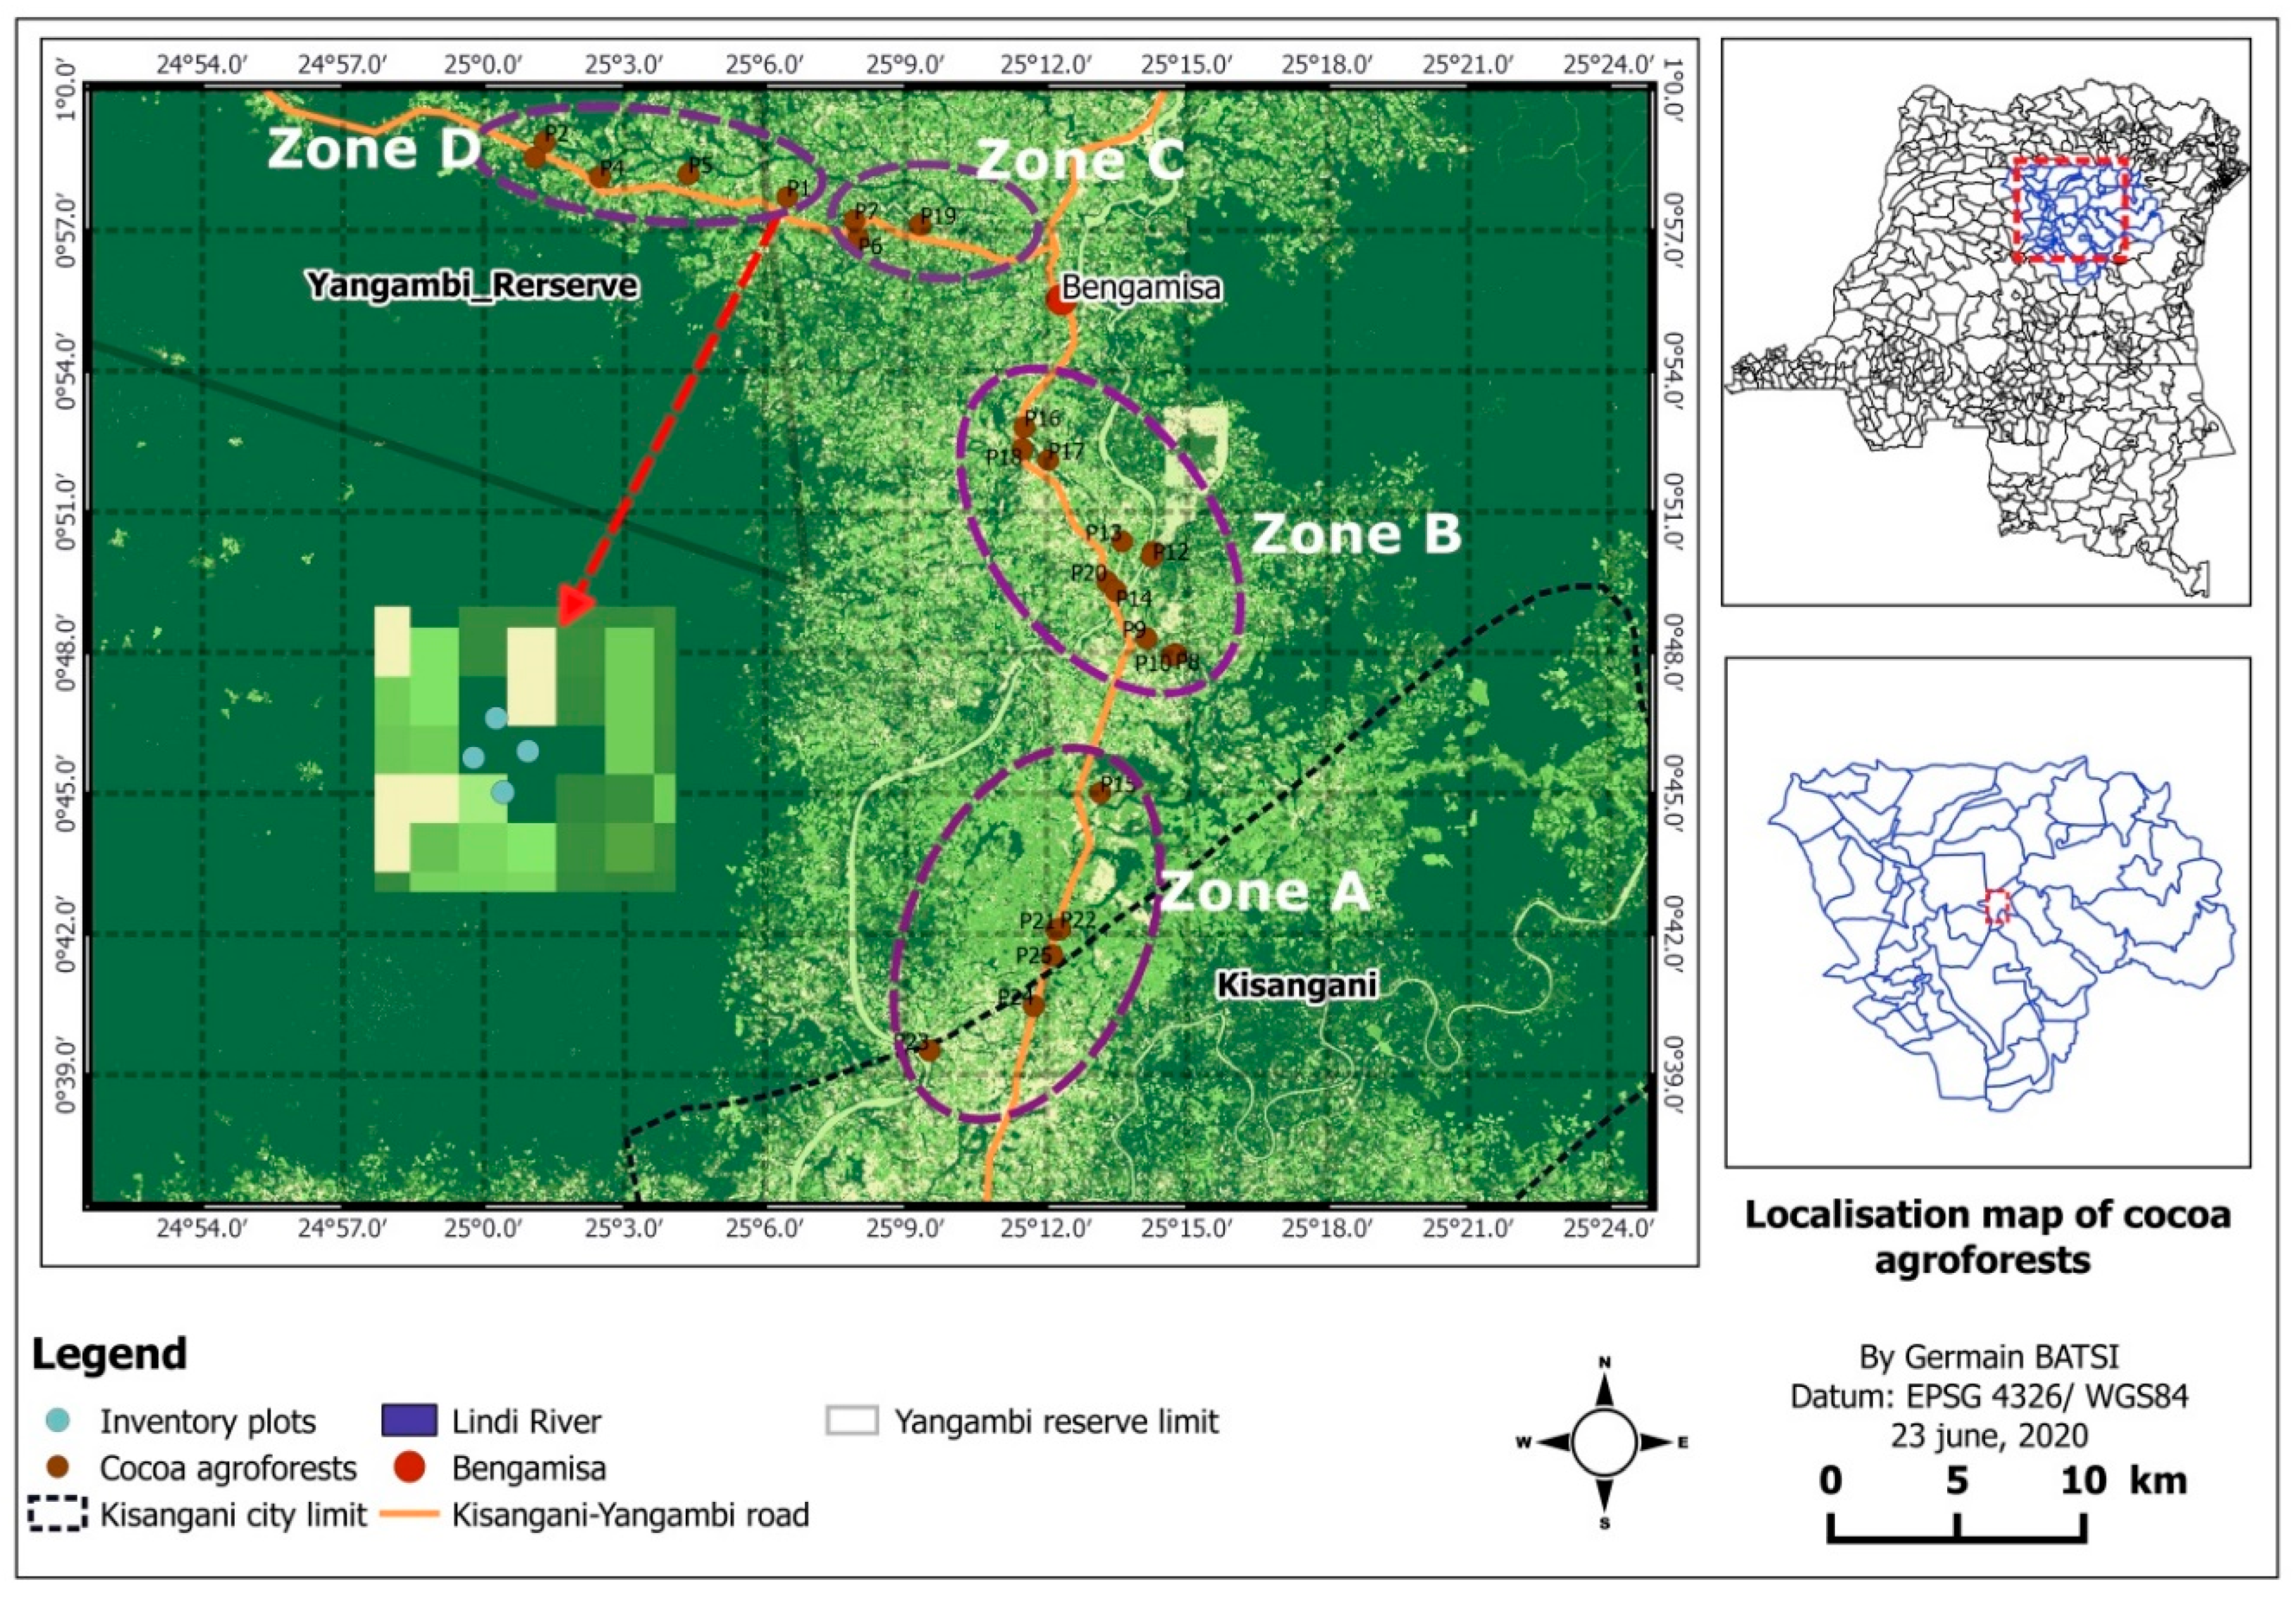
2.1. Study Area

This study was conducted between June and July 2018 in 16 villages and recorded floristic composition of cocoa agroforest in 4 zones of 15 km each, defined along the main road, from Kisangani city to Yangambi forest reserve landscape, via Bengamisa village (Figure 1). This area is located between the city of Kisangani (N 00°31′; E 25°11′) [28] and the Yangambi Biosphere Reserve (N 00°48′; E 24°29′) [29] in Banalia territory, Tshopo province, DRC. The Tshopo province, with an area of 200,240 km2, is in the northeast of DRC and includes seven territories (Bafwasende, Banalia, Basoko, Isangi, Opala, Ubundu and Yahuma) [28,30]. Kisangani, founded in 1883, is the capital of the Tshopo province and is the main city of this province. Its population is estimated at about 1 million (around 20% of the 5,032,472 inhabitants of the province) [28,31]. It is among the five main cities of DRC. Kisangani have an international airport, is the end of the water navigation road on the Congo river and it is crossed by 4 main roads leading to different directions in the country. It has a road connection with the other east part of the DRC and bordering countries such as Uganda. Several smallholders’ industries and shops are thus found in the city. In the Bengamisa-Yangambi forest landscape, it is the main city with his urbanisation impacting the forest landscape between the city and the Yangambi Biosphere reserve.
The region is still predominantly covered with moist forest and has an average population density of 9.8 people per square kilometer (km2). The region has a hot and humid climate without a marked dry season classified as Af in Köppen’s typology [28,30]. It receives an annual precipitation of 1839.5 ± 205.7 millimeters (mm) with an average sub-dry season length of 3.3 ± 1.3 months with monthly precipitation lower than 100 mm, during December–February. Temperatures are high and constant throughout the year with a minimum of 24.2 ± 0.4 °C in July and a maximum of 25.5 ± 0.6 °C in March [29].
The main economic activity in the region is agriculture, which is practiced in a shifting cultivation system [28,31,32]. Cassava is the main staple crop. Furthermore, exploitation of NTFPs, such as bush meat, caterpillars, and wild edible plants, as well as commercial and artisanal logging, artisanal mining, and petty trade provide sources of income to rural households. Six major road axes cut through the forest in a radial pattern starting from Kisangani, along which nearly all settlements are located [31].
In this region, which has excellent agricultural and climatic conditions, cocoa cultivation has been encouraged since colonial times. In 1979, the African Development Bank (AfDB) financed the development of 1750 ha of small peasant and commercial plantations in Bengamisa called CABEN (Cacaoyères de Bengambisa) to increase Congolese cocoa production. CABEN did not achieve its objectives and most of these plantations were abandoned [23].

2.2. Methods

2.2.1. Study Design

To better understand the role of native forest cover, disturbance and land-use intensity on floristic diversity of cocoa agroforests in the region, 4 Blocs/Zones of 15 km each were defined along the main road, including Zone A (18–33 km from Kisangani city), Zone B (34–49 km from Kisangani city), Zone C (50–65 km from Kisangani city), and Zone D (66–81 km from Kisangani city). These zones are arranged from the highly degraded area nearest Kisangani city (Zone A) to the less degraded area in the forest zone (Zone D) (Figure 1). The Bengamisa-Yangambi landscape is still covered by a vast rainforest [33]. The lowest proportion of this forest is found around Kisangani where we have the nucleus of population pressure [34]. The agricultural system is characterized by slash-and-burn agriculture, resulting from a shifting patchwork of cultivated fields, fallows, secondary forests, and remnants of primary forests [33]. Cash crops such as oil palm and cocoa have been cultivated by small farmers since several decades [23,35]. The forest of this landscape is gradually being converted to agricultural land, roads or modified by timber and charcoal exploitation [27,34]. As with other forests stands in DRC [36], the Bengamisa-Yangambi landscape is thus under the agricultural extension, fuelwood collection, timber exploitation, urbanisation, and demography increase pressures.

2.2.2. Collection of Floristic Data

The criteria used to select agroforestry plantations are the net area of the plantation (at least 0.5 hectares) [37]. Four plots of 25 × 25 m (i.e., 625 m2 for each plot), corresponding to an area of 2500 m2 were established within each cocoa agroforest to record plant diversity. In small plantations, the plots were installed successively, spaced 3–5 m apart. In large plantations, the plots were arranged on a diagonal to represent the diversity of the cocoa farm. The diameter was measured at 30 cm from the ground on each cocoa tree and at 1.30 m on the cocoa-associated plants as noted by [38]. A total of 25 cocoa agroforests were surveyed in the Bengamisa-Yangambi forest landscape.
In each cocoa agroforest, and within each plot (25 × 25 m), the number of cocoa trees were counted. Each associated plant with a diameter at breast height (DBH) above/equal to 2.5 centimeter (cm) was recorded. The scientific name of the plant was provided using the Catalogue—Flora of Plants of Kisangani and Tshopo Districts [39]. The main use of each plant is noted. In this study, “Cocoa associated species” refer to all plants (spontaneous or planted) except cocoa trees present in cocoa agroforests. Thus, for their classification, we used the same approach (nature and main use of plants) of previous studies on biodiversity in cocoa agroforests [40,41,42]. All cocoa-associated plant species inventoried were later sorted according to the list of suitable/useful and unsuitable species to cocoa trees established by the National Institute of Agronomic Studies and Research (INERA). Usefulness/suitability criteria used by INERA include production increase, providing light and cocoa-friendly shade, and protection against pests and diseases. The non-suitability of the plant was generally due to pest criteria, including cocoa tree pest housing, competition with cocoa trees, intense shade, and same diseases with cocoa trees. Such criteria were already been used by many cocoa research/extension services in west and central Africa [7].

2.2.3. Data Analysis

Preliminary analysis of cocoa agroforests help to determine three following models of cocoa agroforests: Cocoa agroforests in which companion plants (associated with cocoa trees) were composed primarily of forest/native species (residual species from the previous natural forest or from regeneration of these species or regeneration of species from the adjacent forest), named in this study as Model F; cocoa agroforests in which companion plants were split equally between forest/native species and oil palms (named in this study as Model FP); lastly, cocoa agroforests in which companion plants were composed primarily of oil palms (named in this study as Model P).
We measured the diversity of cocoa agroforests in the Bengamisa-Yangambi forest landscape by evaluating base on the following: (i) species diversity (species richness, Shannon–Wiener index, Piélou’s evenness index, Simpson’s index, rarefaction curve); (ii) relative abundance; (iii) structure (density and basal area); and (iv) linkage between density and biodiversity. Each of these parameters is generally used in the characterization of cocoa agroforest in other countries [15,40,41,43,44,45,46,47] and for the characterization of forest stands [29,48,49].
The diversity and structure (basal area and density of associated plants) were calculated for each of the 25 cocoa agroforests. Diversity was expressed using (a) species richness, (b) Shannon–Wiener index, (c) Piélou’s evenness index, and (d) Simpson’s index [50]. Specific richness (S) is represented by the total or average number of species counted in the cocoa agroforest (obtained by counting the number of species). The Shannon–Wiener index provides an expression of diversity by considering the number of species and the abundance of individuals within each of these species. It is calculated by the following formula: H = i = 1 S p i log p i , where: pi = proportional abundance or percentage of species importance, calculated as follows: p i =   n i N ; ni is the number of individuals of a species in the plot; N is the total number of individuals of all species in the plot; and S is the total number of species in the plot. The Shannon–Wiener index is often accompanied by the Piélou’s evenness index, which is expressed by the following formula: =   H H m a x , where: H m a x   =   log   S and S is the total number of species. This index is a measure of the distribution of individuals within species, independent of species richness. Its value varies from 0 (dominance of a single species) to 1 (equitable distribution of individuals within the species). These two indexes remain dependent on sample size and habitat type. Simpson’s index measures the probability that two randomly selected individuals belong to the same species. It is determined by the following formula: L =   { [ n i ( n i 1 ) ] / [ N ( N 1 ) ] } , where ni is the number of individuals in the species i and N is total number of individuals. As sometimes different diversity indices do not all lead to the same conclusion [50], the rarefaction curves were associated with these indices to make conclusions more robust.
Relative abundance was calculated (for each zone; for each cocoa agroforest models; and for the suitability of associated plants for the agronomy of cocoa (Suitable species and Unsuitable species)) according to the following formula:
A ( % ) = 100 ( N u m b e r     o f s p e c i e s   s t e m s   A l l   s t e m s   o f   t h e   p l o t )
Structure of each cocoa agroforest was evaluated based on the density (number of trees per ha) and the basal area (sums of areas of sections of all trees measured at 1.3 m) of cocoa trees and associated plants. The basal area was calculated by the following formula: S T = π ( D b h ) 2 / 4 , where ST is the basal area expressed in m2 per ha and DBH is expressed in meters. The density calculation concerned first the whole tree population of cocoa agroforest and then the cocoa-associated plants.
Relation between density and species diversity: To establish a possible link between the stem density of species used as associated plant for cocoa trees and species richness, we used the Pearson correlation. This allowed us to correlate density and species richness by zone.
We also used statistical analysis to compare zones (Zones A, B, C, and D) and agroforest models (Model F, Model FP, and Model P). Therefore, descriptive (mean and standard deviation) and inferential analyses (one-way ANOVA, Kruskal test, Wilcoxon–Mann–Whitney test, and simple linear regression) were used. We verified normality using the Shapiro test and verified the homoscedasticity of variance using the Bartlett test. When the data distribution was nonparametric, Kruskal test, and Wilcoxon–Mann–Whitney test were used as appropriate. Otherwise, we used One-way ANOVA and Pearson’s correlation as appropriate. All these analyses were performed by the R software version 4.0.2 [51] under its R studio interface. The acceptable error for the statistical analyses was 5%. The graphs were produced using packages ggplot2 [52] (simple linear regression) and BioDiversity Professional version 2.0 software (The Scottish Association for Marine Science, Oban, United Kingdom) (rarefaction curves). Diversity indices were performed using the Biodiversity R Package [53] and the Vegan Package [54] in the R software [51].
Findings are presented in the following way: (a) species richness and diversity; (b) abundance of plants associated with cocoa; (c) suitable and unsuitable plant species for cocoa agronomy; (d) main uses of plants associated with cocoa; (e) structure of cocoa agroforest; and (f) relation between density and species richness of each cocoa agroforest. These results are later discussed in the context of DRC, and in parallel with previous research across other forest landscapes of the tropics.

3. Results

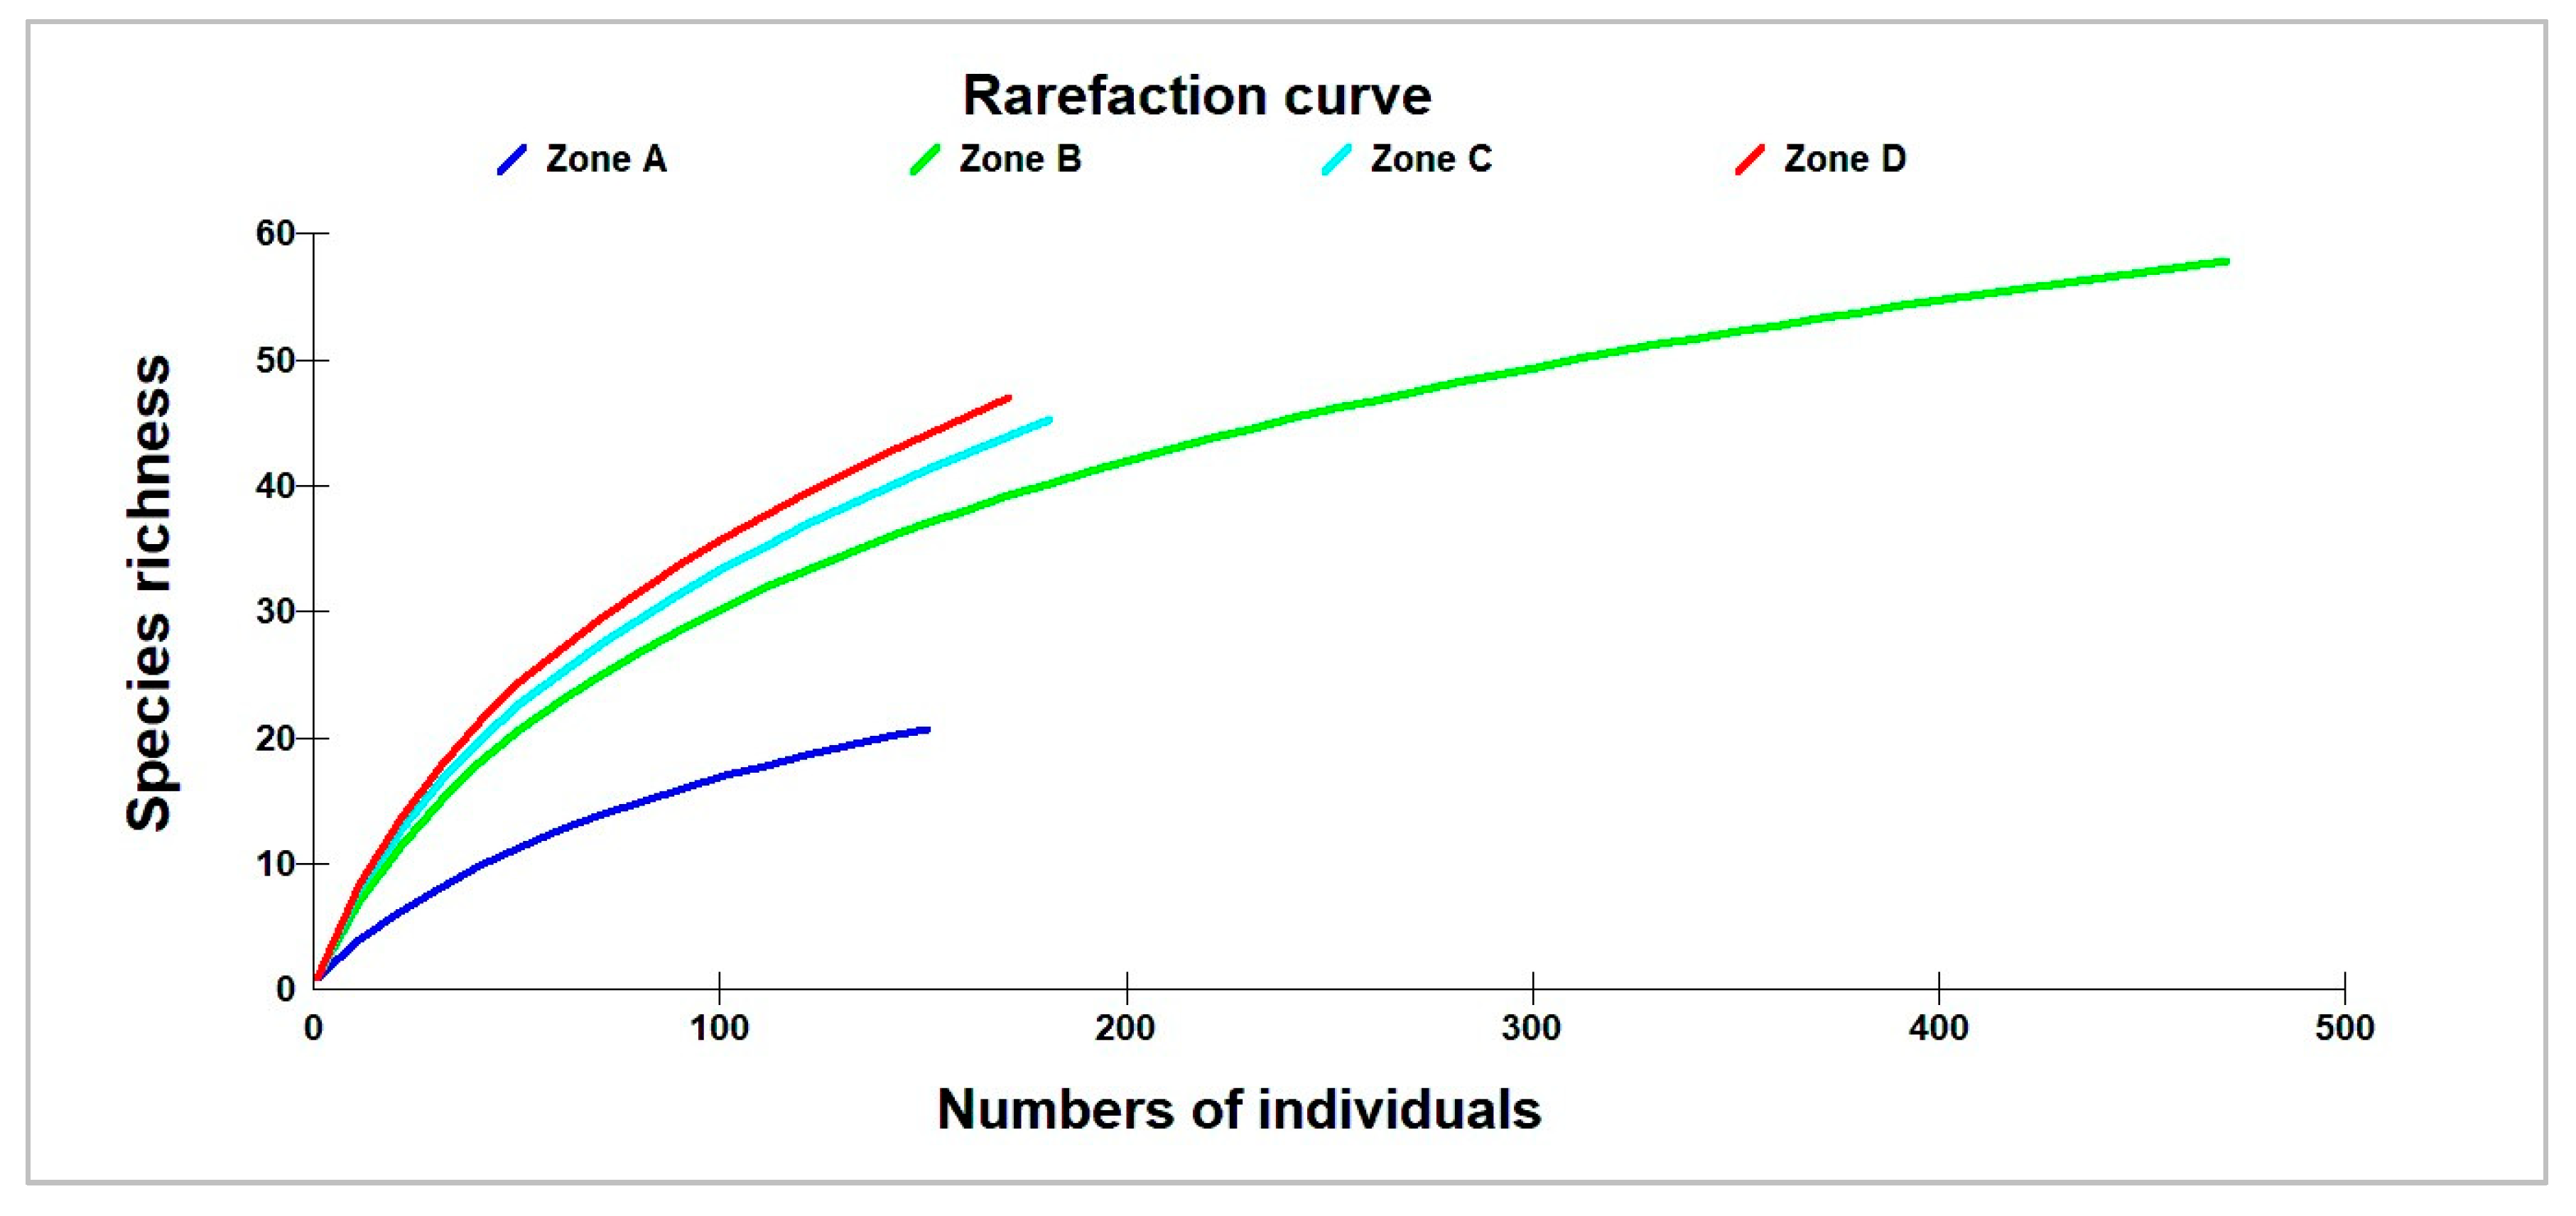
3.1. Species Richness and Diversity Index

A total of 6558 stems, including 996 stems of cocoa-associated plants and 5562 cocoa trees. They are distributed in 90 species including Theobroma cacao, and 78 genera and 38 families were inventoried throughout the survey area. Each cocoa agroforest contains on average 13 species associated with cocoa trees (Table 1). Species richness and diversity indexes (Shannon-Wiener and Simpson) and Piélou’s equitability (the distribution of stems within species) increase with distance from Kisangani city. Indeed, all these indices are low in Zone A (near Kisangani, between 18 and 33 km from Kisangani city) and increase as one moves away from it. On the other hand, they are all high in Zone D (forest zone, between 66 and 81 km from Kisangani city), except for specific richness, which is higher in Zone C (situated between 50 and 65 km from Kisangani city). The rarefaction curve (Figure 2) shows a low number of species in the area surrounding the city (Zone A). The species richness and indexes are generally low in Model P (cocoa agroforests in which companion plants are dominated by oil palms) compared to Model F (agroforests in which companion plants (associated with cocoa trees) are dominated by forest species) and Model FP (cocoa agroforests in which companion plants are split equally between forest species and oil palms) (Table 2). Looking at the entire landscape, Model FP contains the most species followed by Model F (Figure 3).

3.2. Abundance of Plants Associated with Cocoa

The five most abundant species represent around 60% of the plants associated with cocoa. These five most abundant species represented 84%, 59%, 53%, and 47% of plants associated with cocoa in Zones A, B, C, and D, respectively. Elaeis guineensis JACQ. (366 plants representing 36.75% of total plants associated to cocoa) is the most abundant species in the entire study area, followed by Musanga cecropioides R. BR. (45 plants or 4.52%). Considering each zone, Elaeis guineensis (110 plants or 84.62% in Zone A; 179 plants or 63.93 in Zone B; and 51 plants or 51% in Zone C) was most abundant of all species except in the forest area (Zone D), where it was surpassed by Musanga cecropioides (35 plants or 42.17%). Species planted by farmers such as Elaeis guineensis (oil palm), Persea americana MILLER (avocado) and Dacryodes edulis (D. DON) H.J. LAM. (African pear) dominate in cocoa agroforests around Kisangani city (Zone A) in contrast to other areas where residual forest species dominate. However, the five most abundant species in the cocoa agroforests of four zones constitute more than half (59.54%) of the cocoa-associated plant individuals in the Bengamisa-Yangambi landscape (Table 3).

3.3. Suitable and Unsuitable Species for Cocoa

3.3.1. Suitable Species to Cocoa Agronomy

The suitable species for cocoa production (Table 4) represent 27.31% of cocoa-associated plants recorded in the Bengamisa-Yangambi landscape’s cocoa agroforests. They belong to 19 species of the 90 species recorded (They thus represent 21.59% of species in the whole region). Musanga cecropioides (with 57 plants representing 21% of the total plants associated with cocoa), followed by Pycnanthus angolensis (WELW.) EXELL (with 38 plants representing 14% of the total plants associated with cocoa), are the most abundant species for the entire studied area. Considering each zone, Ficus exasperata VAHL (with 3 plants representing 42.9% of the plants associated with cocoa) dominate in Zone A, Pycnanthus angolensis (with 35 plants representing 25% of the plants associated with cocoa) dominate in Zone B, Macaranga monandra MULL. ARG. (with 13 plants representing 25% of the plants associated with cocoa) dominate in Zone C and Musanga cecropioides (with 35 plants representing 47.94% of the plants associated with cocoa) dominate in Zone D. However, a large proportion of individuals (140 plants representing 51.47% of the plants associated with cocoa) of these suitable species for cocoa trees are concentrated in Zone B and a small proportion (seven plants representing 2.5% of the plants associated with cocoa) in Zone A.

3.3.2. Unsuitable Species for Cocoa Agronomy

Unsuitable species for cocoa production (Table 5) represented 13.35% of cocoa-associated plant stems recorded in the Bengamisa-Yangambi landscape. They are grouped in 22 species out of 90 species recorded (25% of the species of the whole region). Pseudospondias microcarpa (A. RICH.) ENGLER (medicinal species) (26 plants or 19.5%) and Myrianthus arboreus P. BEAUV. (edible fruit species) (16 plants or 12%), are the most abundant species in that category in cocoa agroforests of the study area. However, considering each zone, the highest representations are Dacryodes edulis (edible fruit species) with five plants or 71.43% in Zone A, Pseudospondias microcarpa (medicinal species) with 26 plants or 38.46% in Zone B, Carapa procera GILBERT (timber species) with 14 plants or 45.16% in Zone C, and both Vernonia conferta BENTHAM (medicinal species) and Pterocarpus soyauxii TAUB. (timber species) with six plants or 20% each in Zone D. However, a large proportion (48.87%) of individuals of these unsuitable species are concentrated in Zone B and are less represented (5.26%) in Zone A.

3.4. Main Uses of Plants Associated with Cocoa

3.4.1. Main Uses of Plants Associated with Cocoa by Zone (i.e., Main Distance from Kisangani)

In the study area, we inventoried trees hosting caterpillars, trees with edible products, trees with medicinal properties, timber, and other trees with secondary or unknown uses (Table 6). Within these categories, trees with edible products were the most abundant (70.56 ± 50.4 trees per ha), especially in Zone A. The least abundant use category was timber (5.76 ± 7.1 individuals per ha) for the entire study area. Timber was most abundant in Zone C (13.33 ± 13.05 trees per ha) and Zone D (13 ± 4.69 trees per ha).

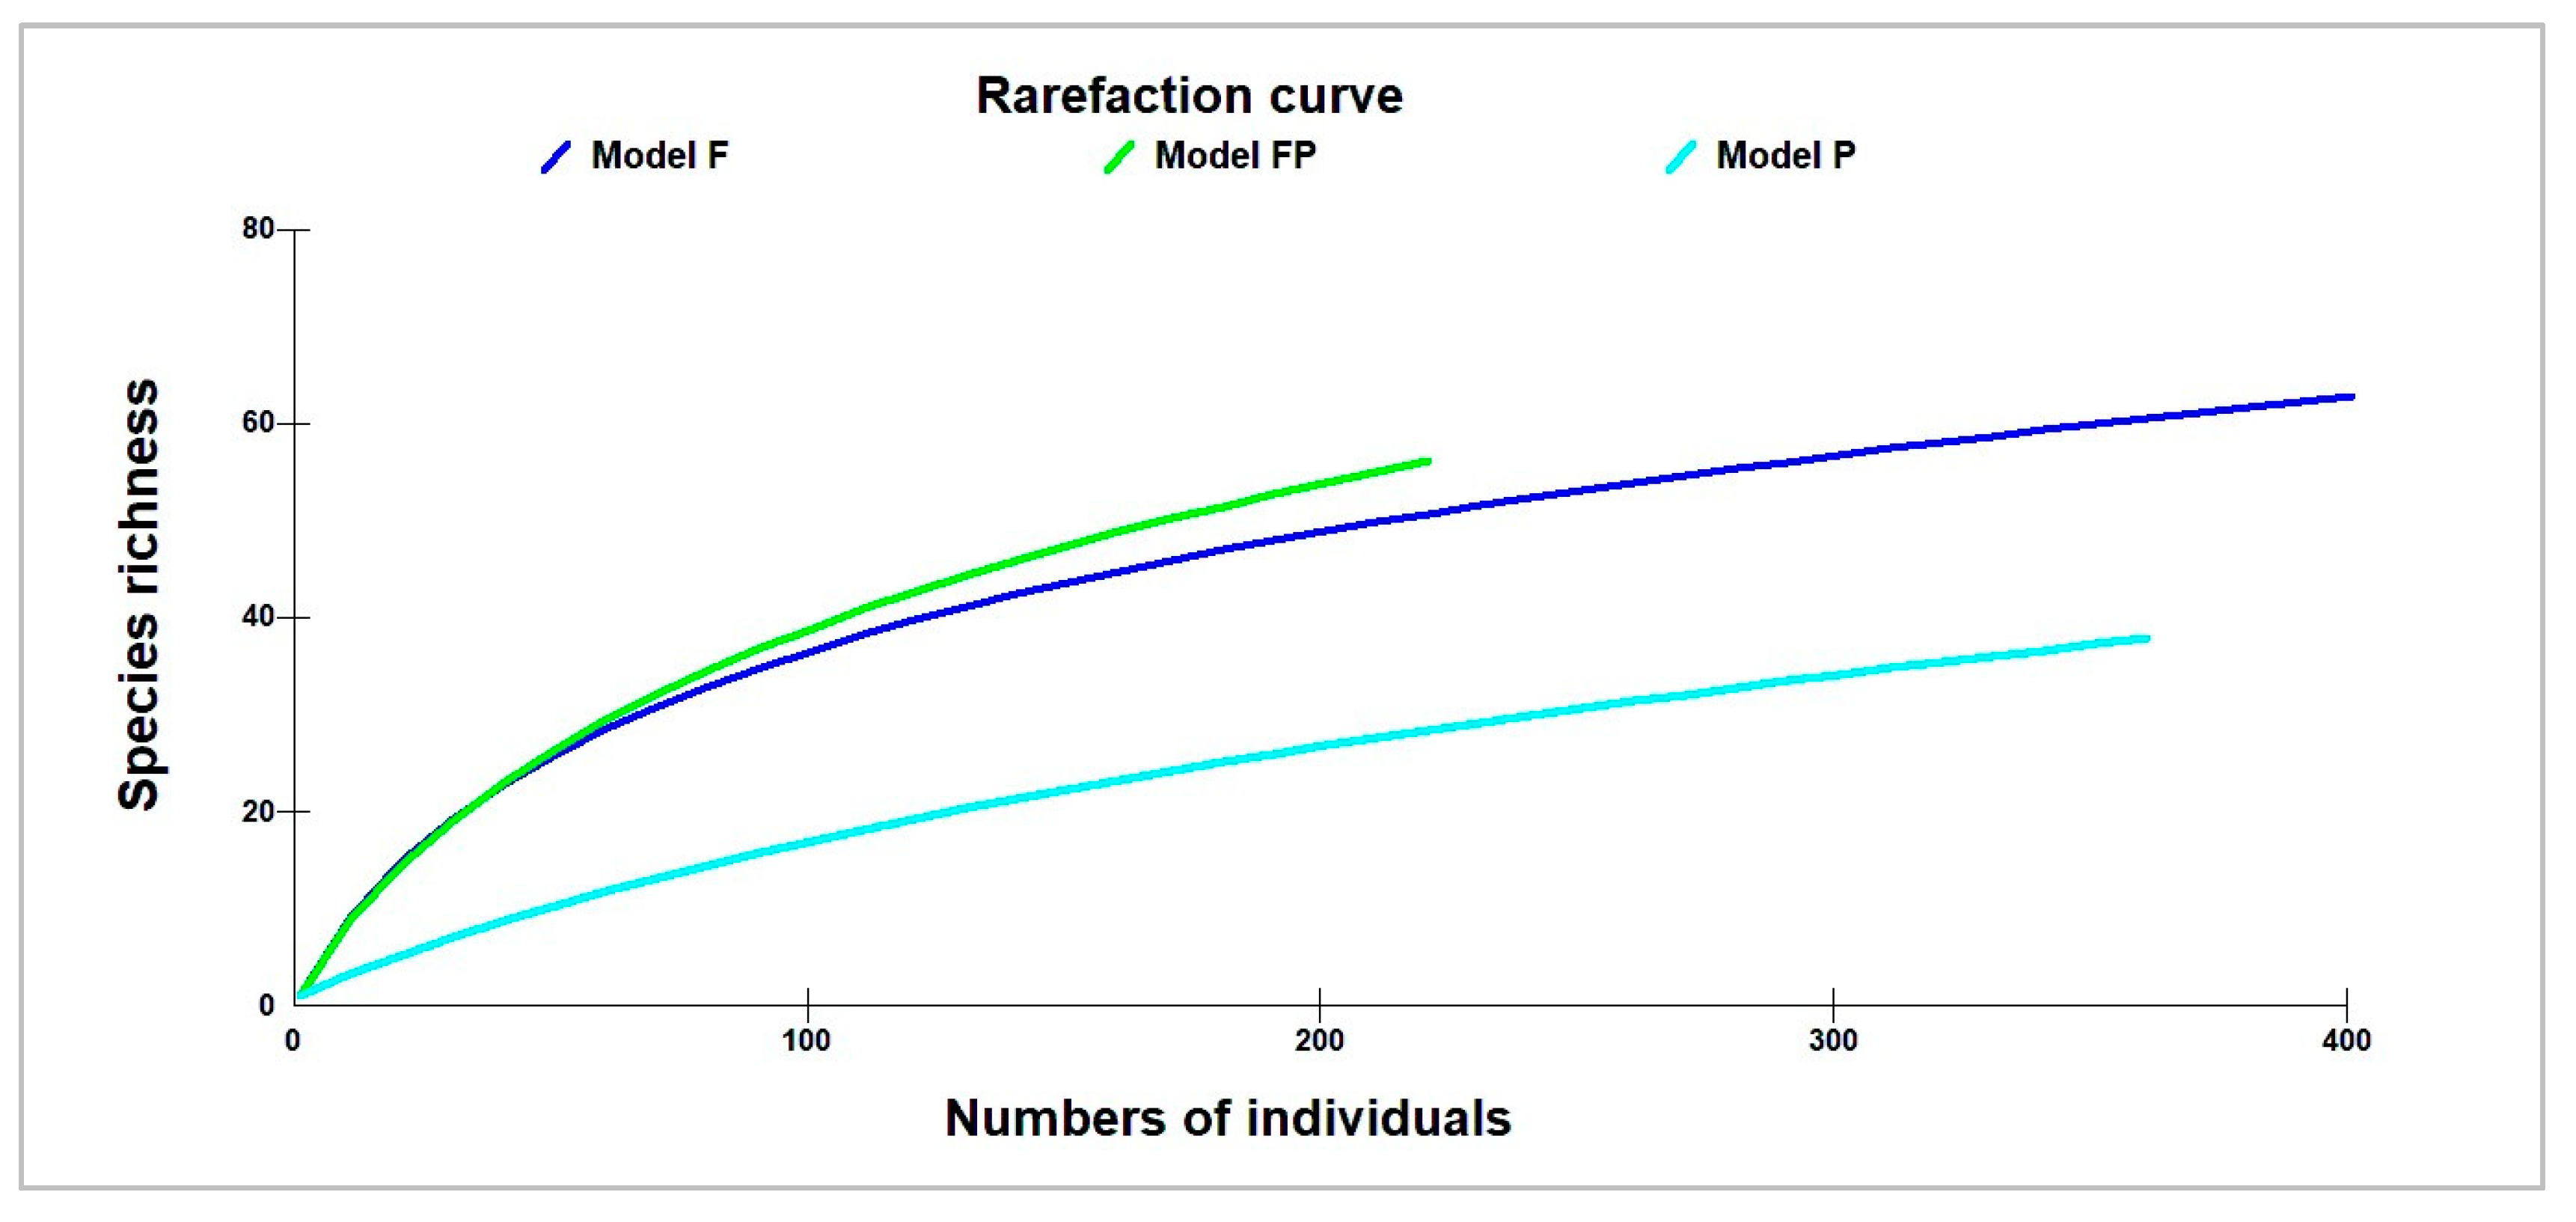
3.4.2. Main Uses of Plants Associated with Cocoa by Cocoa Agroforest Models

Table 7 shows that trees for medicinal use are more abundant (48.8 ± 31.88 individuals per ha) in Model F, followed by tree species with secondary functions (fuelwood, construction wood, etc.) or unknown (37.6 ± 41.06 individuals per ha). In Model FP, individuals in the medicinal category have been most inventoried (52.8 ± 64.96 trees per ha), followed by those with individuals possessing certain edible products (50.4 ± 35.05 trees per ha). Finally, in Model P, individuals of species with edible products are more dominant (121.6 ± 24.6 trees per ha), followed by medicinal species (10 ± 12.82). There is a significant difference between the different models in each of the main uses (p-value < 0.05).

3.5. Structure of Cocoa Agroforests

The average density and basal area of all species (cocoa trees and cocoa-associated plants) in the study area (Table 8) are 1048.16 trees/ha and 17.28 m2/ha, respectively. Of these, cocoa- associated plants take up 15.20% of total density, but 55.84% of total basal area. The density and basal area of cocoa-associated plants in the cocoa agroforests of the study area increase with distance from Kisangani city, except in Zone D where they have decreased compared to the previous areas (Zone C and Zone B). The average density and basal area of cocoa-associated plants in the study area are, respectively, 159.36 trees/ha (p-value = 0.01405) and 9.65 m2/ha (p-value = 0.273).
Table 9 shows that Model F had the highest density (1146 stems/ha) and basal area (22.99 m2/ha), while Model P recorded the lowest density (971 trees/ha) and basal area (12.1 m2/ha). The difference of density between the three models is not statistically significant, but the difference becomes significant when comparing the basal area (p-value = 9.62 × 10⁻⁷).

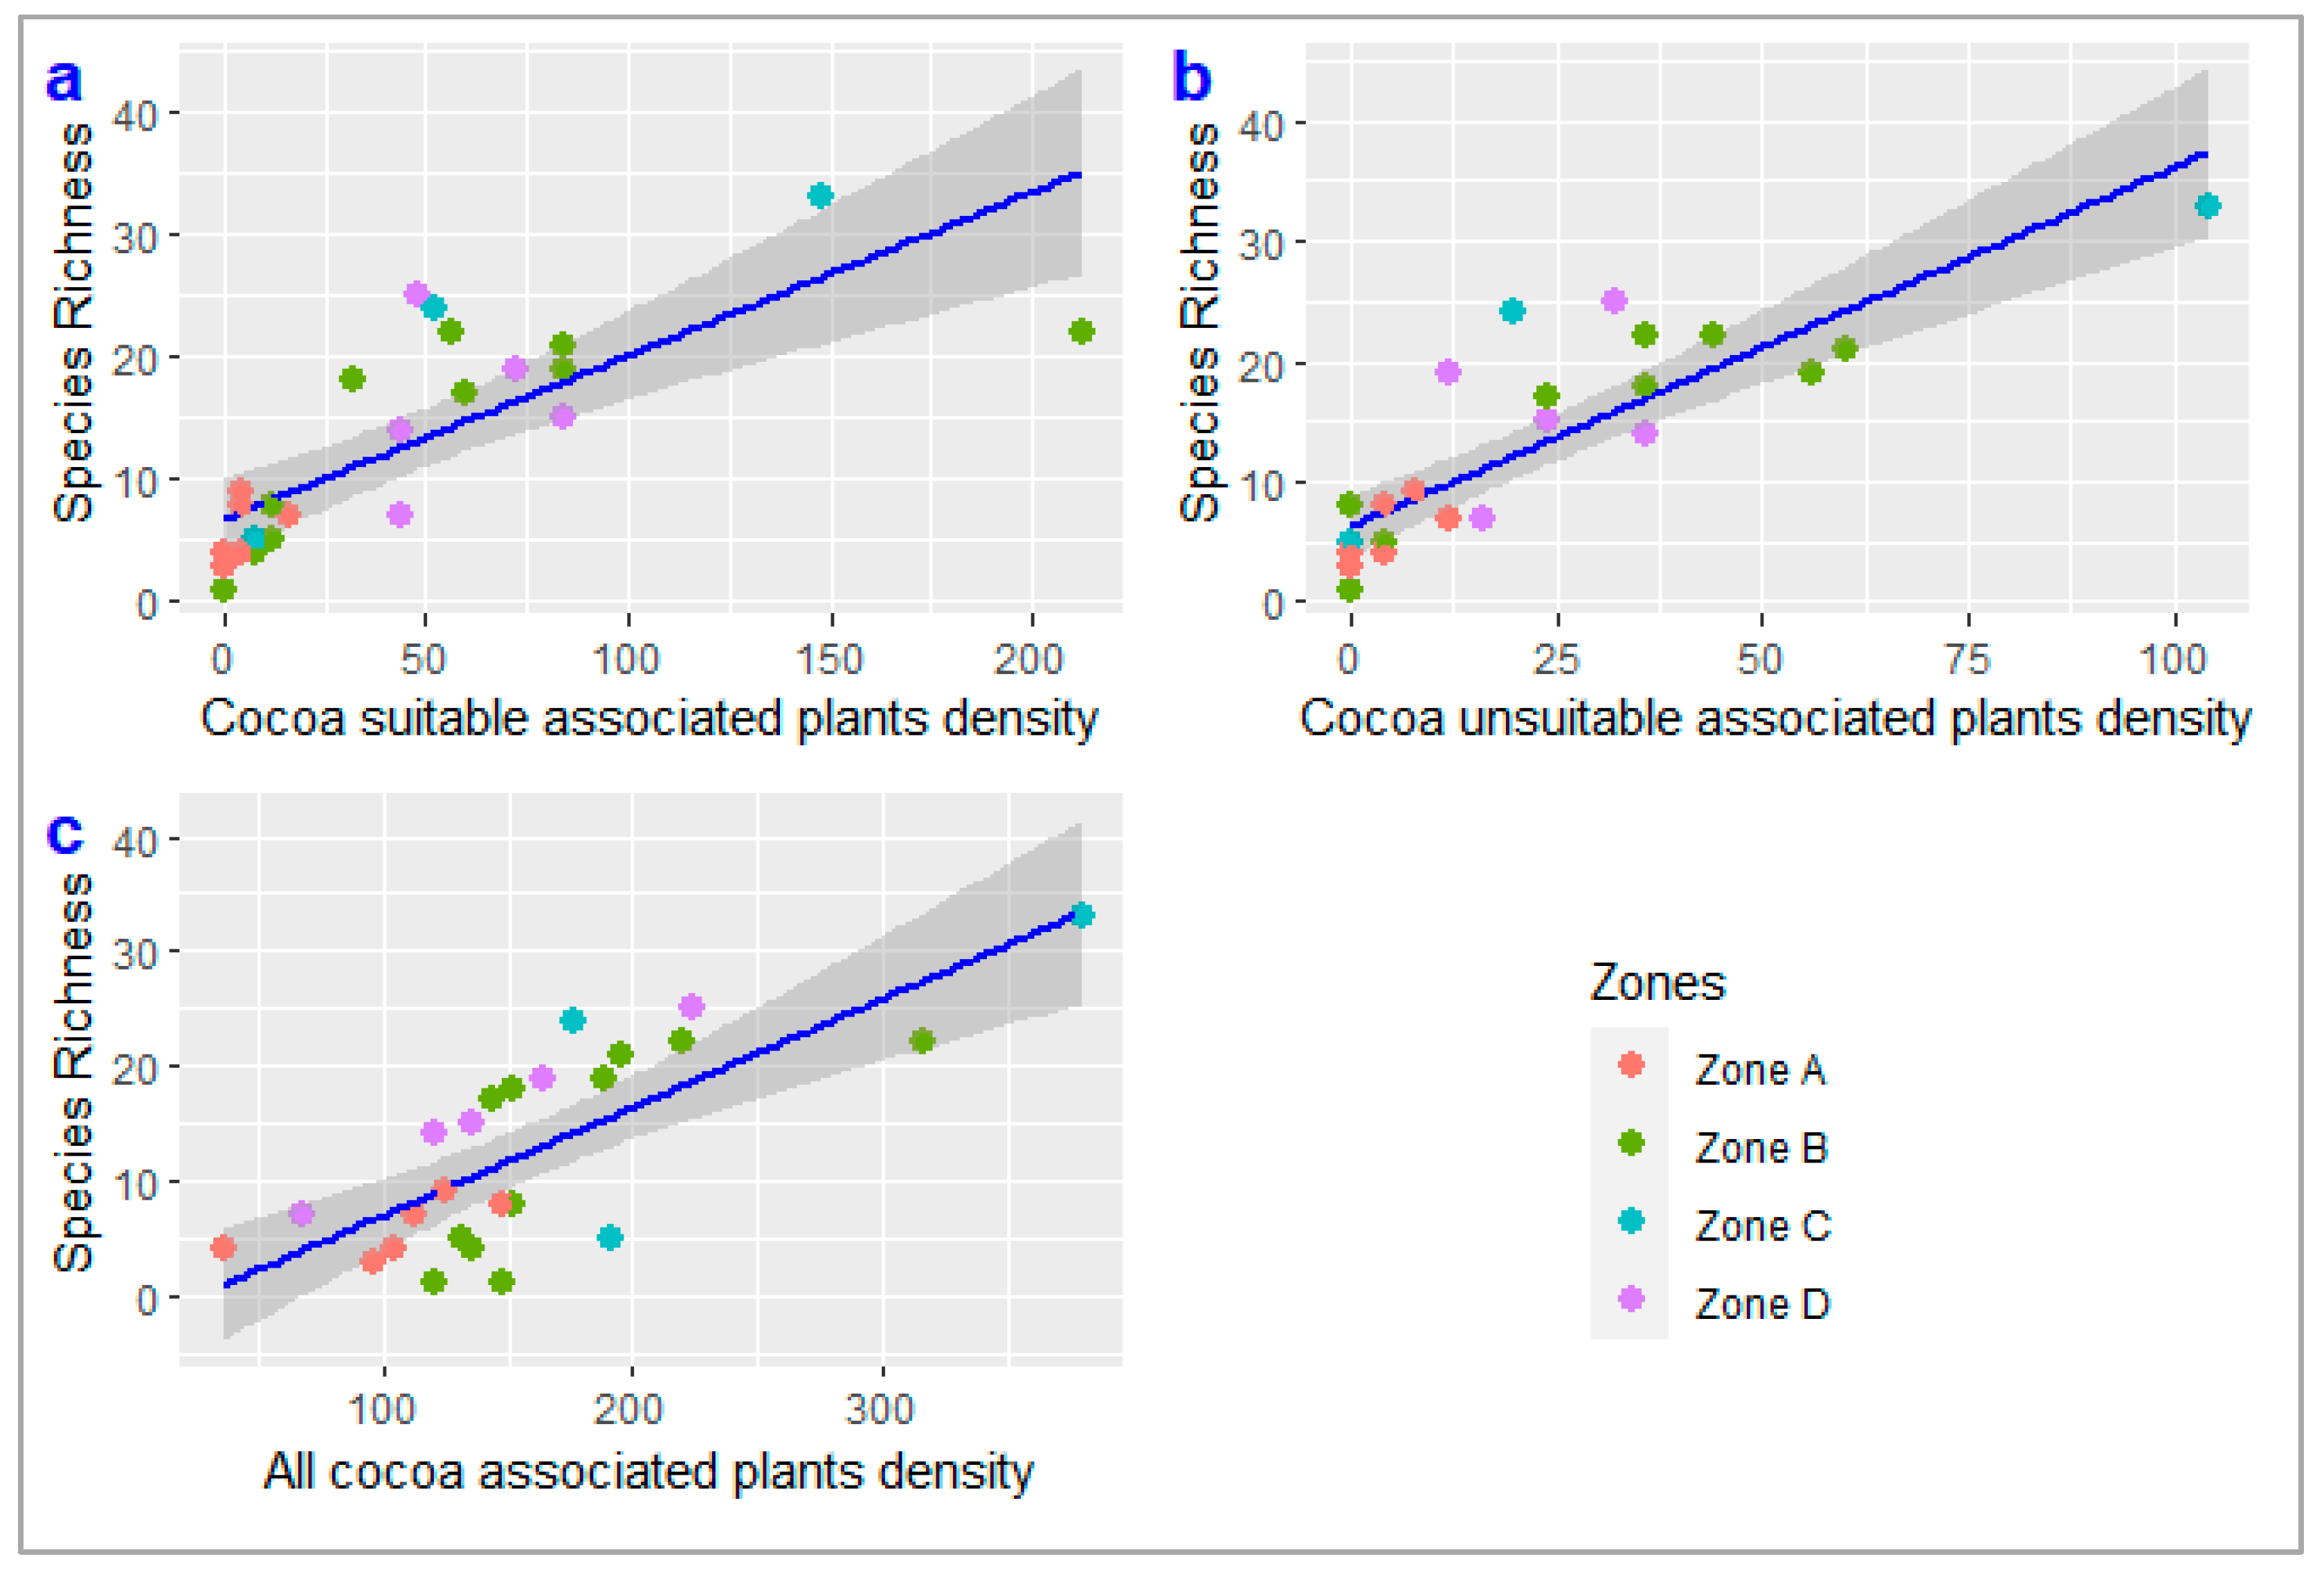
3.6. Relationship between Density and Species Richness of Cocoa Agroforest

There is strong correlation (r = 76%) between the species richness and the density of cocoa-associated plants in cocoa agroforests in the Bengamisa-Yangambi landscape (Figure 4) and in each zone of distance (p-value = 9.4 × 10⁻⁶, R2 = 58%). Moreover, the specific richness in the cocoa agroforests of the above-mentioned landscape is strongly correlated with the density of suitable associated plants (r = 77%, p-value = 6.537 × 10⁻⁶, R2 = 57.6%) (Figure 4a) and with the density of unsuitable associated plants (r = 84.8%, p-value = 8.236 × 10⁻⁸, R2 = 70.8%) to cocoa trees (Figure 4b).

4. Discussion

This study reveals that distance from Kisangani (The main city in the landscape) influences the plants composition (expressed here by species diversity and structure) of the cocoa agroforests. Market access associated to the proximity of this city and land-use intensity and the related disturbance impact the composition of plants associated with cocoa in the forest landscape.

4.1. Floristic Composition of Cocoa Agroforests

The cocoa agroforests of the Bengamisa-Yangambi landscape harbor substantial tree diversity. A total of 996 plants associated to cocoa belonging to 89 species, 77 genera, and 38 families were recorded in 25 cocoa agroforests across the Bengamisa-Yangambi landscape. An average of 13 species occurred per cocoa agroforest. Furthermore, these cocoa agroforests have a high tree diversity as is the case in other cocoa production systems in other parts of the tropics. For example, the authors of [55] inventoried 71 species and 32 families in the agroforestry systems in East Cameroon. Also, the authors of [56] inventoried 27 families and 62 species in cocoa farms in the southern region of Cameroon. However, these results are small compared to those of [57], who obtained 40 families, 112 genera, and 127 species in the Bajo Caguän zone in Colombia. These variabilities can be explained, among others, by the different ecosystems in which the cocoa agroforests were developed, the socio-economic of the landscapes, and the type of cocoa farming systems promoted [57] and sample size.
The high abundance of oil palms (366 of 996 total plants surveyed, i.e., 37%) in cocoa agroforests of the Bengamisa-Yangambi landscape may be explained by the fact that many cocoa trees were established under old oil palm plantations. Indeed, the Bengamisa-Yangambi landscape was subject to an intensification of oil palm cultivation during the colonial period [35]. Moreover, in that region, oil palm is the main source of oil consumed by local people. It is also the main source of beverage consumed (palm wine) in the region. These observations were made in other African countries like Côte d’Ivoire [50] and Cameroon [7,41,42].
The species rarefaction curve, which considers the number of individuals and specific richness (Figure 2 and Figure 3), allows us to see that the number of species grows alongside the increase of cocoa agroforest. This suggests that farmers do not necessarily grow the same species. Since individual farmers have their own species interest [42,58] in separate cocoa agroforests, the combination of all their farms allows for a longer list of species in the cocoa landscape created between the city of Kisangani and the natural forest. The floristic composition of this cocoa landscape is a mixture of local forest species and exotic plants (avocado, etc.). Among these species, those introduced by farmers (oil palm, avocado, African pear) are more present in the cocoa agroforest near Kisangani. Conversely, native species are mainly found within cocoa agroforests close to the forest. However, the abundance of such introduced species indicates the degree of alteration of the cocoa agroforests compared to primary forest [41].

4.2. Specific Diversity in the Cocoa Agroforests of the Study Area

Even though the difference between zones is not statistically significant (one-way ANOVA), the diversity indices (Shannon-Wiener, Simpson’s, Piélou equitability) revealed that diversity is increasing from Zone A (near Kisangani city) to Zone D (forest region). However, large agglomerations like the city of Kisangani exert strong pressure on the forest for satisfying their multiple needs (fuel wood, timber, NTFPs, etc.). This leads to forest fragmentation, followed by deforestation. Therefore, the pressure exerted on the forest also influences the species composition of the cocoa agroforests [41]. It is well established that the distance between the cocoa agroforests and the forest stands may affect the processes associated to forest tree species dissemination [42]. Moreover, when differences in forest coverage change (mainly his disturbance) were considered, plant species richness in cocoa agroforest decreased with increasing intensity of land-use [2], confirming previous studies [41] in the forest zone of southern Cameroon.
Among the three models of cocoa agroforests studied, Model F (agroforests in which companion plants (associated with cocoa trees) are dominated by forest species) is the most diversified. Model P (cocoa agroforests in which companion plants (associated with cocoa trees) are dominated by oil palms) is less diversified (one-way ANOVA). Indeed, the different models of cocoa agroforests displayed different levels of species diversity. These ranged from a critical reduction in species richness from the complex diversified multistate system (which is the most diverse) to the high density of perennial plants (like oil palm) models [57].

4.3. Structure of Cocoa Agroforests

The cocoa-associated plants represent a low density per hectare (15.20% of 1048.16 stems/ha) in the study area. However, they account for more than half of the average basal area in the study area (55.84% of 17.28 m2/ha). Cocoa trees have small diameters compared to cocoa-associated plants, which are heterogeneous, ranging from small to large trees. Consequently, they have a greater influence on the average basal area, despite their low density per hectare. This has a direct impact on stored biomass. Many studies in the tropics have shown similar results, such as in Cameroon [59] and Indonesia [60].
The density of cocoa-associated plants increases significantly with distance from the city (one-way ANOVA, p-value = 0.0177). This difference shows the impact of anthropogenic factors on the vegetation composition in the study area [61]. The impact of anthropogenic footprints is also known to influence the relation between species richness and density [23] of plants associated with cocoa in the study area. Moreover, the management of plants associated with cocoa by smallholders is different between regions and strongly impacts cocoa landscapes [62].
We compared the average density and basal area in agroforestry landscape and natural forests. The density value is largely higher than 467 stems/ha in Pericopsis elata forest and 344 stems/ha in Julbernardia seretii forest obtained by [63] in the lowland forest of Uma in DRC. It is also higher than 412 and 343 stems/ha, respectively, in the mixed forest and monodominant Gilbertiodendron dewevrei forest obtained by [29] in the Yangambi forest in DRC.
The average basal area value is less than 29 and 24.5 m2/ha obtained by [63] in forests of Pericopsis elata and Julbernardia seretii, respectively. It is less than 31.8 and 29.7 m2/ha, respectively, in the mixed and monodominant Gilbertiodendron dewevrei forest obtained by [29]. It is also less than 23 m2/ha in the Gilbertiodendron dewevrei forest and the 32.3 m2/ha obtained by [64] in the mixed forest of the Rubi-Télé hunting domain in DRC. On the other hand, this basal area value is closer to the 19.21 m2/ha obtained by [65] in a degraded forest in the north of Congo-Brazzaville.
However, cocoa agroforests are more comparable to secondary forests in terms of basal area and the high density of small, medium and (the few) large trees in contrast to primary forests (monodominant and mixed) [66]. Conversely, in tropical forests, the large proportion of basal area (biomass) is occupied by large trees. For this reason, even if cocoa agroforests have a high density of trees per hectare, they will not be able to replace primary forests. However, they offer opportunities for developing sustainable land-use systems within fragmented protected forest landscape (around the Yangambi forest reserve). This could help address land and environmental degradation problems, while ensuring provision of substantial household income to sustain livelihoods [67].
The strong positive correlation (r = 76%) between the species richness and the density of cocoa-associated plants in cocoa agroforests in the Bengamisa-Yangambi landscape is similar to the results obtained in tropical forests by several authors [68,69,70], demonstrating the importance of cocoa agroforests in floristic biodiversity conservation in forest landscape. However, this correlation depends on the structural characteristics of the vegetation in the landscape [71]. In the landscape where agronomy farming is introduced, the species proposed by extension services are not necessarily the farmer’s priority [58]. Some of these trees retained are well known to be used (timber, medicine, and fuel wood) [72]. Thus, the management strategies in cocoa plantations affects species diversity and density at plantation and landscape level [72,73]. The strong correlation between species richness and plant density of associated unsuitable species suggest that cocoa bean production is not necessarily the aim of the farmers. And these retentions of species that are not suitable to cocoa agronomy may event, in some situations, be benefit to biodiversity conservation. Figure 4b clearly shows that the species diversity of these unsuitable species increases faster with the increase of their density than in the group of suitable associated species (Figure 4a). This finding suggests that some trade-off between cocoa agronomy and biodiversity conservation may need to be managed within cocoa agroforests.

4.4. Main Local Uses of Cocoa-Associated Plants

The results show that trees with edible products are more abundant and timber species are less abundant in the agroforests of our study area. In Models F and FP, trees for medicinal use are most abundant and in Model P edible species are dominant. This is sufficient proof that farmers are conserving more of the species they need in cocoa agroforests. These needs differ from one area to another. In the forest zone, farmers are more dependent on plants for their health care, whereas near the city they depend more on edible species (oil palm, avocado, African pear, etc.). Nowak et al. [25] obtained a similar result. Indeed, the presence or absence of certain species depends more on their interest to farmers [23]. Usefulness to the household may explain why farmers maintain certain species considered by extension services as potentially unsuitable to cocoa (Table 5) in their cocoa agroforests. Similar results have been obtained in other countries, such as Ghana [24], Cameroon [41,42], and Côte d’Ivoire [58].

4.5. Landscape Management Implication

Initially, cocoa was promoted for its beans. Gradually, however, cocoa agroforest became understood as potentially useful for biodiversity conservation and for climate change responses in forest landscapes of the tropics. Its biodiversity conservation function is mainly explained by the importance of plants associated with cocoa, and more specifically the forest species. Several authors have also recorded this observation in the tropics [1,2,3,41]. Thus, Model F (agroforests in which companion plants (associated with cocoa trees) are dominated by forest species) is the most appropriate if one wishes to approach specific richness and forest structure. The presence of associated plants also contributes to creating a microclimate favourable to development of cocoa trees [74]. On the other hand, several REDD+ projects have proposed cocoa agroforests as a response to deforestation and climate change. These include Mambasa Geographically Integrated REDD+ Pilot Project based on “green cocoa” in DRC [23,75], DRC Cocoa Partnership [20], the Ghana Cocoa Forest Programme [76], Mainstreaming Climate-smart Agricultural Practices in Cocoa Production in Ghana, Climate Cocoa Partnership for REDD+ Preparation [20], Zero Cocoa Deforestation [77], Initiative for Sustainable Landscapes in Cameroon, and the Climate Smart Cocoa Program in Côte d’Ivoire [20].
Without any intervention to reverse the trend, market access if intensified with the growing of Kisangani may contribute to the simplification of plants composition of the cocoa agroforests. This will gradually lead to replacement of forest/native species by the main consumed one, which many of them been exotic (i.e., introduced in DRC). The diversity of cocoa agroforest models offers a variety of options that can be used in the landscapes to search for balance between ecological conservation and farmers livelihoods.

4.6. Limitation of this Paper and Perspectives

This paper is one of the first to study the diversity of cocoa agroforest in DRC. However, further studies are still needed. These should examine better use of cocoa agroforests to support the Sustainable Development Goals (SDG) in rural areas. They should also assess how use of cocoa agroforest can help respond to the Convention on Biological Diversity (CBD) and the United Nations Framework Convention on Climate Change (UNFCCC). More importantly, consumers and chocolate industries are trying to import cocoa that was harvested sustainably without furthering deforestation. European governments are moving toward reducing/cancelling imports of crops that lead to deforestation, including cocoa. At the same time, the private sector (importers and distributors in Europe) wants its value chain to be free of links to deforestation. Plants associated with cocoa are the main carbon sinks [46,78,79] and key components for others ecosystems services. This creates expectations for cocoa agroforest and farming systems that should be explored through greater study. Therefore, the three models (F, PF, P) still require carbon stock studies to be used properly in REDD+ programs in Tshopo province. Other studies could integrate other ecosystem services (wildlife conservation, soil protection, etc.) and socio-economic concerns (improved economic conditions of farmers’ households) related to these three models in Tshopo. Cocoa agroforests are generally recognized for their socio-economic and ecological importance. However, each farming system of the forest landscape needs to be studied better to generate information that will support the sustainable management of these rural landscapes.

5. Conclusions

Cocoa trees introduced in the Yangambi-Bengamisa landscape have been associated with other plants in different cocoa agroforests that are part of the current landscape. Although farmers were advised not to keep some trees in the same field as cocoa plants, they have maintained/introduced plants over the last decades that have some function (edible, hosting caterpillars, medicinal, etc.). A multitude of cocoa farming systems could be classified into three main groups: Model F (agroforests in which companion plants (associated with cocoa trees) are dominated by forest species), Model FP (cocoa agroforests in which companion plants (associated with cocoa trees) are split equally between forest species and oil palms), and Model P (cocoa agroforests in which companion plants (associated with cocoa trees) are dominated by oil palms). Such models thus present different options for strengthening the livelihood of farmers, improving biodiversity conservation, and/or defining an appropriate climate change response in Tshopo province and other parts of DRC. Based on the findings of this study, the diversity of cocoa agroforest models offers a variety of options that can be used in the landscapes to search for balance between ecological conservation and farmers livelihoods.
The distance from the city (Kisangani) is a determining factor in the floristic composition (species diversity and plant density) of the cocoa agroforests. The area close to the city is marked by an abundance of oil palms and some edible species, such as avocados and African pear. Areas near the forests are more abundant to forest species for medicinal use.
The findings provide scientific evidence that can be useful in harnessing cocoa agroforest to improve the livelihoods of farmers, conserve biodiversity, and respond to climate change in the Bengamisa-Yangambi landscape and other forest landscapes of DRC.

Author Contributions

D.J.S. conceptualized and supervised the study with J.-M.K. and J.E.; G.B. collected the data with the assistance of L.M. All authors have read and agreed to the published version of the manuscript.

Funding

This research was funded by EU (Contrat FED/2016/381-145) and NORAD Grant agreement code No: NOR114.

Acknowledgments

The authors would like to thank the European Union (EU) and CIFOR for funding through the Training and Research in Tshopo (FORETS: Formation, Recherche, Environment dans la Tshopo) project. We also thank the Resources & Synergies Development design office for its logistical support. We thank all cocoa farmers in the Bengamisa-Yangambi landscape for their support during the data collection period. Finally, we would like to thank all those who accompanied us in the field during this period (guides and botanical identifiers). This research was carried out to partially complete the requirements of a master’s degree, but also as part of the CIFOR GCS-REDD+ project funded by the Norwegian Agency for Development Cooperation (NORAD).

Conflicts of Interest

The authors declare no conflict of interest.

References

  1. Foley, J.A.; DeFries, R.; Asner, G.P.; Barford, C.; Bonan, G.; Carpenter, S.R.; Chapin, F.S.; Coe, M.T.; Daily, G.C.; Gibbs, H.K.; et al. Global consequences of land-use. Science 2005, 309, 570–574. [Google Scholar] [CrossRef] [PubMed] [Green Version]
  2. Clough, Y.; Barkmann, J.; Juhrbandt, J.; Kessler, M.; Wanger, T.C.; Anshary, A.; Buchori, D.; Cicuzza, D.; Darras, K.; Dwi Putra, D.; et al. Combining high biodiversity with high yields in tropical agroforests. Proc. Natl. Acad. Sci. USA 2011, 108, 8311–8316. [Google Scholar] [CrossRef] [PubMed] [Green Version]
  3. Rice, R.A.; Greenberg, R. Cacao cultivation and the conservation of biological diversity. Ambio 2000, 29, 167–173. [Google Scholar] [CrossRef]
  4. Götz, S.; Harvey, C.A.; Grégoire, V. Agroforestry and biodiversity conservation in tropical landscapes. In Agroforestry Systems; Götz, S., da Fonseca, G., Harvey, C.A., Gascon, C., Vasconcelos, H., Izac, A.-M., Eds.; Island Press: Washington, DC, USA, 2004; Volume 68, pp. 247–249. [Google Scholar]
  5. Bhagwat, S.A.; Willis, K.J.; Birks, H.J.B.; Whittaker, R.J. Agroforestry: A refuge for tropical biodiversity? Trends Ecol. Evol. 2008, 23, 261–267. [Google Scholar] [CrossRef] [PubMed]
  6. Cicuzza, D.; Kessler, M.; Clough, Y.; Pitopang, R.; Leitner, D.; Tjitrosoedirdjo, S.S. Conservation value of cacao agroforestry systems for terrestrial herbaceous species in Central Sulawesi, Indonesia. Biotropica 2011, 43, 755–762. [Google Scholar] [CrossRef]
  7. Sonwa, D.J.; Weise, S.F.; Schroth, G.; Janssens, M.J.J. Howard-Yana Shapiro Plant diversity management in cocoa agroforestry systems in West and Central Africa—Effects of markets and household needs. Agrofor. Syst. 2014, 88, 1021–1034. [Google Scholar] [CrossRef]
  8. Blaser, W.J.; Oppong, J.; Yeboah, E.; Six, J. Shade trees have limited benefits for soil fertility in cocoa agroforests. Agric. Ecosyst. Environ. 2017, 243, 83–91. [Google Scholar] [CrossRef] [Green Version]
  9. Schroth, G.; Harvey, C.A. Biodiversity conservation in cocoa production landscapes: An overview. Biodivers. Conserv. 2007, 16, 2237–2244. [Google Scholar] [CrossRef]
  10. Toppo, P.; Raj, A. Role of agroforestry in climate change mitigation. J. Pharmacogn. Phytochem. 2018, 7, 241–243. [Google Scholar]
  11. Vebrova, H.; Lojka, B.; Husband, T.P.; Zans, M.E.C.; Van Damme, P.; Rollo, A.; Kalousova, M. Tree diversity in cacao agroforests in San Alejandro, Peruvian Amazon. Agrofor. Syst. 2014, 88, 1101–1115. [Google Scholar] [CrossRef]
  12. Sari, R.R.; Saputra, D.D.; Hairiah, K.; Rozendaal, D.M.A.; Roshetko, J.M.; van Noordwijk, M. Gendered species preferences link tree diversity and carbon stocks in Cacao agroforest in Southeast Sulawesi, Indonesia. Land 2020, 9, 108. [Google Scholar] [CrossRef] [Green Version]
  13. Mbow, C.; Smith, P.; Skole, D.; Duguma, L.; Bustamante, M. Achieving mitigation and adaptation to climate change through sustainable agroforestry practices in africa. Curr. Opin. Environ. Sustain. 2014, 6, 8–14. [Google Scholar] [CrossRef] [Green Version]
  14. Merijn, B.; Simone, S. Biodiversity conservation in cacao agroforestry systems. In Biodiversity Conservation in Agroforestry Landscapes: Challenges and Opportunities; Simonetti, J.A., Ed.; Editorial Universitaria: Santiago, Chile, 2013; pp. 61–76. [Google Scholar]
  15. Daghela Bisseleua, H.B.; Fotio, D.; Yede; Missoup, A.D.; Vidal, S. Shade tree diversity, cocoa pest damage, yield compensating inputs and farmers’ net returns in West Africa. PLoS ONE 2013, 8, e56115. [Google Scholar] [CrossRef]
  16. Rajab, Y.; Leuschner, C.; Barus, H.; Tjoa, A.; Hertel, D. Cacao cultivation under diverse shade tree cover allows high carbon storage and sequestration without yield losses. PLoS ONE 2016, 11, e0149949. [Google Scholar] [CrossRef] [PubMed] [Green Version]
  17. Ruf, F.O. The myth of complex cocoa agroforests: The case of Ghana. Hum. Ecol. 2011, 39, 373–388. [Google Scholar] [CrossRef] [Green Version]
  18. Wessel, M.; Quist-Wessel, P.M.F. Cocoa production in West Africa, a review and analysis of recent developments. NJAS Wagening. J. Life Sci. 2015, 74–75, 1–7. [Google Scholar] [CrossRef] [Green Version]
  19. Anderson Bitty, E.; Bi, S.G.; Bene, J.C.K.; Kouassi, P.K.; Scott McGraw, W. Cocoa farming and primate extirpation inside Cote d’Ivoire’s protected areas. Trop. Conserv. Sci. 2015, 8, 95–113. [Google Scholar] [CrossRef] [Green Version]
  20. Kroeger, A.; Bakhtary, H.; Haupt, F.; Streck, C. Eliminating Deforestation from the Cocoa Supply Chain; World Bank: Washington, DC, USA, 2017; pp. 1–61. [Google Scholar]
  21. Bernard, F.; Minang, P.A. Community forestry and REDD+ in Cameroon: What future? Ecol. Soc. 2019, 24, 14. [Google Scholar] [CrossRef] [Green Version]
  22. Downie, R. Assessing the Growth Potential of Eastern Congo’s Coffee and Cocoa Sectors; Center for Strategic and International Studies: Washington, DC, USA, 2018; pp. 1–24. [Google Scholar]
  23. Jassogne, L.; van Asten, P.; De Beule, H. Cocoa: Driver of deforestation in the Democratic Republic of Congo? CGIAR: Copenhagen, Denmark, 2014; pp. 1–31. [Google Scholar]
  24. Schroth, G.; Jeusset, A.; da Silva Gomes, A.; Florence, C.T.; Coelho, N.A.P.; Faria, D.; Läderach, P. Climate friendliness of cocoa agroforests is compatible with productivity increase. Mitig. Adapt. Strateg. Glob. Chang. 2016, 21, 67–80. [Google Scholar] [CrossRef]
  25. Nowak, A.; Rosenstock, T.S.; Hammond, J.; Degrande, A.; Smith, E. Livelihoods of Households Living Near Yangambi Biosphere Reserve, Democratic Republic of Congo; Center for International Forestry Research: Bogor, Indonesia, 2019; pp. 1–10. [Google Scholar]
  26. Ngo Bieng, M.A.; Gidoin, C.; Avelino, J.; Cilas, C.; Deheuvels, O.; Wery, J. Diversity and spatial clustering of shade trees affect cacao yield and pathogen pressure in Costa Rican agroforests. Basic Appl. Ecol. 2013, 14, 329–336. [Google Scholar] [CrossRef]
  27. Kyale Koy, J.; Wardell, D.A.; Mikwa, J.; Kabuanga, J.M.; Monga Ngonga, A.M.; Oszwald, J.; Doumenge, C. Dynamics of déforestation dans la Réserve de biosphère de Yangambi (République Démocratique du Congo): Variabilité spatiale et temporelle au cours des 30 dernières années. Bois Forets Trop. 2019, 341, 15. [Google Scholar] [CrossRef]
  28. Moloba, Y.; Mobula, V.; Ntoto, R.; Mahungu, M. Dynamique socio-économique de l’adoption des variétés améliorées du manioc en République Démocratique du Congo (RDC): Cas des provinces de Kongo Central et la Tshopo. Eur. Sci. J. ESJ 2019, 15, 346–362. [Google Scholar]
  29. Kearsley, E.; Verbeeck, H.; Hufkens, K.; Van de Perre, F.; Doetterl, S.; Baert, G.; Beeckman, H.; Boeckx, P.; Huygens, D. Functional community structure of African monodominant Gilbertiodendron dewevrei forest influenced by local environmental filtering. Ecol. Evol. 2017, 7, 295–304. [Google Scholar] [CrossRef] [Green Version]
  30. Termote, C.; Van Damme, P.; Djailo, B.D. Eating from the wild: Turumbu, Mbole and Bali traditional knowledge on non-cultivated edible plants, District Tshopo, DR Congo. Genet. Resour. Crop Evol. 2011, 58, 585–618. [Google Scholar] [CrossRef]
  31. Moonen, P.C.J.; Verbist, B.; Schaepherders, J.; Bwama Meyi, M.; Van Rompaey, A.; Muys, B. Actor-based identification of deforestation drivers paves the road to effective REDD+ in DR Congo. Landuse Policy 2016, 58, 123–132. [Google Scholar] [CrossRef]
  32. Moonen, P.C.J.; Verbist, B.; Boyemba Bosela, F.; Norgrove, L.; Dondeyne, S.; Van Meerbeek, K.; Kearsley, E.; Verbeeck, H.; Vermeir, P.; Boeckx, P.; et al. Disentangling how management affects biomass stock and productivity of tropical secondary forests fallows. Sci. Total Environ. 2019, 659, 101–114. [Google Scholar] [CrossRef]
  33. Akkermans, T.; Van Rompaey, A.; Van Lipzig, N.; Moonen, P.; Verbist, B. Quantifying successional land cover after clearing of tropical rainforest along forest frontiers in the Congo Basin. Phys. Geogr. 2013, 34, 417–440. [Google Scholar] [CrossRef] [Green Version]
  34. Bamba, I.; Barima, Y.S.; Bogaert, J. Influence de la densité de la population sur la structure spatiale d’un paysage forestier dans le Bassin du congo en R. D. Congo. Trop. Conserv. Sci. 2010, 3, 31–44. [Google Scholar] [CrossRef]
  35. Béguin, H. Densité de population, productivité et développement agricole. Espace Géogr. 1974, 4, 267–272. [Google Scholar] [CrossRef]
  36. Ministère de l’Environnement Conservation de la Nature et Tourisme (MECNT). Potentiel REDD + de la RDC; MECNT: Kinshasa, Democratic Republic of the Congo, 2009; p. 66. [Google Scholar]
  37. Torres, B.; Maza, O.J.; Aguirred, P.; Und, L.H.; Günter, S. Contribution of traditional agroforestry to climate change adaptation in the Ecuadorian Amazon: The Chakra System. In Handbook of Climate Change Adaptation; Filho, W.L., Ed.; Springer: Berlin/Heidleberg, Germany, 2014; Volume 1, pp. 1–19. [Google Scholar]
  38. Zapfack, L.; Engwald, S.; Sonke, B.; Achoundong, G.; Madong, B.A. The impact of land conversion on plant biodiversity in the forest zone of Cameroon. Biodivers. Conserv. 2002, 11, 2047–2061. [Google Scholar] [CrossRef]
  39. Lejoly, J.L.; Djele, M.N.; Eerinck, D.G. Catalogue-Flore des Plantes Vasculaires des Districts de Kisangani et de la Tshopo (RD Congo); 4ème.; Taxonomania: Bruxelles, Belgium, 2012; pp. 1–313. [Google Scholar]
  40. Oke, D.O.; Odebiyi, K.A. Traditional cocoa-based agroforestry and forest species conservation in Ondo State, Nigeria. Agric. Ecosyst. Environ. 2007, 122, 305–311. [Google Scholar] [CrossRef]
  41. Sonwa, D.J.; Nkongmeneck, B.A.; Weise, S.F.; Tchatat, M.; Adesina, A.A.; Janssens, M.J.J. Diversity of plants in cocoa agroforests in the humid forest zone of Southern Cameroon. Biodivers. Conserv. 2007, 16, 2385–2400. [Google Scholar] [CrossRef]
  42. Abada Mbolo, M.M.; Zekeng, J.C.; Mala, W.A.; Fobane, J.L.; Djomo Chimi, C.; Ngavounsia, T.; Nyako, C.M.; Menyene, L.F.E.; Tamanjong, Y.V. The role of cocoa agroforestry systems in conserving forest tree diversity in the Central region of Cameroon. Agrofor. Syst. 2016, 90, 577–590. [Google Scholar] [CrossRef]
  43. Dawoe, K.; Asante, W.; Acheampong, E.; Bosu, P. Shade tree diversity and aboveground carbon stocks in Theobroma cacao agroforestry systems: Implications for REDD+ implementation in a West African cacao landscape. Carbon Balance Manag. 2016, 11, 1–13. [Google Scholar] [CrossRef] [PubMed] [Green Version]
  44. Jadán, O.; Cifuentes, M.; Torres, B.; Selesi, D.; Veintimilla, D.; Günter, S. Influence of tree cover on diversity, carbon sequestration and productivity of cocoa systems in the Ecuadorian Amazon. Bois Forets Trop. 2015, 325, 35–47. [Google Scholar] [CrossRef] [Green Version]
  45. Noiha, V.N.; Zapfack, L.; Mbade, L.F. Biodiversity management and plant dynamic in a Cocoa Agroforest (Cameroon). Int. J. Plant Soil Sci. 2015, 6, 101–108. [Google Scholar] [CrossRef]
  46. Somarriba, E.; Cerda, R.; Orozco, L.; Cifuentes, M.; Dávila, H.; Espin, T.; Mavisoy, H.; Ávila, G.; Alvarado, E.; Poveda, V.; et al. Carbon stocks and cocoa yields in agroforestry systems of Central America. Agric. Ecosyst. Environ. 2013, 173, 46–57. [Google Scholar] [CrossRef]
  47. Hervé, B.; Vidal, S. Plant biodiversity and vegetation structure in traditional cocoa forest gardens in southern Cameroon under different management. Biodivers. Conserv. 2008, 17, 1821–1835. [Google Scholar]
  48. Sullivan, M.J.P.; Talbot, J.; Lewis, S.L.; Phillips, O.L.; Qie, L.; Begne, S.K.; Chave, J.; Cuni-sanchez, A.; Hubau, W.; Lopez, G.; et al. Diversity and carbon storage across the tropical forest biome. Sci. Rep. 2017, 7–39102, 1–12. [Google Scholar] [CrossRef] [Green Version]
  49. Shahid, M.; Joshi, S.P. Relationship between tree species diversity and carbon stock density in moist deciduous forest of Western Himalayas, India. J. For. Environ. Sci. 2017, 33, 39–48. [Google Scholar] [CrossRef]
  50. Grall, J.; Coic, N. Synthèse des Méthodes D’évaluation de la Qualité du Benthos en Milieu Côtier Préliminaire; Institut Universitaire Européen de la Mer–Université de Bretagne Occidentale Laboratoire des Sciences de l’Environnement MARin: Bretagne, France, 2006; pp. 1–90. [Google Scholar]
  51. R Core Team. R: A Language and Environment for Statistical Computing; R Foundation for Statistical Computing: Vienna, Austria, 2020; pp. 1–3636. [Google Scholar]
  52. Wickham, H. ggplot2: Elegant Graphics for Data Analysis; Springer: New York, NY, USA, 2016; ISBN 978-3-319-24277-4. [Google Scholar]
  53. Kindt, R.; Coe, R. Tree Diversity Analysis. A Manual and Software for Common Statistical Methods for Ecological and Biodiversity Studies; World Agroforestry Centre (ICRAF): Nairobi, Kenya, 2005; ISBN 92-9059-179-X. [Google Scholar]
  54. Oksanen, J.; Blanchet, F.G.; Friendly, M.; Kindt, R.; Legendre, P.; McGlinn, D.; Minchin, P.R.; O’Hara, R.B.; Simpson, G.L.; Solymos, P.; et al. Vegan: Community Ecology Package. R package version 2.5-6. Available online: https://CRAN.R-project.org/package=vegan (accessed on 18 July 2020).
  55. Temgoua, L.F.; Dongmo, W.; Nguimdo, V.; Nguena, C. Diversité ligneuse et stock de carbone des systèmes agroforestiers à base de cacaoyers à l’Est Cameroun: Cas de la forêt d’enseignement et de recherche de l’Université de Dschang. J. Appl. Biosci. 2018, 122, 12274–12286. [Google Scholar] [CrossRef]
  56. Zapfack, L.; Chimi Djomo, C.; Noiha Noumi, V.; Zekeng, J.C.; Meyan-ya Daghela, G.R.; Tabue Mbobda, R. Correlation between associated trees, cocoa trees and carbon stocks potential in cocoa agroforests of Southern Cameroon. Sustain. Environ. 2016, 1, 71–84. [Google Scholar]
  57. Salazar, J.C.S.; Bieng, M.A.N.; Melgarejo, L.M.; Di Rienzo, J.A.; Casanoves, F. First typology of cacao (Theobroma cacao L.) systems in Colombian Amazonia, based on tree species richness, canopy structure and light availability. PLoS ONE 2018, 13, e0191003. [Google Scholar] [CrossRef] [PubMed] [Green Version]
  58. Yao, C.Y.A.; Kpangui, K.B.; Vroh, B.T.A.; Ouattara, D. Pratiques culturales, valeurs d’usage et perception des paysans des espèces compagnes du cacaoyer dans des agroforêts traditionnelles au centre de la Côte d’Ivoire. Rev. d’ethnoécologie 2016, 9, 1–19. [Google Scholar] [CrossRef] [Green Version]
  59. Sonwa, D.; Weise, L.; Chimi Djomo, C.; Kabelong Banoho, L.-P.; Forbi Preasious, F.; Tsopmejio Temfack, I.; Tajeukem Vice, C.; Ntonmen Yonkeu, A.; Tabue Mboba, R.; Nasang, J. Carbon storage potential of cacao agroforestry systems of different age and management intensity. Clim. Dev. 2018, 1–12. [Google Scholar] [CrossRef]
  60. Santhyami, S.; Basukriadi, A.; Patria, M.P.; Abdulhadi, R. The comparison of aboveground C-stock between cocoa-based agroforestry system and cocoa monoculture practice in West Sumatra, Indonesia. Biodiversitas 2018, 19, 472–479. [Google Scholar] [CrossRef]
  61. Häger, A.; Fernández Otárola, M.; Stuhlmacher, M.F.; Acuña Castillo, R.; Contreras Arias, A. Effects of management and landscape composition on the diversity and structure of tree species assemblages in coffee agroforests. Agric. Ecosyst. Environ. 2014, 199, 43–51. [Google Scholar] [CrossRef]
  62. Bisseleua, D.H.B.; Missoup, A.D.; Vidal, S. Biodiversity conservation, ecosystem functioning, and economic incentives under cocoa agroforestry intensification. Conserv. Biol. 2009, 23, 1176–1184. [Google Scholar] [CrossRef]
  63. Omatoko, J.; Nshimba, H.; Bogaert, J.; Lejoly, J.; Shutsha, R.; Shaumba, J.P.; Asimonyio, J.; Ngbolua, K.N. Etudes floristique et structurale des peuplements sur sols argileux à Pericopsis elata et sableux à Julbernardia seretii dans la forêt de plaine d’UMA en République Démocratique du Congo. Int. J. Innov. Appl. Stud. 2015, 13, 452–463. [Google Scholar]
  64. Kambale, J.K.; Asimonyio, J.A.; Shutsha, R.E.; Katembo, E.W.; Tsongo, J.M.; Kavira, P.K. Etudes floristique et structurale des forêts dans le domaine de chasse de Rubi-Télé (Province de Bas-Uélé, République Démocratique du Congo). Int. J. Innov. Sci. Res. 2016, 24, 309–321. [Google Scholar]
  65. Koubouana, F.; Ifo, S.A.; Ndzai, S.F.; Stoffenne, B. Étude comparative d ’ une forêt primaire et d ’ une forêt dégradée au Nord de la République du Congo par référence à la structure des forêts tropicales humides. Rev. Sci. Tech. Forêt Environ. du Bassin du Congo 2018, 11, 11–25. [Google Scholar]
  66. Sonwa, D.; Weise, S.F.; Tchatat, M.; Nkongmeneck, B.; Adesina, A.A.; Ndoye, O.; Gockowski, J. Rôle des agroforêts cacao dans la foresterie paysanne et communautaire au Sud-Cameroun. Réseau For. Pour Développement Rural, document du réseau 2001, 25g, 1–11. [Google Scholar]
  67. Asare, R.; Asare, R.A.; Asante, W.A.; Markussen, B.; RÆbild, A. Influences of shading and fertilization on on-farm yields of cocoa in Ghana. Exp. Agric. 2017, 53, 416–431. [Google Scholar] [CrossRef] [Green Version]
  68. Bohlman, S.A.; Bourg, N.A.; Brinks, J.; Bunyavejchewin, S.; Butt, N.; Chisholm, R.A.; Muller-Landau, H.C.; Rahman, K.A.; Bebber, D.P.; Bin, Y.; et al. Scale-dependent relationships between tree species richness and ecosystem function in forests. J. Ecol. 2013, 101, 1214–1224. [Google Scholar]
  69. Sagar, R.; Singh, J.S. Tree density, basal area and species diversity in a disturbed dry tropical forest of northern India: Implications for conservation. Environ. Conserv. 2006, 33, 256–262. [Google Scholar] [CrossRef]
  70. Blanc, L.; Florès, O.; Molino, J.F.; Gourlet-Fleury, S.; Sabatier, D. Diversité spécifique et regroupement d’espéces arborescentes en Forêt Guyanaise. Rev. For. Fr. 2003, 55, 131–146. [Google Scholar] [CrossRef] [Green Version]
  71. Asase, A.; Ofori-frimpong, K.; Ekpe, P. Impact of cocoa farming on vegetation in an agricultural landscape in Ghana. Afr. J. Ecol. 2009, 48, 338–346. [Google Scholar] [CrossRef]
  72. Middendorp, R.; Vanacker, V.; Lambin, E. Impacts of shaded agroforestry management on carbon sequestration, biodiversity and farmers income in cocoa production landscapes. Landsc. Ecol. 2018, 33, 1953–1974. [Google Scholar] [CrossRef]
  73. Asigbaase, M.; Sjogersten, S.; Lomax, B.; Dawoe, E. Tree diversity and its ecological importance value in organic and conventional cocoa agroforests in Ghana. PLoS ONE 2019, 14, e0210557. [Google Scholar] [CrossRef] [Green Version]
  74. Niether, W.; Armengot, L.; Andres, C.; Schneider, M.; Gerold, G. Shade trees and tree pruning alter throughfall and microclimate in cocoa (Theobroma cacao L.) production systems. Ann. For. Sci. 2018, 75, 38. [Google Scholar] [CrossRef] [Green Version]
  75. Redd-RDC. Mambasa Pays: République Démocratique Du Congo, Rapport D’évaluation du Projet; Banque Africaine de Développement: Kinshasa, Democratic Republic of the Congo, 2010; pp. 1–18. [Google Scholar]
  76. Mason, J.J.; Asare, R.; Cenamo, M.; Soares, P.; Carrero, G.; Murphy, A.J.; Bandari, C. Ghana Cocoa REDD+ Programme: Draft Implementation Report; Ghana cocoa Reed+ programme: Accra, Ghana, 2016; pp. 1–77. [Google Scholar]
  77. Carodenuto, S.; Gromko, D.; Chia, E.L. Zero deforestation cocoa in Cameroon: Private sector engagement to support Reducing Emissions from Deforestation and forest Degradation (REDD+). GIZ-ProPFE Policy Br. 2017, 4, 1–3. [Google Scholar]
  78. Fernandes, C.D.A.F.; Matsumoto, S.N.; Fernandes, V.S. Carbon stock in the development of different designs of biodiverse agroforestry systems. Rev. Bras. Eng. Agrícola Ambient. 2018, 22, 720–725. [Google Scholar] [CrossRef]
  79. Sonwa, D.J.; Weise, S.F.; Bernard, A.; Nkongmeneck, M.T.; Janssens, M.J.J. Profiling carbon storage/stocks of cocoa agroforests in the forest landscape of southern Cameroon. In Agroforestry: Anecdotal to Modern Science; Dagar, J., Tewari, V., Eds.; Springer: Singapore, 2017; pp. 739–752. [Google Scholar]
Figure 1. Localization of cocoa agroforests and inventory plots in the Bengamisa-Yangambi-landscape.
Forests 11 01096 g001
Figure 2. Species rarefaction curve considering the number of individuals sampled and the species richness by cocoa agroforests in four zones of the Bengamisa-Yangambi landscape. Legend: Zone A (18–33 km from Kisangani city), Zone B (34–49 km from Kisangani city), Zone C (50–65 km from Kisangani city) and Zone D (66–81 km from Kisangani city).
Forests 11 01096 g002
Figure 3. Species rarefaction curve considering the number of individuals and specific richness in three models of cocoa agroforests in the Bengamisa-Yangambi landscape. Legend: Model F (agroforests in which companion plants [associated with cocoa trees] are dominated by forest species); Model FP (cocoa agroforests in which companion plants [associated with cocoa trees] are split equally between forest species and oil palms); and Model P (cocoa agroforests in which companion plants [associated with cocoa trees] are dominated by oil palms).
Forests 11 01096 g003
Figure 4. Correlation between species richness and plant density by cocoa agroforests in four zones of the Bengamisa-Yangambi landscape. Correlation between species richness and cocoa suitable associated plants density (a), cocoa suitable associated plants density (b) and all cocoa associated plants density (c). Legend: Zone A corresponds to 18–33 km from Kisangani city, Zone B corresponds to 34–49 km from Kisangani city, Zone C corresponds to 50–65 km from Kisangani city, Zone D corresponds to 66–81 km from Kisangani city and (•) corresponds to a cocoa agroforests.
Forests 11 01096 g004
Table 1. Average species richness and diversity (±standard deviation) of cocoa-associated plants per agroforest in four zones of the Bengamisa-Yangambi landscape.
Indices/IndexZone A (n = 6 Agroforests)Zone B (n = 11 Agroforests)Zone C (n = 3 Agroforests)Zone D (n = 5 Agroforests)Whole Region
(n = 25 Agroforests)
p-Value
Species Richness5.83 (±2.48)12.55 (±8.71)20.67 (±14.29)16 (±6.63)12.6 (±8.9)0.0725
Shannon-Wiener index0.99 (±0.5)1.65 (±1.2)2.14 (±1.51)2.3 (±0.54)1.68 (±1.05)0.1836
Piélou’s equitability0.56 (±0.19)0.6 (±0.37)0.69 (±0.38)0.85 (±0.09)0.65 (±0.3)0.2828
Simpson’s index0.45 (±0.22)0.58 (±0.39)0.68 (±0.45)0.83 (±0.12)0.61 (±0.33)0.2142
Legend: Zone A (18–33 km from Kisangani city), Zone B (34–49 km from Kisangani city), Zone C (50–65 km from Kisangani city), Zone D (66–81 km from Kisangani city) and n = number of cocoa agroforests.
Table 2. Average species richness and diversity (±standard deviation) of cocoa-associated plants in three models of cocoa agroforests in Yangambi-Bengamisa landscape.
IndicesModel F
(n = 10 Agroforests)
Model FP (n = 5 Agroforests)Model P
(n = 10 Agroforests)
Whole region (n = 25 Agroforests)p-Value
Species Richness16.4 (±6.19) b17.4 (±10.92) b6.4 (±6.96) a12.6 (±8.9)0.011
Shannon-Wiener index2.33 (±0.63) b2.29 (±0.78) b0.73 (±0.79) a1.68 (±1.05)0.00011
Piélou’s equitability0.85 (±0.08) b0.83 (±0.11) b0.36 (±0.25) a0.65 (±0.3)0.002
Simpson’s index0.83 (±0.14) b0.81 (±0.16) b0.29 (±0.27) a0.61 (±0.33)8.50 × 10⁻⁶
Legend: Model F (agroforests in which companion plants [associated with cocoa trees] are dominated by forest species); Model FP (cocoa agroforests in which companion plants [associated with cocoa trees] are split equally between forest species and oil palms); and Model P (cocoa agroforests in which companion plants [associated with cocoa trees] are dominated by oil palms). Models not sharing a common letter (a and b) in a row are significantly different at p = 0.05.
Table 3. The five most abundant species by cocoa agroforests in four zones of Bengamisa-Yangambi landscape.
SpeciesLocal NamesMain UsesZone A (n = 6 Agroforests)Zone B (n= 11 Agroforests)Zone C (n = 3 Agroforests)Zone D (n = 5 Agroforests)Whole Region (25 Agroforests)
Elaeis guineensisAdjagaleEdible1101795126366
Musanga cecropioidesKomboTimber--103545
Pycnanthus angolensisGbotugbuTimber-35--35
Ficus exasperataKasageMedicinal324--27
Pseudospondias microcarpaBumeMedicinal-25--25
Maesopsis eminiiNganaMedicinal--12618
Petersianthus macrocarpusAngbecheCaterpillar-17--17
Carapa proceraMbindoMedicinal--14-14
Macaranga monandraAbou chumbugeTimber--13-13
Tetrorchidium didymostemonAboligiTimber---99
Persea americanaSavokaEdible8---8
Bridelia atroviridisBubuCaterpillar---77
Dacryodes edulisAngbokaEdible5---5
Senna siameaNgbangaolayaMedicinal4---4
Total of top five species 13028010083593
Total of all species in study area 155476187178996
Percentage of top five species 83.8758.8253.4846.6359.54
Legend: Zone A (18–33 km from Kisangani city), Zone B (34–49 km from Kisangani city), Zone C (50–65 km from Kisangani city), Zone D (66–81 km from Kisangani city) and n (number of cocoa agroforests in each zone).
Table 4. Abundance of suitable species for cocoa agronomy by cocoa agroforests in four zones in the Bengamisa-Yangambi landscape.
SpeciesZone A (n = 6 Agroforests)Zone B (n = 11 Agroforests)Zone C (n = 3 Agroforests)Zone D (n = 5 Agroforests)Whole Region (n = 25 Agroforests)
Musanga cecropioides210103557
Pycnanthus angolensis0353038
Ficus exasperata3241129
Petersianthus macrocarpus0176427
Zanthoxylum gilletii0128626
Macaranga monandra0213419
Bridelia atroviridis090716
Macaranga spinosa054615
Albizia gummifera0101112
Albizia adianthifolia04228
Alstonia boonei14016
Albizia ferruginea03025
Canarium schweinfurthii00303
Croton haumanianus02002
Ficus elastica01102
Ficus mucuso10012
Ficus wildemaniana01012
Zanthoxylum lemairei01012
Harungana madagascariensis00011
Total of suitable plants71405273272
Total of all plants in study area155476187178996
Percentage of suitable plants4.5229.4127.8141.0127.31
Legend: Zone A (18–33 km from Kisangani city), Zone B (34–49 km from Kisangani city), Zone C (50–65 km from Kisangani city) and Zone D (66–81 km from Kisangani city).
Table 5. Abundance of unsuitable species for cocoa agronomy by cocoa agroforests in four zones of the Bengamisa-Yangambi landscape.
SpeciesZone A (n = 6 Agroforests)Zone B (n = 11 Agroforests)Zone C (n = 3 Agroforests)Zone D (n = 5 Agroforests)Whole Region (n = 25 Agroforests)
Pseudospondias microcarpa1250026
Myrianthus arboreus0160016
Carapa procera0114015
Dacryodes edulis531312
Pterocarpus soyauxii014611
Rauvolfia vomitoria04138
Trichilia gilgiana04228
Vernonia conferta00066
Desplatsia dewevrei04105
Oncoba welwitschii01045
Blighia welwitschii02013
Synsepalum subcordatum00303
Uapaca guineensis10113
Barteria fistulosa01012
Canthium subcordatum00112
Cola lateritia02002
Anonidium mannii00101
Cola marsupium00101
Drypetes gossweileri00101
Gilbertiodendron dewevrei00011
Homalium longistylum01001
Panda oleosa00011
Total of unsuitable plants7653130133
Total of all plants in study area155476187178996
Percentage of unsuitable plants4.5213.6616.5816.8513.35
Legend: Zone A (18–33 km from Kisangani city), Zone B (34–49 km from Kisangani city), Zone C (50–65 km from Kisangani city) and Zone D (66–81 km from Kisangani city).
Table 6. Average number of tree species (±standard deviation) by cocoa agroforests in four zones of Yangambi-Bengamisa landscape according to their main uses.
Main UsesZone A (n = 6 Agroforests)Zone B (n = 11 Agroforests)Zone C (n = 3 Agroforests)Zone D (n = 5 Agroforests)Whole Region (n = 25 Agroforests)p-Value
Edible 85.33 (±32.36)78.91 (±49.48)77.33 (±85.54)30.4 (±39.76)70.56 (±50.4)0.265
Hosts for caterpillars0.67 (±1.63)12 (±14.86)9.33 (±6.11)12.8 (±10.35)9.12 (±11.75)0.07834
Medicinal11.33 (±8.55)38.91 (±37.23)76 (±79.9)25.6 (±17.57)34.08 (±39.38)0.115
Timber1.33 (±2.07) a13.45 (±12.93) a53.33 (±52.2) b52 (±18.76) b23.04 (±28.38)0.002034
Others (minor or no known uses)4.67 (±7.34)29.82 (±42.61)33.33 (±34.02)21.6 (±14.59)22.56 (±31.91)0.2558
Total103.33 (±37.64) a173.09 (±56.23) b249.33 (±13.44) b142.4 (±7.45) ab159.36 (±71.96)0.01405
Legend: Zone A (18–33 km from Kisangani city), Zone B (34–49 km from Kisangani city), Zone C (50–65 km from Kisangani city) and Zone D (66–81 km from Kisangani city). Zones not sharing a common letter (a and b) in a row are significantly different at p = 0.05.
Table 7. Average number of tree species (±standard deviation) in three models of cocoa agroforests in Yangambi-Bengamisa landscape according to their main uses.
Main UsesModel F
(n = 10 Agroforests)
Model FP (n = 5 Agroforests)Model P
(n = 10 Agroforests)
Whole Region (n = 25 Agroforests)p-Value
Edible29.6 (±25.24) a50.4 (±35.05) a121.6 (±24.6) b70.56 (±50.4)0.0001507
Tree-hosting caterpillars15.6 (±13.91) a11.2 (±11.1) ab1.6 (±2.8) b9.12 (±11.75)0.01258
Medicinal48.8 (±31.88) a52.8 (±64.96) ab10 (±12.82) b34.08 (±39.38)0.007181
Timber30.4 (±25.38) ab39.2 (±43.58) a7.6 (±13.79) b23.04 (±28.38)0.04679
Others (minor or no known uses)37.6 (±41.06) a28.8 (±25.2) ab4.4 (±10.41) b22.56 (±31.91)0.0071
Whole region162 (±77.98)182.4 (±113.3)145.2 (±38.69)159.36 (±71.96)0.653
Legend: Model F (agroforests in which companion plants [associated with cocoa trees] are dominated by forest species); Model FP (cocoa agroforests in which companion plants [associated with cocoa trees] are split equally between forest species and oil palms); and Model P (cocoa agroforests in which companion plants [associated with cocoa trees] are dominated by oil palms). Models not sharing a common letter (a and b) in a row are significantly different at p = 0.05.
Table 8. Average density and basal area of cocoa-associated plants (±standard deviation) by cocoa agroforests in four zones of Yangambi-Bengamisa landscape.
Cocoa Agroforest StructureZone A (n = 6 Agroforests)Zone B (n = 11 Agroforests)Zone C (n =3 Agroforests)Zone D (n = 5 Agroforests)Whole Region (n = 25 Agroforests)p-Value
Density of associated plants (n/ha)103.33 (±37.64) a173.09 (±56.23) b249.33 (±113.44) b142.4 (±7.45) ab159.36 (±71.96)0.01405
Basal area of associated plants (m2/ha)5.59 (±5.28)10.95 (±9.4)15.36 (±3.35)8.26 (±4.66)9.65 (±7.52)0.273
Density of (n/ha) of cocoa913.33 (±213.07)959.27 (±154.07)746.67 (±78.93)789.6 (±92.81)888.8 (±168.24)0.107
Basal area of cocoa10.91 (±2.63)9.14 (±1.94)8.2 (±2.04)9.68 (±3.9)9.56 (±2.58)0.453
Density of whole region 1016.67 (±77.94)1132.36(±187.62)996 (±34.64)932 (±77.82)1048.16 (±70.36)0.133
Basal area of whole region 13.13 (±3.04)19.19 (±7.73)17.28 (±2)18.08 (±3.13)17.28 (±5.91)0.248
Legend: Zone A (18–33 km from Kisangani city), Zone B (34–49 km from Kisangani city), Zone C (50–65 km from Kisangani city) and Zone D (66–81 km from Kisangani city). Zones not sharing a common letter (a and b) in a row are significantly different at p = 0.05.
Table 9. Average density and basal area of cocoa-associated plants (±standard deviation) in three models of cocoa agroforests in the Bengamisa-Yangambi landscape.
Cocoa Agroforest StructuresModel F (n = 10 Agroforests)Model FP (n = 5 Agroforests)Model P (n = 10 Agroforests)Whole Region (n = 25 Agroforests)p-Value
Density of associated plants (n/ha)162 (±77.98)182.4 (±113.3)145.2 (±38.69)159.36 (±71.96)0.653
Basal area of associated plants (m2/ha)12.38 (±9.48)9.87 (±4.83)6.81 (±5.77)9.65 (±7.52)0.263
Density (n/ha) cocoa984 (±200.55)824 (±109.8)826 (±114.53)888.8 (±168.24)0.0629
Basal area of cocoa9.6 (±2.97)9.81 (±3.45)9.4 (±1.91)9.56 (±2.58)0.961
Density of whole region 1146 (±217.52)1006.4 (±50.72)971.2 (±103.67)1048.16 (±70.36)0.0525
Basal area of whole region22.99 (±3.86) a16.22 (±2.77) b12.1 (±2.85) b17.28 (±5.91)9.62 × 10⁻⁷
Legend: Model F (Agroforests in which companion plants [associated with cocoa trees] are dominated by forest species); Model FP (cocoa agroforests in which companion plants [associated with cocoa trees] are split equally between forest species and oil palms); and Model P (cocoa agroforests in which companion plants [associated with cocoa trees] are dominated by oil palms). Models not sharing a common letter (a and b) in a row are significantly different at p = 0.05.

