Abstract
The volume, value and distribution of the nontimber forest product (NTFP) trade in the United States are largely unknown. This is due to the lack of systematic, periodic and comprehensive market tracking programs. Trade measurement and mapping would allow market actors and stakeholders to improve market conditions, manage NTFP resources, and increase the sustainable production of raw material. This is especially true in the heavily forested and mountainous regions of the eastern United States. This study hypothesized that the tendency to purchase medicinal NTFPs in this region can be predicted using socioeconomic and environmental variables associated with habitat and trade, and those same variables can be used to build more robust estimates of trade volume. American ginseng (Panax quinquefolius L.) dealers were surveyed (n = 700), because by law they must acquire a license to legally trade in this species, and therefore report a business address. They also record purchase data. Similar data are not reported for other medicinal species sold to the same buyers, known colloquially as ‘off-roots’. Ginseng buyers were queried about trade activity in eleven commonly-harvested and previously untracked medicinal NTFP species in 15 states. Multinomial logistic regression comprised of socioeconomic and environmental predictors tied to business location was used to determine the probability that a respondent purchased off-roots. Significant predictors included location in a particular subregion, population and percentage of employment in related industries. These variables were used in a two-step cluster analysis to group respondents and nonrespondents. Modeled probabilities for off-root purchasing among respondents in each cluster were used to impute average off-root volumes for a proportion of nonrespondents in the same cluster. Respondent observations and nonrespondent estimations were summed and used to map off-root trade volume and value. Model functionality and estimates of the total volume, value and spatial distribution are discussed. The total value of the species surveyed to harvesters was 4.3 million USD. We also find that 77 percent of the trade value and 73 percent of the trade volume were represented by two species: black cohosh (Actaea racemosa L.) and goldenseal (Hydrastis canqdensis L.)
1. Introduction
Nontimber forest products (NTFPs) are defined by Chamberlain et al. as the plants, parts of plants, fungi and other biological material harvested from within and on the edges of natural, manipulated, or disturbed forests [1].
Medicinal plants and fungi have a long history of commerce in the diverse hardwood forests of the eastern United States (US). They are sold into local, regional and global markets, generating hundreds of millions of dollars in retail value [2,3]. In addition to traditional user group value, NTFPs are increasingly viewed as a multifaceted asset for economic development and market-driven conservation in areas with extensive forests and struggling economies [4,5,6].
Despite longstanding interest and trade in NTFPs, there is a dearth of consistent, systematic data on the volume, value and distribution of market activity. This lack of data hamstrings efforts to assess the sustainability of harvests or quantify existing supply [7]. The “black box” of NTFP supply and value, as well as the regional economic impacts of the trade, increase the volatility and risk for producers, traders and communities [8], and diminishes their ability to leverage enterprise in terms of public awareness, and government support and recognition. Lack of comprehensive projections and regional trade mapping also hinders efforts to certify or support cultivation and sustainable harvesting [7].
This study sought to project and map the total annual trade of regularly sold eastern US medicinal NTFP species other than American ginseng (Panax quinquefolius L.)—referred to in the common colloquial form as ‘off-roots’, due to their lower value compared to ginseng. Unlike American ginseng, off-roots are not tracked through a formal market registry and licensure program. In the eastern US deciduous forests, off-root species of note include, for example, goldenseal (Hydrastis canadensis L., also called orangeroot or yellow puccoon) and black cohosh (Actaea racemosa L., also known as black bugbane, black snakeroot or fairy candle). Despite longstanding markets for off-roots such goldenseal and black cohosh, little is known about the annual intensity and distribution of trade. Reasoning varies as to why, but common theories include the informal nature of off-root NTFP trade [7] and a lack of institutional investment and recognition of them [1].
To address the gap in comprehensive and periodic information regarding NTFP trade in the eastern US deciduous forests, a model predicting off-root buying behavior among registered ginseng buyers was tested and used to project the scope and scale of markets for eleven commonly traded species. Another key goal was to address the persistence of low participation and coverage error and nonresponse bias attributed to informal supply-chain actors when using buyer surveys to measure NTFP trade [3,9]. Study hypotheses were that biophysical and socioeconomic variables associated with buyer business location predict the probability of trade in off-root eastern US woodland medicinal NTFPs, and that modeled probabilities can be used to project off-root trade among nonrespondents, thereby allowing researchers to sum observed and estimated volumes to study overall volume, value and distribution.
2. Literature
2.1. Tracking Forest Product Trade
Since the 1930s, the United States Forest Service (USFS) has tracked timber trade through the Timber Product Output (TPO) program, which surveys wood product mills about the species and volume of timber they purchase [10]. This well-established program enjoys high rates of participation (e.g., [11]), and is part of a larger Forest Inventory and Analysis (FIA) program that also monitors standing timber in thousands of research plots across the country. FIA also maintains research units that subdivide states into county groups that form regions largely based on geographic and environmental factors. The TPO provides valuable market data for the industry and researchers via reports and public data tools that present data by research unit, and even down to the county level. By contrast, there is very little systematic tracking and mapping of NTFP output in the US [1,3].
Overviews of the US NTFP sector have relied upon a mixture of data from permit sales, surveys, data from industry organizations, and in a few cases, data collected under legal mandate [3,12]. Each NTFP tracking approach has advantages and disadvantages. In the case of permits and leases, not all products are permitted, and not all public land units offer them. For example, national forests in North Carolina sell permits for harvesting some medicinal plants, but national forests in Indiana do not (USDA Forest Service 2018b; 2018c).
Large, undeveloped tracts of private land have customarily been utilized as a commons for NTFP harvests in many parts of the country [13,14], meaning that substantial activity in NTFP trade is not captured through permit sales. American ginseng is regulated through the 1973 Convention on the Trade in Endangered Species (CITES), and is tracked under its legal mandate, which provides some of the best information about a single NTFP species [15].
The American Herbal Products Association (AHPA), an industry advocacy group, periodically publishes data on native species that are commonly wild harvested [16]. AHPA’s survey constitutes the best data previously available for many of the products in the study. However, its findings are generally derived from dues-paying AHPA members. They do not include harvest origin or product value, and these findings are released infrequently and only to AHPA members. On the other hand, surveys by researchers often take place at the regional or state level, such as Greenfield and Davis’ assessment of the medicinal NTFP market in North Carolina [17]. These studies often are short-term projects, providing only a snapshot of markets that can fluctuate dramatically. Other examples include surveys of mushroom harvests in the Pacific Northwest [18], and the ornamental moss trade in the Northwest and in Appalachia [19].
Systematic data about NTFP trade in the US has the potential to benefit all users and stakeholder groups. Harvesters and buyers often rely upon the people they sell to for market information like prices and demand, which weakens their bargaining power and their ability to plan. This is especially true for new entrants to the market, who usually have no reliable information on prices or demand [8]. Reliable output data in the form of a systematic reporting protocol, or the nontimber product output (NTPO) program, along with monitoring supply in forests, are key components for managing NTFPs at the regional level. The inability to value the industry and describe its economic impact is an obstacle to institutional investment [7]. Finally, reliable output data trusted by all stakeholder groups will provide a much-needed baseline for discussion and collaboration between stakeholder groups working for a sustainable and ethical industry, many of whom disagree on the state of the industry and its future.
While American ginseng generally is considered the most famous medicinal NTFP harvested in eastern U.S. forests, the roots, barks, and vegetative materials of hundreds of other species also are harvested for commercial sale in global markets. For instance, fifty percent of the native medicinal NTFP species with markets in the US are found in the eastern deciduous forests of the Appalachian Mountains [17]. Fourteen of the 22 species in the AHPA survey of wild harvested species are native to the region. A 2015 list produced by the American Botanical Council of the most frequently purchased and valuable roots and herbs consumed by Americans included two off-root species naive to eastern US forests, goldenseal and black cohosh [2], with products derived from the latter valued at over 35 million USD in retail sales.
2.2. Environmental and Socioeconomic Factors
Many of the iconic medicinal woodland NTFP species in the eastern US forests are most often found in mesic hardwood forests [20], primarily in the oak–hickory and maple–beech–birch forest groups as defined by the US Forest Service [21]. Due to slim profit margins for off-root harvesters, trade is most likely with primary buyers who are located close to large expanses of potential habitat. Schmidt et al. [22] found ginseng harvests were more likely to occur in more rural and more heavily forested areas with appropriate habitat. Conversely, buyers in urban areas or rural areas without ideal habitat are less likely to trade directly with harvesters.
Elsewhere in the study region, forested commons became some of the first national forests in the US [13]. Even in places where large landholdings were retained by individuals, there often were expansive absentee land holdings. This type of land ownership results in large tracts of forest, which enabled NTFP use generally, and the commercial harvesting of NTFPs more specifically. Until the twentieth century, the right of citizens to hunt, gather herbs and graze livestock on mast was both customarily and legally protected in much of the study area [14].
Today, although no longer legally recognized, it remains a customary norm to harvest on large, undeveloped land holdings [23] and it is reasonable to postulate that harvesting activity is concentrated in areas with greater amounts of forest in public and corporate ownership.
NTFP harvesting for personal use occurs often and is not limited to any one demographic group [24,25], but economic hardship and commercial NTFP harvesting are thought to generally correlate [4,5,6,9,17,22,26]. Gathering wild plants in forests is hard work with low compensation. Harvesters are usually paid in cash by weight or volume. This trade often occurs in remote or rural areas, which, due to their economic isolation or reliance on a few industries, often are economically distressed.
Within many forest-dependent communities, commercial NTFP harvesters come from the most vulnerable demographic groups: those without steady income, indigenous people, women and recent immigrants [5,27]. Harvesting and selling medicinal herbs and roots are typically part of a safety net or a livelihood strategy that includes other forms of informal economic activity [13,14,28,29]. Schmidt et al. (2019) found that poverty and unemployment were correlated with ginseng harvests. For lower value species, those relationships may even be stronger.
Commercial NTFP harvesting and associated trade that supplements formal material livelihoods is a common market activity in many of the economically stressed, forested regions of the eastern US. The prevalence of associated occupations such as coal mining, forestry and agriculture typically go hand-in-hand with NTFP trade. Often ‘diggers’—or ‘wild crafters’ as harvesters are sometimes referred to—use income or trade from medicinal NTFPs to supplement agricultural income in the off-season, to bolster low-wage or part-time pay in distressed communities where natural resource economies are declining, or to make ends meet when local mines or mills are overstaffed or not operating [26,30]. The dominance of natural resource extraction, especially coal and timber production, in the economies of areas like Central Appalachia have resulted in large tracts of forest that can be utilized for NTFP production [23,31]. By the early twentieth century, harvesting medicinal NTFPs for extra income developed into a cultural tradition and livelihood strategy. More recently, media reports and anecdotal evidence suggest a relationship between the dramatic uptick in substance abuse, and motivations to harvest medicinal NTFPs in the study region [32].
3. Methods
3.1. Buyer Surveys and Instrumentation
Nontimber forest product (NTFP) harvesters in the eastern US forests are numerous, widely dispersed and often difficult to locate. Traditionally, they sell NTFPs to local buyers, who often pay cash. For this reason, the primary buyers of American ginseng were surveyed. These buyers are required by law to purchase a license to legally trade the species. Primary buyers also are required to report information about ginseng transactions, including the location and volume of raw material purchased. State agencies that oversee ginseng programs in their jurisdiction collect market-wide ginseng trade data from buyer reports, and hold and often publish lists of licensed ginseng buyers. Similar tracking programs do not exist for off-root species.
Not all ginseng buyers purchase off-root species, but virtually all off-root buyers with overlapping range purchase ginseng [33]. Thus, the study area included every Appalachian state defined by the Appalachian Regional Commission (ARC) [34] that maintains a ginseng program (exceptions: Mississippi and South Carolina do not permit ginseng harvests). Also included were adjacent eastern US states with ginseng programs, similar forest habitat and a history of commercial trade in off-root, medicinal NTFPs. This included the rest of the Ohio Valley in Indiana and Illinois, and the Ozark and Ouachita Plateaus in Arkansas and Missouri.
Three methods were used to collect and analyze trade data for eleven off-root species over two years (buying years: 2014 and 2015). The main method was a mail survey, but an option to complete the survey over the phone, or by using an online platform, also were offered. The mail survey followed Dalman’s Tailored Design Method [35], and consisted of a presurvey recruitment mailing, a survey with instructions, a reminder postcard and a replacement survey.
The survey included four sections, which addressed four goals: (1) capture market participation and knowledge of market structure among respondents; (2) tally the volume of off-roots (non-ginseng) purchased by respondents; (3) determine the point-of-origin for off-roots purchased by respondents; and (4) measure the first-order value for off-roots purchased by respondents.
The first survey section asked buyers general questions about business structure, such as whether ginseng, off-root NTFPs, or other nonmedicinal NTFPs were purchased, if products were harvested in addition to purchasing from others, the number of employees, and to whom products were sold (product fate). Product fate was divided into five categories (consumers, fellow buyers, manufacturers, retailers and other). The second section asked buyers to report the amount purchased for 10 herbaceous plants typically harvested for roots and one tree harvested for bark, equaling eleven off-root species (Table 1). Off-root plants and trees were selected if they were harvested in eastern US deciduous forests, valuable in the market, commonly harvested, and/or rare (i.e., of conservation interest) [36].

Table 1.
Eleven ‘off-root’ (i.e., not American ginseng) eastern US, deciduous forest medicinal nontimber forest product (NTFP) species included in annual surveys of primary buyer purchasing in 2014 and 2015. The surveyed primary buyer population consisted of registered ginseng buyers in 15 states.
The third section asked buyers to indicate from where their purchased material was harvested. It was important to avoid a level of resolution that could result in respondent identification. County-level analysis was desirable, but there would only be one large buyer at this scale in some cases. To preserve anonymity and make data compatible with the US Forest Service FIA program, the study area was partitioned into FIA research units. FIA units are multicounty areas composed of roughly the same amount and type of forest. Buyers were supplied with a map, as well as a list of FIA research unit regions and counties grouped into these units. They were asked to attribute percentages of their annual volume purchased for each product to FIA unit subdivisions. The final section asked buyers to report average prices paid to harvesters. Average prices were requested to avoid discomfort with respect to proprietary and sensitive payment transactions (after [17]). Interviews were also solicited through the survey, and by using a chain referral method, to help refine the instrument in subsequent years.
A pilot study of primary buyers in Virginia and North Carolina’s ginseng registries was conducted in 2012 for the purchasing year 2011. One hundred and two surveys were successfully delivered, and the response rate was 10 percent. A revised pilot survey was tested in 2014 for the 2013 purchasing year. The second test included six southeastern states with ginseng programs: Alabama, Georgia, Kentucky, North Carolina, Tennessee and Virginia. Forty-five responses were received from 264 surveyed buyers, for a response rate of 17 percent.
Pilot findings were used to develop formal surveys, which were administered in 2015 and 2016 (with respect to the 2014 and 2015 buying years) for ginseng buyers registered in 15 states in the eastern US deciduous forest range. Response rates rose relative to pilot surveys as the program expanded, buyers developed familiarity, and the survey instrument matured.
To maximize analyzable data, 700 unique buyers hailing from 15 states (Alabama, Arkansas, Georgia, Illinois, Indiana, Kentucky, Maryland, Missouri, New York, North Carolina, Ohio, Pennsylvania, Tennessee, Virginia and West Virginia) were surveyed over the course of a two-year study, and their responses were combined.
Two-year means for purchased off-root NTFPs were used for buyers who responded in both rounds of surveying. If they did not purchase a particular off-root product in one year, the amount for the reported year was used. Aggregators, who also purchase volume from fellow primary buyers, were surveyed, but only the amount they purchased directly from the harvesters was included to avoid counting the same material twice. The majority of the material was dry, and the relatively small amount of fresh material was converted to dry pounds at a fresh-to-dry rate of 33 percent. These data were converted to kilograms for publication.
Two methods were used to measure nonresponse bias (after [37]). In the ‘wave’ method, later respondents are assumed to resemble nonrespondents. Significant differences between date of response and variables of interest are considered a red flag. Wave analysis failed to find significant differences between the response date and purchasing tendencies of select species. A second method administered an abbreviated survey to a subsample of nonrespondents (n = 18), which uncovered no large outliers in weight and species purchased between respondents and nonrespondents. Taken together, respondents appear to be similar to nonrespondents. Nonresponse results were additionally evaluated by comparing industry figures and estimates of total market output obtained from aggregator input through open-ended comments and informal input.
3.2. Purchasing Probability
Habitat modeling methods were used to develop a model that predicts whether a respondent purchased in the study year: (1) no woodland medicinal NTFPs; (2) ginseng only; or (3) ginseng and off-root species. In many classic wildlife abundance studies, habitat modeling is used to identify limiting and enabling factors such as climate, site conditions, presence of food and potential nesting sites to develop predictive models that assign probability scores for the species in question across a landscape that is modeled, but not directly observed [38]. A similar approach was used to model the probability of plant poaching in Shenandoah National Park [39]. This study used a habitat modeling approach, and tested whether off-root purchasing can be predicated using environmental and socioeconomic variables associated with a business location. Probabilities in the predictive model derived from respondent data were associated with nonrespondent businesses to project off-root purchasing that has not been directly observed. Respondent values were combined with projected nonrespondent values to estimate the overall total annual trade volume, value and distribution for eleven species.
Multinomial logistic regression was used to model respondent off-root purchasing, because dependent variables were both parametric and nonparametric, as well as nonhierarchical. Model output includes a chi-square (χ2) likelihood ratio test, which indicates the overall significance of predictor variables, and a Nagelkerke R2 that approximates a measure of goodness of fit. Parameter estimates demonstrate the significance and effect of individual variables. Because the study segmented results into FIA research units, it was possible to identify and describe areas of high and low production across the study area. Exploratory factor analysis was used to optimize the number of variables, and collinearity diagnostics were run on hypothesized predictors to reduce spuriousness in the model.
To develop environmental variables for the buyer model, habitat data were determined using the US Forest Service FIA Program’s EVALIDator online tool [40]. Total acreage and percentage of ‘ideal’ forest type group by county were used, which were defined as the forest-types where study species are commonly found: oak–hickory, maple–beech–birch and elm–ash–cottonwood. Total figures and percentages were coded as continuous variables, titled % Ideal Forest.
To reduce model error and control the number of parameters, the many FIA research units were aggregated into regions based on physiographic areas, and one category that represented FIA zones located outside of the range for most species, and/or outside of the study area (Figure 1).
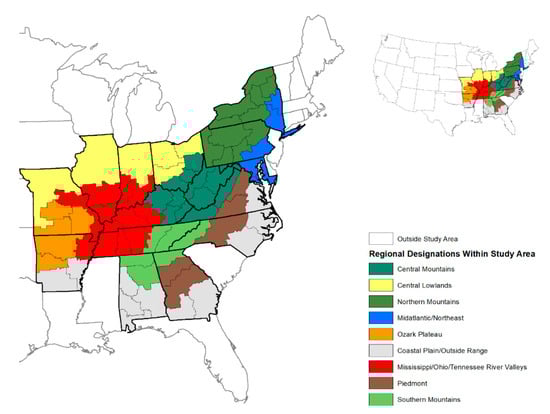
Figure 1.
15-state study area divided into nine subregions (Forest Inventory and Analysis (FIA) Research Unit Regional Categories) based on biophysical and geographic conditions. Each subregion is composed of multiple United States Forest Service (USFS) FIA Units, a group of counties containing roughly the same amount and type of forest.
The Northern Mountains included the Appalachian, Adirondack, Catskill and Pocono areas of New York and Pennsylvania. The flatter and more urbanized area to the east was designated as Mid-Atlantic/Northeast. The flatter, less forested regions north of the Ohio River and west of the Appalachian region were aggregated as the Central Lowlands. The Ozark Plateau in Arkansas and Missouri was treated as a distinct region, as was the rolling areas of mostly deciduous forest along the Ohio, Mississippi and Tennessee Valleys. The Piedmont area of the southeast was also considered as a distinct region. Areas that were either outside the range of ginseng, or outside the study area, were treated as one region. Locations were coded as a categorical variable: FIA Research Unit Regional Categories.
Secondary data sources were used to create the socioeconomic variables included in the buyer model. The US Department of Agriculture’s Economic Research Service publishes the Rural–Urban continuum (RU), which classifies counties based upon their urban population and whether they are part of or adjacent to large metropolitan areas [41]. Data from the most recent RU dataset (2013) were used as an ordinal categorical variable in the model, called Rural–Urban Continuum.
The US Forest Service’s National Woodland Owners Survey (NWOS) provided ownership data for use in the model [42], to include percent corporate forest ownership as well as public versus private forest ownership. These data were summed to create a percentage of each FIA research unit that represents a potential ‘commons’ forest, on the basis that these large tracts of land may be more likely to be harvested. This continuous variable is referred to as % Commons.
Additional socioeconomic data and data on population were obtained from the American Community Survey (ACS), an annual survey conducted by the US Census at the county level [43]. Five-year averages from 2015 were used to code for median income, poverty rate, rate of Supplemental Nutrition Assistance Program (SNAP) benefit receivers (government assistance, sometimes referred to as ‘food stamps’) and a combination of unemployment rate with the percentage of the population out of the workforce. This ‘not working’ statistic is useful because many in the study area have claimed disability, stopped looking for work, or are participating in informal economic activity [44].
The rate of drug overdose per 10,000 deaths was obtained from the County Health Rankings Program developed by the University of Wisconsin’s Public Health Initiative [45]. Data were coded as continuous variables: Population, Median Income, % Below Poverty, % Not Working, % on SNAP Benefits, and Overdose Rate.
Occupational data were gleaned from the ACS, specifically the percentage of the county working population employed in natural resources, forestry, mining and agricultural fields, subsequently coded to create a continuous variable, what is termed here % Relevant Employment.
3.3. Volume, Value, and Distribution
Variables that were significant in the multinomial regression model were used in a two-step cluster analysis to group respondents and nonrespondents into clusters based upon business location and those location scores for the significant variables. The two-step procedure can use categorical and continuous data to determine an optimal number of clusters with high cohesion [46]. Cohesion is quantified by a silhouette measure of cohesion and separation (range = 0.0 to 1.0; ≥0.3 acceptable). The score represents how similar respondents in each cluster are relative to differences compared to other clusters. Clusters were descriptively named using respondent characteristics in each clustering variable. One-way analysis of variance (ANOVA) was used to test for statistically significant differences between clusters.
The mean probability score for off-root purchasing among respondents in each cluster was used to estimate the number of nonrespondents in the respective cluster that are likely to behave the same way. Frequency and median purchase volumes for observed cases (i.e., respondents) in each cluster were used to estimate off-root trade for sampled nonrespondents. To account for variability within each cluster, observed buyers for each off-root species were divided into quartiles. Median purchases in each quartile were then ascribed to a proportional amount of nonrespondents. Respondent and nonrespondent volume and value data were then summed and distributed across FIA research units according to business location. Final estimates were calibrated through comparison with industry data, which was available through American Herbal Products Association (AHPA) reports for some species from 2000–2010 [16].
Procedural steps were as follows:
- Mean cluster probability score × number of nonrespondents in each cluster = number of nonrespondent buyers (NRB)
- NRB × percent of respondent buyers in each cluster who purchased individual species = nonrespondent buyers of individual species (NBIS) M
- Respondent buyers divided into quartiles based on purchasing for each species
- Proportional number of NBIS assigned to each quartile
- NBIS assigned median purchasing amount in associated quartile
- Nonrespondent material + reported purchase from respondents = cluster total (CT)
- Sum of all CTs = nontimber product output (NTPO)
4. Results
Surveys were mailed to 700 valid business addresses for primary buyers who purchased a license from their state to legally trade in ginseng in 2014 and/or 2015 (surveys mailed in 2015 and 2016, respectively). One hundred and eighty were returned for a response rate of 26 percent. Forty primary buyers were not counted because they were deceased, based outside of the US, or were one of multiple buying agents for the same business. Response rates by state ranged from 13 percent in Illinois to 60 percent in Arkansas and Pennsylvania (Table 2).
Table 2.
Responses across 700 surveyed, registered ginseng buyers in 15 eastern states in the US that were surveyed about purchasing of species other than ginseng (i.e., ‘off-roots’) in 2015 and 2016.
The final logistic regression model was significant (p < 0.00), with a Nagelkerke R-square of 0.46 (Table 3). In the likelihood ratio estimates, regional categories from FIA Research Unit Regional Categories were most significant (p = 0.01). Other significant predictors included % Relevant Employment (p = 0.04), and Population (p = 0.05). The first two directly correlated with off-root purchases, whereas Population inversely related to trade.
Table 3.
Multinomial logistic regression predicting the probability that surveyed potential primary buyers of non-ginseng nontimber forest products (NTFPs) purchased off-root NTFP species, only ginseng, or nothing (results bottom of table). The model used biophysical and socioeconomic variables. Likelihood Ratio Estimates are included. FIA Research Unit Regional Categories, Population, and % Relevant Employment were significant predictors of whether buying behavior.
Four buyer types with an acceptable silhouette of cohesion (0.3) were identified in the cluster analysis using significant variables in the buyer model. Descriptive titles included: (1) Core Production; (2) Secondary Production; (3) Low Production; and (4) Outside/Adjacent. The most significant clustering variable was the FIA Research Unit Regional Categories, followed by Population and % Relevant Employment at 1.8 and 0.2, respectively. Across the 180 respondents and 520 nonrespondents, Core Production included 48 respondents (27%) and 172 nonrespondents (33%), Secondary Production included 53 respondents (29%) and 173 nonrespondents (33%), Low Production included 62 respondents (34%) and 112 nonrespondents (22%) and Outside/Adjacent included 16 respondents (8%) and 64 nonrespondents (12%) (Figure 2).
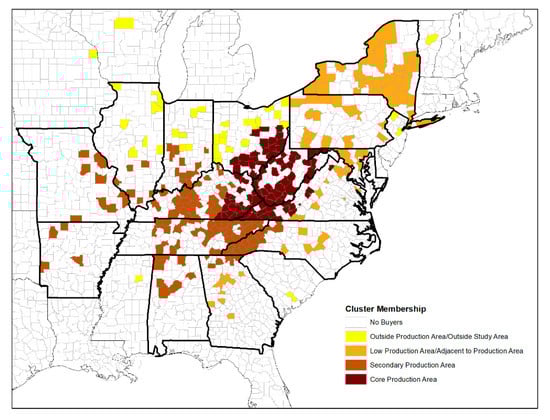
Figure 2.
Map of cluster membership for US counties containing ginseng buyers registered in the study area (states outlined in bold) based on significant variables in a multinomial logistic regression predicting off-root buying behavior. Clusters are classified as the Core Production, Secondary Production, Low Production and Outside/Adjacent. Buyers were also located in five west coast counties, which are also classified as Outside/Adjacent.
The Core Production cluster were entirely based in Central Appalachia. These designated FIA research units had the highest% Relevant Employment (7.4%), and the lowest mean Population (32,874) (Table 4). The Secondary Production cluster included the more rolling forested areas of the Ohio River Valley, southern Appalachia, the Ozarks and some areas of central Appalachia. Secondary Production research units had the second highest% Relevant Employment (2.84%) and the second lowest Population (74,178). While the other variables were not significant in predicting the probability of purchasing other species, the Core Production area had the most potential habitat and the largest percentage of land as a potential habitat. It also had the highest percentage of land as public or corporate-owned forest, the highest overdose rate, lowest workforce participation, highest poverty and highest percentage of Supplemental Nutrition Assistance Program (SNAP) users, with the values decreasing for Secondary, Low and Outside/Adjacent clusters (Table 5).
Table 4.
Registered ginseng dealers licensed in 15 eastern states grouped into four clusters using two-step cluster analysis. The most common (categorical) and mean (continuous) values used to create each cluster are presented.
Table 5.
Mean scores of other biophysical and socioeconomic variables for registered ginseng dealers clustered by the probability of purchasing non-ginseng medicinal plants.
The Core Production cluster had the highest observed frequency of purchase and the highest mean probability score (48%; 62%) (Table 6). The observed frequency of purchasing off-root medicinal NTFPs for respondents in the entire study area was 33%. Thirty-nine percent of the entire sample was predicted to purchase off-roots based on probabilities in the regression model. This pattern followed for both commonly purchased species (goldenseal, black cohosh and bloodroot) and less commonly purchased species (all others).
Table 6.
Purchasing frequency and probability for purchasing off-roots among surveyed ginseng buyers. The first section of the table presents results for observed purchasing by respondents among cluster types (i.e., whether respondents bought ginseng, bought off-roots, or bought nothing during the study period). The second section lists the proportion of all licensed ginseng buyers in the study area (n = 700).
The Core Production area accounted for the majority of total volume of all species except trillium, of which a majority was purchased in the Secondary Production area (Table 7). The Secondary and Core Production areas shared roughly the same amount of reported mayapple output. For the remainder of the species the Core Production area accounted for most of the reported product. Individual buyers also tended to buy in greater volumes in the Core Production area, in some cases by an order of magnitude. While it was a small amount of the total, the Outside/Adjacent area traded in more material than the Low Production cluster.
Table 7.
Mean and total purchased volume of 11 off-root NTFP species reported by respondents in a combined data set from surveys of registered ginseng buyers in 2014 and 2015. Respondents are categorized in clusters determined using predictors of buying behavior based on location.
Projections of annual nontimber product output (NTPO) for the eleven off-root species in the study area using clusters and iterative estimation indicated that overall projected totals for annual output for surveyed species varied in the study (Table 8). The highest projected volume was black cohosh at 120,207 kg, and the lowest was Virginia snakeroot at 91 kg. There were multiple tiers in terms of trade volume. The three most commonly purchased were black cohosh, goldenseal (48,230 kg) and bloodroot (9996 kg). Black cohosh and goldenseal accounted for 73 percent of total trade volume. Less commonly-purchased products accounted for less than 5000 kg each, with several estimated at under 1000 kg in total output. Wild yam and slippery elm had higher volume, but were purchased less frequently (i.e., by fewer buyers).
Table 8.
Projected purchased volume in kilograms of eleven medicinal NTFPs for 15 states in the eastern US. The overall volume is reported, as well as volume values by respondent clusters determined using predictors of buying behavior.
Over 90 percent of total output was estimated to have been traded in the Core Production areas in central Appalachia. A majority of every species purchased was attributed to dealers from that region. Nine percent of the remainder was estimated to be purchased in the Secondary Production cluster, while less than one percent was purchased in the Low and Outside/Adjacent zones. The Secondary Production cluster accounted for between 20 and 50 percent of several individual species: goldenseal, false unicorn, mayapple, trillium, Virginia snakeroot and wild yam. The Outside/Adjacent and Low Production areas accounted for a negligible amount of all the species, with the exception of Virginia snakeroot, of which 32 percent was reportedly purchased in the Outside/Adjacent cluster.
The estimated total value of average prices paid to harvesters in US Dollars (USD) indicate that seven of the products surveyed were valued at less than 10 USD per kilogram (Table 9). The most valuable was Virginia snakeroot, valued at an average of 186.23 USD per kilogram at the time of the survey. The most valuable product was goldenseal, which was the most commonly-purchased species other than ginseng, the second largest in terms of trade volume, and the third most valuable in terms of prices paid to harvesters. The total value to harvesters of goldenseal was estimated to be 2.3 million USD, and the second most valuable product was black cohosh, which had a lower average price of 7.96 USD per kilogram, but due its large volume, trade resulted in an estimated 957,327 USD paid to harvesters. Together, these two species accounted for 77 percent of the total trade value for the species surveyed.
Table 9.
Total mean annual estimated value in United States dollars (USD) paid to off-root harvesters by ginseng buyers licensed in 15 states in the eastern US study area. Total value is based on mean prices reported by buyers, and by total volumetric sales projected for off-root material bought in 2014–2015 in the study area.
False unicorn was next in line. This higher-priced species (158.71 USD per kilogram) accounted for only 2792 kg, but 443,156 USD paid to harvesters. By contrast, the most valuable species, Virginia Snakeroot, accounted for only 17,014 USD in primary trade value due to its low trade volume. The lowest valued product was trillium (4161 USD), of which an estimated 608 kg was sold at 3.11 USD per kilogram.
The total first-order value of the products surveyed was 4.3 million USD. By comparison, the mean annual value of the total US trade in wild ginseng for harvesters is estimated at 27 million USD [47].
5. Discussion
A combination of environmental and socioeconomic variables associated with the business location for licensed ginseng buyers in this study proved to significantly increase the probability of accurately predicting trade activity for eleven off-root NTFP species that are native to the eastern US deciduous forests. The subregion variable based on aggregated FIA research units was the most important predictor variable, followed by relevant employment and population size at the county level. Clustering respondents and nonrespondents by business location and associated significant predictor variables resulted in four groups of licensed ginseng buyers. Each group reflected differences across scales and location of trade, and were labeled accordingly: Core Production, Secondary Production, Low Production and Outside/Adjacent. The Core Production Area was heavily forested with associated forest types, and had the highest poverty rates, overdose rates, SNAP usage and the lowest rate of workforce participation. While these other variables were not significant in predicting a dealer’s likelihood of purchasing off-roots, other studies have demonstrated that there may be a relationship between trade volume and a region’s available habitat and economic distress [22]. However, the purpose of this study is not to explain harvests, but to predict buyer activity by location for the purposes of estimating output.
Identifying geographic variability in the probability of purchasing off-root medicinal NTFPs allowed for greater precision in trade projections. In the case of this study, there was a greater proportion of potential buyers in the Core Production area, due to the lower response rate in that area and a larger pool of licensed ginseng buyers. Kentucky and Ohio, two states with territory in the Core Production area, had two of the lowest response rates (18%), and Kentucky, due to its large number of registered buyers, had 117 nonrespondents, which accounted for an outsized 22% of total nonrespondents.
Attributing volume to nonrespondents according to probabilities observed among respondents within the same cluster addressed variability in response rates, the number of buyers and amount of off-root material projected to have been purchased. As a result, study estimates are higher than they would be for a simple arithmetic projection based on summing reported data. This fine tuning also means that estimates pertaining to the share of market value and the proportion of trade represented by each product will be different when compared to figures taken only from observed data, but the upside is that nonrespondents are not left out.
Most off-root purchases occurred in the Core Production area, which had the lowest mean population and highest dependence on natural resources and agricultural employment. It encompassed central Appalachia, with 75% of buyers coming from coal producing areas. Buyers in these areas were responsible for 90 percent of the total trade volume and a majority of all species surveyed. Around 9% of the total material came from the area of Secondary Production, and 20–40% of some individual species. Less than 1% of the total off-root trade volume came from Low Production and Outside/Adjacent clusters, which had the highest mean population and lowest dependence on natural resources and agricultural employment.
Results show that trade in medicinal off-roots in eastern US deciduous forests is concentrated in terms of both trade volume and trade value for a small number of species. When considering final estimates, around three quarters of the total projected trade volume was comprised of two species, black cohosh and goldenseal. The total projected trade value was roughly 4.3 million USD, which may seem small compared to the 27 million USD paid to ginseng harvesters [47]), but there are a few differences.
Most ginseng is exported from the study region and sold to consumers as a whole root, primarily in Asia. Off-root species also are exported from the region, but typically are processed into value-added products such as tinctures, pills or teas, and sold domestically in addition to foreign markets. Black cohosh, which was one of the most popular native botanical products in North America, has an annual retail value of 35 million USD [2]. Raw material payout according to this study’s projections come close to one million USD, but the total economic value is likely to be much higher.
Conducting the study over two years increased response rates and associated data, and helped insulate from annual variability. Buyers who participated in both years bought 31 percent more black cohosh, 29 percent less goldenseal, and 9 percent less bloodroot. Even greater annual fluctuation has been observed in AHPA data [16]. This can be related to changes in consumer demand, difficulty in sourcing plants, or a tendency of aggregators to stockpile material, which can cause a drop in primary purchasing the following year. Estimates from this study tended to be within the range of AHPA estimates from 2000–2010. Where they diverged from recent trends, it is important to consider the possibility of changes in demand, as well as the possibility that suppliers outside of the ginseng supply chain may be missed (as is likely the case for slippery elm). In the case of bloodroot and blue cohosh, numbers in this study reflect recent changes in demand. While bloodroot purchasing dropped among respondents, both years were higher than recent AHPA numbers, perhaps related to an uptick due to new uses [20]. A declining demand for blue cohosh may be related to recent issues with toxicity [48]. Any short-term survey of the herbal products industry will be a snapshot, and a regularly replicated survey program would be highly beneficial. Wild harvests of American ginseng, which is measured annually, fluctuated by an average of 19 percent per year from 2002–2012 [49].
6. Conclusions
This study evaluated the role of high and low production areas in total nontimber product output (NTPO) in the eastern US. Results indicated that trade is not uniform, but varies in its intensity and importance throughout the region. The conditions influencing harvests suggested by authors such as Bailey [26] and Jones et al. [5] are reflected in the differences between high and low production areas, but there is no single explanation for the volume, value and distribution of off-root NTFP trade in the eastern forests of the US. Instead, a combination of environmental and socioeconomic factors influence trade intensity, a finding also shown by Schmidt et al. [22].
Understanding trade in these regions can help those seeking to support NTFP supply chains and promote sustainable production, and help land managers and policymakers understand the intertwined forces that influence NTFP markets.
While product supply chains and harvesting practices may vary, assessing the likelihood or scale of production among nonrespondents in surveys measuring NTFP activity can be achieved by quantifying the limiting and enabling conditions surrounding the supply chain and the practice of harvesting and selling material. This may work differently based on product pathways to consumers. In this study, the advantage was in knowing the business location for a bounded population of ginseng buyers. In a system where buyers or harvesters are transient (as is the case with mushroom and berry harvests in the Pacific Northwest [18]) or in a direct sale system, such as roadside stands selling ramps or burl wood bowls, creating a sample frame and estimating the size of the potential respondent pool will come with a different set of challenges.
The idea of combining the availability of product by modeling the habitat and integrating characteristics of the supply chain or harvesting community is broadly applicable, as long as other relevant information is obtainable from nonrespondents, either by data collected on a permit form, public listings such as buyer advertising, or any registry or method used to identify potential participants. These estimates have an additional benefit, as they are based on the unique conditions of the trade. Projecting trade among nonrespondents using probabilities was iterative, and only emerged after modeling probabilities in the trade behavior and distribution among respondents. For researchers working with NTFP communities, the conversations required to conduct similar work may result in valuable knowledge sharing. In situations where stakeholder groups are at odds over the state of the industry, results also may be more acceptable as grounded or conservative, thereby leading to a more nuanced understanding of the relationship between people and NTFP species.
Author Contributions
Conceptualization, S.D.K., J.F.M., J.L.C., J.M.D. and R.D.H.; Data curation, S.D.K., J.F.M. and J.L.C.; Formal analysis, S.D.K., J.F.M., J.L.C., J.M.D. and R.D.H.; Funding acquisition, J.F.M. and J.L.C.; Investigation, S.D.K., J.F.M., J.L.C., J.M.D. and R.D.H.; Methodology, S.D.K., J.F.M., J.L.C., J.M.D. and R.D.H.; Project administration, S.D.K., J.F.M. and J.L.C.; Resources, J.F.M., J.L.C., J.M.D. and R.D.H.; Supervision, J.F.M.; Validation, S.D.K., J.F.M., J.L.C., J.M.D. and R.D.H.; Visualization, Steve Kruger, J.F.M.; Writing—original draft, S.D.K., J.F.M., J.L.C., J.M.D. and R.D.H.; Writing—review & editing, S.D.K., J.F.M., J.L.C., J.M.D. and R.D.H. All authors have read and agreed to the published version of the manuscript.
Funding
This project was made possible by funding from the USDA Forest Service.
Acknowledgments
We would like thank the USDA Forest Service for their funding of this project, and the buyers, ginseng coordinators, and other stakeholders who gave their time to be a part of this study.
Conflicts of Interest
The authors declare no conflicts of interest.
Appendix A
Table A1.
Multinomial regression output.
Table A1.
Multinomial regression output.
| Predictor Variable | Buyer Type (Ref: Bought All) | Categories | Wald | SE |
|---|---|---|---|---|
| FIA Research Unit Regional Categories | Bought Nothing | FIA1:FIA8 | 1.46 | 0.978 |
| FIA2:FIA8 | 0.90 | 1.55 | ||
| FIA3:FIA8 | 6.74 | 1.12 | ||
| FIA4:FIA8 | 0.01 | 1.27 | ||
| FIA5:FIA8 | 0.35 | 2.37 | ||
| FIA6:FIA8 | 0.05 | 1.14 | ||
| FIA7:FIA8 | 6.54 | 1.51 | ||
| Bought Ginseng Only | FIA1:FIA8 | 1.27 | 0.77 | |
| FIA2:FIA8 | 1.44 | 1.58 | ||
| FIA3:FIA8 | 1.00 | 0.94 | ||
| FIA4:FIA8 | 1.06 | 1.05 | ||
| FIA5:FIA8 | 0.66 | 1.97 | ||
| FIA6:FIA8 | 1.90 | 0.96 | ||
| FIA7:FIA8 | 0.06 | 1.55 | ||
| Population | Bought Nothing | 1.48 | 1.93 | |
| Bought Ginseng Only | 2.85 | 1.92 | ||
| % Relevant Employment | Bought Nothing | 5.31 | 1.37 | |
| Bought Ginseng Only | 2.15 | 0.87 | ||
| % Commons | Bought Nothing | 0.05 | 0.32 | |
| Bought Ginseng Only | 1.74 | 0.27 | ||
| % Not Working | Bought Nothing | 1.12 | 7.17 | |
| Bought Ginseng Only | 0.28 | 6.13 | ||
| Median Earnings | Bought Nothing | 0.03 | 0.56 | |
| Bought Ginseng Only | 0.44 | 0.54 | ||
| % Below Poverty | Bought Nothing | 0.60 | 0.84 | |
| Bought Ginseng Only | 0.90 | 0.08 | ||
| % on Snap Benefits | Bought Nothing | 0.72 | 7.85 | |
| Bought Ginseng Only | 0.67 | 7.51 | ||
| % Ideal Forest | Bought Nothing | 0.47 | 2.03 | |
| Bought Ginseng Only | 0.51 | 1.78 | ||
| Overdose Rate | Bought Nothing | 1.45 | 0.04 | |
| Bought Ginseng Only | 0.247 | 0.03 | ||
| RU Continuum | Bought Nothing | RU1:RU5 | 0.32 | 1.50 |
| RU2:RU5 | 0.15 | 1.06 | ||
| RU3:RU5 | 0.41 | 1.15 | ||
| RU4:RU5 | 0.03 | 0.90 | ||
| Bought Ginseng Only | RU1:RU5 | 1.78 | 1.50 | |
| RU2:RU5 | 0.02 | 0.86 | ||
| RU3:RU5 | 0.58 | 0.99 | ||
| RU4:RU5 | 1.14 | 0.71 |
References
- Chamberlain, J.; Bush, R.; Hammett, A. Non-timber forest products: The other forest products. For. Prod. J. 1998, 48, 10–19. [Google Scholar]
- Smith, T.; Kawa, K.; Eckl, V.; Morton, C.; Stredney, R. Herbal supplement sales in US increase 7.7% in 2016. HerbalGram 2017, 115, 56–65. [Google Scholar]
- Chamberlain, J.L.; Emery, M.R.; Patel-Weynand, T. Assessment of Nontimber Forest Products in the United States under Changing Conditions; General Technical Report 0160945887; Southern Research Station, USDA Forest Service: Asheville, NC, USA, 2018; p. 268.
- Neumann, R.P.; Hirsch, E. Commercialisation of Non-Timber Forest Products: Review and Analysis of Research; Center for International Forestry Research: Bogor, Indonesia, 2000. [Google Scholar]
- Jones, E.T.; Lynch, K. The relevance of sociocultural variables to nontimber forest product research, policy, and management. In Nontimber Forest Products in the United States; Jones, E.T., McClain, R.J., Weigand, J., Eds.; University Press of Kansas: Lawrence, KS, USA, 2002; pp. 26–51. [Google Scholar]
- Shackleton, C.M.; Pandey, A.K. Positioning non-timber forest products on the development agenda. For. Policy Econ. 2014, 38, 1–7. [Google Scholar] [CrossRef]
- Vaughan, R.C.; Munsell, J.F.; Chamberlain, J.L. Opportunities for enhancing nontimber forest products management in the United States. J. For. 2013, 111, 26–33. [Google Scholar] [CrossRef]
- Gold, M.; Godsey, L.; Josiah, S. Markets and marketing strategies for agroforestry specialty products in North America. In New Vistas in Agroforestry; Springer: New York, NY, USA, 2004; pp. 371–382. [Google Scholar]
- McLain, R.J.; Jones, E.T. Expanding non-timber forest product harvester/buyer participation in Pacific Northwest Forest Policy. J. Sustain. For. 2001, 13, 147–161. [Google Scholar] [CrossRef]
- U.S. Forest Service. Timber Product Output. Forest Inventory and Analysis National Program. Available online: https://www.fia.fs.fed.us/program-features/tpo/ (accessed on 20 October 2019).
- Piva, R.; Cook, G. West Virginia Timber Industry: An Assessment of Timber Product Output and Use, 2007; Bull. Nrs-46; US Department of Agriculture, Forest Service: Newtown Sqaure, PA, USA, 2011; Volume 155, pp. 1–33.
- Alexander, S.J.; Oswalt, S.N.; Emery, M.R. Nontimber Forest Products in the United States: Montreal Process Indicators as Measures of Current Conditions and Sustainability; General Technical Report; USDA Forest Service, Pacific Northwest Research Station: Corvallis, OR, USA, 2011.
- Newfont, K. Blue Ridge Commons: Environmental Activism and Forest History in Western North Carolina; University of Georgia Press: Athens, GA, USA, 2012. [Google Scholar]
- Manget, L. Nature’s Emporium: The Botanical Drug Trade and the Commons Tradition in Southern Appalachia, 1847–1917. Environ. Hist. 2016, 21, 660–687. [Google Scholar] [CrossRef]
- Robbins, C.S. Comparative analysis of management regimes and medicinal plant trade monitoring mechanisms for American ginseng and goldenseal. Conserv. Biol. 2000, 14, 1422–1434. [Google Scholar] [CrossRef]
- Dentali, S.; Zimmermann, M. Tonnage Surveys of Select North American Plants, 2006–2010; American Herbal Products Association: Silver Spring, MD, USA, 2012; p. 24. [Google Scholar]
- Greenfield, J.; Davis, J.M. Collection to Commerce: Western North Carolina Non-Timber Forest Products and Their Markets; North Carolina State University: Raleigh, NC, USA, 2003. [Google Scholar]
- Schlosser, W.E.; Blatner, K.A. The wild edible mushroom industry of Washington, Oregon, and Idaho: A 1992 survey. J. For. 1995, 93, 31–36. [Google Scholar]
- Muir, P.; Norman, K.; Sikes, K. Quantity and value of commercial moss harvest from forests of the Pacific Northwest and Appalachian regions of the US. Bryologist 2006, 109, 197–215. [Google Scholar] [CrossRef]
- Davis, J.; Persons, W.S. Growing and Marketing Ginseng, Goldenseal and other Woodland Medicinals; New Society Publishers: Gabriola Island, BC, Canada, 2014. [Google Scholar]
- U.S. Forest Service. Forest Type Groups of the United States. Available online: https://data.fs.usda.gov/geodata/rastergateway/forest_type/conus_forest_type_group_metadata.php (accessed on 1 October 2019).
- Schmidt, J.P.; Cruse-Sanders, J.; Chamberlain, J.L.; Ferreira, S.; Young, J.A. Explaining harvests of wild-harvested herbaceous plants: American ginseng as a case study. Biol. Conserv. 2019, 231, 139–149. [Google Scholar] [CrossRef]
- Hufford, M. Reclaiming the commons: Narratives of progress, preservation, and ginseng. In Culture, Environment, and Conservation in the Appalachian South; Howell, B.J., Ed.; University of Illinois Press: Champaign, IL, USA, 2002; pp. 100–120. [Google Scholar]
- Robbins, P.; Emery, M.; Rice, J.L. Gathering in Thoreau’s backyard: Nontimber forest product harvesting as practice. Area 2008, 40, 265–277. [Google Scholar] [CrossRef]
- Trozzo, K.; Munsell, J.; Niewolny, K.; Chamberlain, J.L. Forest Food and Medicine in Contemporary Appalachia. Southeast. Geogr. 2019, 59, 52–76. [Google Scholar] [CrossRef][Green Version]
- Bailey, B. Social and Economic Impacts of wild Harvested Products; West Virginia University: Morgantown, WV, USA, 1999. [Google Scholar]
- Emery, M.; Ginger, C.; Chamberlain, J. Migrants, markets, and the transformation of natural resources managment: Galax harvesting in western North Carolina. In Latinos in the New South: Transformations of Place; Smith, H.A., Furuseth, O.J., Eds.; Ashgate Publishing, Ltd.: Burlington, VT, USA, 2006; pp. 69–88. [Google Scholar]
- Hufford, M. Coal River Folklife Project collection (AFC 1999/008); American Folklife Center, Library of Congress: Washington, DC, USA, 1999. [Google Scholar]
- McCoy, T. After the check is gone. The Washington Post, 6 October 2017; 2007. [Google Scholar]
- Price, E.T. Root digging in the Appalachians: The geography of botanical drugs. Geogr. Rev. 1960, 50, 1–20. [Google Scholar] [CrossRef]
- Force, A.L.O.T. Who Owns Appalachia?: Landownership and Its Impact; University Press of Kentucky: Lexington, KY, USA, 2015. [Google Scholar]
- Baublitz, S. Ginseng season returns to the Mountain State Sept. 1, officials say. WVNews, 1 September 2019; 2019. [Google Scholar]
- Kruger, S.D.; Chamberlain, J.L. New Methods for Estimating Non-Timber Forest Product Output: An Appalachian Case Study; U.S. Department of Agriculture, Forest Service, Pacific Northwest Research Station: Portland, OR, USA, 2015; pp. 330–333.
- The Appalachian Region. Available online: https://www.arc.gov/appalachian_region/MapofAppalachia.asp (accessed on 12 November 2019).
- Dillman, D.A.; Smyth, J.D.; Christian, L.M. Internet, Phone, Mail, and Mixed-Mode Surveys: The Tailored Design Method; John Wiley & Sons: Hoboken, NJ, USA, 2014. [Google Scholar]
- Cunningham, A.B. Applied Ethnobotany: People, Wild Plant Use and Conservation; Earthscan Publications Ltd.: Londo/Sterling, VA, USA, 2006. [Google Scholar]
- Rogelberg, S.G.; Stanton, J.M. Introduction. Understanding and Dealing With Organizational Survey Nonresponse. Organ. Res. Methods 2007, 10, 195–209. [Google Scholar] [CrossRef]
- MacKenzie, D.I.; Nichols, J.D.; Royle, J.A.; Pollock, K.H.; Bailey, L.; Hines, J.E. Occupancy Estimation and Modeling: Inferring Patterns and Dynamics of Species Occurrence; Elsevier: London, UK, 2017; p. 698. [Google Scholar]
- Young, J.A.; van Manen, F.T.; Thatcher, C.A. Geographic profiling to assess the risk of rare plant poaching in natural areas. Environ. Manag. 2011, 48, 577–587. [Google Scholar] [CrossRef]
- USDA Forest Service. EVALIDator Tool. Forest Inventory and Analysis Program. Available online: https://apps.fs.usda.gov/Evalidator/evalidator.jsp (accessed on 28 October 2019).
- Rural-Urban Continuum. Available online: https://www.ers.usda.gov/data-products/rural-urban-continuum-codes.aspx (accessed on 1 November 2019).
- National Woodland Owners Survey. Forest Inventory and Analysis Program. Available online: https://www.fia.fs.fed.us/nwos/results/ (accessed on 1 November 2019).
- American Community Survey. Five Year Employment and Poverty Statistics. 2011–2015. Available online: http://factfinder2.census.gov (accessed on 1 November 2019).
- Bradley, D.; Herzenberg, S.A.; Wial, H. An Assessment of Labor Force Participation Rates and Unemployment in Appalachia; Appalachian Regional Commission: Harrisburg, PA, USA, 2001; p. 78. [Google Scholar]
- Drug Overdoses. County Health Rankings and Roadmap. Available online: http://www.countyhealthrankings.org/ (accessed on 1 November 2019).
- Bacher, J.; Wenzig, K.; Vogler, M. SPSS TwoStep Cluster-a First Evaluation; Social Science Open Access Repository, Leibniz Institute for the Social Sciences: Leibniz, Germany, 2004. [Google Scholar]
- Chamberlain, J.; Prisley, S.; McGuffin, M. Understanding the Relationships Between American Ginseng Harvest and Hardwood Forests Inventory and Timber Harvest to Improve Co-Management of the Forests of Eastern United States. J. Sustain. For. 2013, 32, 605–624. [Google Scholar] [CrossRef]
- Datta, S.; Mahdi, F.; Ali, Z.; Jekabsons, M.B.; Khan, I.A.; Nagle, D.G.; Zhou, Y.-D. Toxins in botanical dietary supplements: Blue cohosh components disrupt cellular respiration and mitochondrial membrane potential. J. Nat. Prod. 2013, 77, 111–117. [Google Scholar] [CrossRef] [PubMed]
- Chamberlain, J.; Teets, A.; Kruger, S. Nontimber forest products in the United States: An analysis for the 2015 National Sustainable Forest Report. In e-General Technical Reports SRS-229; US Department of Agriculture, Forest Service, Southern Research Station: Asheville, NC, USA, 2018; Volume 229, 36p. [Google Scholar]
© 2020 by the authors. Licensee MDPI, Basel, Switzerland. This article is an open access article distributed under the terms and conditions of the Creative Commons Attribution (CC BY) license (http://creativecommons.org/licenses/by/4.0/).