Article

Competition, Climate, and Size Effects on Radial Growth in an Old-Growth Hemlock Forest

1
The Jones Center at Ichauway, Newton, GA 39870, USA
2
Department of Biological Sciences, Wright State University, Dayton, OH 45435, USA
3
NOAA climate prediction center/Innovim, College Park, MD 20740, USA
*
Author to whom correspondence should be addressed.
Forests 2020, 11(1), 52; https://doi.org/10.3390/f11010052
Submission received: 22 November 2019 / Revised: 20 December 2019 / Accepted: 28 December 2019 / Published: 31 December 2019
(This article belongs to the Special Issue Radial Tree-Ring Traits Variation in Relation to Climate Factors)

Abstract

:
Research Highlights: We applied neighborhood and dendro-ecological methods in a stand with a 33-year record of forest dynamics, finding that growth will decrease for several species under predicted climate trends. Background and Objectives: Conventional tree-ring analysis removes the influence of competition and size on growth, precluding assessment of the relative influence of these factors. An old-growth eastern hemlock forest in east–central New York was mapped in 1978 and was measured at eight-year intervals since then. Our objective was to use these data to examine the influence of climate, neighborhood, and tree size on radial growth. Materials and Methods: We evaluated an array of climatic indices to find which ones had the strongest influence on radial growth from increment cores of eastern hemlock (Tsuga canadensis L.), yellow birch (Betula alleghaniensis Britton), and sugar maple (Acer saccharum Marsh.). We used the strongest climatic indices in combination with neighborhood and target-tree size information to create growth models for the three tree species. Results: Size accounted for 2% to 21% of observed growth; the shade-tolerant sugar maple and eastern hemlock grew fastest when large, but the mid-tolerant yellow birch grew fastest when small. Competition accounted for 9% to 21% of growth; conifers had a weaker competitive effect than deciduous trees, and eastern hemlock was less sensitive to competition than sugar maple and yellow birch. Climate accounted for only 2% of growth variation; eastern hemlock showed a positive response to warming climate trends, but yellow birch and sugar maple showed negative responses. Conclusions: Predicted climate trends are likely to result in decreased growth of sugar maple and yellow birch, and the sensitivity of these species to competition suggests the effect will be exacerbated when they grow in crowded conditions.

1. Introduction

Old-growth forests are often characterized by intense competition for growing space among trees [1]. Competition may be high in old-growth forests because available space may become utilized more completely than in younger stands where trees may not have grown large enough to exploit all available resources [2,3]. Competition may suppress or alter climatic response [4,5], creating the potential for a different relationship between competition and climate in old-growth forests than in early and mid-successional forests.
Studies that simultaneously address competitive interactions and climate response in a range of forest types showed that competition from neighboring trees exerts stronger effects than climate on tree growth [6,7]. The relative strength of competition and climate may be especially pronounced in old growth stands. Furthermore, the nature of the interaction between competition and climate may depend on whether or not the factors are consumed (e.g., soil water vs. air temperature, heat). As an example, European beech (Fagus sylvatica L.) is sensitive to water balance when under strong competition, but it is most sensitive to temperature at low competition [8]. Several studies indicated that climate sensitivity is low under strong competition [4,5]. Nevertheless, utilization of consumable resources such as soil water may be high under conditions of high competition and, therefore, higher sensitivity to annual precipitation might be anticipated [9]. Indeed, competition was seen to amplify drought stress under a wide range of forest types [10,11].

Response to Competition and Climate in Northern Hardwood Forests

Eastern hemlock (Tsuga canadensis L.), yellow birch (Betula alleghaniensis Britton), and sugar maple (Acer saccharum Marsh.) are iconic species of mixed northern hardwood forest. Sugar maple and hemlock are characterized as highly shade-tolerant [12] and, by implication, as tolerant of competition. Yellow birch, in contrast, is classified as intermediate in shade tolerance and, thus, potentially more vulnerable to competition for light [12,13]. Consistent with this shade-tolerance ranking, the eastern United States of America (USA) studies of Canham et al. [14] indicated that yellow birch was highly sensitive to competition, that sugar maple was also sensitive but not as much as birch, and that hemlock was still less sensitive. The ability of these species to compete against other species for resources (i.e., their competitive effects as opposed to competitive response), however, is less well known despite being an important element of competition [15]. Growth rates of trees are further dependent upon size, in a species-specific manner. For hemlock, most rapid growth occurs for adult trees roughly 60 cm in diameter at breast height (dbh), there is little or no relationship between yellow birch size and growth rate, and sugar maple growth increases asymptotically with size [14].
The responses of these species to local variation in climate may be contingent upon location within their range. Growth of hemlock, a needle-leaved evergreen, is positively related to higher temperatures and precipitation across eastern USA [14]; however, in its northern range, hemlock grows more slowly at higher summer temperatures [16]. Yellow birch growth decreases in warmer locations within its distribution, particularly during winter thaws [14,17]. Sugar maple grows slightly faster in locations with mean annual temperatures >10 °C than in cooler locations, and also grows more slowly in locations with >1400 mm of annual precipitation than in drier locations [14]. In upper Midwest USA, sugar maple is more sensitive to temperature than to precipitation [18]. Sugar maple stress in Vermont is correlated with increased temperatures in April and October, and its growth in Vermont is positively correlated with increased annual precipitation [19], in contrast to the findings of Canham et al. [14]. In summary, in eastern USA, hemlock growth increases with higher temperature and precipitation, yellow birch growth decreases with increased temperature, and sugar maple growth may increase or decrease in response to elevated temperature and precipitation.
Mixed northern hardwood forest in northeastern USA is expected to come under increasing stress from human-induced climate change [20,21]. In the past three decades, the rate of surface air warming increased at 0.25 °C per decade. Projected increases for mean temperatures in northeastern USA are 2.1–2.9 °C by 2034–2064, and 2.9–5 °C by 2099, with corresponding increases in precipitation of 4.7–9.5% and 6.4–11.4%, respectively [22]. Higher average air temperatures, more days over 32 °C (90 °F), more precipitation falling as rain, and reduced snowpack are expected [23], which may result in decreased suitable habitat for some northern hardwood species [24].
To address these uncertainties, we studied an old-growth hemlock-northern hardwood stand in east–central New York State [25]. Our goals were (1) to understand the relative strength of growth limitation by competition, climate, and size in an old-growth stand, (2) to compare competitive response and competitive effect in the tree species, and (3) to identify limiting climate factors for growth. Our predictions were, firstly, that, in this old growth stand with very high site occupancy, limitation due to temperature, a non-consumed resource, would be weaker than the limitation due to precipitation, a consumed resource. Secondly, we predicted that growth of the shade-intolerant species yellow birch would be more strongly controlled by competition than growth of the other more shade-tolerant species.

2. Materials and Methods

The study took place at the Huyck Preserve and Biological Field Station on the Helderberg plateau, elevation ca. 460 m, in east–central New York State [26]. An old-growth hemlock stand is bordered on two sides by a pond. The soils belong to the Nunda series and are classified as very stony silt loams with 3–15% slopes; they consist of a silty mantle over loamy glacial till derived from calcareous shale and siltstone. There may be a seasonally high water table at 45–60 cm below the surface [27]. Surficial bedrock geology of this area of the Helderberg Plateau is limestone from the Lower Devonian period. Although unsuitable for cultivated crops because of stones on the surface, the soil has moderate potential productivity for sugar maple, a species which thrives on soils with high base cation status [28].
The hemlock stand was cleared, likely to obtain bark for tanning hides, around 1800 but was little disturbed since then and regenerated well [29]. Basal area, at >50 m2∙ha−1, is extremely high. An assessment in summer 2015 using vertical sighting tubes (GRS Densitometer, Arcata CA) at 5-m spacing revealed a canopy cover of 96%. The stand is dominated by hemlock (two-thirds of basal area), and there are minor components of northern red oak (Quercus rubra L.), red maple (A. rubrum L.), white ash (Fraxinus americana L.), beech (Fagus grandifolia Ehrh.), and bigtooth aspen (Populus grandidentata Mich.). Canopy composition remained highly stable over 40 years; the principal changes are increased hemlock basal area and decreased stem density, and loss of beech due to beech bark disease [30].
A 2.02-ha portion of the stand was stem-mapped in 1978, and four censuses were conducted since then at eight-year intervals [29]. We used census data to select 60–80 individuals each of hemlock, sugar maple, and yellow birch for sampling. We stratified the individuals sampled across the range of size (dbh) and competitive environment to provide balanced data to improve subsequent estimation of size and competition parameters. Hegyi’s competition index was estimated using the R package siplab [31]. In June 2014, increment cores were taken from the selected trees, and some additional cores were taken in 2015. The dbh of a target tree was measured; then, two cores at right angles to each other were extracted at breast height. Cores were polished with sandpaper as fine as 400 grit (hemlock) or 600 grit (hardwoods); then, ring boundaries of the latewood-to-earlywood transition were measured with either a scanner-based (V600, Seiko Epson, Suwa Japan; CooRecorder-CDendro, Cybis Elektronik, Saltsjöbaden Sweden) or microscope-based system (UniSlide, Velmex, Inc., Bloomfield New York USA). Cross-dating was done against species-specific sequences from the International Tree-Ring Databank and other sources (Neil Pederson, unpublished data) using cross-correlation functions [32]. A minimum age representing the number of annual rings between bark and the earliest ring present (not all cores included the pith) at breast height was determined for each tree; minimum age was compared among species with analysis of variance.
Weather for the study site from 1978–2011 was extracted from gridded climate data [33,34]. Climate indices were created from temperature and precipitation variables following Oswald et al. [19]. Indices included annual precipitation and mean annual temperature; mean spring (March–May) maximum temperature, sum of spring precipitation, mean summer (June–August) maximum temperature, sum of summer precipitation, spring warm-up (number of March and April days with three-day mean temperature >5 °C), annual three-day maximum temperature, number of days per year with maximum temperature >31 °C, growing degree-days between 1 March and 30 September based on a 4 °C threshold, and thaws (number of days in January and February with mean temperature >0 °C). Linear regression was used to identify temporal trends of climate factors over the 1978–2011 study period.
Prior to the nonlinear likelihood analyses, we identified the climate indicators with strongest effects on each species with linear methods. A ring width index was created for each species by de-trending ring width sequences with cubic splines then combining into a single chronology [32,35]. We did multiple linear regressions predicting ring width index as a function of the suite of climate indicators. We calculated the contribution each climate index made to the coefficient of determination (r2) because multiple linear regression is sensitive to the order in which variables appear in the equation (LMG algorithm [36]). This metric, the relative importance (RI), was expressed on the same scale as r2; thus, the sum of RI of all climate indices is equal to r2. The LMG algorithm carries out multiple linear regressions with all possible orderings and combinations of predictor values, and it provides mean values of correlation coefficients at all model sizes. Coefficients may be either positive or negative in sign depending on model size. Climate indices with high RI were selected for intensive exploration with non-linear likelihood models.

Statistical Modeling

Likelihood models of untransformed ring widths were made from neighborhood competition, climate, and size effect models [7,37]. The general equation form was radial growth = prg × ce × se × ne, where prg = potential radial growth (mm∙year−1), ce is the climate effect, se is the size effect, and ne is the neighborhood (i.e., competition) effect. Each effect takes values from 0 to 1. The climate effect is the product of two Gaussian curves, each a function of a climate index.
c e   =   e x p [ 1 2 ( I 1 X 1 0 X 1 b ) 2 ]   ×   e x p [ 1 2 ( I 2 X 2 0 X 2 b ) 2 ] ,
where I1 are I2 are climate indices, X10 and X20 are values of I1 and I2 at which potential growth is maximum, and X1b and X2b control the breadth of functions. The size effect is a log–normal function,
s e   =   e x p [ 1 2 ( l n ( d b h / X 3 0 ) X 3 b ) 2 ] ,
where X30 is target tree dbh at which maximum growth occurs, and X3b controls the breadth of the function. The neighbor effect n e   =   e E   ×   n c i z is a Weibull function of the neighbor competition index (nci), where the parameters E and z reflect the rate at which crowding from competition decreases growth. The neighborhood competition index is defined as
n c i =   i = 1 g λ g j = 1 n d b h i j 2 e γ d i s t i j β
where λg expresses the competitive effect of the neighboring functional group (evergreen vs. deciduous) on a target tree, and γ and β express the rate of decline of competitive effects with distance from the neighboring tree. Neighborhood size was defined as the area within 10 m of the target tree, a distance which is sufficient for capturing most competitive interactions among trees in northern hardwood forest [14,37]. A dataset of neighboring trees for competition analysis was prepared by using dbh measured in a given year to represent the four years preceding and following that year. Neighborhoods were recalculated at eight-year intervals, and any tree death was assumed to have occurred at the mid-point of the eight-year census period.
We evaluated support in the data for size, climate, and neighborhood effects by testing non-linear models incorporating effects alone and in two- and three-way combinations. Models were evaluated in a sequence starting with a model with no independent variables and building to a model with size, competition, and climate. The normal error distribution was used for hemlock and yellow birch, and the gamma error distribution was used for sugar maple because it provided more stable and centrally distributed parameter estimates. Two climate indices were evaluated for each species: the climate index with the highest importance value, and an additional index with importance value >0.05. Akaike’s information criterion (AIC), corrected for small sample size, was used to select the most parsimonious model for each species [38]. The strength of support for a model was based on Δi, the difference between its AICc and that of the best model. A large AICc is indicative of a poor model; a model with Δi < 2 has strong support from the data, and a model with Δi > 10 has vanishingly small support. The adjusted R2 reports the variance explained by the statistical model relative to the simple mean of the dependent variable.

3. Results

Average minimum tree age was oldest in hemlock and youngest in sugar maple (127 and 117 years, respectively); a 288-year-old hemlock was the oldest individual. Mean hemlock age was significantly greater than mean sugar maple age (p < 0.06, α = 0.1). Average breast-height diameter was 38 cm for hemlock, 26 cm for yellow birch, and 32 cm for sugar maple.

3.1. Climate Trends

Over the analysis period of 1978–2011, mean degree-days was 1224 (standard deviation 206), mean spring warm-up was 22.5 (6.1) days, and mean winter temperature was −5.2 (1.7) °C (Table 1). There were significantly increasing trends of 101 degree-days per decade (p < 0.01), 1.8 days per decade spring warm-up (p < 0.1), 0.4 degrees per decade spring temperature (p < 0.1), 0.3 degrees per decade maximum summer temperature (p < 0.1), and 41 mm per decade summer precipitation (p < 0.01). Other climate factors did not display significant time-related trends over the 1978–2011 period.

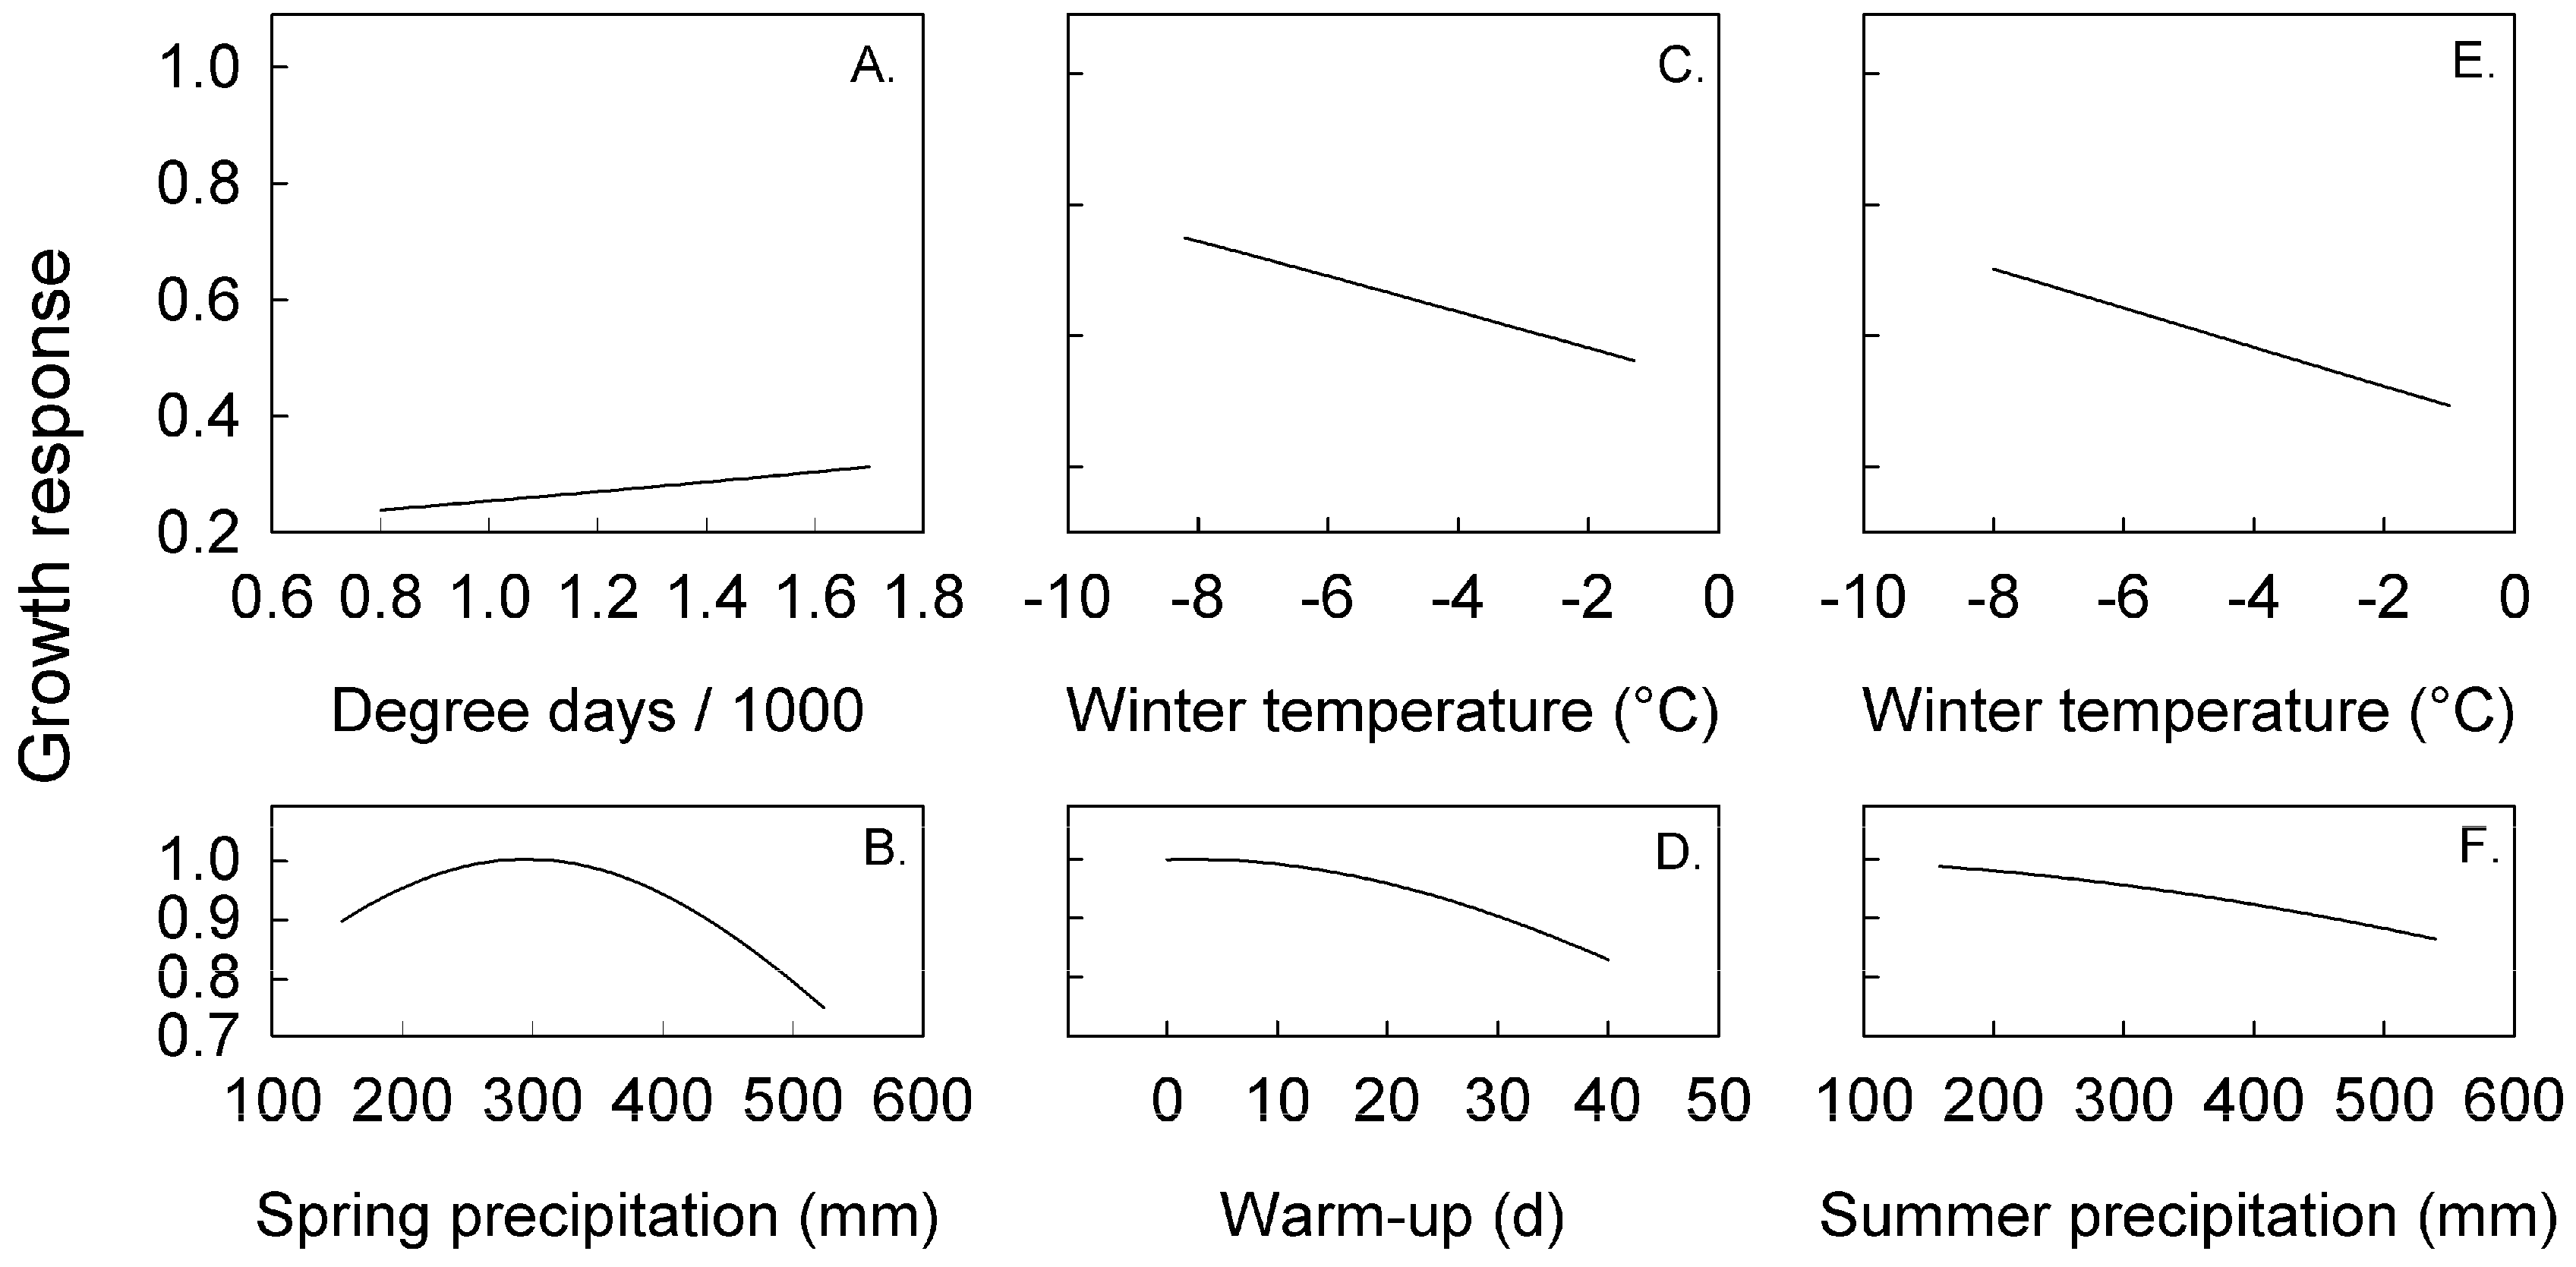
3.2. Climate Effects on Radial Growth Analyzed with Linear and Likelihood Models

Conventional climate analyses on de-trended ring widths were used to identify the strongest climatic influences on growth; then, non-linear likelihood analyses on raw ring width were used to determine climatic effect relative to competition and size. Growing degree-days had the strongest correlation with de-trended hemlock growth (RI = 0.133). Other factors that explained at least 5% of growth were mean winter temperature (positive and negative correlations, RI = 0.052), spring precipitation (negative correlation, RI = 0.055), and mean spring temperatures (positive and negative correlations, RI = 0.055). Likelihood analysis indicated that the best nonlinear growth model incorporated climate, competition, and size (adjusted R2 = 0.32; Table 2). The climate component of the non-linear model confirmed that hemlock growth increased monotonically with increased degree-days (Figure 1A). Spring precipitation was included in the non-linear model, and the parameters indicated that growth increased with spring precipitation to a maximum of 295 mm (support interval 260–311 mm), then declined at higher levels. The spring precipitation value at which growth is maximum was close to the 1978–2011 average of 301 mm (Figure 1B, Table 1 and Table 3). The non-linear likelihood analysis indicated that climate explained 2% of variation in all three species (Table 4) over the period from 1978-2011.
Yellow birch de-trended ring width was strongly related to the number of warm spring days (negative correlation, RI = 0.124; Table 1). Other climatic factors with RI ≥ 0.05 were winter temperature (negative correlation, RI = 0.058) and spring temperature (positive correlation, RI = 0.062). Likelihood analysis indicated that the best model incorporated effects of competition and size, as well as climate (adjusted R2 = 0.24; Table 2). Likelihood analysis confirmed the decrease in growth with warm spring days, because the estimated number of warm spring days at which growth was maximum was zero (Table 3). The additional factor in the non-linear climate analysis, winter temperature, showed that growth declined with increasing winter temperatures, because the −22.6 °C estimated mean winter temperature for maximum growth was far below the −5.2 °C mean winter temperature for the region (Table 1, Table 2 and Table 3, Figure 1C,D).
The linear analysis indicated that de-trended sugar maple ring width was influenced most strongly by summer precipitation (negative correlation, RI = 0.138; Table 1). Other factors with RI ≥ 0.05 were winter temperature (negative correlation, RI = 0.061), maximum three-day temperature (negative correlation, RI = 0.060), and degree-day (negative correlation, RI = 0.090). Likelihood analysis indicated the best model included competition and size in addition to climate effects (adjusted R2 = 0.25; Table 2). The climate component of the non-linear models confirmed the decrease in growth with increased summer precipitation (estimate of summer precipitation at which maximum growth occurred was zero; Table 3, Figure 1F). The other climate factor in the non-linear model, winter temperature, showed growth decreasing steadily at warmer winter temperatures at a rate similar to yellow birch (Table 1, Table 2 and Table 3, Figure 1E).

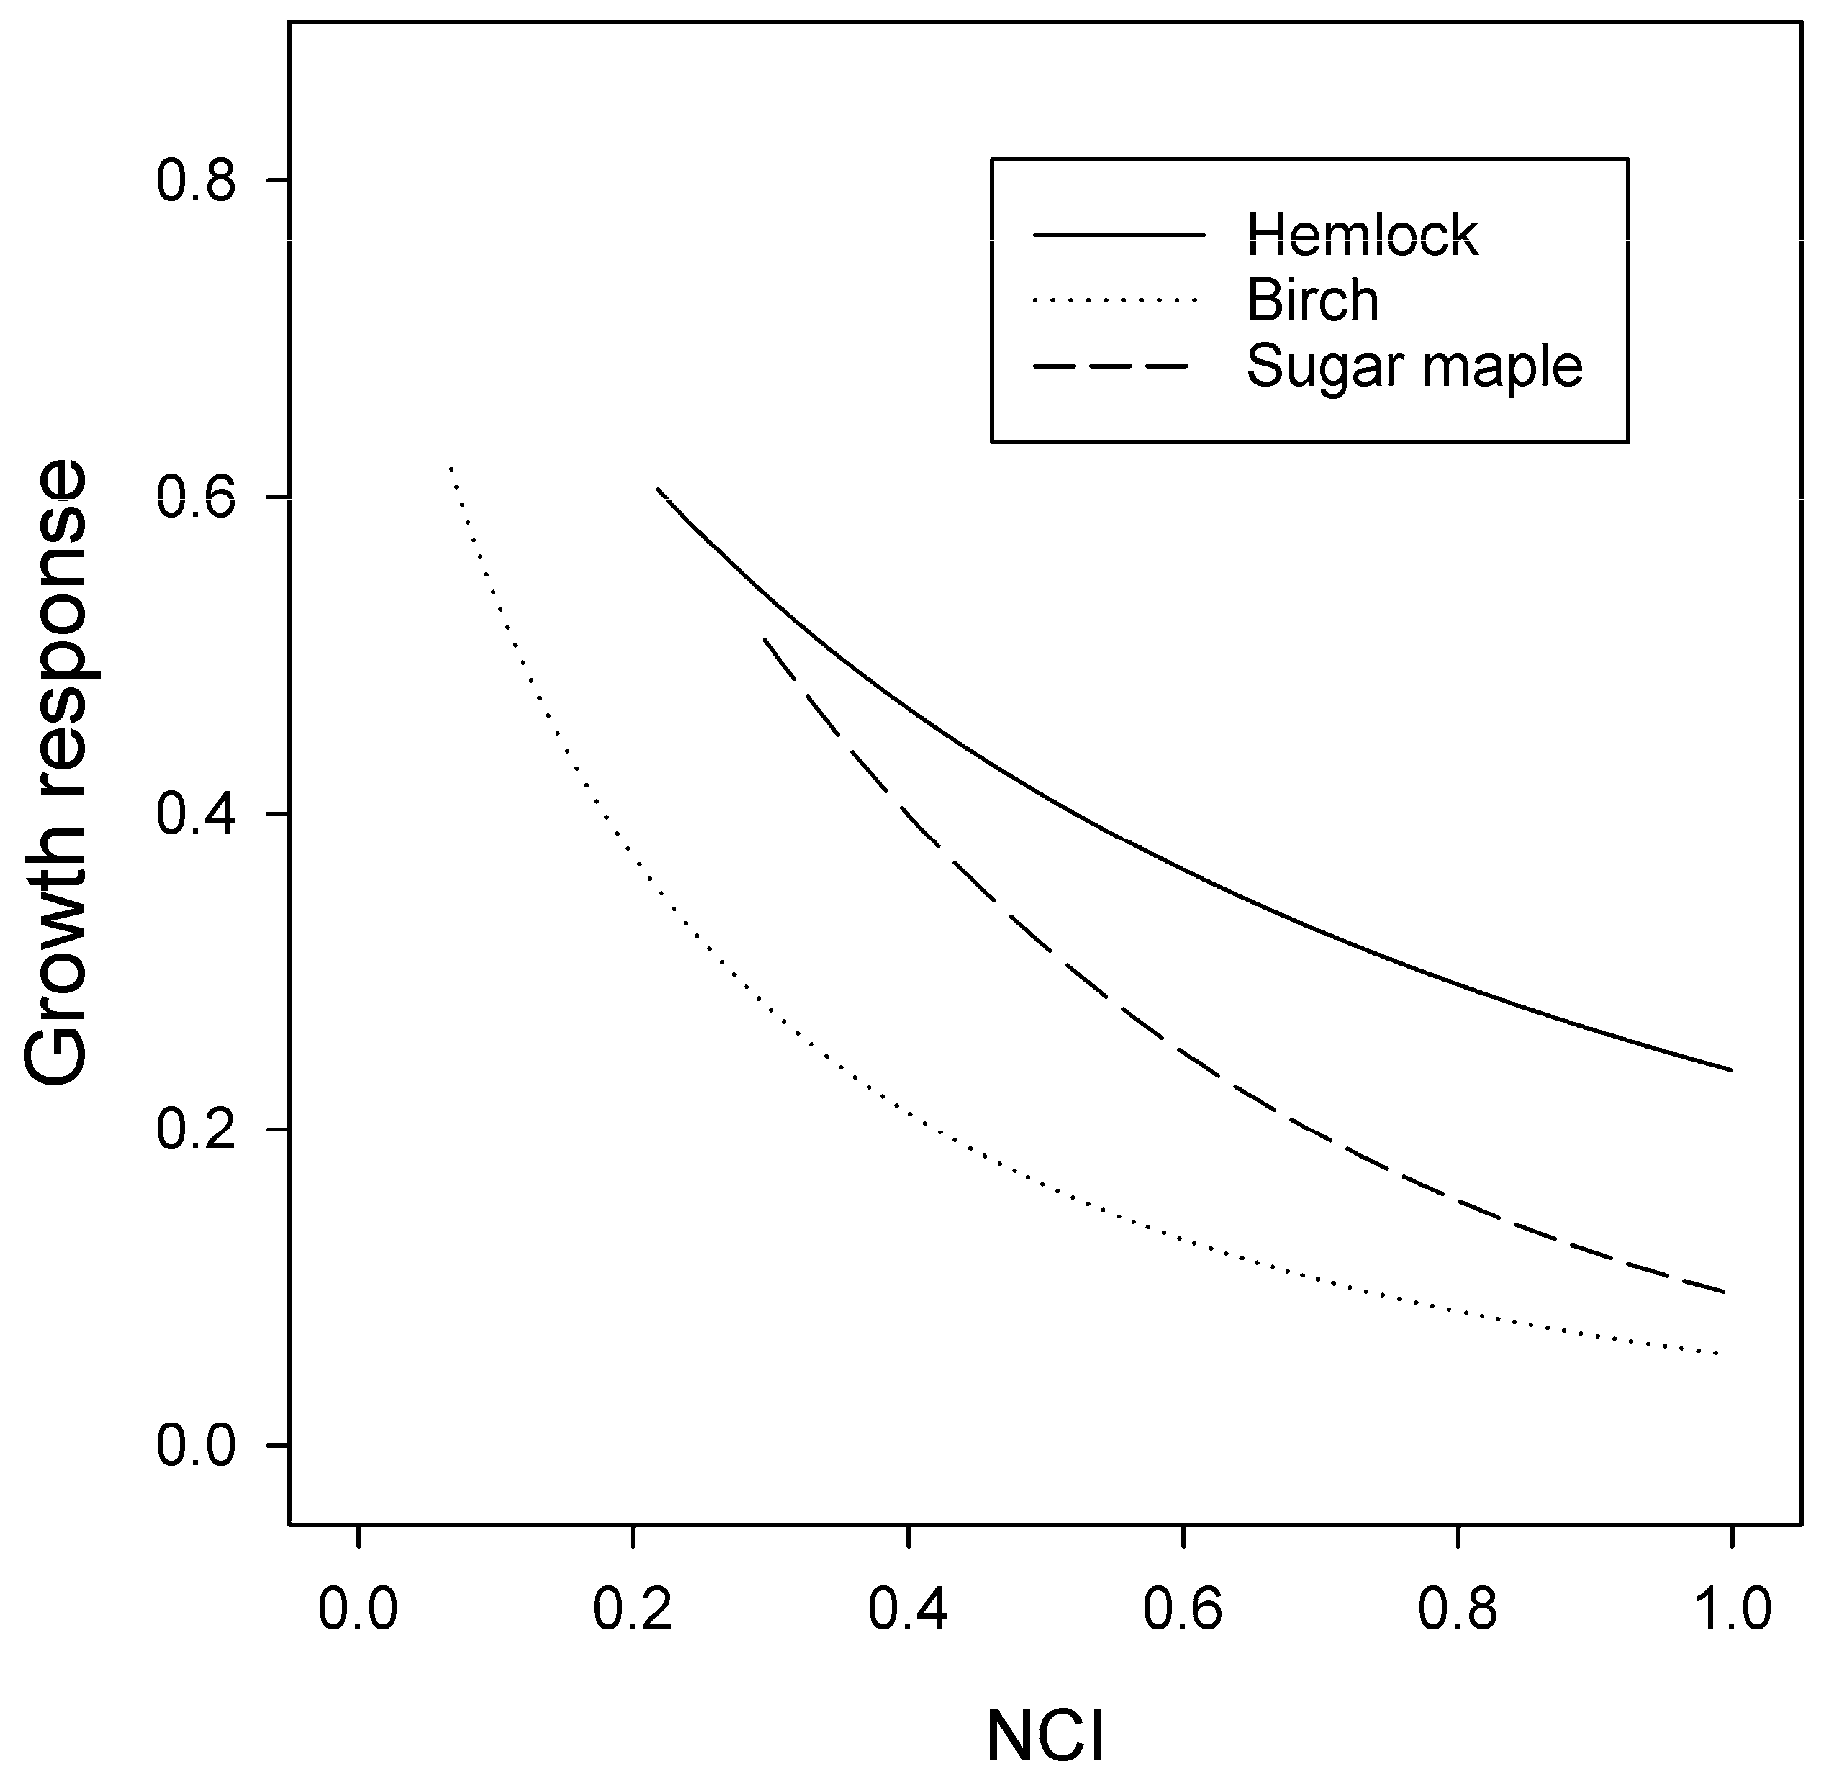
3.3. Size and Competition Effects

Likelihood models indicated that each species growth was influenced by individual size and competitive environment. Size effects were strong in hemlock, explaining 21% of variance, and weak in yellow birch and sugar maple, explaining 1% and 7% of variance, respectively (Table 4). Maximum radial growth rates of hemlock and sugar maple occurred at large trunk diameters indicated by the X30 parameter: a mean dbh of 48 cm for hemlock and an asymptotic increase for sugar maple (Figure 2). Maximum radial growth of yellow birch occurred at the smallest dbh (10 cm).
Deciduous species were more effective than evergreens at suppressing the growth of competitors, regardless of the competing species identity, as indicated by the competitive effect coefficient λ which was consistently larger for deciduous species than for evergreen species (Table 3). Competition explained only 9% of hemlock growth but 21% of yellow birch growth and 16% of sugar maple growth. Sugar maple was more sensitive to competition than hemlock, as indicated by the more rapid decrease in growth as crowding from neighbors increased (Figure 3), and growth that was closer to zero at maximum crowding. Yellow birch was still more sensitive than sugar maple.

4. Discussion

In this stem-mapped old-growth stand with over three decades of census data, a combination of dendro-ecological and neighborhood methods plus non-traditional climate indices provided insight into stand dynamics and climate effects. The amount of growth explained by a tree’s size compared to the competition exerted by its neighbors varied substantially among species. As we predicted based on shade tolerance and successional status, competition limited the growth of yellow birch more strongly than it limited the growth of the two other species. Our predictions about the relative strength of limitation due to precipitation vs. temperature-related factors in an old-growth stand were incorrect for two species; the relationship of hemlock growth to precipitation was weak, and yellow birch growth was not limited by precipitation at all. Sugar maple was the only species for which limitation by precipitation was stronger than limitation by a temperature-related factor, but the relationship was counterintuitive in that there was a negative correlation of growth with summer precipitation.

4.1. Competition

The consistent ranking of deciduous trees as stronger effect-competitors (as per Goldberg and Fleetwood 1987) than evergreen trees was consistent with a previous ranking of these species [37]. In other forest types such as interior cedar–hemlock forest, deciduous species are also stronger competitors than evergreens [39]; however, in young boreal mixed-wood stands in eastern Canada [40], the deciduous species quaking aspen (Populus tremuloides Michx.) is a weaker competitor than balsam fir (Abies balsamea (L.) P. Mill.). Hemlock, the dominant evergreen in our study stand, is typically shorter than co-occurring deciduous species at any given dbh up to 50 cm [41], and this height disparity could account for some of the disparity in competitive effects between evergreen and deciduous species. Low nutrient demand of hemlock compared to the deciduous species in the stand may contribute to its generally low competitive effect strength [42,43,44].
Yellow birch was more sensitive to competition (was a weaker response competitor, as per Goldberg [15]) than hemlock or sugar maple, as indicated by the steep decline in its growth response curve at higher competition levels (Figure 3) and the high proportion of growth explained by competition (22% versus 16% of sugar maple growth and 9% of hemlock growth). Canham and Murphy [14] observed a similar trend; as competition from neighbors increased, yellow birch growth and sugar maple growth dropped sharply but hemlock growth showed only a slow steady decrease. As a mid-tolerant species [12], yellow birch is likely to perform more poorly than shade-tolerant species like hemlock and sugar maple in later successional, old-growth forest [45]. Hemlock is a stress-tolerant species which can establish in marginal sites and has low nutrient demand [46]. Sugar maple has high nutrient demand throughout its development [47], which may help explain its sensitivity to competition compared to hemlock despite being highly shade-tolerant.

4.2. Size Effects on Growth

The size-dependent growth patterns we detected were consistent with the results of past studies and with life history traits of the three tree species. Other studies showed maximum growth rates of sugar maple and hemlock occurring at large trunk diameters [14,29,37]. Sugar maple and hemlock are shade-tolerant, late-successional species; thus, a typical growth trajectory might involve long periods of slow growth while young, then rapid growth once the canopy is reached or a gap is created [48]. In contrast, yellow birch is classified as a mid-tolerant species that may require substantial canopy disturbance to establish [49], and fast early growth is expected. Nevertheless, the amount of variation in yellow birch growth explained by size in the present study, 2%, is far less than the variation explained by the size of sugar maple (7%) or hemlock (21%). Canham and Murphy [14] found no trend in growth with size for yellow birch; our observation of slow growth in large birch is consistent with the other observations in the study stand [29].

4.3. Climate and Growth

The importance of temperature-related factors compared to precipitation in determining the growth of hemlock and yellow birch is perhaps understandable given the humid climate of northeastern USA, notwithstanding our predictions about relative strength of consumed and non-consumed factors in old growth stands. Our findings do not suggest that anthropogenic increases in air temperatures will have a direct adverse impact on hemlocks on the Helderberg plateau in the short term, even though more northerly hemlocks are responding negatively to increased summer temperatures for some time [16]. To the contrary, hemlock growth appeared to benefit from warmer temperatures, as observed in other studies [14,50]. D’Arrigo et al. [51] found a positive correlation with February–March temperature but a negative correlation with June temperatures of the previous year. Indirect effects of anthropogenic increases in air temperatures are likely to be stronger than direct effects on growth, because the hemlock wooly adelgid is the main threat to hemlock survival [52]. The hemlock wooly adelgid’s range is limited by cold winters, and the insect was detected close to the Huyck Preserve.
Positive relationships between hemlock growth and precipitation were reported previously [14,50,51]. Our non-linear analysis clarified the reason for the finding of a negative spring precipitation–growth relationship, showing instead that there is a unimodal relationship of hemlock growth with spring precipitation, with an optimum near the long-term average of 301 mm. This finding suggests that growth will be lower in years with substantially more or less spring precipitation than the long-term average (Figure 1B). There was no significant temporal trend in spring precipitation over the 33-year data record, although there was a substantial increase in summer precipitation.
The negative correlation of yellow birch to spring warm-up (number of March and April days with three-day mean temperature >5 °C) and warm winter temperatures is consistent with other observations of this species under alternating warming then freezing conditions [17,53]. The positive relationship of growth with mean spring (March, April, and May) temperatures was unexpected; after the stronger effect of spring warm-up was accounted for, growth was faster in years with higher mean spring temperatures. Nevertheless, there was a predominantly negative relationship with factors reflecting temperatures, suggesting that yellow birch’s growth will continue to be adversely affected as these climate factors intensify in the coming decades. There is already a pronounced decline in tree growth at the warm end of their distribution in the USA [14], and available habitat for the species in USA is projected to contract by >50% by the end of the 21st century under current greenhouse gas emission trends [24].
Sugar maple performance with respect to climate factors is important for maple sugar and tourism industries; sugar maple habitat in northeastern USA is projected to contract by as much as 50% by the end of the 21st century under continued high emissions of greenhouse gases [24]. Higher minimum air temperatures in spring and fall are associated with more sugar maple stress in Vermont [19], but Canham and Murphy [14] found slightly faster growth in locations with warmer mean annual temperatures in eastern USA. At our study site in east–central New York, growth was slower in years with warmer winters and wetter summers; both these climatic factors are projected to increase in the region under continued greenhouse warming, which augurs poorly for this species [22]. The cause of the unexpected relationship with precipitation may be lower irradiance due to high cloud cover rather than a more direct effect. Low snow cover in warm winters was implicated in sugar maple growth declines, possibly due to calcium leakage from damaged root membranes [54]. The study site on the Helderberg plateau has a cool microclimate, and there is usually an insulating mid-winter snowpack, although it became less consistent in recent years (Anne Rhoads, personal communication). Nevertheless, there is vanishingly low probability of an insulating mid-winter snowpack persisting by the end of the 21st century in the region, and loss of the snowpack may exacerbate growth declines [55]. Our findings were consistent with the expectation of declining sugar maple growth under ongoing climatic change.

5. Conclusions

The predicted performance of trees of mixed northern hardwood forest under climate change is a concern not only for forest managers but for a broad segment of society, emphasizing the need for evaluation under a range of competitive environments including old-growth forests. Our examination of ca. 200-year-old hemlock forest in east–central New York, USA suggests that most trends of temperature and precipitation factors are expected to result in decreased growth of the iconic species sugar maple and yellow birch. Hemlock showed the potential to benefit from warmer winters although these promote growth and survival of a pest, the hemlock wooly adelgid. By simultaneously accounting for the effects of climate, competition, and size on radial growth, we showed that climate accounted for a small (2%) proportion of growth. The comparatively strong influence of competition on sugar maple and yellow birch radial growth broadly suggests the potential for silvicultural interventions such as thinning to maintain growth of these species in managed stands.

Author Contributions

Conceptualization, S.W.B.; methodology, S.W.B. and E.M.O.; software, S.W.B.; validation, S.W.B., J.R.R., and E.M.O.; formal analysis, S.W.B.; investigation, S.W.B.; resources, S.W.B. and J.R.R.; data curation, S.W.B. and J.R.R.; writing—original draft preparation, S.W.B.; writing—review and editing, J.R.R. and E.M.O.; visualization, S.W.B.; project administration, S.W.B. and J.R.R.; funding acquisition, S.W.B. All authors have read and agreed to the published version of the manuscript.

Funding

Field and lab work were funded by The Huyck Foundation. Analysis and manuscript preparation were supported by M.E.N. Bigelow and the Robert W. Woodruff Foundation.

Acknowledgments

Charles Canham suggested the idea for the study, and Lora Murphy provided the computer code for likelihood analyses. Neil Pederson provided reference tree ring sequences, and the 2015 Odum Fellowship interns did canopy cover measurements. Assistance with increment boring was provided by Jon Bigelow and Will Kessler. Antje Weitz assisted with core preparation, and Anthony Cuminale and Anna Rollosson assisted with ring width measurement.

Conflicts of Interest

The authors declare no conflicts of interest. The funders had no role in the design of the study; in the collection, analyses, or interpretation of data; in the writing of the manuscript, or in the decision to publish the results.

References

  1. Aakala, T.; Fraver, S.; D’Amato, A.W.; Palik, B.J. Influence of competition and age on tree growth in structurally complex old-growth forests in northern Minnesota. For. Ecol. Manag. 2013, 308, 128–135. [Google Scholar] [CrossRef]
  2. Fraver, S.; D’Amato, A.W.; Bradford, J.B.; Jonsson, B.G.; Jönsson, M.; Esseen, P.-A. Tree growth and competition in an old-growth Picea abies forest of boreal Sweden: Influence of tree spatial patterning. J. Veg. Sci. 2013, 25, 374–385. [Google Scholar] [CrossRef]
  3. Das, A.J. The effect of size and competition on tree growth rate in old-growth coniferous forests. Can. J. For. Res. 2012, 42, 1983–1995. [Google Scholar] [CrossRef]
  4. Ford, K.R.; Breckheimer, I.K.; Franklin, J.F.; Freund, J.A.; Kroiss, S.J.; Larson, A.J.; Theobald, E.J.; Hille Ris Lambers, J. Competition alters tree growth responses to climate at individual and stand scales. Can. J. For. Res. 2017, 47, 53–62. [Google Scholar] [CrossRef] [Green Version]
  5. Sánchez-Salguero, R.; Linares, J.C.; Camarero, J.J.; Madriga-Gonzalez, J.; Hevia, A.; Sanchez-Miranda, A.; Ballesteros-Canovas, J.A.; Alfaro-Sanchez, C.; Garcia-Cervignon, A.K.; Bigler, C.; et al. Disentangling the effects of competition and climate on individual tree growth: A retrospective and dynamic approach in Scots pine. For. Ecol. Manag. 2015, 358, 12–25. [Google Scholar] [CrossRef]
  6. Clark, J.S.; Bell, D.M.; Hersh, M.H.; Nichols, L. Climate change vulnerability of forest biodiversity: Climate and competition tracking of demographic rates. Glob. Chang. Biol. 2011, 17, 1834–1849. [Google Scholar] [CrossRef]
  7. Gómez-Aparicio, L.; Garcia-Valdes, R.; Ruiz-Benito, P.; Zavala, M.A. Disentangling the relative importance of climate, size, and competition on tree growth in Iberian forests: Implications for forest management under global change. Glob. Chang. Biol. 2011, 17, 2400–2414. [Google Scholar] [CrossRef] [Green Version]
  8. Cescatti, A.; Piutti, E. Silvicultural alternatives, competition regime and sensitivity to climate in a European beech forest. For. Ecol. Manag. 1998, 102, 213–223. [Google Scholar] [CrossRef]
  9. Misson, L.; Vincke, C.; Devillez, F. Frequency responses of radial growth series after different thinning intensities in Norway spruce (Picea abies (L.) Karst.) stands. For. Ecol. Manag. 2003, 177, 51–63. [Google Scholar] [CrossRef]
  10. Bottero, A.; D’Amato, A.W.; Palik, B.J.; Bradford, J.B.; Fraver, S.; Battaglia, M.A.; Asherin, L.A. Density-dependent vulnerability of forest ecosystems to drought. J. Appl. Ecol. 2016, 54, 1605–1614. [Google Scholar] [CrossRef]
  11. Gleason, K.E.; Bradford, J.; Bottero, A.; D’Amato, A.W.; Fraver, S.; Palik, B.; Battaglia, M.A.; Iverson, L.R.; Kenefic, L.; Kern, C.C. Competition amplifies drought stress in forests across broad climatic and compositional gradients. Ecosphere 2017, 8, E01849. [Google Scholar] [CrossRef] [Green Version]
  12. Baker, F.S. A revised tolerance table. J. For. 1949, 47, 179–181. [Google Scholar] [CrossRef]
  13. Duchesne, L.; Prévost, M. Canopy disturbance and intertree competition: Implications for tree growth and recruitment in two yellow birch–conifer stands in Quebec, Canada. J. For. Res. 2013, 18, 168–178. [Google Scholar] [CrossRef]
  14. Canham, C.; Murphy, L. The demography of tree species response to climate: Sapling and canopy tree growth. Ecosphere 2016, 7. [Google Scholar] [CrossRef]
  15. Goldberg, D.E.; Fleetwood, L. Competitive effect and response in four annual plants. J. Ecol. 1987, 75, 1131–1143. [Google Scholar] [CrossRef]
  16. Tardif, J.; Brisson, J.; Bergeron, Y. Dendroclimatic analysis of Acer saccharum, Fagus grandifolia, and Tsuga canadensis from an old-growth forest, southwestern Quebec. Can. J. For. Res. 2001, 31, 1491–1501. [Google Scholar] [CrossRef] [Green Version]
  17. Bourque, C.P.-A.; Cox, R.M.; Allen, D.J.; Arp, P.A.; Meng, F.-R. Spatial extent of winter thaw events in eastern North America: Historical weather records in relation to yellow birch decline. Glob. Chang. Biol. 2005, 11, 1477–1492. [Google Scholar] [CrossRef]
  18. Lane, C.J.; Reed, D.D.; Mroz, G.D.; Liechty, H.O. Width of sugar maple (Acer saccharum) tree rings as affected by climate. Can. J. For. Res. 1993, 23, 2370–2375. [Google Scholar] [CrossRef]
  19. Oswald, E.M.; Pontius, J.; Rayback, S.A.; Schaberg, P.G.; Wilmot, S.H.; Dupigny-Giroux, L.-A. The complex relationship between climate and sugar maple health: Climate change implications in Vermont for a key northern hardwood species. For. Ecol. Manag. 2018, 422, 303–312. [Google Scholar] [CrossRef]
  20. Huntington, T.G.; Richardson, A.D.; McGuire, K.J.; Hayhoe, K. Climate and hydrological changes in the northeastern United States: Recent trends and implications for forested and aquatic ecosystems. Can. J. For. Res. 2009, 39, 199–212. [Google Scholar] [CrossRef] [Green Version]
  21. Tang, G.; Beckage, B. Projecting the distribution of forests in New England in response to climate change. Divers. Distrib. 2010, 16, 144–158. [Google Scholar] [CrossRef]
  22. Hayhoe, K.; Wake, C.P.; Andersen, B.T.; Liang, X.-Z.; Maurer, E.P.; Zhu, J.; Bradbury, J.A.; DeGaetano, A.T.; Stoner, A.M.; Wuebbles, D.J. Regional climate change projections for the Northeast USA. Mitig. Adapt. Strateg. Glob. Chang. 2008, 13, 425–436. [Google Scholar] [CrossRef]
  23. Frumhoff, P.C.; McCarthy, J.; Melillo, J.M.; Moser, S.C.; Wuebbles, D.J. Confronting Climate Change in the U.S. Northeast: Science, Impacts, Solutions; Union of Concerned Scientists: Cambridge, MA, USA, 2007. [Google Scholar]
  24. Iverson, L.R.; Prasad, A.M.; Matthews, S.N.; Peters, M. Estimating potential habitat for 134 US tree species under six climate scenarios. For. Ecol. Manag. 2008, 254, 390–406. [Google Scholar] [CrossRef]
  25. Russell, N.R. Natural forests of the Edmund Niles Huyck Preserve, New York. Proc. Iowa Acad. Sci. 1995, 62, 231–244. [Google Scholar]
  26. Odum, E.P. The vegetation of the Edmund Niles Huyck Preserve, New York. Am. Midl. Nat. 1943, 29, 72–88. [Google Scholar] [CrossRef]
  27. Brown, J.H. Soil Survey of Albany County, New York; USDA Soil Conservation Service: Washington, DC, USA, 1992. [Google Scholar]
  28. Bigelow, S.W.; Canham, C.D. Community organization of tree species along soil gradients in a north-eastern USA forest. J. Ecol. 2002, 90, 188–200. [Google Scholar] [CrossRef] [Green Version]
  29. Runkle, J.R. Twenty-four years of change in an old Tsuga canadensis woods affected by beech bark disease. J. Torrey Bot. Soc. 2005, 132, 483–491. [Google Scholar] [CrossRef]
  30. Runkle, J.R. Eight years change in an old Tsuga canadensis woods affected by beech bark disease. Bull. Torrey Bot. Club 1990, 117, 409–419. [Google Scholar] [CrossRef]
  31. Garcia, O. A generic approach to spatial individual-based modelling and simulation of plant communities. Math. Comput. For. Nat. Resour. Sci. 2014, 6, 36–47. [Google Scholar]
  32. Bunn, A.G. Statistical and visual crossdating in R using the dplR library. Dendrochronologia 2010, 28, 251–258. [Google Scholar] [CrossRef]
  33. Oyler, J.W.; Ballantyne, A.; Jencso, K.; Sweet, M.; Running, S.W. Creating a topoclimatic daily air temperature dataset for the conterminous United States using homogenized station data and remotely sensed land skin temperature. Int. J. Climatol. 2015, 35, 2258–2279. [Google Scholar] [CrossRef]
  34. Livneh, B.; Rosenberg, A.; Lin, C.; Nijssen, B.; Mishra, V.; Andreadis, K.M.; Maurer, E.P.; Lettenmaier, D.P. A long-term hydrologically based dataset of land surface fluxes and states for the conterminous United States: Update and extension. J. Clim. 2013, 26, 9384–9392. [Google Scholar] [CrossRef]
  35. R Development Core Team. R: A Language and Environment for Statistical Computing; R Foundation for Statistical Computing: Vienna, Austria, 2016. [Google Scholar]
  36. Grömping, U. Relative importance for linear regression in R: The package relaimpo. J. Stat. Softw. 2006, 17, 1–27. [Google Scholar] [CrossRef] [Green Version]
  37. Canham, C.D.; Papaik, M.J.; Uriarte, M.; McWilliams, W.H.; Jenkins, J.C.; Twery, M.J. Neighborhood analyses of canopy tree competition along environmental gradients in New England forests. Ecol. Appl. 2006, 16, 540–554. [Google Scholar] [CrossRef] [Green Version]
  38. Burnham, K.P.; Anderson, D.R. Model Selection and Multimodel Inference: A Practical Information-Theoretic Approach; Springer: New York, NY, USA, 2002; p. 488. [Google Scholar]
  39. Simard, S.W.; Sachs, D.L.; Vyse, A.; Blevins, L.L. Paper birch competitive effects vary with conifer tree species and stand age in interior British Columbia forests: Implications for reforestation policy and practice. For. Ecol. Manag. 2004, 198, 55–74. [Google Scholar] [CrossRef]
  40. Boivin, F.; Paquette, A.; Papaik, M.J.; Thiffault, N.; Messier, C. Do position and species identity of neighbours matter in 8–15-year-old post harvest mesic stands in the boreal mixedwood? For. Ecol. Manag. 2010, 260, 1124–1131. [Google Scholar] [CrossRef] [Green Version]
  41. Ducey, M.J. Evergreenness and wood density predict height–diameter scaling in trees of the northeastern United States. For. Ecol. Manag. 2012, 279, 21–26. [Google Scholar] [CrossRef]
  42. Tripler, C.E.; Canham, C.D.; Inouye, R.S.; Schnurr, J.L. Soil nitrogen availability, plant luxury consumption, and herbivory by white-tailed deer. Oecologia 2002, 133, 517–524. [Google Scholar] [CrossRef]
  43. Catovsky, S.; Kobe, R.K.; Bazzaz, F.A. Nitrogen-induced changes in seedling regeneration and dynamics of mixed conifer-broad-leaved forests. Ecol. Appl. 2002, 12, 1611–1625. [Google Scholar] [CrossRef]
  44. Bigelow, S.W.; Canham, C.D. Nutrient limitation of juvenile trees in a northern hardwood forest: Calcium and nitrate are preeminent. For. Ecol. Manag. 2007, 243, 310–319. [Google Scholar] [CrossRef]
  45. Huston, M.; Smith, T. Plant succession: Life history and competition. Am. Nat. 1987, 130, 168–198. [Google Scholar] [CrossRef]
  46. Goerlich, D.L.; Nyland, R.D. Natural Regeneration of Eastern Hemlock: A Review; GTR-NE-267; USDA-Forest Service, Northeastern Forest Experiment Station: Newtown Square, PA, USA, 2000; pp. 14–23. [Google Scholar]
  47. Long, R.P.; Horsley, S.B.; Hallett, R.A.; Bailey, S.W. Sugar maple growth in relation to nutrition and stress in the northeastern United States. Ecol. Appl. 2009, 19, 1454–1466. [Google Scholar] [CrossRef] [PubMed] [Green Version]
  48. Canham, C.D. Growth and canopy architecture of shade-tolerant trees: Response to canopy gaps. Ecology 1988, 69, 786–795. [Google Scholar] [CrossRef]
  49. Woods, K.D. Dynamics in late-successional hemlock–hardwood forests over three decades. Ecology 2000, 81, 110–126. [Google Scholar] [CrossRef]
  50. Teets, A.; Fraver, S.; Weiskittel, A.R.; Hollinger, D.Y. Quantifying climate–growth relationships at the stand level in a mature mixed-species conifer forest. Glob. Chang. Biol. 2018, 24, 3587–3602. [Google Scholar] [CrossRef] [PubMed]
  51. D’Arrigo, R.D.; Schuster, W.S.F. Climate-growth relationships of eastern hemlock and Chestnut Oak from Black Rock Forest in the Highlands of Southeastern New York. Tree-Ring Res. 2001, 57, 183–190. [Google Scholar]
  52. Paradis, A.; Elkington, J.; Hayhoe, K.; Buonaccorsi, J. Role of winter temperature and climate change on the survival and future range expansion of the hemlock woolly adelgid (Adelges tsugae) in eastern North America. Mitig. Adapt. Strateg. Glob. Chang. 2008, 13, 541–554. [Google Scholar] [CrossRef]
  53. Zhu, X.B.; Cox, R.M.; Bourque, C.P.-A.; Arp, P.A. Thaw effects on cold-hardiness parameters in yellow birch. Can. J. Bot. 2002, 2002, 390–398. [Google Scholar] [CrossRef]
  54. Comerford, D.P.; Schaberg, P.G.; Templer, P.H.; Socci, A.M.; Campbell, J.L.; Wallin, K.F. Influence of experimental snow removal on root and canopy physiology of sugar maple trees in a northern hardwood forest. Oecologia 2013, 171, 261–269. [Google Scholar] [CrossRef]
  55. Reinmann, A.B.; Susser, J.R.; Demaria, E.M.C.; Templer, P.H. Declines in northern forest tree growth following snowpack decline and soil freezing. Glob. Chang. Biol. 2019, 25, 420–430. [Google Scholar] [CrossRef]
Figure 1. Climate response (fraction of potential growth) of trees inferred from tree ring growth from 1978–2011 in an old-growth hemlock stand on the Helderberg plateau in east–central New York. (A) Effect of growing temperatures (degree-days) on hemlock growth. (B) Effect of spring precipitation on hemlock. (C) Effect of summer temperature on yellow birch growth. (D) Effect of warm spring days (three-day mean >5 °C) on yellow birch growth. (E) Effect of mean winter (December–January–February) temperatures on sugar maple growth. (F) Effect of summer precipitation on sugar maple growth.
Forests 11 00052 g001
Figure 2. Influence of tree size (dbh) on predicted radial growth rate (fraction of potential growth) of three tree species in an old-growth hemlock stand on the Helderberg plateau in east–central New York.
Forests 11 00052 g002
Figure 3. Influence of competition (NCI = neighborhood competition index) on predicted radial growth rate (fraction of potential growth) of three tree species in an old-growth hemlock forest on the Helderberg plateau in east–central New York. NCI is scaled relative to maximum value for each species.
Forests 11 00052 g003
Table 1. Relative importance of climate indices in explaining ring width index of three mixed northern hardwood species from 1977–2011; the sum of importance values is equal to the coefficient of determination (r2).
Climate IndexMean (SD)UnitHemlock *BirchSugar Maple
Winter temperature−5.2 (1.7)°C0.052 (+/−)0.058 (−)0.061 (−)
Snow171 (65)inches0.030 (−)0.006 (+/−)0.005 (+/−)
Warm-up22.5 (6.1)days0.024 (+/−)0.124 (−)0.010 (−)
Max. 3-day temperature30.4 (1.3)°C0.020 (+/−)0.026 (−)0.060 (−)
Temperature extremes1.8 (2.5)days0.025 (+)0.007 (−)0.043 (−)
Degree-days1224 (206)°C days0.133 (+)0.035 (−/+)0.090 (−)
Thaws8.6 (5.4)days0.048 (+/−)0.047 (−)0.024 (−)
Hardening7.0 (3.9)days0.027 (−)0.003 (+)0.035 (+)
Spring precipitation301 (86)mm0.052 (−)0.004 (−)0.003 (+/−)
Summer precipitation309 (85)mm0.006 (+)0.006 (+/−)0.138 (−)
Spring temperature11.9 (2)°C0.055 (+/−)0.062 (+)0.015 (+/−)
Summer temperature21.2 (2)°C0.014 (+/−)0.027 (−)0.033 (−)
Sum (=r2) 0.480.40 0.52
* Plus and minus signs in parentheses indicate the predominant direction of relationship in regressions with varying numbers of explanatory variables; bold font indicates importance values ≥ 0.1.
Table 2. Statistics for models of radial growth of three northern hardwood tree species in an old- growth hemlock forest in east–central New York, United States of America (USA); the best model for each species (in bold) incorporates neighborhood competition, target tree size, and climate.
HemlockYellow BirchSugar Maple
Model *KAICcΔi§R2||AICcΔiR2AICcΔiR2
pg24535.6955.40.002858.3393.10.003294.9514.90.00
pg × se43841.0254.40.242856.7391.50.003130.3350.40.07
pg × ce64481.1900.40.022842.8377.60.013268.5488.50.02
pg × ne84280.2632.90.102524.459.20.192985.8205.90.17
pg × se·ce83771.1190.50.262841.0375.80.013062.9283.00.10
pg × se·ne103691.4104.80.292478.713.50.222802.622.70.24
pg × ce·ne124126.5545.90.162500.835.60.212934.1154.10.20
pg × se × ce × ne143580.600.322448.700.242779.900.25
* pg is a model with no independent variables, and other models incorporate effects of size (se), climate (ce), and neighborhood competition (ne) alone or in combination; factors in climate models vary by species: hemlock (degree-days and spring precipitation), yellow birch (winter temperature and spring warmup, and sugar maple (winter temperature and summer precipitation); K is the number of model parameters; counts include an estimated variance parameter; AICc is Akaike’s information criterion adjusted for small sample size; § Δi is the difference in AICc units between the model under consideration and the best model; || adjusted R2 shows variance explained relative to the simple mean of the data (i.e., model pg).
Table 3. Statistics for models of radial growth of three northern hardwood tree species in an old- growth hemlock forest in east–central New York, USA; the best model for each species (in bold) incorporates neighborhood competition, target tree size, and climate.
HemlockYellow BirchSugar Maple
Model *KAICcΔi§R2||AICcΔiR2AICcΔiR2
pg24535.6955.40.002858.3393.10.003294.9514.90.00
pg × se43841.0254.40.242856.7391.50.003130.3350.40.07
pg × ce64481.1900.40.022842.8377.60.013268.5488.50.02
pg × ne84280.2632.90.102524.459.20.192985.8205.90.17
pg × se·ce83771.1190.50.262841.0375.80.013062.9283.00.10
pg × se·ne103691.4104.80.292478.713.50.222802.622.70.24
pg × ce·ne124126.5545.90.162500.835.60.212934.1154.10.20
pg × se × ce × ne143580.600.322448.700.242779.900.25
* pg is a model with no independent variables, and other models incorporate effects of size (se), climate (ce), and neighborhood competition (ne) alone or in combination; factors in climate models vary by species: hemlock (degree-days and spring precipitation), yellow birch (winter temperature and spring warm-up, and sugar maple (winter temperature and summer precipitation); K is the number of model parameters; counts include an estimated variance parameter; AICc is Akaike’s information criterion adjusted for small sample size; § Δi is the difference in AICc units between the model under consideration and the best model; || adjusted R2 shows the variance explained relative to the simple mean of the data (i.e., model pg).
Table 4. Relative strength of contribution of climate, size, and competition to radial growth of three tree species in old-growth hemlock stand of mixed-northern hardwood forest in east–central New York: values indicate a mean increase in R2 when the factor was added to simpler models of growth.
FactorHemlockYellow BirchSugar Maple
Climate0.020.020.02
Size0.210.010.07
Competition0.090.210.16

