Article

The Composition and Diversity of Soil Bacterial and Fungal Communities Along an Urban-To-Rural Gradient in South China

College of Forestry and Landscape Architecture, South China Agricultural University, Guangzhou 510642, China
*
Author to whom correspondence should be addressed.
Forests 2019, 10(9), 797; https://doi.org/10.3390/f10090797
Submission received: 23 July 2019 / Revised: 9 September 2019 / Accepted: 10 September 2019 / Published: 12 September 2019
(This article belongs to the Section Forest Ecophysiology and Biology)

Abstract

:
Soil microbes are of great significance to driving the biogeochemical cycles and are affected by multiple factors, including urbanization. However, the response of soil microbes to urbanization remains unclear. Therefore, we designed an urban-to-rural gradient experiment to investigate the response of soil microbial composition and diversity to urbanization. Here, we used a high-throughput sequencing method to analyze the biotic and abiotic effects on soil microbial composition and diversity along the urban-to-rural gradient. Our results showed that soil bacterial diversity was the highest in urban areas, followed by suburban areas, and was the lowest in exurbs; however, fungal diversity did not vary significantly among the three areas. Plant traits, i.e., tree richness, shrub richness, the number of tree stems, diameter at breast height of trees, and soil properties, i.e., pH, soil organic carbon, soil exchangeable calcium and magnesium, and soil water content, were only significantly influenced bacterial diversity, but not fungal diversity. The effect of trees and shrubs was higher than that of herbs on microbial composition. Soil organic carbon, pH, soil available nitrogen, soil exchangeable calcium, and magnesium were the major soil factors influencing the soil bacterial and fungal composition. Soil properties had a greater influence on bacterial than on fungal composition at genus level, while plant traits contributed more to fungal than to bacterial composition at genus level. Our study suggests that the urban-to-rural gradient affect the composition and diversity of bacterial community as well as the fungal composition, but not the fungal diversity.

1. Introduction

Acceleration of urbanization globally has led to an explosive increase in global urban population. In 2018, the global urban population of 4.2 billion accounted for 55% of the total population worldwide [1]. Despite rapid economic development, urbanization has resulted in a series of ecological challenges, such as urban heat islands [2], increased atmospheric CO2 concentration [3], nitrogen deposition [4], and decreased biodiversity [5]. However, urban forests play a positive role under the enormous pressure of urbanization. Urban forests are associated with multiple ecological benefits such as absorption of carbon and release of oxygen, regulation of urban microclimate, and diminishing heat island effect, thus alleviating the impacts of urbanization [6].
As an essential component of urban forest ecosystem, soil microbes participate in many ecological processes and play an important role in urban forest ecosystem. Soil microbes drive biogeochemical cycles [7], via litter decomposition [8,9], catalyzing the turnover of soil carbon and nutrients [10] and alleviation of changes induced by urbanization. Therefore, subtle changes in soil microbes may reflect significant changes in nutrient cycles of the plant-soil system [11]. However, the response of soil microbial composition and diversity to biotic (plant traits) and abiotic (soil physicochemical attributes) factors remains unclear.
Studies have shown that plant diversity is a determinant of soil microbial biomass. Increased plant diversity significantly increases microbial biomass [12,13], microbial diversity [14], and microbial activity [15], and enhances the rate of microbial use of rhizosphere carbon [16]. In addition, plant diversity can predict soil microbial beta diversity [17]. The various soil microbial groups and the diversity of different plant layers show varying levels of relationship. Soil bacterial diversity is significantly correlated with tree and shrub diversity [18,19], while the correlation between fungal and plant diversity is weak [18,20]. However, a strong correlation exists between the composition of fungal and plant communities [20]. Soil microbes are very sensitive to the soil microenvironment. Studies have shown that the soil physicochemical attributes (pH, C source, available nutrients, water content, and soil structure) [21] can significantly affect the diversity of the soil microbial community. Soil pH is currently recognized as a key factor affecting soil microbes [22,23]. However, Wang et al. [24] showed that the changes in the rate of soil nitrogen utilization and soil organic carbon following nitrogen addition significantly reduced soil microbial diversity; soil pH did not significantly affect the soil microbial diversity. To date, the differential impact of plant traits and soil properties on soil microbes remains understudied.
Recent studies investigating the role and the assembly mechanism of urban forests mainly focused on soil properties [25,26] and plant communities [5,27]. However, the response of soil microbial communities to urbanization and the impact of changes in plant traits and soil properties induced by urbanization on the soil microbes have yet to be investigated systematically. The Pearl River Delta in China has experienced rapid urbanization since the economic reform in 1978 and is one of the three major urban agglomerations in the country. It has surpassed Tokyo in Japan to become the world’s largest urban agglomerate facilitating the study of the response of soil microbial communities to urbanization [28]. Therefore, we designed an urban-to-rural gradient experiment (urban-suburb-exurb) in Dongguan, one of the important cities in China’s Pearl River Delta urban agglomeration to address this concern. The composition and diversity of soil microbial community and the related biotic (plant traits) and abiotic (soil properties) factors were systematically investigated along the urban-to-rural gradient. Based on previous studies investigating soil microbial community [18,29,30,31,32], we predicted that plant traits may have stronger effects on fungal rather than on bacterial community along the urban-to-rural gradient, while soil properties may affect bacteria more than the fungal community. The specific objectives of this investigation were to (1) test the responses of soil bacterial and fungal communities to urbanization based on their composition and diversity along the urban-to-rural gradient, respectively, and (2) analyze the relationships between soil microbial composition and diversity, and plant traits and soil properties.

2. Materials and Methods
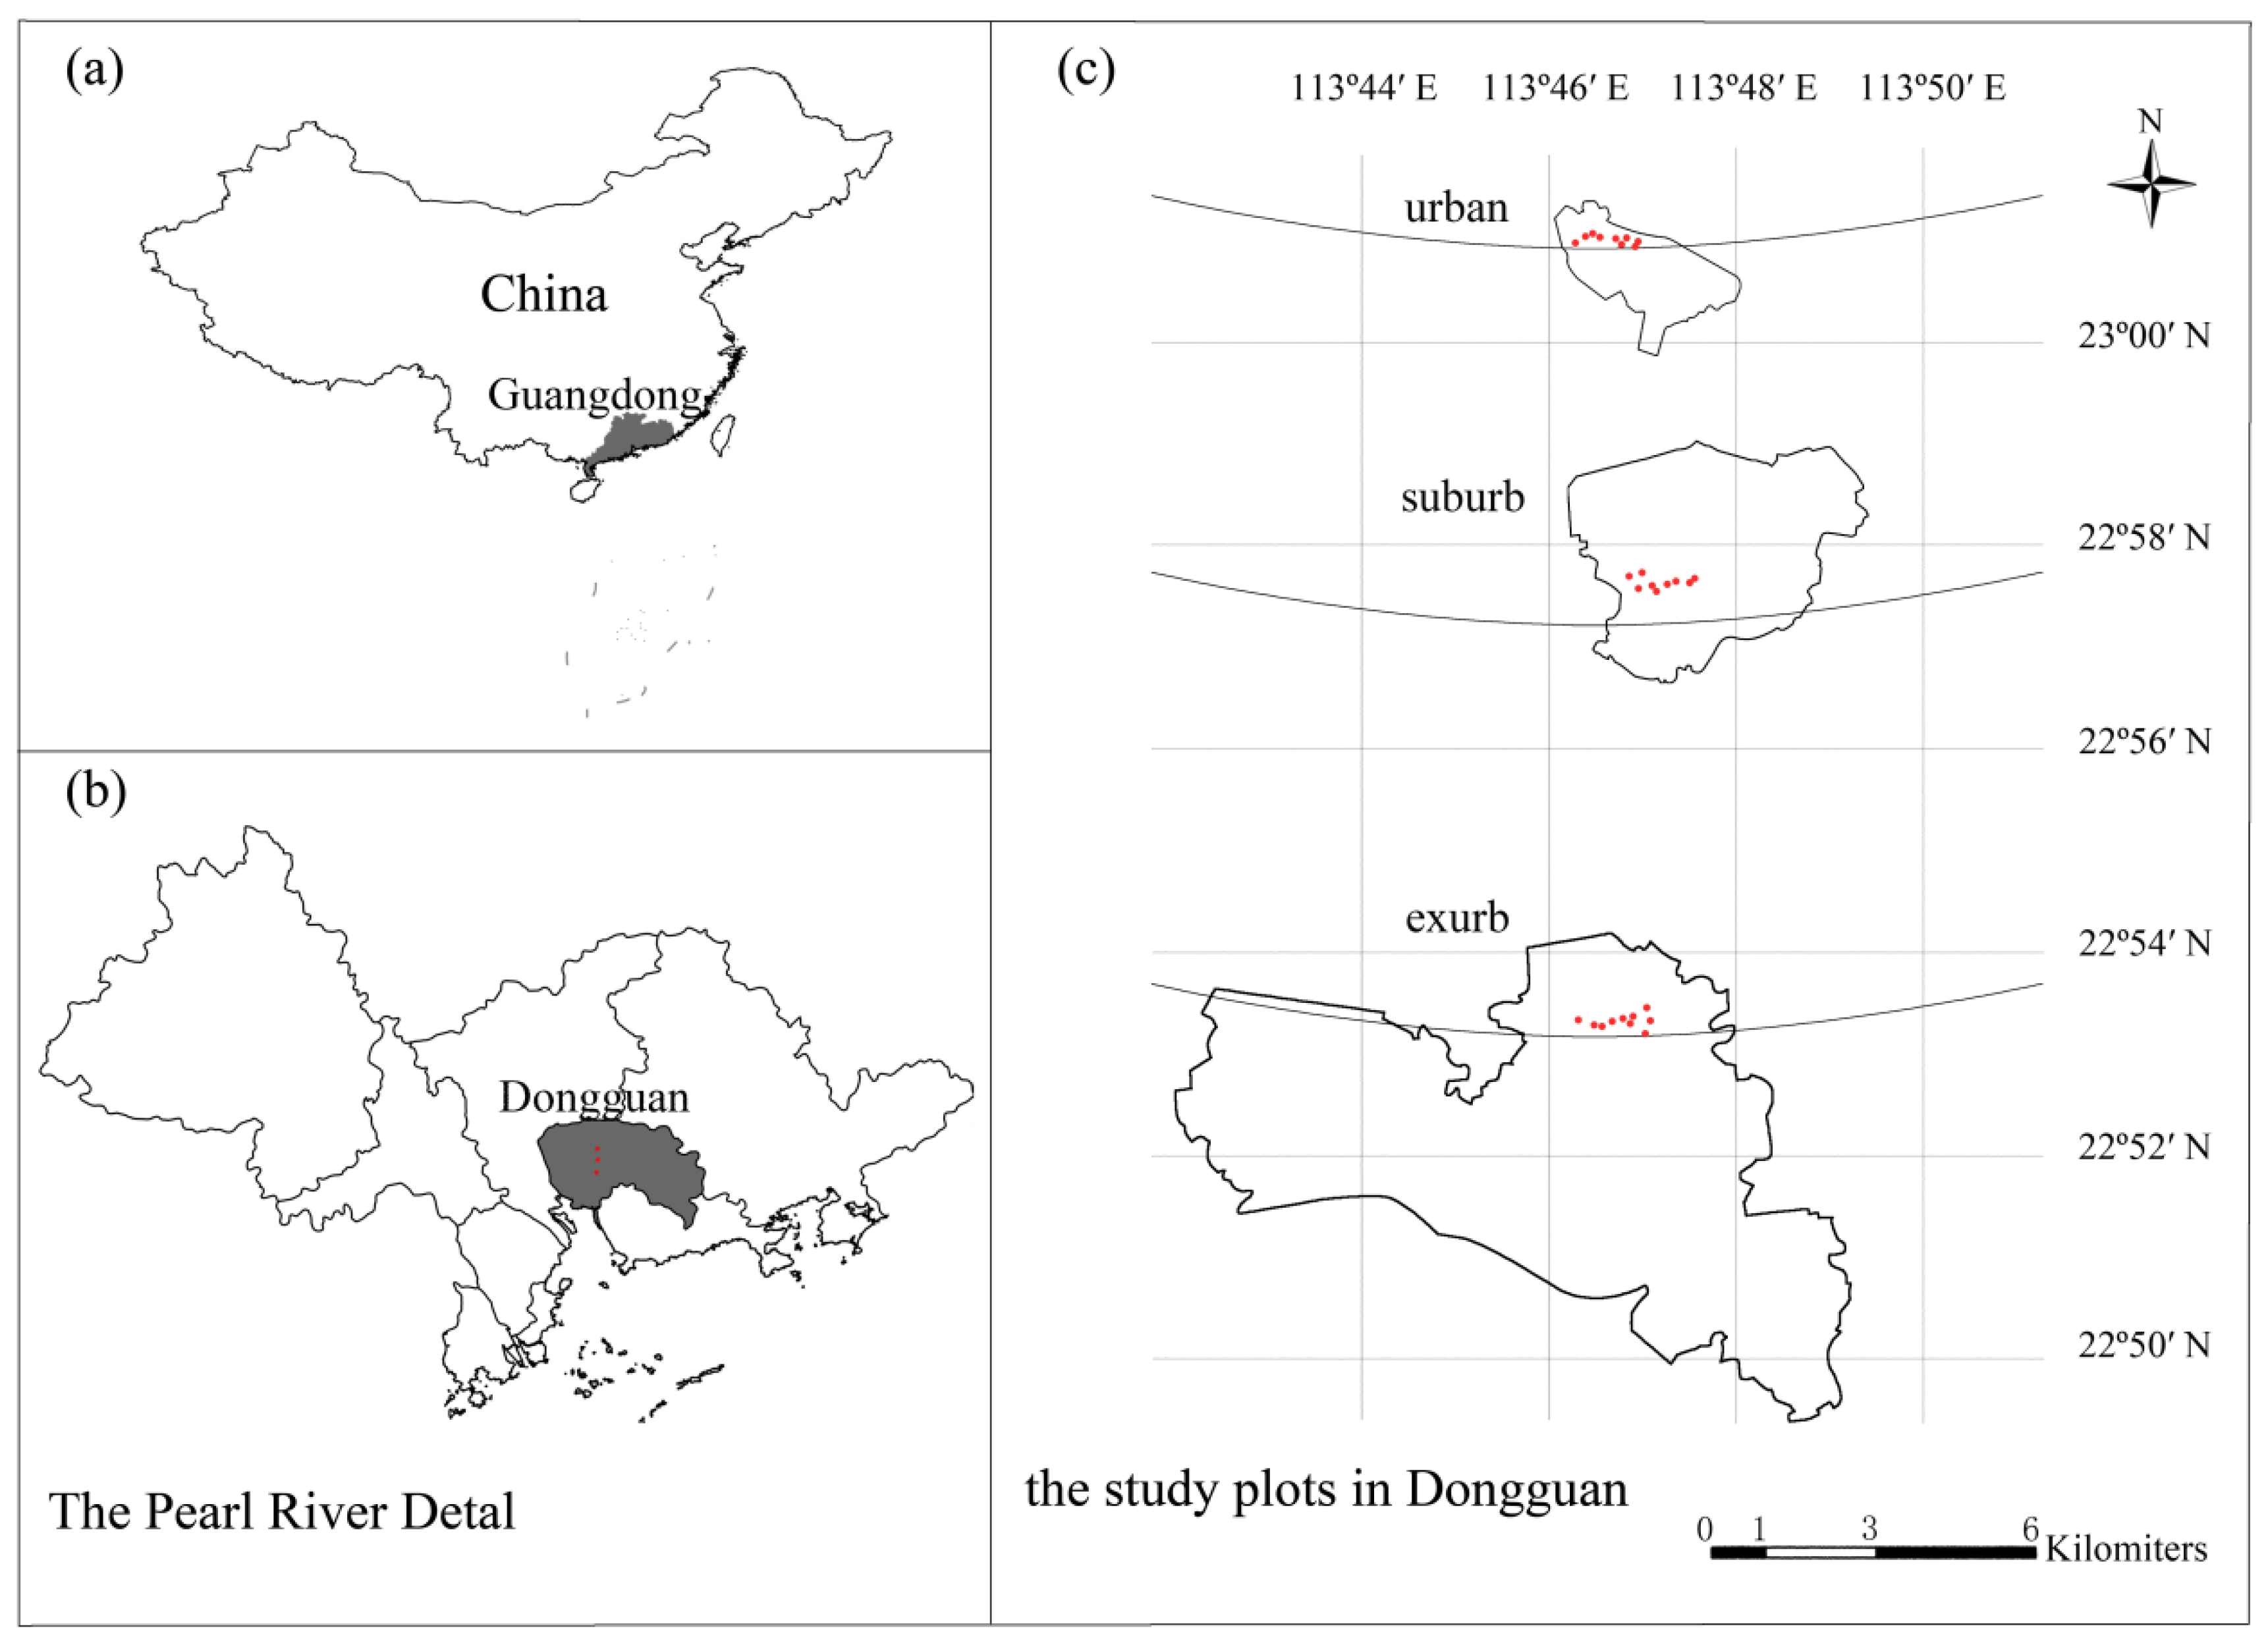
2.1. Study Site

We conducted our study in Dongguan (113°31′–114°15′ E, 22°39′–23°09′ N), which is located in the Pearl River Delta, South China (Figure 1). The climate in Dongguan is warm and humid. The annual average temperature is 22.1 °C, and the average temperatures during the hottest (July) and the coldest (January) months are 28.2 °C and 13.4 °C, respectively. The annual average precipitation is 1796 mm. The rainfall during the rainy season (April to September) accounts for approximately 80% of the precipitation during the whole year. The soil type is red and the soil texture is sandy and loam. The evergreen broad-leaved zonal forest is well preserved in the south of Dongguan [33]. Therefore, we selected the research sites from the city center to the south, with an almost consistent longitude.
We selected the following study sites: Qifeng Park (113°45′50″–113°46′26″ E, 23°00′50″–23°01′04″ N) in the urban areas, the Tongsha Ecological park (113°45′54″–113°46′45″ E, 22°57′45″–23°58′25″ N) in the suburban areas about 6 km from the city center, and the Dalingshan Forest Park (113°45′56″–113°46′46″ E, 22°52′28″–22°53′09″ N) in the exurban areas about 16 km from the city center. The population densities of the three sites decreased from urban to exurban areas [33]. Qifeng Park is located in the center of Dongguan with a high degree of disturbance. Plantation is the main vegetation type. Tongsha Ecological Park is located in the suburb of Dongguan. The vegetation types include mainly plantations and natural secondary forests. The existing subtropical evergreen broad-leaved forests are mainly artificial, and the natural secondary forests are mainly composed of evergreen shrubs and small trees. Dalingshan Forest Park is located in the exurb of Dongguan. The vegetation types mainly include secondary forests and plantations. The secondary forest is well preserved due to effective long-term protection (Table 1).

2.2. Experimental Design, Plant Census, and Soil Sampling

The experiment was carried out in Dongguan in January 2018. Nine independent plots with identical size (20 × 20 m) were randomly designated within each site for vegetation census and soil sampling. The space between each two plots was more than 20 m. In each plot, we recorded all trees (diameter at breast height (DBH) ≥ 3 cm) including the species name, DBH, and the number of stems. Four 25 m2 (5 × 5 m) subplots and five 1 m2 (1 × 1 m) subplots were selected in each plot for investigation of shrubs and herbs, respectively. In the shrub quadrats, the individual species name and their number were recorded. In the herb quadrats, the species name and cover were recorded. Plant traits used for analyses included diameter at breast height of trees (DBH), the number of tree stems (TS), tree richness (TR), shrub richness (SR), and herb richness (HR) (Table S1).
For soil sampling, after removing the litter layer, six samples were collected in an “S” shape (0–10 cm) and thoroughly mixed. Then, we removed impurities such as plant roots and stones to provide a composite soil sample in each plot. The composite soil sample was divided into two subsamples: one (>6 g) was immediately transferred into the portable ice box designed for microbial identification and another (>500 g) carried in a sealed bag for the determination of soil chemical properties. We also obtained soil samples from each plot using a cut ring (50 mm diameter) to measure the soil water content. All soil samples were collected within a single day.

2.3. Soil Physicochemical Properties

Soil water content (SWC) was calculated gravimetrically via oven drying to constant mass at 105 °C. Soil pH was measured via glass electrode method in a 1:2.5 (v/v) soil:water suspension. We determined soil organic carbon (SOC) using the K2Cr2O7 oxidation method and soil available nitrogen (AvN) via alkaline hydrolysis diffusion method. Soil available potassium (AvK), soil exchangeable calcium (Ca2+) and soil exchangeable magnesium (Mg2+) were determined via flame atomic absorption spectrophotometry after extraction with 1 mol·L−1 ammonium acetate. Soil available phosphorus (AvP) was determined using the molybdenum-antimony colorimetric method after extraction with 0.03 mol·L−1 ammonium fluoride and 1 mol·L−1 hydrochloric acid [34] (Table S1).

2.4. Soil Microbial Communities

Soil microbial DNA was extracted from fresh soil using a MOBIO PowerSoil® DNA Isolation Kit (MOBIO laboratories, Carlsbad, CA, USA) for the corresponding sample according to the manufacturer’s instructions. The concentration and purity of the extracted DNA were quantified using the NanoDrop One (Thermo Fisher Scientific, MA, USA). The 16S rRNA (for bacteria) and ITS3 (for fungi) genes of distinct regions were amplified using a specific primer with 12 bp barcode. Primers were synthesized by Invitrogen (Invitrogen, Carlsbad, CA, USA). PCR reactions, containing 25 μL 2x Premix Taq (Takara Biotechnology, Dalian Co. Ltd., China), 1 μL of each primer (10 mM) and 3 μL DNA (20 ng/μL) template in a volume of 50 µl, were amplified by thermocycling: 5 min at 94 °C for initialization; 30 cycles of 30 s each for denaturation at 94 °C, 30 s annealing at 52 °C, and 30 s extension at 72 °C; followed by a 10 min final elongation step at 72 °C.
PCR products were analyzed and purified by 1% agarose gel electrophoresis for further experiments. The selected PCR products were mixed in equidensity ratios according to the GeneTools Analysis Software (Version4.03.05.0, a division of Synoptics, Cambridge, England). The PCR product mixtures were purified with EZNA Gel Extraction Kit (Omega, USA). Sequencing libraries were finally generated using NEBNext® Ultra™ DNA Library Prep Kit for Illumina® (New England Biolabs, MA, USA), and sequenced on an IlluminaHiseq2500 platform to generate 250 bp paired-end reads (Guangdong Magigene Biotechnology Co.,Ltd. Guangzhou, China).
The paired-end raw reads were filtered to obtain the high-quality clean reads according to the Trimmomatic (V0.33, http://www.usadellab.org/cms/?page= Trimmomatic, Aachen, Germany). The paired-end clean reads were merged according to the degree of overlap between the paired-end reads by FLASH (V1.2.11, https://ccb.jhu.edu/software/FLASH/, MD, USA), and the spliced sequences designated as Raw Tags. Using Mothur software (V1.35.1, http://www.mothur.org, MA, USA), the sequences were assigned to each sample based on their unique barcode and primer, after which the barcodes and primers were removed to obtain the effective Clean Tags. Usearch software (V10, http://www.drive5.com/usearch/, CA, USA) was used to select operational taxonomic units (OTU) by combining the reads of clustered OTUs with 97% similarity. Finally, the normalized (subsampled) OTU table was obtained according to the sample with the least sequences. The OTU table with annotations of fungal taxonomy was then used to analyze ecological groups of fungi with FUNGuild software (MN, USA) [35]. The OTU table with annotations of bacterial taxonomy was then used with FAPROTAX (Vancouver, Cananda) software to find the bacterial functional group for each OUT [36].

2.5. Statistical Analyses

The Chao1 index and Shannon index of bacteria (Chao1B and ShannonB) and fungi (Chao1F and ShannonF) were calculated with QIIME (V1.9.1, http://qiime.org, CA, USA) based on bacterial and fungal OTUs. The Chao1 index indicated the microbial species richness, and the Shannon index represented both the microbial species richness and evenness.
Kruskal–Wallis nonparametric test was conducted to analyze the differences in soil properties, plant traits, microbial diversity, and the relative abundance of the main bacterial and fungal phyla and genera along the urban-to-rural gradient. The differences of both bacterial and fungal composition (OTUs) along the urban-to-rural gradient and the differences of both bacterial and fungal functional groups along the urban-to-rural gradient were detected by permutational multivariate analysis of variance (PerMANOVA) with 999 permutations. Redundancy analysis (RDA) was used to determine the correlation between the composition of bacterial and fungal communities, and soil properties and plant traits. Also, we used the Spearman correlation analyses to determine the relationship of bacterial and fungal diversities, composition, and bacterial and fungal functional groups with soil properties and plant traits. Furthermore, the contribution of soil properties and plant traits to the composition of bacterial and fungal community was identified via variation partitioning analysis (VPA) [37]. All analyses were conducted in R (3.4.4, Vienna, Austria) software with ‘agricolae’, ‘psych’, and ‘vegan’ packages. p value < 0.05 was considered statistically significant.

3. Results

3.1. Changes in Plant and Soil Variables

Plant and soil properties greatly varied along the urban-to-rural gradient displaying different trends in these variations (Table 2). Among plant traits, TR, SR, and TS significantly increased along the urban-to-rural gradient (p < 0.01), whereas HR and DBH showed the opposite trend. All the soil properties varied significantly along the urban-to-rural gradient (p < 0.05) except AvK. The soil was acidic and the pH decreased along the urban-to-rural gradient. SOC, AvN, and SWC were the highest in exurban areas. However, Ca2+ and Mg2+ had the highest values in urban area soils. AvP in the suburban areas was significantly higher than in urban and exurban areas (p < 0.01).

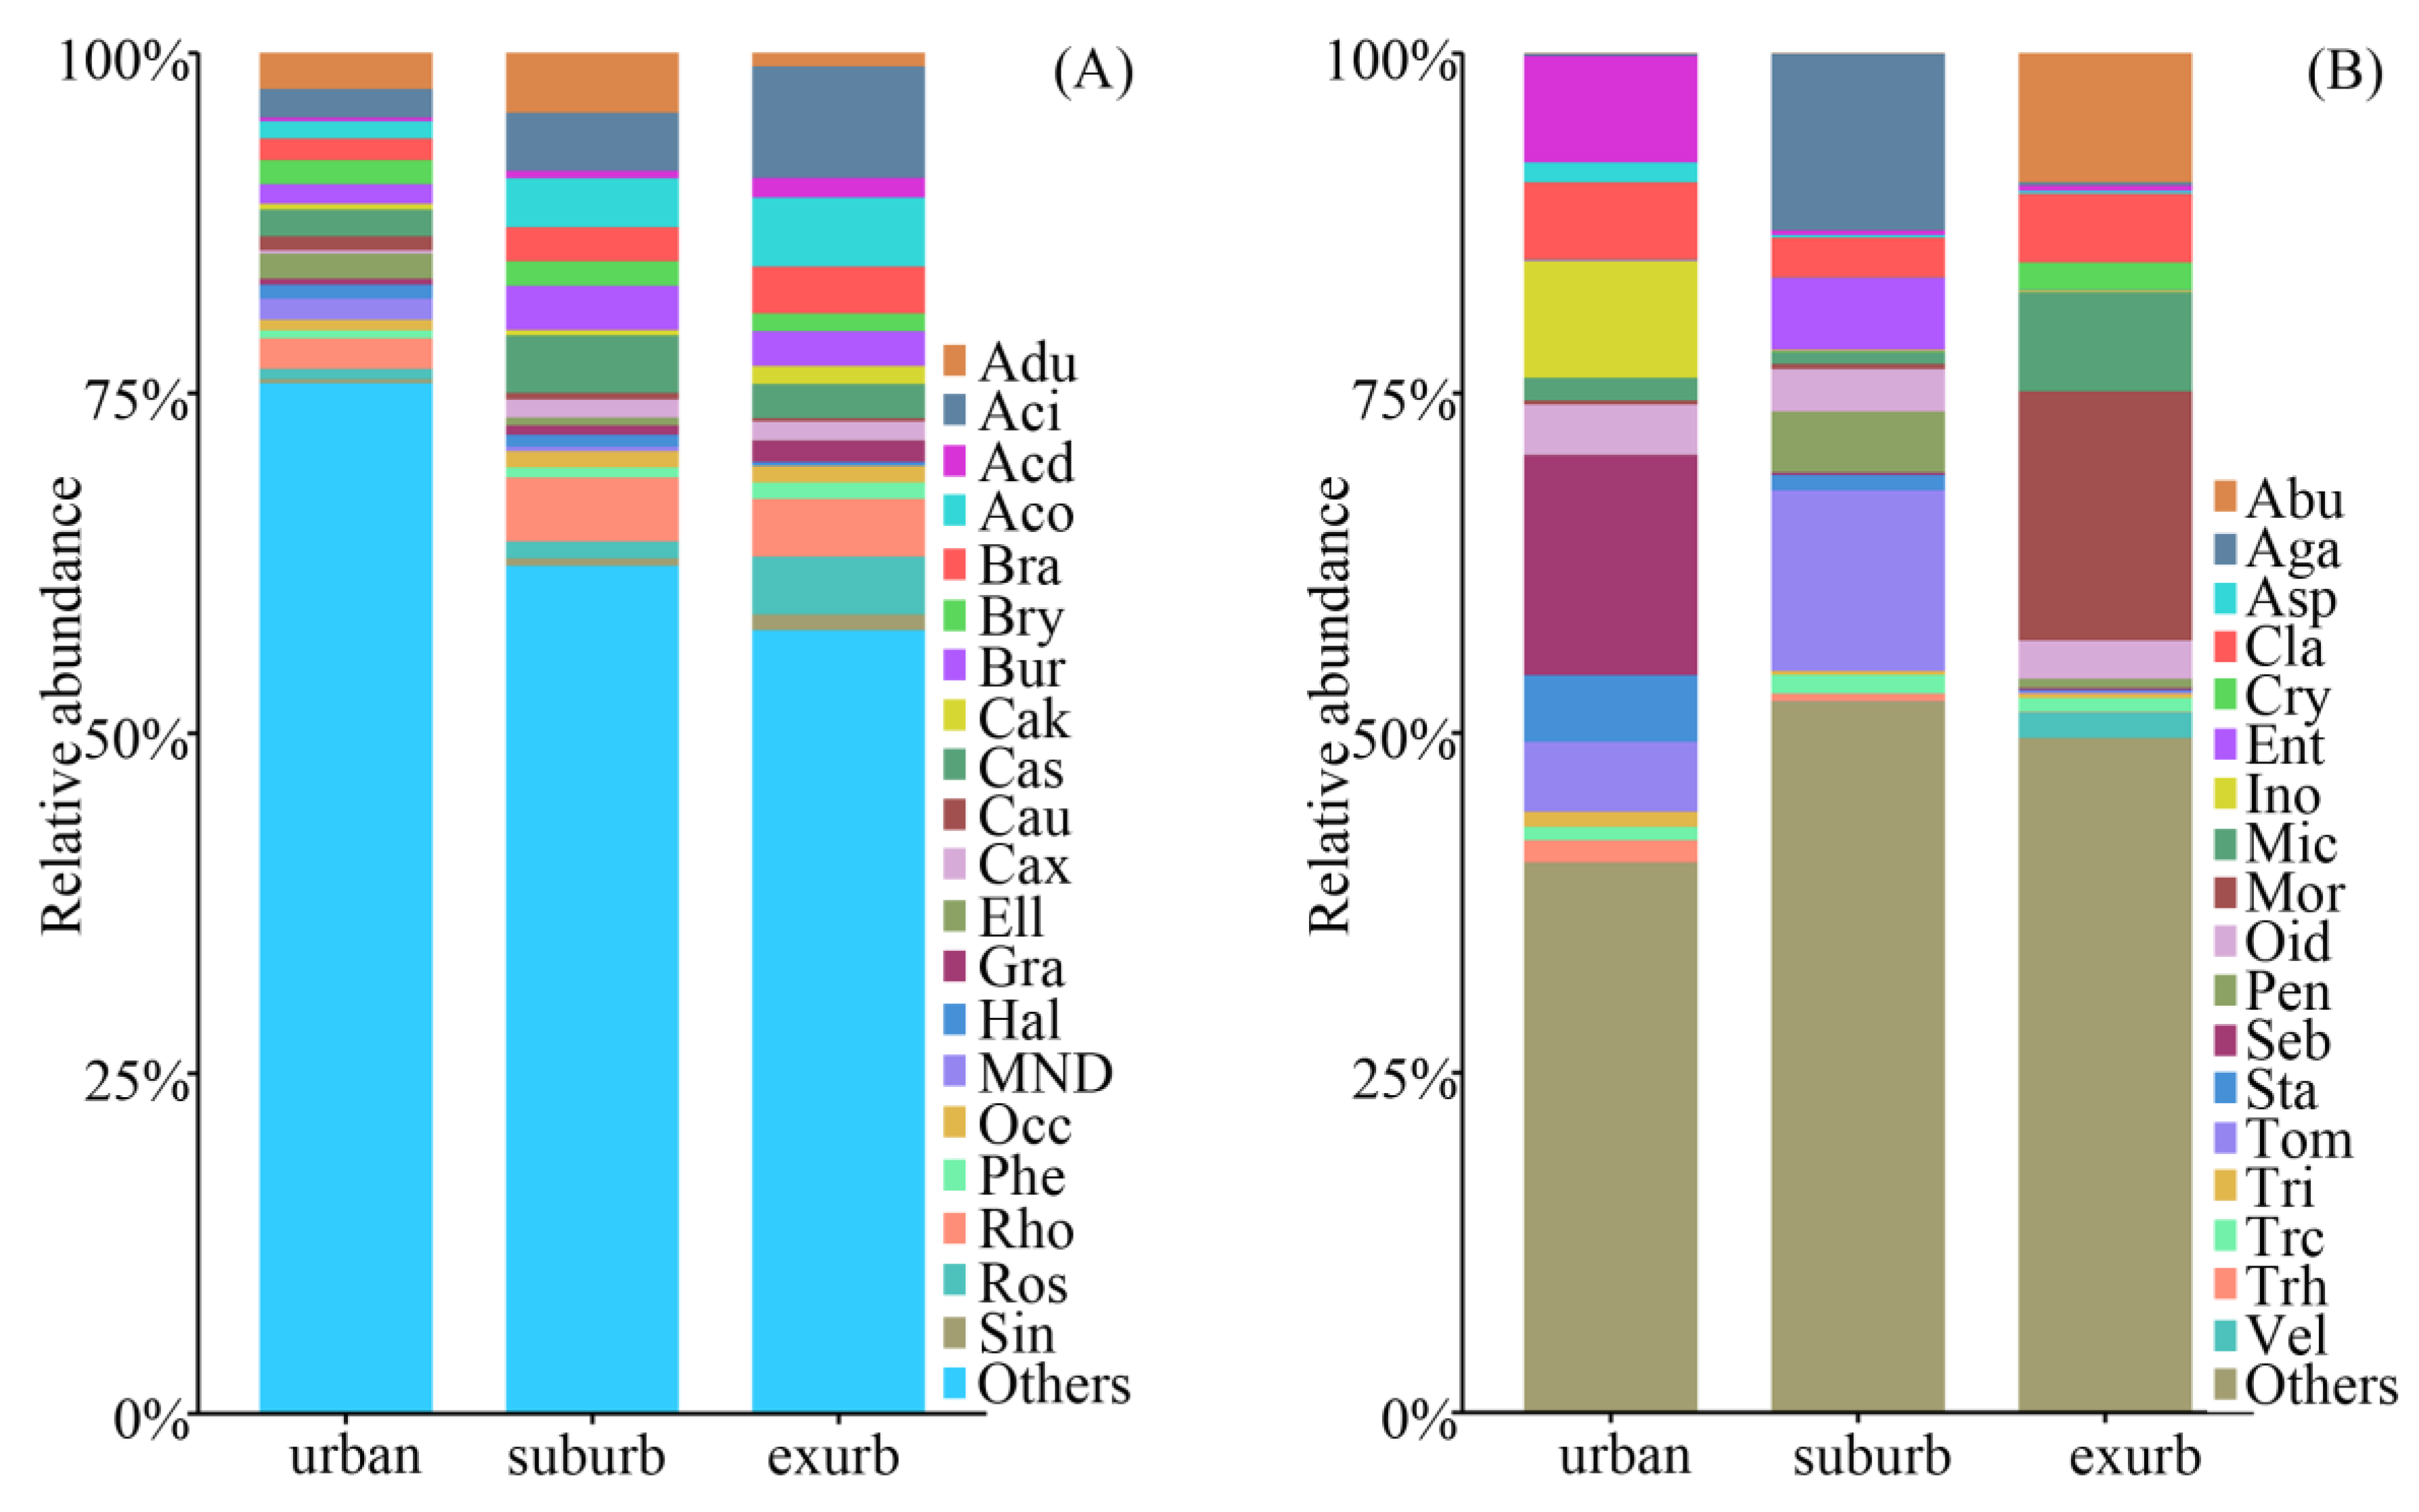
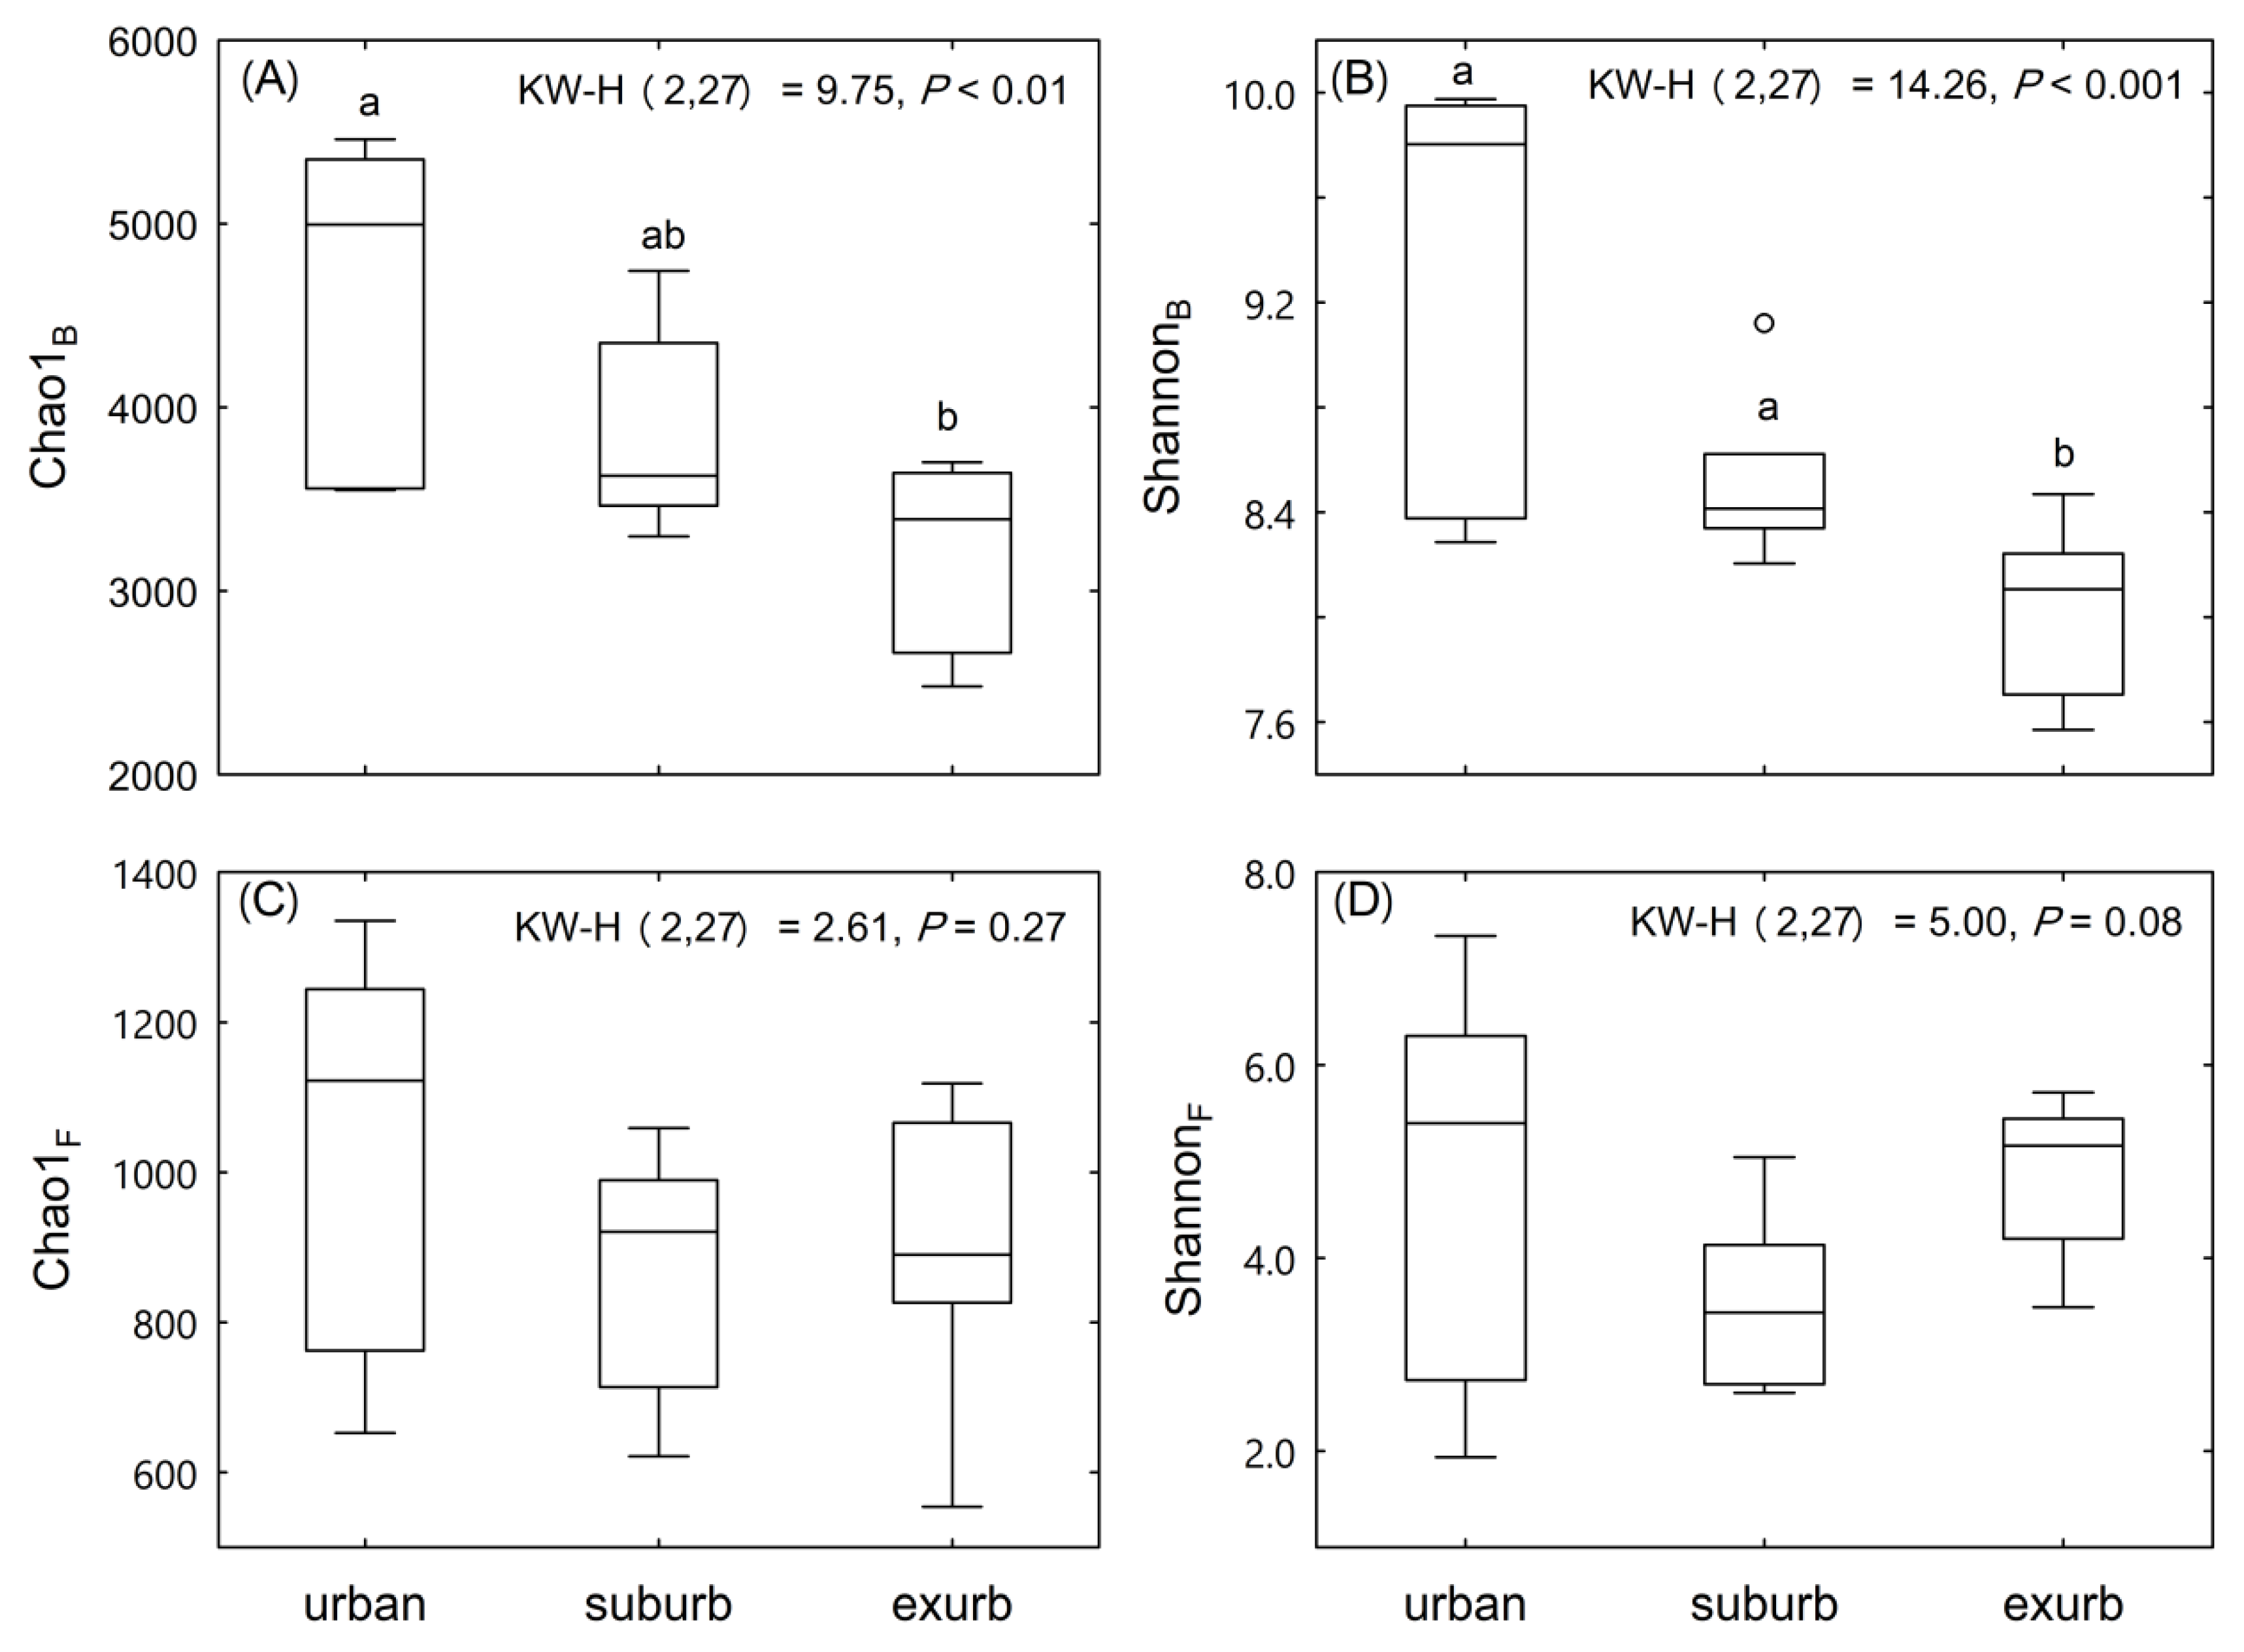
3.2. Communities of Soil Bacteria and Fungi

A total of 82,683 bacteria OTUs and 27813 fungi OTUs were identified in soil samples. The main bacterial phyla (relative abundance > 1%) across all samples were Proteobacteria, Acidobacteria, Actinobacteria, Verrucomicrobia, WPS-2, Planctomycetes, Chloroflexi, Bacteroidetes, Gemmatimonadetes, and Latescibacteria. Proteobacteria and Acidobacteria were the most abundant bacterial phyla constituting 40.94% and 25.73%, respectively (Figure S1A, Table S2). Except for the Acidobacteria, Chloroflexi, Planctomycetes, and Verrucomicrobia, the relative abundance of other main bacterial phyla differed significantly along the urban-to-rural gradient (p < 0.05, Table S2). Additionally, the relative abundance of Actinobacteria, Proteobacteria, and WPS-2 increased significantly along the urban-to-rural gradient, whereas those of Bacteroidetes, Gemmatimonadetes, and Latescibacteria decreased along the gradient (p < 0.05, Table S2). At the genus level, there were 20 main bacterial genera (relative abundance > 1%, Figure 2A). The relative abundance of all the main bacterial genera, except for Occallatibacter, exhibited a significant difference along the urban-to-rural gradient (p < 0.05, Table S2). Nine genera with the most abundance showed different trends. Bryobacter, from Acidobacteria, exhibited the lowest abundance in the exurban areas; however, another genus belonging to Acidobacteria, Candidatus_Solibacter, showed the highest abundance in the suburban areas (p < 0.05, Table S2). Within the Proteobacteria, the abundance of three genera (Acidibacter, Bradyrhizobium, and Roseiarcus) significantly increased from urban to exurban areas. The abundance of other two genera (Burkholderia-Caballeronia-Paraburkholderia and Rhodoplanes) in the urban areas was significantly lower than in suburban and exurban areas (p < 0.05, Table S2). Acidothermus in Actinobacteria also increased in the abundance along the gradient, and ADurb.Bin063-1 in Verrucomicrobia was predominant in suburban areas (p < 0.05, Table S2). The PerMANOVA analyses of bacterial OTUs indicated that the composition of bacterial community significantly differed along the urban-to-rural gradient (p < 0.001, Table S4).
Among the fungal communities, the main phyla (relative abundance > 1%) were Ascomycota (38.77%), Basidiomycota (50.71%), and Zygomycota (4.12%, Figure S1B, Table S3). Only the relative abundance of Zygomycota showed a significant difference along the urban-to-rural gradient (p < 0.05, Table S3). At the genus level, the fungal genera varied greatly along the urban-to-rural gradient (Figure 2B, Table S3). There were 19 main fungal genera (relative abundance > 1%), and the relative abundance of almost half of which significantly differed along the urban-to-rural gradient (p < 0.05, Table S3). The relative abundance of Aspergillus, Staphylotrichum, and Trichocladium belonging to Ascomycota, and Tomentella and Trichosporon included in Basidiomycota was significantly higher in the urban than in exurban areas. Howerver, Oidiodendron, from Ascomycota, and Abundisporus, Entoloma, and Veluticeps from Basidiomycota had the highest abundance in exurban areas (p < 0.05, Table S3). The PerMANOVA analyses of fungal OTUs also indicated that the composition of fungal community significantly differed along the urban-to-rural gradient (p < 0.001, Table S4).
Both indices (Chao1 and Shannon) characterizing the diversity of bacterial communities decreased significantly along the urban-to-rural gradient (Figure 3A,B). At the same time, diversity of fungal communities did not vary significantly along the gradient (Figure 3C,D).

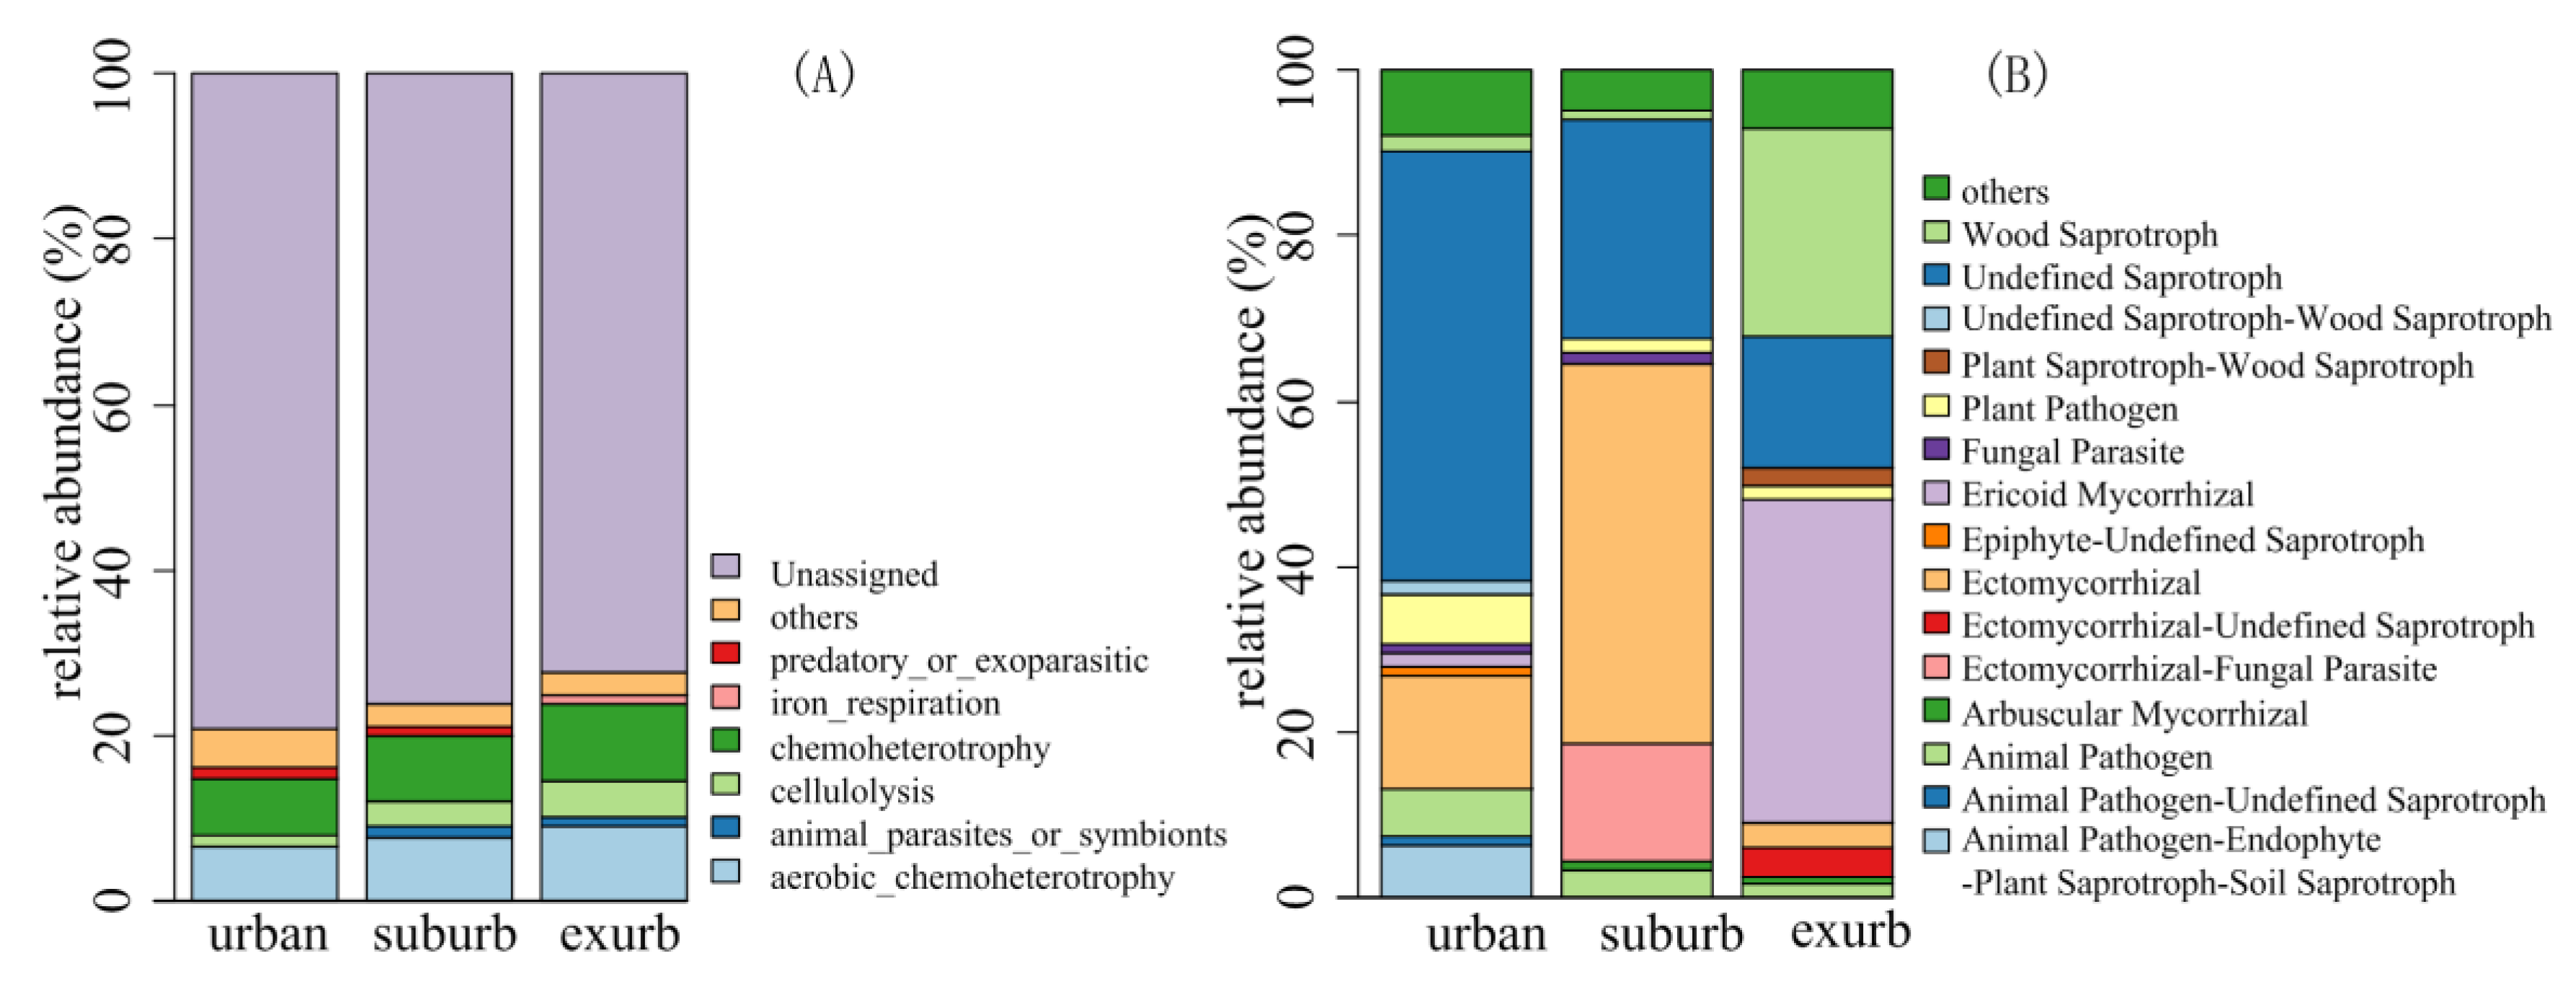
3.3. Bacterial and Fungal Functional Groups

FAPROTAX assigned 108,854, 128,508, and 153,970 squences to 62, 61, and 62 bacterial functional groups in urban, suburban, and exurban areas, respectively. The main six abundant groups were influenced by urban-to-rural gradient (Figure 4A). The relative abundance of chemoheterotrophy, aerobic_chemoheterotrophy, cellulolysis, and iron_respiration was higher in exurban areas than in suburban and urban areas. However, the relative abundance of predatory_or_exoparasitic increased in urban areas (Figure 4A). The PerMANOVA analyses indicated that the composition of bacterial functional groups significantly differed along the urban-to-rural gradient (p < 0.01, Table S5).
FUNGuild assigned 32,878, 51,000, and 39,390 sequences to 59, 54, and 58 fungal functional guilds in urban, suburban, and exurban areas, respectively, with the “confidence ranking” of “highly probable” or “probable”. There were 15 main guilds (Figure 4B). For example, the relative abundance of wood saprotroph and ericoid mycorrhizal fungi was the highest in exurban areas than in urban and suburban areas. The guilds of undefined saprotroph, plant pathogen, animal pathogen, and animal pathogen-endophyte-plant saprotroph-soil saprotroph were most abundant in urban areas (Figure 4B). The PerMANOVA analyses also indicated that the composition of fungal functional guilds were significantly influenced by the urban-to-rural gradient (p < 0.01, Table S5).

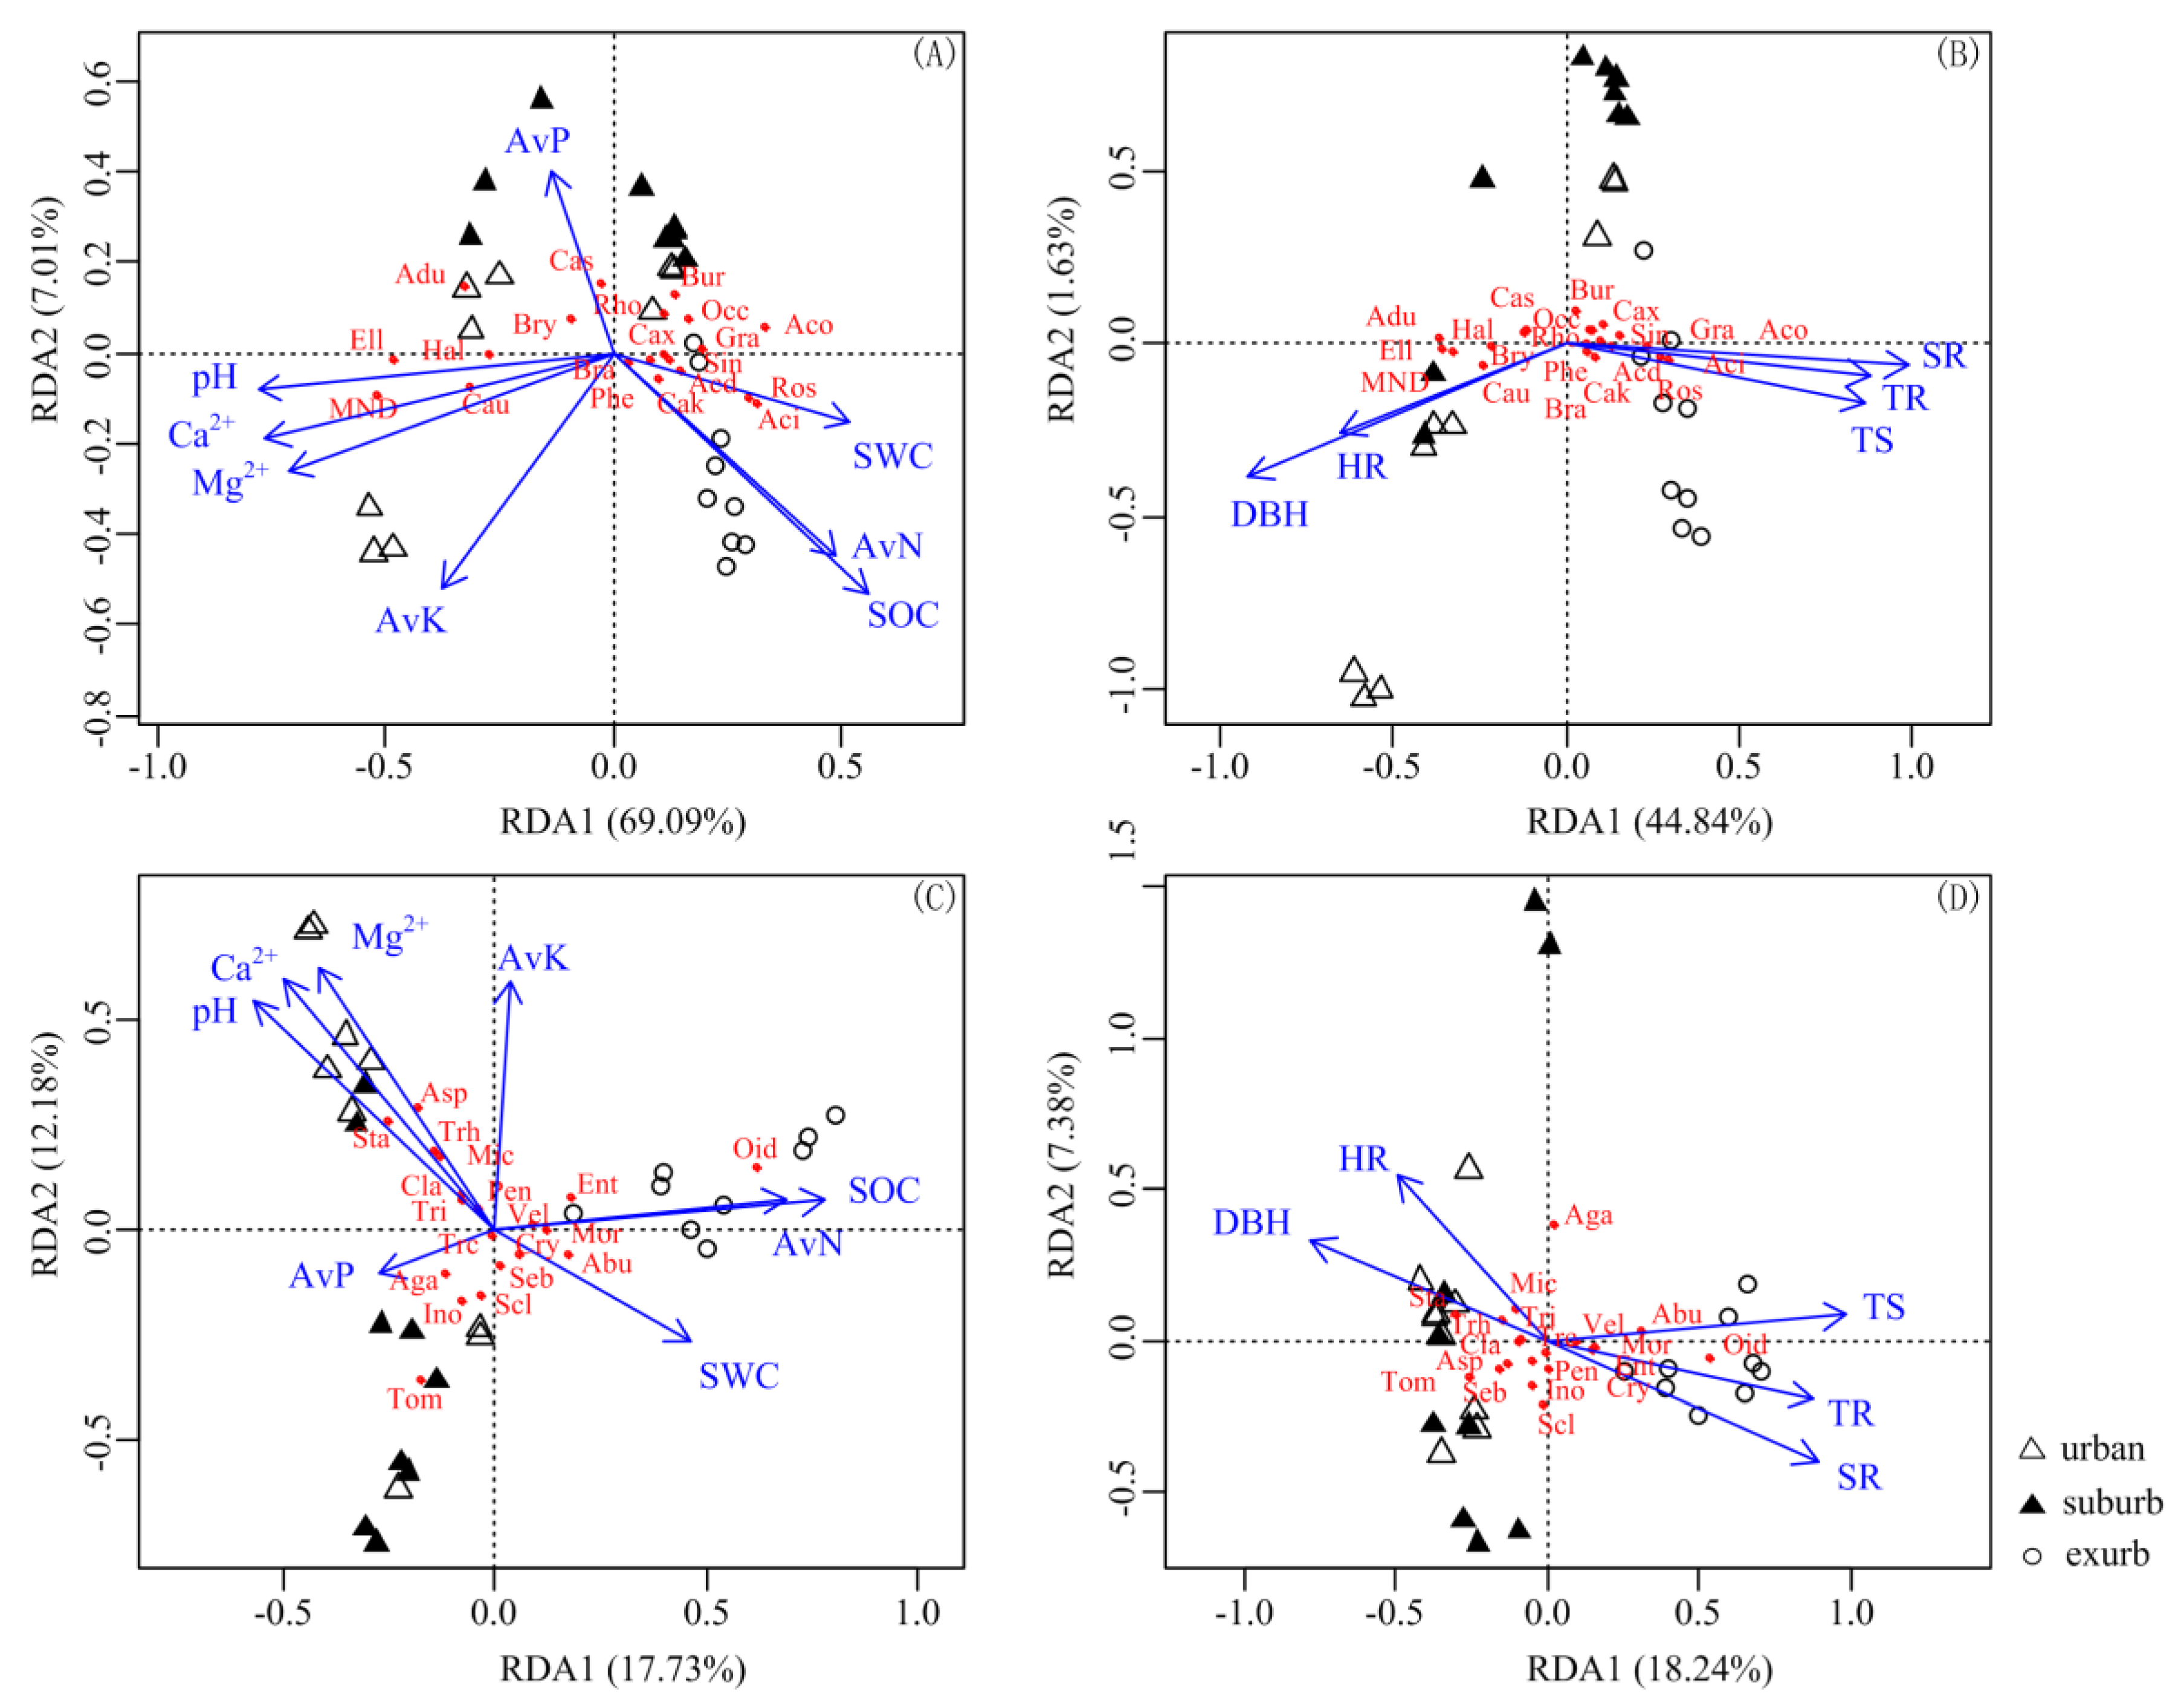
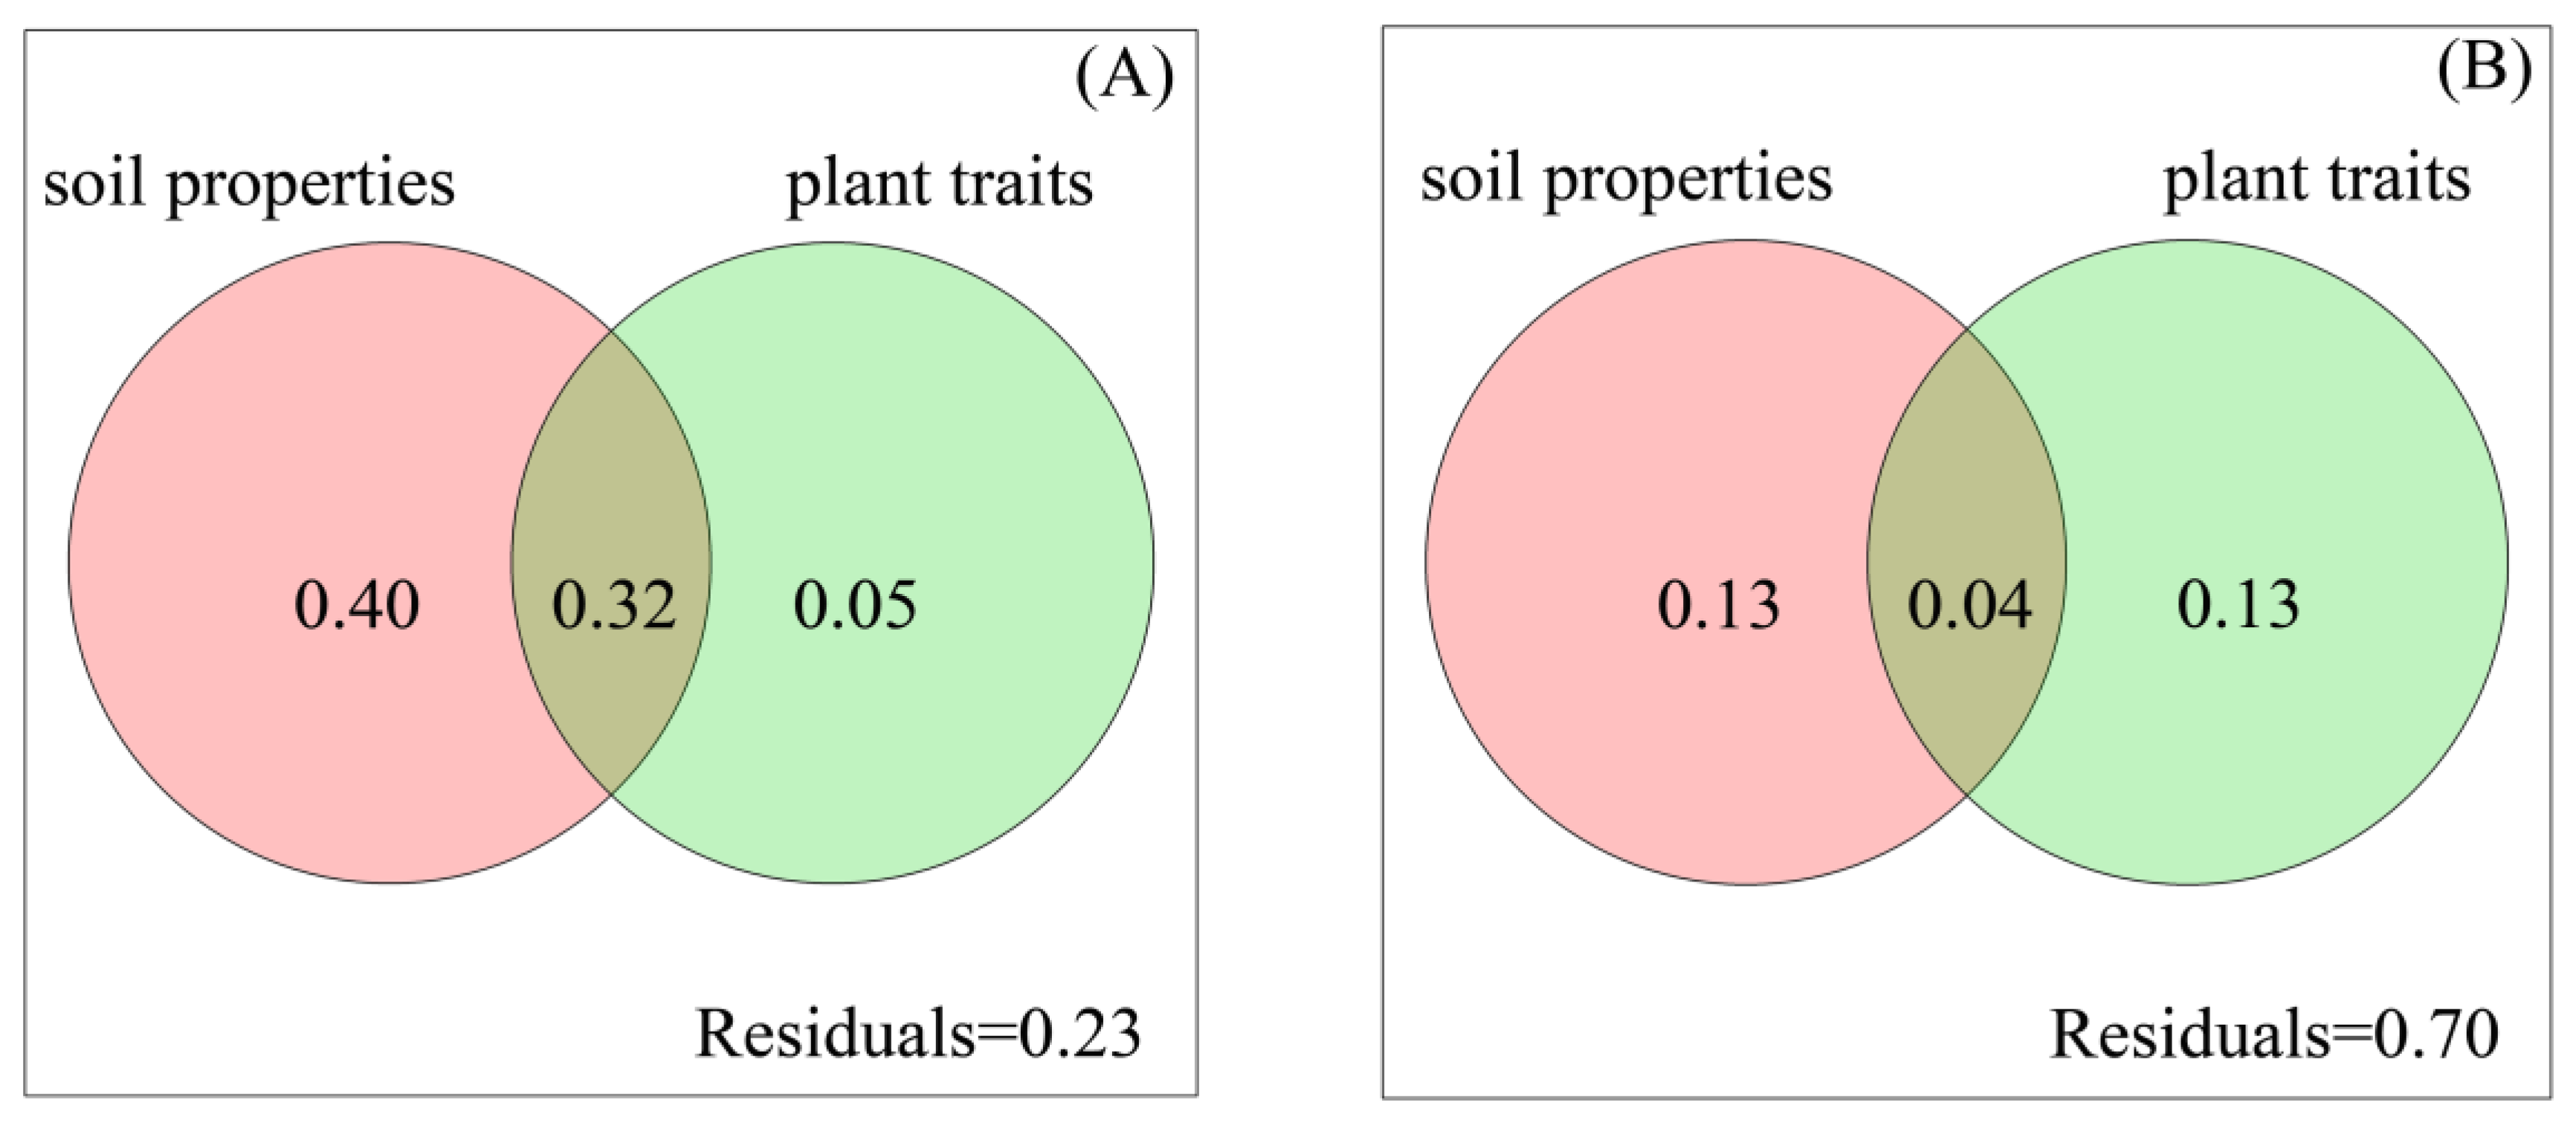
3.4. Correlation of Characteristics of Soil Bacterial and Fungal Communities with Plant and Soil Variables

According to Spearman correlation analyses, DBH, TS, TR, SR, HR, pH, SOC, Ca2+, Mg2+, and SWC significantly influenced six bacterial functional groups (p < 0.05, Table S6). For fungal functional groups, the abundance of wood saprotroph was negatively correlated with DBH and pH, while positively with TS, TR, SR, SOC, and AvN. The abundance of ericoid mycorrhizal fungi was correlated with plant traits and soil properties except for AvK. The abundance of animal pathogen and animal pathogen-endophyte-plant saprotroph-soil saprotroph was positively correlated with Ca2+ and Mg2+. The abundance of plant pathogen was positively and significantly associated with pH, but negatively with TS, TR, SOC, and AvN (p < 0.05, Table S6).
According to Spearman correlation analyses, the diversity of bacterial communities (Chao1B, ShannonB) was strongly correlated with almost all plant and soil variables (Table 3). However, the fungal diversity was not influenced by plant and soil variables (Table 3).
The Redundancy analyses (RDA) and Spearman correlation analyses indicated that plant traits including TS, DBH, TR, SR, and HR significantly affected the bacterial composition. SR was the most important factor, while HR had the least effect (Figure 5B and Figure S2B, Tables S7, S8, and S11). Among soil properties, pH, SOC, Ca2+, and Mg2+ were identified as the most important predictors of bacterial composition (Figure 5A and Figure S2A, Tables S7, S8, and S11). AvP did not influence the bacterial community significantly (Table S11). The changes in the abundance of Proteobacteria, Bacteroidetes, and WPS-2 were related to plant traits (SR, TR, TS, and DBH) and soil properties (pH, Ca2+, Mg2+, SOC, and SWC) (Figure S2A,B, Table S7). Moreover, the abundance of Acidibacter and Roseiarcus in Proteobacteria was positively associated with SWC, AvN, SOC, SR, TR, and TS, but negatively correlated with pH, Ca2+, Mg2+, and DBH; however, the effect of the observed factors on the other three genera (Ellin6067, Haliangium, and MND1) belonging to Proteobacteria was opposite (Figure 5A,B, Table S8).
The plant and soil properties had no effect on fungal community at the phylum level (p > 0.05, Figure S2C,D). However, plant traits including TS, DBH, TR, SR, and HR significantly affected the fungal composition at the genus level. SR and TS influenced fungal composition the most at the genus level (Figure 5D, Tables S10 and S11). Among soil properties, SOC, pH, AvN, Ca2+, and Mg2+ most significantly affected the fungal composition at the genus level (Figure 5C, Tables S10 and S11). Similarly, AvP did not influence the fungal community significantly (Table S11). In addition, only the abundance of Zygomycota was positively and significantly correlated with SOC, AvN, SWC, and SR, but negatively with pH and DBH (Table S9). SOC, AvN, SWC, TS, TR, and SR positively influenced the aboundance of Oidiodendron, from Ascomycota, whereas pH, Ca2+, Mg2+, and DBH had negative influence. However, SOC, AvN, SWC, TS, TR, and SR negatively influenced the aboundance of Staphylotrichum in Ascomycota, pH, Ca2+, Mg2+, and DBH had positive influence (Figure 5C,D, Table S10).
Variation partitioning analysis (VPA) indicated that 76% of variation in bacterial community at the phylum level (Figure S3A), and 77% at the genus level were attributed to plant and soil variables (Figure 6A). Soil properties contributed to higher variation in bacterial community compared with plant traits (Figure 6 and Figure S3A). However, a large proportion of variation in fungal community could not be explained by plant and soil variables (Figure 6B and Figure S3B). More importantly, plant and soil variables did not significantly affect fungal community at the phylum level (Figure S3B), but significantly affected fungal community at the genus level (Figure 6B). The result showed that soil properties had a greater effect on bacterial than on fungal composition at genus level. By contrast, plant traits contributed more to fungal than to bacterial composition at genus level.

4. Discussion

4.1. The Composition and Diversity of Soil Microbial Community Varied Along the Urban-To-Rural Gradient

The composition and diversity of soil microbial communities are closely related to urbanization [38]. Our results confirmed that the urban-to-rural gradient affected the composition of soil microbial community, with varying degrees of influence on bacterial and fungal communities (Figure 2, Figure 3, and Figure S1, Tables S2 and S3). Along the urban-to-rural gradient, the relative abundance of the main bacterial phyla and genera differed significantly (Figure 2 and Figure S1, Tables S2). The relative abundance of main fungal genera differed significantly along the urban-to-rural gradient (Figure 2, Table S3). In addition, the PerMANOVA analyses showed that the composition of both bacterial and fungal OTUs had significant difference along the urban-to-rural gradient (Table S4). This result indicates that bacteria respond to urbanization via changes in relative abundance at the phylum and genus level, while fungi respond to urbanization via changes in relative abundance at the genus level. Further, we found that bacterial diversity decreased significantly along the urban-to-rural gradient, whereas the fungal diversity did not change significantly (Figure 3). Our results are similar to the studies of Barrico et al. [29]. With the intensity of urbanization, a few main bacteria OTUs are suppressed, while the survival of other OTUs were promoted in specific habitats. In addition, disturbances can increase environmental heterogeneity, creating more diverse niches for coexistence of other OTUs. Therefore, the diversity of bacteria is higher in urban areas with large disturbance. Moreover, due to the high functional redundancy of bacteria community [39], higher bacterial diversity contributes to maintaining the ecosystems stability.
According to the bacterial and fungal functional groups analyses, our results indicated that the urban-to-rural gradient significantly impacted the composition of bacterial and fungal functional groups. The relative abundance of chemoheterotrophy, aerobic_chemoheterotrophy, cellulolysis, wood saprotroph, and ericoid mycorrhizal fungi was the highest in exurban areas. Chemoheterotrophic bacteria and aerobic_chemoheterotrophic bacteria utilize the soil organic carbon which is higher in exurban areas. Because the secondary forest is well preserved in exurban areas, there are more litter and coarse woody debris containing lignin, cellulose, and hemicellulose in exurban areas. Wood saprotroph can decompose lignin, cellulose, and hemicellulose; therefore, the relative abundance of wood saprotroph fungi was higher in exurban areas. In addition, the spearman correlation analyses showed wood saprotroph fungi was highly correlated with SR and TR, wich showed the highest value in exurban areas (Table S6). Ericoid mycorrhizal fungi, limited of Ericaceae [40], have a strong ability to take up phosphorus directly from organic matters [41]. Our study showed that ericoid mycorrhizal fungi were negatively correlated with available phosphorus (Table S6), and the available phosphorus was the lowest in exurbs (Table 1). Moreover, the Ericaceae plants are abundant in exurban areas, especially Rhododendron moulmainense. Therefore, the relative abundance of ericoid mycorrhizal fungi was the highest in exurban areas. Moreover, the higher relative abundance of plant and animal pathogens in urban areas indicates that urbanization can increase the potential risk of pathogen infection.
Our results indicated that the urban-to-rural gradient significantly affected the composition of soil bacterial communities at the level of phyla, genera, and OTUs and fungal communities at the level of genera and OTUs. The bacterial diversity was significantly influenced by the urban-to-rural gradient, while the fungal diversity was not.

4.2. Plant and Soil Variables Significantly Affect Soil Bacterial Diversity, but Not Fungal Diversity

Along the urban-to-rural gradient, differences in plant and soil variables explain changes in soil microbial communities [29]. Our results showed that soil bacterial diversity was the highest in urban areas and the lowest in exurban areas. However, fungal diversity did not vary significantly along the urban-to-rural gradient (Figure 3) because urbanization-induced changes in plant and soil variables (TR, SR, TS, DBH, pH, SOC, AvN, Ca2+, Mg2+, SWC) significantly affect bacterial diversity but not fungal diversity. Generally, soil microbes interact with plants, with synergistic as well as positive or negative feedback effects [42]. Therefore, we expect a significant correlation between microbial diversity and plant diversity. However, we found that only bacterial diversity was significantly related to TR, SR, TS, DBH, while fungal diversity was not correlated with plant traits. Hu et al. [20] also found that fungal diversity was weakly related to plant diversity in the forests of five climate regions in China; similarly, plant diversity did not determine fungal diversity at a global scale [43]. However, Hiiesalu et al. [44] found that plant diversity determined fungal diversity at a regional scale in temperate pine forests. This finding indicates that the relationship between fungal diversity and plant communities is very complex and depends on spatial scales.

4.3. Soil Properties Affect Bacterial Composition More Than Fungal Composition, While Plant Traits Affect Fungal Composition More Than Bacterial Composition

The changes in soil microbial communities along the urban-to-rural gradient and the relationship between soil microbial diversity and plant and soil variables are described above. However, the link between soil microbial composition and plant and soil variables remains unclear. In this study, we found that plant and soil variables explained large variation in the bacterial community composition, with 76% and 77% at the phylum and genus level, respectively (Figure 6A and Figure S3A). However, plant and soil variables did not significantly affect fungal community at the phylum level and explained 30% of variation in fungal community composition at the genus level (Figure 6B and Figure S3B). Both RDA and VPA showed that explanatory variables contributed to significant variation in fungal composition at the genus level (Figure 5C,D and Figure 6B). Studies have shown that fungal community composition is mainly affected by climatic factors (rainfall and temperature) [18]. The heat island effect caused by urbanization raises the urban temperature significantly higher than that of suburban and exurban areas [2]. Therefore, temperature may be an important factor affecting the composition of fungal community in urban forest soils.
We found that TR and SR had a greater impact on soil bacterial and fungal composition, whereas HR had less impact (Tables S7–S10). Therefore, woody plants had a stronger effect than herbs on soil microbial community. The study of Hu et al. [20] reported similar results. We also found that the effect of plant diversity on soil fungal composition was stronger than on bacterial composition at genus level (Figure 6). Fungi are the major organisms that can decompose woody litter containing lignin, which accounts for 60–75% of woody litter affected by plant diversity [45]. Moreover, mycorrhizal fungi develop a symbiosis with plants [46]. Therefore, plant diversity explained more variations in fungal composition (13% of variation at genus level, Figure 6B) than in bacterial composition (5% of variation at genus level, Figure 6A). However, only a small proportion of variation in fungal composition was explained by plant diversity. Perhaps plant composition greatly influences fungal composition [17,20].
Moreover, soil pH and SOC largely affect soil bacterial community composition. Soil pH, SOC, and AvN were the important factors influencing soil fungal community composition (Table S11), which was similar to the results of other studies [21,23]. Notably, we found strong effects of Ca2+ and Mg2+ on soil bacterial and fungal composition (Table S11). Barrico et al. [29] also showed that Mg2+ was an important factor affecting the fungi community. Our research sites were located in urban parks and subjected to human disturbance, such as artificial fertilization. Since calcium and magnesium are essential trace elements in plants, MgSO4 is often used by gardeners for the management of garden plants, releasing large amounts of magnesium within a short time [47]. Treatment of ornamental plants in urban parks with artificial fertilizers raises the soil content of magnesium and calcium. Soil microbes facilitate the absorption of trace elements by plants. Therefore, in urban forests, due to human disturbance (fertilizers, etc.), the content of soil Ca2+ and Mg2+ is changed, resulting in a strong correlation between soil microbial community and levels of Ca2+ and Mg2+. Overall, these results support the hypothesis that plant and soil variables significantly affected the composition of soil bacterial and fungal composition. The influence of trees and shrubs on the composition of soil microbial community was larger than that of herbs. Soil properties exert larger effect on bacterial than on fungal composition at genus level, while plant variables had larger effect on fungal than on bacterial composition at genus level.

5. Conclusions

The results demonstrated that urbanization affected the composition and diversity of soil bacteria and fungi. The composition of soil bacterial communities at the level of phyla, genera, and OTUs and fungal communities at the level of genera and OTUs significantly varied along the urban-to-rural gradient. The bacterial diversity decreased significantly along the urban-to-rural gradient. However, fungal diversity did not significantly differ along the urban-to-rural gradient. Moreover, the composition of both soil bacterial and fungal communities varied in response to plant and soil variables. Soil properties had a greater effect on bacterial than on fungal composition at genus level. By contrast, plant traits contributed more to fungal than to bacterial composition at genus level. Trees and shrubs had a higher impact than herbs on the microbial community composition. Among soil properties, in addition to pH, SOC, and AvN, the changes in soil Ca2+ and Mg2+ caused by urbanization had a significant impact on soil bacterial and fungal communities.

Supplementary Materials

The following are available online at https://www.mdpi.com/1999-4907/10/9/797/s1, Figure S1: Relative abundance of bacterial phyla (A) and fungal phyla (B) along the urban-to-rural gradient at the Dongguan city, southern China, Figure S2: RDA plot showing influence of soil properties and plant traits on the distribution of main phyla in soil bacterial (A and B) and fungal (C and D) communities, Figure S3: The proportions of variation at phylum level in composition of soil bacterial community (A) and soil fungal community (B) composition explained by soil and plant variables, Table S1: Abbreviations and corresponding full names of plant traits and soil properties in this paper, Table S2: Relative abundance of bacterial composition along the urban-to-rural gradient at phylum and genus level, Table S3: Relative abundance of fungal composition along the urban-to-rural gradient at phylum and genus level, Table S4. The PerMANOVA analyses of bacterial and fungal OTUs along the urban-to-rural gradient, Table S5: The PerMANOVA analyses of bacterial and fungal functional groups along the urban-to-rural gradient; Table S6. Spearman correlation of bacterial and fungal functional groups with plant and soil variables, Table S7: Spearman correlation of bacterial composition with plant and soil variables at phylum level, Table S8: Spearman correlation of bacterial composition with plant and soil variables at genus level, Table S9: Spearman correlation of fungal composition with plant and soil properties at phylum level, Table S10: Spearman correlation of fungal composition with plant traits and soil properties at genus level, Table S11: The results of RDA monte carlo tests of soil bacterial and fungal community compositions.

Author Contributions

L.Z. and X.T. conceived and designed the experiments. X.T. and L.K. performed field surveys and collected the data. X.T. analyzed the data, prepared the figures and tables, and wrote the first draft. Z.S., X.L. and L.Z. reviewed and edited the manuscript.

Funding

This research was funded by the Guangdong Provincial Special Fund for Forestry Development and Protection (Forestry Science and Technology Innovation Project 2017KJCX037/2019KJCX007), Guangdong Natural Science Foundation (2015A030313403) and State Forestry Administration (2130211).

Acknowledgments

We thank Linying Cai, Xingyuan Zhang for their assistance with plot establishment and field data collection, Qifeng Mo for his comments and discussions on the early version of the manuscript.

Conflicts of Interest

The authors declare no conflict of interest.

References

  1. Department of Economic and Social Affairs. 2018 Revision of World Urbanization Prospects; United Nations: New York, NY, USA, 2018. [Google Scholar]
  2. Li, X.M.; Zhou, W.Q. Optimizing urban greenspace spatial pattern to mitigate urban heat island effects: Extending understanding from local to the city scale. Urban For. Urban Green. 2019, 41, 255–263. [Google Scholar] [CrossRef]
  3. Yazdi, S.K.; Dariani, A.G. CO2 emissions, urbanisation and economic growth: Evidence from Asian countries. Econ. Res.-Ekon. Istraz. 2019, 32, 510–530. [Google Scholar] [CrossRef]
  4. Cui, Y.Z.; Zhang, W.S.; Bao, H.J.; Wang, C.; Cai, W.J.; Yu, J.; Streets, D.G. Spatiotemporal dynamics of nitrogen dioxide pollution and urban development: Satellite observations over China, 2005–2016. Resour. Conserv. Recy. 2019, 142, 59–68. [Google Scholar] [CrossRef]
  5. Lopez, B.E.; Urban, D.; White, P.S. Testing the effects of four urbanization filters on forest plant taxonomic, functional, and phylogenetic diversity. Ecol. Appl. 2018, 28, 2197–2205. [Google Scholar] [CrossRef] [PubMed]
  6. Ning, Z.H.; Chambers, R.; Abdollahi, K. Modeling air pollutant removal, carbon storage, and CO2 sequestration potential of urban forests in Scotlandville, Louisiana, USA. iForest 2016, 9, 860–867. [Google Scholar] [CrossRef]
  7. Veresoglou, S.D.; Halley, J.M.; Rillig, M.C. Extinction risk of soil biota. Nat. Commun. 2015, 6. [Google Scholar] [CrossRef]
  8. Klimek, B.; Chodak, M.; Jazwa, M.; Niklinska, M. Functional diversity of soil microbial communities in boreal and temperate Scots pine forests. Eur. J. For. Res. 2016, 135, 731–742. [Google Scholar] [CrossRef] [Green Version]
  9. Wardle, D.A.; Bardgett, R.D.; Klironomos, J.N.; Setala, H.; van der Putten, W.H.; Wall, D.H. Ecological linkages between aboveground and belowground biota. Science 2004, 304, 1629–1633. [Google Scholar] [CrossRef]
  10. Li, J.; Li, Z.A.; Wang, F.M.; Zou, B.; Chen, Y.; Zhao, J.; Mo, Q.F.; Li, Y.W.; Li, X.B.; Xia, H.P. Effects of nitrogen and phosphorus addition on soil microbial community in a secondary tropical forest of China. Biol. Fert. Soils 2015, 51, 207–215. [Google Scholar] [CrossRef]
  11. Deng, Q.; Cheng, X.L.; Hui, D.F.; Zhang, Q.; Li, M.; Zhang, Q.F. Soil microbial community and its interaction with soil carbon and nitrogen dynamics following afforestation in central China. Sci. Total Environ. 2016, 541, 230–237. [Google Scholar] [CrossRef]
  12. Strecker, T.; Mace, O.G.; Scheu, S.; Eisenhauer, N. Functional composition of plant communities determines the spatial and temporal stability of soil microbial properties in a long-term plant diversity experiment. Oikos 2016, 125, 1743–1754. [Google Scholar] [CrossRef]
  13. Thakur, M.P.; Milcu, A.; Manning, P.; Niklaus, P.A.; Roscher, C.; Power, S.; Reich, P.B.; Scheu, S.; Tilman, D.; Ai, F.X.; et al. Plant diversity drives soil microbial biomass carbon in grasslands irrespective of global environmental change factors. Glob. Chang. Biol. 2015, 21, 4076–4085. [Google Scholar] [CrossRef] [Green Version]
  14. Thompson, G.L.; Kao-Kniffin, J. Diversity Enhances NPP, N Retention, and Soil Microbial Diversity in Experimental Urban Grassland Assemblages. PLoS ONE 2016, 11, e0155986. [Google Scholar] [CrossRef]
  15. Lange, M.; Eisenhauer, N.; Sierra, C.A.; Bessler, H.; Engels, C.; Griffiths, R.I.; Mellado-Vazquez, P.G.; Malik, A.A.; Roy, J.; Scheu, S.; et al. Plant diversity increases soil microbial activity and soil carbon storage. Nat. Commun. 2015, 6. [Google Scholar] [CrossRef]
  16. Mellado-Vazquez, P.G.; Lange, M.; Bachmann, D.; Gockele, A.; Karlowsky, S.; Milcu, A.; Piel, C.; Roscher, C.; Roy, J.; Gleixner, G. Plant diversity generates enhanced soil microbial access to recently photosynthesized carbon in the rhizosphere. Soil Biol. Biochem. 2016, 94, 122–132. [Google Scholar] [CrossRef]
  17. Prober, S.M.; Leff, J.W.; Bates, S.T.; Borer, E.T.; Firn, J.; Harpole, W.S.; Lind, E.M.; Seabloom, E.W.; Adler, P.B.; Bakker, J.D.; et al. Plant diversity predicts beta but not alpha diversity of soil microbes across grasslands worldwide. Ecol. Lett. 2015, 18, 85–95. [Google Scholar] [CrossRef]
  18. Ren, C.J.; Zhang, W.; Zhong, Z.K.; Han, X.H.; Yang, G.H.; Feng, Y.Z.; Ren, G.X. Differential responses of soil microbial biomass, diversity, and compositions to altitudinal gradients depend on plant and soil characteristics. Sci. Total Environ. 2018, 610, 750–758. [Google Scholar] [CrossRef]
  19. Zhang, Y.G.; Cong, J.; Lu, H.; Li, G.L.; Xue, Y.D.; Deng, Y.; Li, H.; Zhou, J.Z.; Li, D.Q. Soil bacterial diversity patterns and drivers along an elevational gradient on Shennongjia Mountain, China. Microb. Biotechnol. 2015, 8, 739–746. [Google Scholar] [CrossRef] [Green Version]
  20. Hu, Y.J.; Veresoglou, S.D.; Tedersoo, L.; Xu, T.L.; Ge, T.D.; Liu, L.; Chen, Y.L.; Hao, Z.P.; Su, Y.R.; Rillig, M.C.; et al. Contrasting latitudinal diversity and co-occurrence patterns of soil fungi and plants in forest ecosystems. Soil Biol. Biochem. 2019, 131, 100–110. [Google Scholar] [CrossRef]
  21. Brant, J.B.; Myrold, D.D.; Sulzman, E.W. Root controls on soil microbial community structure in forest soils. Oecologia 2006, 148, 650–659. [Google Scholar] [CrossRef]
  22. Shen, C.; Xiong, J.; Zhang, H.; Feng, Y.; Lin, X.; Li, X.; Liang, W.; Chu, H. Soil pH drives the spatial distribution of bacterial communities along elevation on Changbai Mountain. Soil Biol. Biochem. 2013, 57, 204–211. [Google Scholar] [CrossRef]
  23. Zhou, X.Q.; Guo, Z.Y.; Chen, C.R.; Jia, Z.J. Soil microbial community structure and diversity are largely influenced by soil pH and nutrient quality in 78-year-old tree plantations. Biogeosciences 2017, 14, 2101–2111. [Google Scholar] [CrossRef] [Green Version]
  24. Wang, C.; Liu, D.W.; Bai, E. Decreasing soil microbial diversity is associated with decreasing microbial biomass under nitrogen addition. Soil Biol. Biochem. 2018, 120, 126–133. [Google Scholar] [CrossRef]
  25. Apeagyei, E.; Bank, M.S.; Spengler, J.D. Distribution of heavy metals in road dust along an urban-rural gradient in Massachusetts. Atmos. Environ. 2011, 45, 2310–2323. [Google Scholar] [CrossRef]
  26. Fang, S.B.; Qiao, Y.J.; Yin, C.S.; Yang, X.Y.; Li, N. Characterizing the physical and demographic variables associated with heavy metal distribution along urban-rural gradient. Environ. Monit. Assess. 2015, 187, 570. [Google Scholar] [CrossRef]
  27. Vakhlamova, T.; Rusterholz, H.P.; Kanibolotskaya, Y.; Baur, B. Changes in plant diversity along an urban-rural gradient in an expanding city in Kazakhstan, Western Siberia. Landsc. Urban Plan. 2014, 132, 111–120. [Google Scholar] [CrossRef]
  28. Huang, J.; Liu, J.X.; Zhang, W.; Cai, X.A.; Liu, L.; Zheng, M.H.; Mo, J.M. Effects of urbanization on plant phosphorus availability in broadleaf and needleleaf subtropical forests. Sci. Total Environ. 2019, 684, 50–57. [Google Scholar] [CrossRef]
  29. Barrico, L.; Castro, H.; Coutinho, A.P.; Goncalves, M.T.; Freitas, H.; Castro, P. Plant and microbial biodiversity in urban forests and public gardens: Insights for cities’ sustainable development. Urban For. Urban Green. 2018, 29, 19–27. [Google Scholar] [CrossRef]
  30. Kivlin, S.N.; Hawkes, C.V. Tree species, spatial heterogeneity, and seasonality drive soil fungal abundance, richness, and composition in Neotropical rainforests. Environ. Microbiol. 2016, 18, 4662–4673. [Google Scholar] [CrossRef]
  31. Nguyen, N.H.; Williams, L.J.; Vincent, J.B.; Stefanski, A.; Cavender-Bares, J.; Messier, C.; Paquette, A.; Gravel, D.; Reich, P.B.; Kennedy, P.G. Ectomycorrhizal fungal diversity and saprotrophic fungal diversity are linked to different tree community attributes in a field-based tree experiment. Mol. Ecol. 2016, 25, 4032–4046. [Google Scholar] [CrossRef]
  32. Ito, N.; Iwanaga, H.; Charles, S.; Diway, B.; Sabang, J.; Chong, L.; Nanami, S.; Kamiya, K.; Lum, S.; Siregar, U.J.; et al. Geographical variation in soil bacterial community structure in tropical forests in Southeast Asia and temperate forests in Japan based on pyrosequencing analysis of 16S rRNA. Genes Genet. Syst. 2017, 92, 1–20. [Google Scholar] [CrossRef]
  33. Sun, J.; Li, Y.P.; Gao, P.P.; Suo, C.; Xia, B.C. Analyzing urban ecosystem variation in the City of Dongguan: A stepwise cluster modeling approach. Environ. Res. 2018, 166, 276–289. [Google Scholar] [CrossRef]
  34. Lu, R.Q. Methods of Soil Agricultural Chemical Analysis; China Agricultural Science and Technology Press: Beijing, China, 1999. [Google Scholar]
  35. Nguyen, N.H.; Song, Z.; Bates, S.T.; Branco, S.; Tedersoo, L.; Menke, J.; Schilling, J.S.; Kennedy, P.G. FUNGuild: An open annotation tool for parsing fungal community datasets by ecological guild. Fungal. Ecol. 2016, 20, 241–248. [Google Scholar] [CrossRef]
  36. Louca, S.; Parfrey, L.W.; Doebeli, M. Decoupling function and taxonomy in the global ocean microbiome. Science 2016, 353, 1272–1277. [Google Scholar] [CrossRef]
  37. Peres-Neto, P.R.; Legendre, P.; Dray, S.; Borcard, D. Variation partitioning of species data matrices: Estimation and comparison of fractions. Ecology 2006, 87, 2614–2625. [Google Scholar] [CrossRef]
  38. Yan, B.; Li, J.S.; Xiao, N.W.; Qi, Y.; Fu, G.; Liu, G.H.; Qiao, M.P. Urban-development-induced Changes in the Diversity and Composition of the Soil Bacterial Community in Beijing. Sci. Rep. UK 2016, 6. [Google Scholar] [CrossRef]
  39. Comte, J.; del Giorgio, P.A. Linking the patterns of change in composition and function in bacterioplankton successions along environmental gradients. Ecology 2010, 91, 1466–1476. [Google Scholar] [CrossRef]
  40. Brundrett, M.C.; Tedersoo, L. Evolutionary history of mycorrhizal symbioses and global host plant diversity. New Phytol. 2018, 220, 1108–1115. [Google Scholar] [CrossRef]
  41. Peay, K.G. The Mutualistic Niche: Mycorrhizal Symbiosis and Community Dynamics. Annu. Rev. Ecol. Evol. Syst. 2016, 47, 143–164. [Google Scholar] [CrossRef]
  42. Sinha, S.; Masto, R.E.; Ram, L.C.; Selvi, V.A.; Srivastava, N.K.; Tripathi, R.C.; George, J. Rhizosphere soil microbial index of tree species in a coal mining ecosystem. Soil. Biol. Biochem. 2009, 41, 1824–1832. [Google Scholar] [CrossRef]
  43. Tedersoo, L.; Bahram, M.; Polme, S.; Koljalg, U.; Yorou, N.S.; Wijesundera, R.; Ruiz, L.V.; Vasco-Palacios, A.M.; Thu, P.Q.; Suija, A.; et al. Global diversity and geography of soil fungi. Science 2014, 346, 125688. [Google Scholar] [CrossRef]
  44. Hiiesalu, I.; Bahram, M.; Tedersoo, L. Plant species richness and productivity determine the diversity of soil fungal guilds in temperate coniferous forest and bog habitats. Mol. Ecol. 2017, 26, 4846–4858. [Google Scholar] [CrossRef]
  45. Bardelli, T.; Ascher-Jenull, J.; Stocker, E.B.; Fornasier, F.; Arfaioli, P.; Fravolini, G.; Medeiros, L.R.A.; Egli, M.; Pietramellara, G.; Insam, H.; et al. Impact of slope exposure on chemical and microbiological properties of Norway spruce deadwood and underlying soil during early stages of decomposition in the Italian Alps. Catena 2018, 167, 100–115. [Google Scholar] [CrossRef]
  46. Rineau, F.; Shah, F.; Smits, M.M.; Persson, P.; Johansson, T.; Carleer, R.; Troein, C.; Tunlid, A. Carbon availability triggers the decomposition of plant litter and assimilation of nitrogen by an ectomycorrhizal fungus. ISME J. 2013, 7, 2010–2022. [Google Scholar] [CrossRef] [Green Version]
  47. Härdter, R.; Rex, M.; Orlovius, K. Effects of different Mg fertilizer sources on the magnesium availability in soils. Nutr. Cycl. Agroecosyst. 2004, 70, 249–259. [Google Scholar] [CrossRef]
Figure 1. Locations of the three study sites and 27 plots in Dongguan, south China.
Forests 10 00797 g001
Figure 2. Relative abundance of bacterial genera (A) and fungal genera (B) along the urban-to-rural gradient at the Dongguan city, southern China. Abbreviations: Aci, Acidibacter; Acd, Acidicaldus; Aco, Acidothermus; Adu, ADurb.Bin063-1; Bra, Bradyrhizobium; Bry, Bryobacter; Bur, Burkholderia-Caballeronia-Paraburkholderia; Cak, Candidatus_Koribacter; Cas, Candidatus_Solibacter; Cau, Candidatus_Udaeobacter; Cax, Candidatus_Xiphinematobacter; Ell, Ellin6067; Hal, Haliangium; MND, MND1; Rho, Rhodoplanes; Phe, Phenylobacterium; Ros, Roseiarcus; Sin, Singulisphaera; Occ, Occallatibacter; Gra, Granulicella; Abu, Abundisporus; Aga, Agaricus; Asp, Aspergillus; Cla, Cladosporium; Cry, Cryptococcus; Ent, Entoloma; Ino, Inocybe; Mic, Micropsalliota; Mor, Mortierella; Oid, Oidiodendron; Pen, Penicillium; Scl, Scleroderma; Seb, Sebacina; Sta, Staphylotrichum; Tom, Tomentella; Tri, Trichocladium; Trc, Trichoderma; Trh, Trichosporon; Vel, Veluticeps.
Forests 10 00797 g002
Figure 3. Diversity of soil bacterial community (A,B) and soil fungal community (C,D) along the urban-to-rural gradient at the Dongguan city, southern China. Different lowercase letters indicate significant differences among three areas based on Kruskal–Wallis nonparametric test (p < 0.05).
Forests 10 00797 g003
Figure 4. Relative abundance of bacterial (A) and fungal (B) functional groups along the urban-to-rural gradient at the Dongguan city, southern China.
Forests 10 00797 g004
Figure 5. Redundancy analysis (RDA) plot showing influence of soil properties and plant traits on the distribution of main genera in soil bacterial (A,B) and fungal (C,D) communities. Abbreviations: SWC, soil water content; SOC, soil organic carbon; AvN, soil available nitrogen; AvK, Soil available potassium; AvP, soil available phosphorus; Ca2+, soil exchangeable calcium; Mg2+, soil exchangeable magnesium; DBH, diameter at breast height of trees; TS, the number of tree stems; TR, tree richness; SR, shrub richness; HR, herb richness; Aci, Acidibacter; Acd, Acidicaldus; Aco, Acidothermus; Adu, ADurb.Bin063-1; Bra, Bradyrhizobium; Bry, Bryobacter; Bur, Burkholderia-Caballeronia-Paraburkholderia; Cak, Candidatus_Koribacter; Cas, Candidatus_Solibacter; Cau, Candidatus_Udaeobacter; Cax, Candidatus_Xiphinematobacter; Ell, Ellin6067; Hal, Haliangium; MND, MND1; Rho, Rhodoplanes; Phe, Phenylobacterium; Ros, Roseiarcus; Sin, Singulisphaera; Occ, Occallatibacter; Gra, Granulicella; Abu, Abundisporus; Aga, Agaricus; Asp, Aspergillus; Cla, Cladosporium; Cry, Cryptococcus; Ent, Entoloma; Ino, Inocybe; Mic, Micropsalliota; Mor, Mortierella; Oid, Oidiodendron; Pen, Penicillium; Scl, Scleroderma; Seb, Sebacina; Sta, Staphylotrichum; Tom, Tomentella; Tri, Trichocladium; Trc, Trichoderma; Trh, Trichosporon; Vel, Veluticeps.
Forests 10 00797 g005
Figure 6. The proportions of variation at genus level in composition of soil bacterial community (A) and soil fungal community (B) composition explained by soil and plant variables.4. Discussion.
Forests 10 00797 g006
Table 1. Stand characteristics of three sites along the urban-to-rural gradient in Dongguan, south China.
SiteDBH Mean ± S.E.H Mean ± S.E.Representative Species
urban14.31 ± 0.41 cm8.79 ± 0.19 mCinnamomum burmanni, Ficus microcarpa and Albizia falcataria
suburb11.55 ± 0.27 cm8.21 ± 0.14 mEucalyptus urophylla, Elaeocarpus sylvestris and Spathodea campanulata
exurb7.71 ± 0.13 cm6.70 ± 0.08 mSchefflera octophylla, Acronychia pedunculata and Acronychia pedunculata
DBH and H indicated the diameter at breast height and average height of trees, respectively.
Table 2. Characteristics of plant and soil along the urban-to-rural gradient.
VariablesUrbanSuburbExurbp Value
pH5.47 ± 0.26 a4.66 ± 0.09 a4.24 ± 0.04 b<0.001
SWC (g·kg−1)155.65 ± 13.19 b187.43 ± 9.15 ab208.97 ± 13.33 a<0.05
SOC (g·kg−1)15.95 ± 1.6 b17.2 ± 0.9 b32.72 ± 2.36 a<0.001
AvN (mg·kg−1)84.29 ± 6.37 b84.58 ± 4.85 b142.25 ± 10.07 a<0.001
AvP (mg·kg−1)3.98 ± 0.53 b12.92 ± 3.76 a2.44 ± 0.09 b<0.01
AvK (mg·kg−1)74.05 ± 5.0657.01 ± 4.8868.48 ± 3.570.074
Ca2+ (mg·kg−1)660.53 ± 146.93 a214.54 ± 73.14 b72.81 ± 6.92 b<0.01
Mg2+ (mg·kg−1)33.13 ± 5.39 a11.51 ± 2.17 b11.17 ± 0.91 b<0.01
DBH (cm)14.71 ± 0.84 a11.49 ± 1.09 b7.76 ± 0.37 c<0.001
TS53.11 ± 4.31 c82.89 ± 5.72 b153.67 ± 5.06 a<0.001
TR7.67 ± 0.91 c11.56 ± 1.18 b17.67 ± 0.62 a<0.001
SR10.33 ± 1.52 b14.67 ± 2.02 b29.67 ± 1.09 a<0.001
HR10.11 ± 1.33 a7.67 ± 1.26 ab5.44 ± 0.38 b<0.05
Abbreviations: SWC, soil water content; SOC, soil organic carbon; AvN, soil available nitrogen; AvK, Soil available potassium; AvP, soil available phosphorus; Ca2+, soil exchangeable calcium; Mg2+, soil exchangeable magnesium; DBH, diameter at breast height of trees; TS, the number of tree stems; TR, tree richness; SR, shrub richness; HR, herb richness. Values are means ± SE. Different lowercase letters indicate significant differences among three areas based on Kruskal–Wallis nonparametric test (p < 0.05).
Table 3. Spearman correlations of bacterial (B) and fungal (F) diversity with plant traits and soil properties.
VariablesChao1BShannonBChao1FShannonF
DBH (cm)0.63 ***0.69 ***0.20−0.13
TS−0.55 **−0.67 ***−0.29−0.01
TR−0.67 ***−0.77 ***−0.230.00
SR−0.69 ***−0.78 ***−0.080.22
HR0.43 *0.48 *0.02−0.24
pH0.78 ***0.79 ***0.26−0.04
SOC (g·kg−1)−0.71 ***−0.82 ***−0.22−0.03
AvN (mg·kg−1)−0.62 **−0.68 **−0.190.04
AvP (mg·kg−1)0.380.45 *0.29−0.03
AcK (mg·kg−1)0.340.240.290.14
Ca2+ (mg·kg−1)0.74 ***0.71 ***0.280.04
Mg2+ (mg·kg−1)0.65 ***0.59 **0.380.21
SWC (g·kg−1)−0.60 **−0.69 ***−0.090.01
Abbreviations: SWC, soil water content; SOC, soil organic carbon; AvN, soil available nitrogen; AvK, Soil available potassium; AvP, soil available phosphorus; Ca2+, soil exchangeable calcium; Mg2+, soil exchangeable magnesium; DBH, diameter at breast height of trees; TS, the number of tree stems; TR, tree richness; SR, shrub richness; HR, herb richness. * p < 0.05; ** p < 0.01; *** p < 0.001.

