Article

Response Characteristics of Chinese Pine (Pinus tabulaeformis Carr.) Radial Growth to Climate and Drought Variability Reconstruction in Western Liaoning, Northeast China

1
Shaanxi Key Laboratory of Disaster Monitoring and Mechanism Simulating, College of Geography and Environment, Baoji University of Arts and Sciences, Baoji 721013, China
2
State Key Laboratory of Loess and Quaternary Geology, Institute of Earth Environment, Chinese Academy of Sciences, Xi’an 710061, China
3
The Eleventh Middle School of Dalian Economic and Technological Development Zone, Dalian 116600, China
*
Author to whom correspondence should be addressed.
Forests 2019, 10(9), 752; https://doi.org/10.3390/f10090752
Submission received: 10 July 2019 / Revised: 28 August 2019 / Accepted: 29 August 2019 / Published: 1 September 2019
(This article belongs to the Special Issue Long-Term Impacts of Climate Change on Forest Health)

Abstract

:
Chinese pine (Pinus tabulaeformis Carr.) plays an important role in maintaining ecosystem health and stability in western Liaoning Province and the southern Horqin sand land, Northeast China, with benefits including sand fixation and soil erosion. In the context of climate change, developing a better understanding of the relationship between climate factors and growth rates of this species will be extremely valuable in guiding management activities and meeting regional conservation objectives. Here, the results based on two groups of tree-ring samples show that the radial growth of Chinese pine is controlled primarily by water conditions. The longer chronology had the highest correlation coefficient with the January–September mean self-calibrating Palmer Drought Severity Index (scPDSI); therefore, drought variability was reconstructed for the period 1859–2014. Statistical analysis showed that our model explained 41.9% of the variance in radial growth during the 1951–2014 calibration period. Extreme dry and wet events, defined as the criteria of one standard deviation less or greater than the mean value, accounted for 19.9% and 18.6% of the 156-year climate record, respectively. During the past century, the regional hydroclimate experienced significant long-term fluctuations. The dry periods occurred from the early-1900s–1930s and 1980s–2000s, and the wet periods occurred from the 1940s–1970s. The drought reconstruction was consistent with the decreasing trend of the East Asian summer monsoon since the late 1970s. The reconstructed temporal patterns in hydroclimate in western Liaoning were closely related to the large-scale climate drivers in the North Pacific and the tropical equatorial Pacific. The teleconnections were confirmed by spatial correlations between the reconstructed sequence and sea surface temperature (SST) in the North Pacific, as well as the correlations with the Pacific Decadal Oscillation (PDO) and El Niño Southern Oscillation (ENSO) indices. Aerosols played an important role in affecting drought variations over the past several decades. Moisture stress caused by global warming and interdecadal changes in the PDO will have long-term effects on the growth of pines in the study area in the future.

1. Introduction

As one of the largest forest plantation countries, China has launched several important national forestry projects. The Three North Shelterbelt Project, launched in 1978, is playing a critical role in controlling desertification in Northeast China, North China, and Northwest China [1]. For example, the southward invasion of the Horqin sandy land has been effectively controlled in western Liaoning Province due to the activity of afforestation, with a total planted trees area of 1,868,600 hm2 [2]. The decreasing trend of soil erosion and increasing agricultural production capacity are attributed to afforestation in this region. However, Mongolian pine (Pinus sylvestris L. var. mongolica Litv.), the first introduced plantation species in the Horqin sand land (planting began in the 1990s), has shown an obvious decline due to dieback, poor regeneration capacity, and reduced growth rate [3]. Additionally, Chinese pine (Pinus tabulaeformis Carr.), another important afforestation species, has also experienced degeneration phenomena in western Liaoning in the southern Horqin sand land margin region [4]. Due to their ecological characteristics of cold and drought resistance, Chinese pine has been widely planted in northern China [5]. With a monoculture forest area of ca. 533,000 hm2, Chinese pine has become the dominant constituent of forests in western Liaoning and has exerted an important role in soil and water conservation and climate regulation [6]. With the increase in global temperature, the intensity of regional warming and drying is becoming serious, which has negative effects on Chinese pine. According to reports, the drought conditions that occurred in the early 1980s affected more than 9 million artificially planted pines in the Chaoyang area of western Liaoning [6].
Previous studies have shown that environmental factors, including soil thickness, slope and aspect, affect the growth of Chinese pine in western Liaoning [7,8]. In particular, soil thickness was recognized as the most important factor because of the moisture and nutrients contained in thick soil layers [7,8]. Annual average precipitation and temperature were the primary climatic factors for the success rate of Chinese pine plantations [9]. However, considering the distribution characteristics of precipitation and temperature in different months during the current growth year and fluctuations on both decadal and centennial scales, the relationship between tree growth and monthly climatic variables should be explored and identified.
Tree rings have been successfully applied to study environmental change features at long timescales due to advantages including annual resolution, broad spatial distribution and climate sensitivity [10]. Chinese pine has been widely used in dendroclimatic studies in northern China [11,12,13,14,15,16,17,18]. This research reports the development of two new tree-ring chronologies from Chinese pine from western Liaoning in the southern Horqin sand land, Northeast China.
The objectives of this work were (1) to identify the responses of tree radial growth to climate at two sites; (2) to reconstruct a 156 year self-calibrating Palmer Drought Severity Index (scPDSI) inferred from the older tree-ring width chronology; and (3) to explore tempo-spatial representations of drought reconstruction and the possible driving forces. Our results could provide a basis for mitigating the adverse effects of climate variation on the semiarid area and for enhancing the response capacity of Chinese pine forest to the projected warmer future.

2. Materials and Methods

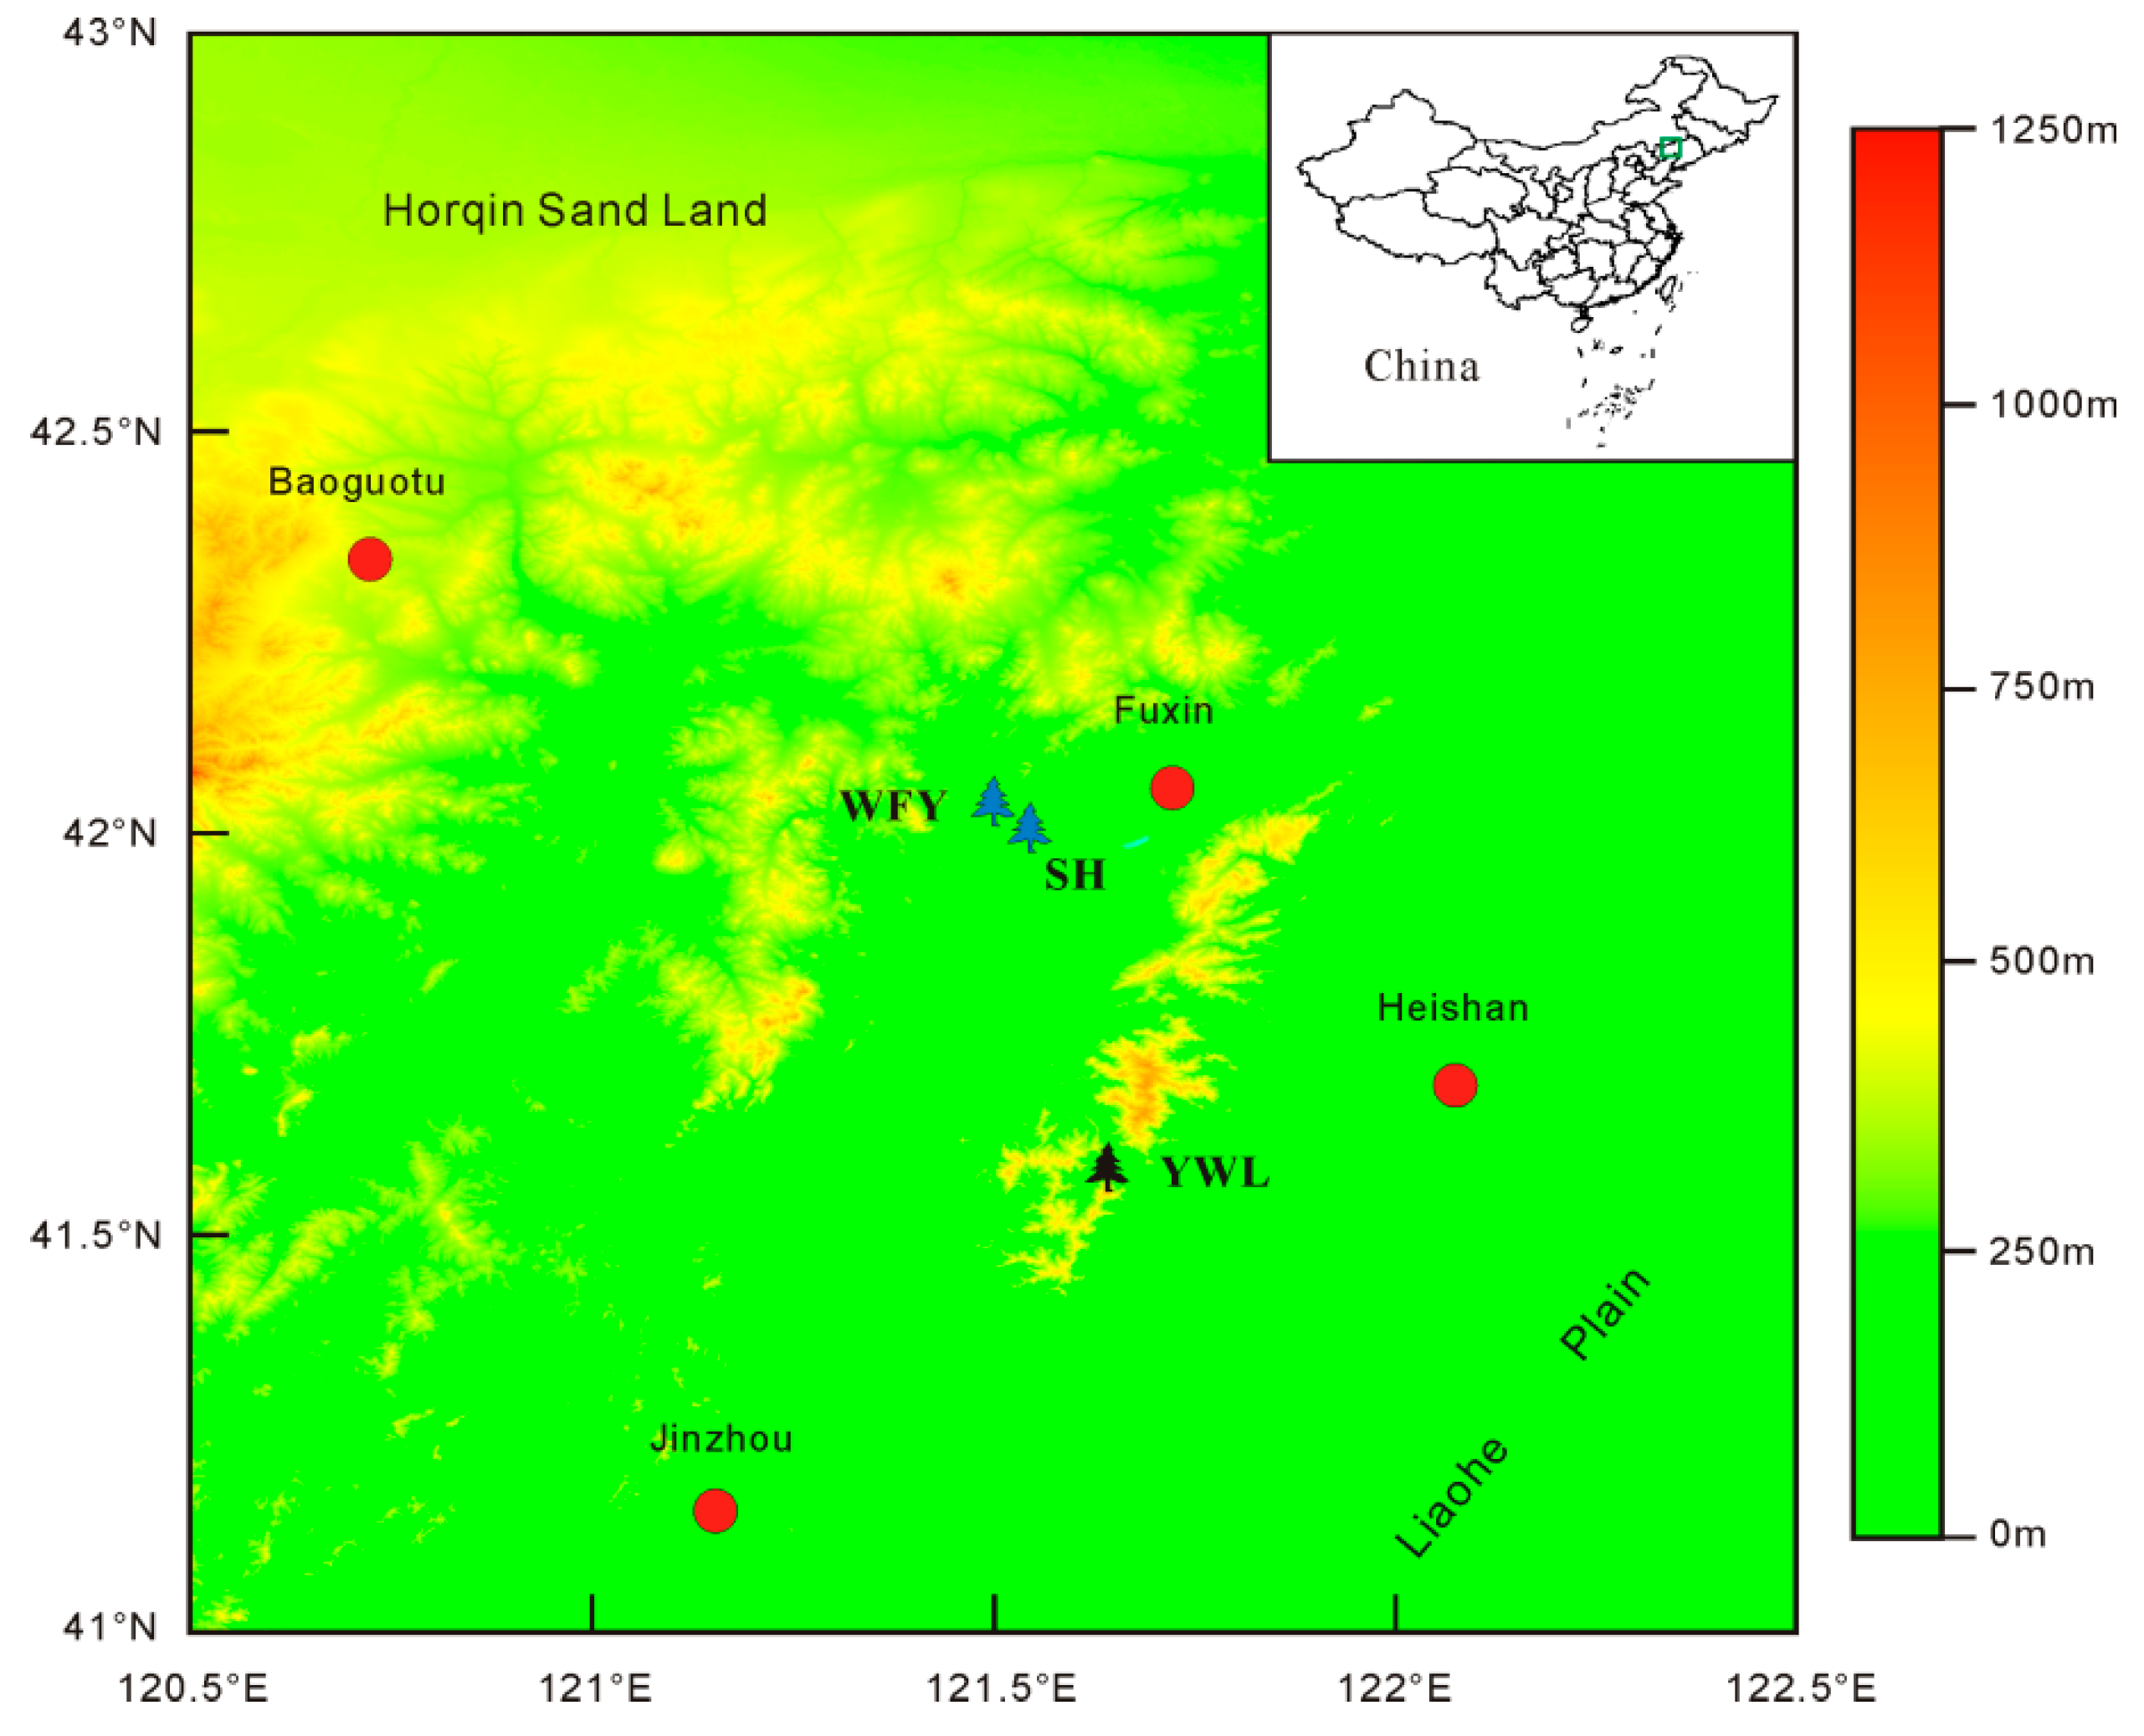
2.1. Study Area and Climate

The study area was located in western Liaoning Province and southern Horqin sand land (Figure 1). As one part of the eastern farming-pastoral ecotone in northern China, western Liaoning is sensitive to climate change due to the fragile ecological environment of drought, barren soil and scarce vegetation [19]. This area belongs to a typical temperate continental monsoon climate. Meteorological data for a period 1951–2012 were obtained from Fuxin station through the China Meteorological Data Sharing Service System (http://cdc.cma.gov.cn), including precipitation, average temperature and relative humidity on a monthly scale.
The distribution characteristics of climatic variables at Fuxin station for the interval from 1951 to 2012 are shown (Figure 2). High temperatures occur in summer (June–August). The hottest month and coldest month are July and January, with average temperatures of 24.25 °C and −11.27 °C, respectively. Due to the influence of the East Asian summer monsoon, the main precipitation occurs in June, July and August. The calculation results show that the average precipitation of June to August in summer from 1951 to 2012 is 339.75 mm, accounting for 67% of the total annual rainfall of 507.02 mm. The highest monthly precipitation occurs in July. The total spring precipitation from March to May is 70.95 mm, which is only 51.44% of the precipitation in July with a multiyear average value of 137.93 mm, indicating that dry spring conditions occur in this area. The relative humidity is influenced by temperature and precipitation. The range of variation in each month is between 44.79% and 76.71%, and the lowest and highest relative humidity values are in March and July, respectively. The amount of annual evaporation is approximately three times that of precipitation [20].

2.2. Tree-Ring Data

Tree-ring cores were collected from Chinese pine at two sites in August 2015. The sampling sites are located on the western edge of the Yiwulv Mountains (YWL) in western Liaoning, designated as groups SH (121°34′ E, 42°00′ N, elevation 193 m) and WFY (121°29′ E, 42°04′ N, elevation 174 m) (Figure 1). The ages of pines from SH are younger than those from WFY. We collected increment cores from 16 trees in SH and 17 trees in WFY (one or two cores per tree). All samples were treated according to standard dendrochronological procedures, including core preparation and crossdating [21,22]. The tree-ring width assigned a calendar year was measured in each core using the Lintab6 system with a precision of 0.01 mm (www.rinntech.de). The quality of crossdating was identified using the COFECHA program [23]. Finally, 31 cores of 16 trees from the SH site and 22 cores of 15 trees from the WFY site were used for further study. Age-related growth trends of ring width series were removed by negative exponential or linear regression fits, and then the standardized indices were averaged to establish tree-ring chronologies using the ARSTAN program (version 41d) [22]. Three chronologies were established, that is, standard (STD), residual (RES) and autoregressive standard chronology (ARS). As the STD chronology could retain more frequency signals, we used the standard chronology (STD) to conduct further analysis in this research. The expressed population signal (EPS) was used to identify the reliable portion of the tree-ring width chronology for further study [24].

2.3. Statistical Analyses

A Pearson correlation coefficient was used to explore the response of the tree-ring width index to climate. The climatic data from October to September were selected for tree growth response analysis. A simple linear regression model was used to assess the close connection between the chronology and climatic variables. Split calibration–verification procedures were conducted to test the stability of the model [22]. The main statistics, including reduction of error (RE), coefficient of efficiency (CE) and sign test (ST), were used to validate the reconstruction. The RE and CE values are the most rigorous indicators of reconstruction model skill, and CE or RE values >0 demonstrate that the linear regression equation is acceptable for climate analysis. The ST was performed to assess the consistency of the observation and estimate departures from the series mean by counting the numbers of agreeing signs. Extreme high or low years were defined as the reconstructed values one standard deviation (SD) higher or lower than the mean value of the entire reconstruction sequence. To examine the regional representativeness of climatic variables reflected by tree-ring chronology, as well as the teleconnections with remote oceans, spatial correlation analyses between our drought reconstruction and gridded data, including self-calibrating Palmer Drought Severity Index (scPDSI) [25], temperature of the Climate Reach Unit (CRU TS4.02) [26] and sea surface temperature of Extended Reconstructed Sea Surface Temperature (ERSST v5) [27], were conducted through the KNMI (The Royal Netherlands Meteorological Institute) climate explorer. The significant oscillation periods contained in the drought reconstruction were identified using a multitaper method (MTM) [28]. A Paul wavelet with a parameter value of 4 was applied to examine periodicity changes over time [29].

3. Results

3.1. Statistics of Tree-Ring Width Chronology

The periods of the SH and WFY chronologies were 1978–2014 and 1849–2014 CE, respectively (Figure 3). However, based on the threshold of EPS greater than 0.85, the high-confidence beginning years were 1979 and 1859 with the minimum sample depth in five cores for SH and WFY, respectively (Table 1). The common signal strength among the tree-ring series and the reliability of the chronologies were assessed by mean sensitivity (MS), mean correlation between all series (MCS), and signal-to-noise ratio (SNR) [22]. Compared to SH, the WFY chronology showed a stronger signal with higher MS (0.321), MCS (0.660) and first order autocorrelation (0.656) (Table 1). The relatively lower value of SNR (12.804) in the WFY chronology could be attributed to the difference in length of both chronologies, that is, the WFY span was longer than the SH chronology. Even so, the first vector variances of the two chronologies were very close, that is, 53.1% (SH) and 53% (WFY). Overall, the statistical features of both SH and WFY tree-ring standard chronologies given by the ARSTAN program (Table 1) suggested the capability of radial growth-based climate analysis.

3.2. Correlations between Chronologies and Climatic Variables

Significant positive correlations were found between the SH chronology and precipitation in December and May and the relative humidity in December and August. A significant negative correlation occurred between SH and the current May temperature. The WFY chronology had significant positive correlations with previous October precipitation, relative humidity in the previous October and November and the current June. Stronger negative correlations existed between the WFY chronology and temperature from January to September, except in July (Table 2). Both SH and WFY chronologies had the strongest positive correlations with scPDSI in almost all months at significance levels of 0.05 or 0.01. (Table 2).
After the combination of multi-month data, a higher positive correlation occurred between WFY and January–September scPDSI, while a negative correlation occurred between WFY and January–September mean temperature (Table 2). These results suggest that moisture conditions are the primary limiting factors of tree radial growth in the WFY sample site and that seasonal temperature also plays an important role in affecting pine growth by enhancing water stress. The results of seasonal analysis between WFY and scPDSI are shown in Table S1.

3.3. Variations in the Reconstructed scPDSI Index

Due to its greater length, the WFY chronology was used to analyze the changing characteristics of the January–September mean scPDSI over the past 156 years. The regression model was designed as follows: RECscPDSI-C19 = 2.849 × WFY − 2.637 (r = 0.647, n = 64, F = 44.74, p < 0.0001), where RECscPDSI-C19 represents the reconstructed January–September mean scPDSI.
The positive RE (0.568, 0.695) and CE (0.185, 0.334) values in the two verification periods of 1983–2014 and 1951–1982 indicate that our regression function was confidently able to reconstruct the drought variability (Table 3). The ST results also confirm the skills of this model, especially statistical values 48+/14− in the entire period of 1951–2014 passing the limit at the 0.01 significance level. The scPDSI reconstruction explained a variance of 41.9% during the calibration period 1951–2014. The variations in drought reconstruction matched observations quite well (Figure 4), but it should be noted that some extreme values of dry years were underestimated by the tree-ring reconstructions, such as in 1983 and 2003. These estimated values may result in low-frequency drought reconstructions during the past dry periods being underestimated, and relevant effects have been confirmed by a previous study [30]. Obvious fluctuations on interannual to multidecadal scales occurred in this drought proxy during the whole valid period of 1859–2014. The mean RECscPDSI-C19 (mean) and standard deviation (SD) values were 0.062 and 1.168, respectively. According to the criteria of greater (less) than the mean + 1SD (mean − 1SD), there were 31 extreme low index years (<1SD) and 29 extreme high index years (>1SD) in the entire sequence, accounting for 19.87% and 18.59% of the past 156 years, respectively (Figure 4, Table 4). Extreme dry events with low values lasting two years or more were found in 1870–1873, 1881–1882, 1904–1906, 1910–1912, 1927–1930, 1994–1995, and 2002–2003, while extreme wet events with high values were identified in 1859–1861, 1899–1901, 1914–1915, 1939–1941, 1948–1955 and 1964–1967 (Table 4). After an 11-year running average, low-frequency changes in the reconstructed scPDSI index displayed three drier periods with moving values greater than the mean (>0.062) in 1865–1878, 1905–1933 and 1983–2009, while wetter periods (<0.062) in 1879–1883, 1895–1901 and 1934–1978.
Spatial correlation results showed that the RECscPDSI-C19 series had significant positive correlations with the January–September mean scPDSI of the Climate Reach Unit (CRU 3.26e) in southern Northeast China, North China and the Korean Peninsula (Figure 5a). Significant positive correlations also existed between RECscPDSI-C19 and SST in the remote central-north Pacific Ocean (Figure 5b,c). Significant negative correlations with temperatures of the Climate Reach Unit (CRU TS4.02) occurred over Eurasia in the mid-high latitudes, especially in Northeast Asia (Figure 5e).
Cycle analyses demonstrated (Figure 6) that RECscPDSI-C19 had significant multitaper spectrum (MTM) peaks at 8.0–8.61 a (p < 0.01), 7.37–7.94 a (p < 0.01), 6.87–6.96 a (p < 0.05), 5.60–5.69 a (p < 0.05), 4.92–4.95 a (p < 0.05), 3.39–3.94 a (p < 0.1) and 2.25–2.35 a (p < 0.1). Similar periods were found in the wavelet results (Figure 6).

4. Discussion

4.1. Climate–Growth Relationship

Although the response degrees of the SH and WFY tree-ring index to climatic variables were different, both chronologies were positively correlated with monthly precipitation and relative humidity and negatively correlated with monthly mean temperature, indicating that the radial growth of Chinese pine in the study area was mainly affected by moisture conditions. Similar growth and climate relationships were found for Yiwulv Mountain [11], Ortindag sandy land [12] and the Loess Plateau, China [13,14,15,16,17]. Among them, the study conducted on Yiwulv Mountain (YWL), the nearest sampling site to our study area (Figure 1), showed that Chinese pine width was significantly positively correlated with precipitation in May, July and September and negatively correlated with temperature in May, June and July [13]. These results confirmed that humidity conditions were the main limiting factor for Chinese pine growth in arid and semiarid regions in northern China (Figure 5a).
The significant positive correlation of the SH chronology with May precipitation and the negative correlation with May mean temperature were consistent with the response pattern found for Yiwulv Mountain (YWL) (Figure 1) [11] and Ortindag sandy land [12] to the west of our study area, as well as the positive effects of precipitation and relative humidity in the previous growth season on pine radial growth in the current year [13,14,15,16,17,18].
A higher monthly mean temperature before and during the growth season could result in moisture deficiency through accelerating soil water consumption and plant evapotranspiration, therefore tending to result in narrow rings. The water stress caused by increasing temperature is obviously inferred from the tree growth response at the WFY site. Similar results have been reported in the Lingkong Mountain, southeast Chinese Loess Plateau [13]. The significant positive correlation results for both the SH and WFY tree-ring chronologies and monthly mean scPDSI support the above hypothesis (Table 2).

4.2. Regional Drought Signals and Teleconnection

The four-year dry event of 1927–1930 (<1 SD) that occurred in our reconstruction was consistent with the serious droughts of the 1920s–1930s that occurred in northern China [31,32]. Previous studies reported that the influence of these extreme droughts covered large areas, including most parts of China, Pakistan and India [33]. Higher temperatures associated with less precipitation were the primary reason for the 1920s droughts inferred from historical documents, tree rings and instrumental records [34,35]. The latest droughts of the 1980s–2000s in this reconstructed January–September mean scPDSI could be attributed to the similar warm and dry climate conditions. Additionally, the two significant drought events of 1870–1873 (<1SD) and 2002–2003 (<1SD) coincided with the regional dry intervals in the 1870s and 2000s that occurred in the central-eastern Mongolian Plateau [36].
Previous studies have shown that the East Asian summer monsoon has weakened significantly from the late 1970s, leading to drought anomalies in northern China [37,38,39]. The drought index reconstruction in this paper reflects the trend of the East Asian summer monsoon in the same period. The East Asian summer monsoon is affected by a variety of circulation factors, such as the tropical Pacific and the North Pacific sea surface temperature changes [38,39,40].
Significant positive correlations with SST in the central-north Pacific Ocean and negative correlations with SST along the west coast of North America suggested the effects of the Pacific Decadal Oscillation (PDO) on our study area (Figure 5b). Similar patterns of climate-related radial growth response have been found in tree-ring-based hydroclimatic reconstructions in the Hulunbuir sand land, Northeast China and the Weihe River basin, eastern Northwest China [15,41]. The adverse relationship between the Palmer drought severity index (PDSI) in northern China and the PDO index [38] support the drought variations in western Liaoning and surrounding areas modulated by the northern Pacific Ocean.
A previous study demonstrated that northern China tends to exhibit dry conditions due to the high-pressure anomaly and anticyclone system during the warm PDO phase [40]. A recent study found that the warm PDO phase could result in a northwesterly wind anomaly in northern China, coinciding with the southward and westward position of the west Pacific subtropical high, resulting in a warm and dry climate in northern China [42].
The spatial correlation results during the cold PDO phase of 1947–1976 (Figure 5c) were consistent with the pattern displayed in Figure 5b, suggesting a connection between drought conditions in this study area and PDO. However, the linkage between our reconstruction and the North Pacific sea surface temperature was weakened during the warm PDO phase of 1977–1998 (Figure 5d), implying that other factors might reduce the East Asian summer monsoon, resulting in dry conditions and therefore masking the PDO signal in the drought variation inferred from the WFY tree-ring chronology.
Aerosols can affect regional climate through a direct effect, the cloud albedo effect, and the cloud lifetime effect, especially in China, where particle pollution has been very serious during the past forty years [43]. A previous study reported that aerosols reduce the average air temperature and precipitation in summer over the East Asian monsoon region in eastern China, which includes northern China where our study site is located. In addition, a significant decrease in precipitation in northern China occurred in weak summer monsoon years [44]. Liu et al. [45] found that aerosol radiative effects could cause a reduction in land temperature and land-sea thermal contrast, leading to weakening of the strength of the East Asian summer monsoon and decreasing the summer precipitation in northern China. A recent study carried out on the west-central margin of the Asian summer monsoon indicated that increasing anthropogenic sulfate aerosols could be the dominant factor causing a strength reduction in the Asian summer monsoon during the past several decades, and regional tree-ring precipitation reconstruction demonstrated that a decreasing trend on the Asian summer monsoon during the last eighty years is unprecedented over the past four centuries [46]. Thus, the linkage between the reconstructed drought sequence and the warm PDO phase from 1977 to 1998 could be attributed at least partially to the effects of aerosols. The teleconnection could be confirmed by significant negative correlations between RECscPDSI-C19 and the PDO index on a monthly scale for the period of 1950–2013 (p < 0.05, n = 64) (Figure 7) [47], as well as the reconstructed PDO index (r = −0.205, p < 0.05, 1873−1994; r = −0.232, p < 0.05, 1900–1994; and r = −0.481, p < 0.001, 1950−1994) [48].
The significant cycles with spectrum peaks at 2–7 as mentioned above (Figure 6), implied teleconnections between drought variations in western Liaoning and the El Niño Southern Oscillation (ENSO) [49]. An adverse relationship of the present reconstructed drought index with the Niño 4 index from the Central Tropical Pacific SST over the sea area of 5° N–5° S and 160° E–150° W [27] existed during the period of 1950–2013, particularly in July, August and September, and it passed the 95% confidence level (Figure 7). Good matches between extreme dry/wet events with low/high values and the El Niño/La Niña events obtained from the historical period of 1525–2002 AD [50] supported the conclusion that ENSO variability could influence hydroclimatic conditions in our study area (Table 4). Twelve El Niño events occurring in the reconstructed drought index series accounted for 38.71% of the extreme dry years, while nine La Niña events accounted for 31.03% of the extreme wet years. Similar cycles related to ENSO have been revealed in other tree-ring climate variable reconstruction series in surrounding regions [11,15,16,34,51,52].

5. Conclusions and Perspectives

Two new tree-ring width chronologies of Chinese pine (Pinus tabulaeformis Carr.) were established for western Liaoning Province in the southern part of the Horqin sand land, Northeast China. The response analyses showed that moisture was the key limiting factor for the radial growth of this species, inferred from the correlations of the ring width index with temperature, precipitation, relative humidity and scPDSI. The history of January–September mean scPDSI drought changes during the period from 1859 to 2014 was reconstructed. Extreme dry and wet events occurred 31 and 29 times, respectively. The low-frequency variations in the past century were characterized by drought periods in the 1900s–early 1930s and 1980s–2000s and wet periods in the 1940s–1970s. The results of spatial correlation and time series analyses confirmed that hydroclimate changes in western Liaoning were connected with the North Pacific and the tropical equatorial Pacific. The effects of aerosols on the climatic conditions of the East Asian monsoon region are equally important for the growth of Pinus tabulaeformis trees in the study area. The long-term radial growth trend of this species in the study area will be affected by the synergistic effects of drought stress caused by global warming and the PDO fluctuations on decadal scales through Asian summer monsoon intensity variation caused by aerosol emissions in the future. The drought reconstruction accounted for 41.9% of the explained variance, which demonstrates that other environmental and localized influences also affect tree-growth in this region. More work is still necessary to identify Chinese pine radial growth, drought variability and larger-scale climate forcing. Our findings provide reliable scientific data for the management and conservation of Chinese pine and for the enhancement of the responses and adaptability to climate change.

Supplementary Materials

The following are available online at https://www.mdpi.com/1999-4907/10/9/752/s1, Table S1: Correlations between the tree-ring width chronologies of WFY and scPDSI on seasonal scale during 1951–2014 (note that all correlation coefficients (R) at p < 0.01; P indicates previous year, C indicates current year).

Author Contributions

Conceptualization, N.L. and G.B.; Data curation, N.L. and G.B.; Formal analysis, N.L., G.B. and M.B.; Funding acquisition, N.L. and G.B.; Investigation, N.L., G.B. and M.B.; Methodology, N.L. and G.B.; Project administration, N.L. and G.B.; Writing–original draft, N.L. and G.B.; Writing–review & editing, N.L. and G.B.

Funding

This work was supported by Natural Science Basic Research Program of Shaanxi (Program No. 2019JM-208,2018JQ4022); Shaanxi Key Laboratory of Disaster Monitoring and Mechanism Modeling (17JS005), Key program of the Baoji University of Arts and Sciences (ZK2018047), Second Outstanding Young Talents of Shaanxi Universities (2018), State Key Laboratory of Loess and Quaternary Geology (SKLLQG1711, SKLLQG1801) and the Young Scientist Project of Shaanxi Province (2016KJXX-41).

Acknowledgments

We thank Tong Wang and Xuehai Ma for their great assistance in the fieldwork. We also acknowledge the reviewers for their constructive comments to improve the manuscript.

Conflicts of Interest

The authors declare no conflict of interest.

References

  1. State Forestry Administration of China (SFA). Bulletion of the Fifth Desertification and Sandification State of China; State Forestry Administration: Beijing, China, 2015. [Google Scholar]
  2. Shi, K.H. Construction and countermeasures of three-north shelterbelt in Liaoning. Prot. Sci. Technol. 2016, 4, 85–86. (In Chinese) [Google Scholar]
  3. Jiao, S.R. Report on the causes of the early decline of Pinus sylvestris var. mongolica shelterbelt and its preventative and control measures in Zhanggutai of Liaoning province. Sci. Silva. Sin. 2001, 37, 131–138. [Google Scholar]
  4. Jiang, F.Q.; Yu, Z.Y.; Zeng, D.H. An ecological perspective of afforesting Chinese pine (Pinus tabulaeformis) plantations in western Liaoning Province. Chin. J. Ecol. 2007, 26, 2069–2074. [Google Scholar]
  5. Xu, H.C. Chinese Pine (Pinus tabulaeformis Carr.); Chinese Forest Press: Beijing, China, 1993. [Google Scholar]
  6. Zhao, Y.M. Present situation, problems and management countermeasures of Pinus tabulaeformis plantations in Western Liaoning. Prot. Sci. Technol. 2015, 2, 54. [Google Scholar]
  7. Lei, Q.D.; Liu, M.J.; Liu, J.Y. An approach of transforming the artificial forest of Chinese pine into the mixed broadleaf-pine forest in the hilly areas of Western Liaoning. Chin. J. Ecol. 1997, 16, 8–13. [Google Scholar]
  8. Wang, S.Z.; Li, S.M. Benefit analysis of issuing mixed forest of Pinus tabulaeformis forest in semi-arid area. Sci. Technol. 1999, 6, 22–24. [Google Scholar]
  9. Wu, X.X.; Han, L.C. Geographical distribution and suitability division of Pinus tabulaeformis. J. Soil Water Conserv. 2000, 14, 18–23. [Google Scholar]
  10. Zhang, Z. Tree-rings, a key ecological indicator of environment and climate change. Ecol. Indic. 2015, 51, 107–116. [Google Scholar] [CrossRef]
  11. Liu, Y.; Wang, Y.; Li, Q.; Song, H.; Zhang, Y.; Yuan, Z.; Wang, Z. A tree-ring based June–September mean relative humidity reconstruction since 1837 from the Yiwulü Mountain region, China. Int. J. Clim. 2015, 35, 1301–1308. [Google Scholar] [CrossRef]
  12. Liang, E.; Eckstein, D.; Liu, H. Climate-growth relationships of relict Pinus tabulaeformis at the northern limit of its natural distribution in northern China. J. Veg. Sci. 2008, 19, 393–406. [Google Scholar] [CrossRef]
  13. Cai, Q.; Liu, Y.; Lei, Y.; Bao, G.; Sun, B. Reconstruction of the March–August PDSI since 1703 AD based on tree rings of Chinese pine (Pinus tabulaeformis Carr.) in the Lingkong Mountain, southeast Chinese loess Plateau. Clim. Past 2014, 10, 509–521. [Google Scholar] [CrossRef]
  14. Fang, K.; Guo, Z.; Chen, D.; Linderholm, H.W.; Li, J.; Zhou, F.; Guo, G.; Dong, Z.; Li, Y. Drought variation of western Chinese Loess Plateau since 1568 and its linkages with droughts in western North America. Clim. Dyn. 2017, 49, 3839–3850. [Google Scholar] [CrossRef]
  15. Liu, N.; Bao, G.; Liu, Y.; Linderholm, H.W. Two centuries-long streamflow reconstruction inferred from tree rings for the middle reaches of the Weihe River in Central China. Forests 2019, 10, 208. [Google Scholar] [CrossRef]
  16. Li, Q.; Liu, Y.; Nakatsuka, T.; Song, H.; McCarroll, D.; Yang, Y.; Qi, J. The 225-year precipitation variability inferred from tree-ring records in Shanxi Province, the North China, and its teleconnection with Indian summer monsoon. Glob. Planet. Chang. 2015, 132, 11–19. [Google Scholar] [CrossRef] [Green Version]
  17. Yang, B.; Kang, S.; Ljungqvist, F.C.; He, M.; Zhao, Y.; Qin, C. Drought variability at the northern fringe of the Asian summer monsoon region over the past millennia. Clim. Dyn. 2014, 43, 845–859. [Google Scholar] [CrossRef]
  18. Chen, Z.; He, X.; Cook, E.R.; He, H.S.; Chen, W.; Sun, Y.; Cui, M. Detecting dryness and wetness signals from tree-rings in Shenyang, Northeast China. Palaeogeogr. Palaeoclimatol. Palaeoecol. 2011, 302, 301–310. [Google Scholar] [CrossRef]
  19. Zhao, H.L.; Zhao, X.Y.; Zhang, TH.; Zhou, R.L. Boundary line on agro-pasture zigzag zone in north China and its problems on eco-environment. Adv. Earth Sci. 2002, 17, 739–747. [Google Scholar]
  20. Song, L.; Zhu, J.; Li, M.; Zhang, J.; Lv, L. Sources of water used by Pinus sylvestris var. mongolica trees based on stable isotope measurements in a semiarid sandy region of Northeast China. Agric. Water Manag. 2016, 164, 281–290. [Google Scholar] [CrossRef]
  21. Fritts, H.C. Tree-Rings and Climate; Academic Press: London, UK, 1976. [Google Scholar]
  22. Cook, E.R.; Kairiukstis, L.A. Methods of Dendrochronology: Applications in the Environmental Sciences; Kluwer Academic Publishers: Boston, MA, USA, 1990. [Google Scholar]
  23. Holmes, R.L. Computer-assisted quality control in tree-ring dating and measurement. Tree Ring Bull 1983, 43, 69–95. [Google Scholar]
  24. Wigley, T.; Briffa, K.R.; Jones, P.D. On the average value of correlated time series, with applications in dendroclimatology and hydrometeorology. J. Appl. Meteorol. Climatol. 1984, 23, 201–213. [Google Scholar] [CrossRef]
  25. Wells, N.; Goddard, S.; Hayes, M.J. A self–calibrating palmer drought severity index. J. Clim. 2004, 17, 2335–2351. [Google Scholar] [CrossRef]
  26. Mitchell, T.D.; Jones, P.D. An improved method of constructing a database of monthly climate observations and associated high-resolution grids. Int. J. Climatol. 2005, 25, 693–712. [Google Scholar] [CrossRef]
  27. Smith, T.M.; Reynolds, R.W.; Peterson, T.C.; Lawrimore, J. Improvements to NOAA’s historical merged land-ocean surface temperature analysis (1880–2006). J. Clim. 2008, 21, 2283–2296. [Google Scholar] [CrossRef]
  28. Mann, M.E.; Lees, J. Robust estimation of background noise and signal detection in climatic time series. Clim. Chang. 1996, 33, 409–445. [Google Scholar] [CrossRef]
  29. Torrence, C.; Compo, G.P. A practical guide to wavelet analysis. Bull. Am. Meteorol. Soc. 1998, 79, 61–78. [Google Scholar] [CrossRef]
  30. McCarroll, D.; Young, G.H.F.; Loader, N.J. Measuring the skill of variance-scaled climate reconstructions and a test for the capture of extremes. Holocene 2015, 25, 618–626. [Google Scholar] [CrossRef] [Green Version]
  31. Liang, E.Y.; Liu, X.H.; Yuan, Y.J.; Qin, N.S.; Fang, X.Q.; Huang, L.; Zhu, H.F.; Wang, L.L.; Shao, X.M. The 1920s drought recorded by tree rings and historical documents in the semi-arid and arid areas of Northern China. Clim. Chang. 2006, 79, 403–432. [Google Scholar] [CrossRef]
  32. Luo, M.; Feng, J.; Xu, Z.; Wang, Y.; Dan, L. Evaluating the performance of five twentieth-century reanalysis datasets in reproducing the severe drought in northern China during the 1920s–1930s. Theor. Appl. Climatol. 2018. [Google Scholar] [CrossRef]
  33. Feng, S.; Hu, Q.; Wu, Q.; Mann, M.E. A gridded reconstruction of warm season precipitation for Asia spanning the past half millennium. J. Clim. 2013, 26, 2192–2204. [Google Scholar] [CrossRef]
  34. Yi, L.; Yu, H.; Ge, J.; Lai, Z.; Xu, X.; Qin, L.; Peng, S. Reconstructions of annual summer precipitation and temperature in north-central China since 1470 AD based on drought/flood index and tree-ring records. Clim. Chang. 2012, 110, 469–498. [Google Scholar] [CrossRef]
  35. Qian, W.; Lin, X.; Zhu, Y.; Xu, Y.; Fu, J. Climatic regime shift and decadal anomalous events in China. Clim. Chang. 2007, 84, 167–189. [Google Scholar] [CrossRef]
  36. Bao, G.; Liu, Y.; Liu, N.; Linderholm, H.W. Drought variability in eastern Mongolian Plateau and its linkages to the large-scale climate forcing. Clim. Dyn. 2015, 44, 717–733. [Google Scholar] [CrossRef]
  37. Wang, H.J. The weakening of the Asian monsoon circulation after the end of 1970′s. Adv. Atmos. Sci. 2001, 18, 376–386. [Google Scholar]
  38. Ma, Z.G. The interdecadal trend and shift of dry/wet over the central part of North China and their relationship to the Pacific decadal oscillation (PDO). Chin. Sci. Bull. 2007, 52, 2130–2139. [Google Scholar] [CrossRef]
  39. Ding, Y.; Sun, Y.; Wang, Z.; Zhu, Y.; Song, Y. Interdecadal variation of the summer precipitation in China and its association with decreasing Asian summer monsoon. Part II: Possible causes. Int. J. Climatol. 2009, 29, 1926–1944. [Google Scholar] [CrossRef]
  40. Qian, C.; Zhou, T. Multidecadal variability of North China aridity and its relationship to PDO during 1900–2010. J. Clim. 2014, 27, 1210–1222. [Google Scholar] [CrossRef]
  41. Liu, N.; Liu, Y.; Bao, G.; Bao, M.; Wang, Y.; Zhang, L.; Ge, Y.; Bao, W.; Tian, H. Drought reconstruction in eastern Hulun Buir steppe, China and its linkages to the sea surface temperatures in the Pacific Ocean. J. Asian Earth Sci. 2016, 115, 298–307. [Google Scholar] [CrossRef]
  42. Yang, Q.; Ma, Z.G.; Fan, X.G.; Yang, Z.L.; Xu, Z.F.; Wu, P.L. Decadal modulation of precipitation patterns over eastern China by sea surface temperature anomalies. J. Clim. 2017, 30, 7017–7033. [Google Scholar] [CrossRef]
  43. Wu, G.X.; Li, Z.Q.; Fu, C.B.; Zhang, X.Y.; Zhang, R.Y.; Zhang, R.H.; Zhou, T.J.; Li, J.P.; Li, J.D.; Zhou, D.G.; et al. Advances in studying interactions between aerosols and monsoon in China. Sci. China Earth Sci. 2016, 59, 1–6. [Google Scholar] [CrossRef]
  44. Li, S.; Wang, T.; Solmon, F.; Zhuang, B.; Wu, H.; Xie, M.; Han, Y.; Wang, X. Impact of aerosols on regional climate in southern and northern China during strong/weak East Asian summer monsoon years. J. Geophys. Res. Atmos. 2016, 121, 4069–4081. [Google Scholar] [CrossRef] [Green Version]
  45. Liu, X.D.; Xie, X.N.; Yin, Z.Y.; Liu, C.H.; Gettelman, A. A modeling study of the effects of aerosols on clouds and precipitation over East Asia. Theor. Appl. Climatol. 2011, 106, 343–354. [Google Scholar] [CrossRef]
  46. Liu, Y.; Cai, W.J.; Sun, C.F.; Song, H.M.; Cobb, K.; Li, J.P.; Leavitt, S.; Wu, L.X.; Cai, Q.F.; Liu, R.S.; et al. Anthropogenic aerosols cause recent pronounced weakening of Asian Summer Monsoon relative to last four centuries. Geophysic. Res. Lett. 2019. [Google Scholar] [CrossRef]
  47. Mantua, N.J.; Hare, S.R.; Zhang, Y.; Wallace, J.M.; Francis, R.C. A Pacific interdecadal climate oscillation with impacts on salmon production. Bull. Am. Meteorol. Soc. 1997, 78, 1069–1080. [Google Scholar] [CrossRef]
  48. Felis, T.; Suzuki, A.; Kuhnert, H.; Rimbu, N.; Kawahata, H. Pacific decadal oscillation documented in a coral record of North Pacific winter temperature since 1873. Geophysic. Res. Lett. 2010, 37, L14605. [Google Scholar] [CrossRef]
  49. Allan, R.; Lindesay, J.; Parker, D. El Nino: Southern Oscillation and ClimaticVariability; CSIRO Publishing: Collinwood, Australia, 1996. [Google Scholar]
  50. Gergis, J.L. Fowler, A.M. A history of ENSO events since A.D. 1525: Implications for future climate change. Clim. Chang. 2009, 92, 343–387. [Google Scholar] [CrossRef]
  51. Hu, Y.; Bao, G.; Liu, N.; Qu, Y. May–July mean minimum temperature variability in the mid-Qinling Mountains, central China, since 1814 CE. Quat. Int. 2018, 476, 102–109. [Google Scholar] [CrossRef]
  52. Zhang, Y.; Tian, Q.H.; Guillet, S.; Stoffel, M. 500-yr precipitation variability in Southern Taihang Mountains, China, and its linkages to ENSO and PDO. Clim. Chang. 2017, 144, 419–432. [Google Scholar] [CrossRef]
Figure 1. Locations of the study area (green rectangle), tree-ring sampling sites (blue tree, WFY and SH; black tree for comparison, YWL) and Fuxin meteorological station (red dot).
Forests 10 00752 g001
Figure 2. Distribution of monthly mean temperature (circles), precipitation (black bars) and relative humidity (crosshatched bars) from Fuxin meteorological station data during the period of 1950–2012.
Forests 10 00752 g002
Figure 3. Tree-ring width standard chronologies of (a) SH and (b) WFY and sample depth.
Forests 10 00752 g003
Figure 4. (a) Comparison of reconstructed (bold line) and observed (thin line) January–September mean self-calibrating Palmer Drought Severity Index (scPDSI) during the period of 1951–2014 and (b) variations in the drought reconstruction during the whole reliable period of 1859–2014 for western Liaoning (the bold line indicates the 11-year moving data and the horizontal lines indicate the mean value along with the extremely high and low values at ± one standard deviation).
Forests 10 00752 g004
Figure 5. Spatial correlations of the reconstructed January–September mean self-calibrating Palmer Drought Severity Index (RECscPDSIC1-9) with (a) scPDSI (1901–2014), (bd) sea surface temperature of ERSSTv5 (1901–2014, 1946–1976 and 1977–1998), and (e) CRU TS4.02 temperature (1951–2014). The significance levels are p < 0.05 for (a) and (e), and p < 0.1 for panels (b), (c) and (d). The study area is marked by a green rectangle in panels (a) and (b).
Forests 10 00752 g005
Figure 6. Cycle results of (a) Paul wavelet with a parameter value of 4 [29] and (b) multitaper spectrum (MTM) analyses [28] for reconstructed January–September mean self-calibrating Palmer Drought Severity Index for the period of 1859–2014. The cone of influence in the wavelet analysis is indicated by the black line. The confidence intervals at 99%, 95%, and 90% for peaks in the power spectrum are indicated by the red, green, and blue lines, respectively.
Forests 10 00752 g006
Figure 7. Correlations between reconstructed January–September mean self-calibrating Palmer Drought Severity Index and the PDO [47] and el Niño 4 indices [27] in the period of 1950–2013. P indicates the previous year, C indicates the current year. The dashed line indicates the confidence level of 95%.
Forests 10 00752 g007
Table 1. Statistical characteristics of the SH and WFY chronologies.
Statistical Items SH WFY
Mean sensitivity0.2700.321
First-order autocorrelation0.4790.656
Mean correlation between all series (MCS)0.4930.660
Variance in first eigenvector (%)53.153.0
Signal-to-noise ratio (SNR)31.19412.804
Chronology length1978–20141849–2014
Table 2. Correlations between tree-ring width chronologies of SH and WFY and climatic factors.
Month SH Month WFY
pTRHscPDSIpTRHscPDSI
p 100.0940.0840.3360.427 **p 100.261 *−0.1320.443 **0.551 **
p 110.3140.2210.1860.457 **p 11−0.041−0.0790.359 **0.533 **
p 120.388 *0.3220.381 *0.465 **p 120.185−0.1410.1480.551 **
c 1−0.20.151−0.120.455 **c 10.104−0.354 **0.2090.573 **
c 2−0.067−0.014−0.130.443 **c 20.159−0.403 **0.1760.592 **
c 3−0.098−0.022−0.0190.381 *c 3−0.093−0.362 **0.1750.570 **
c 4−0.031−0.1420.0780.385 *c 4−0.058−0.488 **0.2270.578 **
c 50.386 *−0.465 **0.2150.429 **c 50.087−0.314 *0.1470.583 **
c 6−0.054−0.1890.170.478 **c 60.104−0.434 **0.344 **0.583 **
c 70.174−0.1830.3340.472 **c 70.176−0.2480.1500.507 **
c 80.114−0.0780.387 *0.365 *c 80.184−0.329 **0.2210.531 **
c 90.053−0.1840.130.295c 90.004−0.455 **0.0640.466 **
c1–90.210−0.1870.2040.469 **c1-90.259 *−0.638 **0.337 **0.647 **
Note: * means p < 0.05, ** p < 0.01, p indicates previous year, c indicates current year, P is the sum of monthly precipitation, T is the average monthly temperature, RH is the average monthly relative humidity. The calculation periods between both chronologies, P, T and RH were 1979–2012 and 1951–2012 for SH and WFY chronologies, respectively. The calculation periods for scPDSI were 1979–2014 and 1951–2014.
Table 3. Statistical features of split calibration–verification for the January–September mean scPDSI reconstruction model.
CalibrationVerification
PeriodrR2STPeriodrR2RECEST
1951–19820.600 *0.36022+/10−1983–20140.462 *0.2130.5680.18521+/11−
1983–20140.462 *0.21324+/8− *1951–19820.600 *0.3600.6950.33422+/10−
1951–20140.647 *0.41948+/16− *
* indicates p < 0.01.
Table 4. Extreme events of reconstructed January–September mean scPDSI for western Liaoning during the period 1859–2014.
RankYearLow ValueYearHigh Value
11864−1.116 *18591.571
21868−1.264 *18602.793 **
31870−1.22718612.278 **
41871−1.51218751.300 **
51872−1.31218791.924 **
61873−1.39518861.508 **
71881−1.617 *18991.619
81882−1.45219002.232
91889−1.825 *19012.024
101904−1.506 *19141.409
111905−1.663 *19151.981
121906−1.156 *19251.249
131910−1.11019392.537
141911−1.500 *19402.369
151912−1.403 *19411.260
161917−1.53219481.457
171922−1.72519491.862
181927−1.21819502.109 **
191928−1.60019511.599 **
201929−1.71119521.565
211930−1.426 *19531.716 **
221945−1.48319541.289
231974−1.65419551.306 **
241984−1.29819641.970
251991−1.127 *19652.058
261994−1.39219662.827
271995−1.44319671.363
282000−1.21519712.013
292002−1.204 *19781.466
302003−1.879
312006−1.472
Note: * indicates an El Niño event; ** indicates a La Niña event.

