Article

Application of GRAS Compounds for the Control of Mould Growth on Scots Pine Sapwood Surfaces: Multivariate Modelling of Mould Grade

1
Wood Science and Engineering, Luleå University of Technology, 50115 Skellefteå, Sweden
2
InnoRenew CoE, 6310 Izola, Slovenia
3
RISE Research Institutes of Sweden, 50115 Skellefteå, Sweden
4
ABiTEP GmbH, D-12489 Berlin, Germany
*
Author to whom correspondence should be addressed.
Forests 2019, 10(9), 714; https://doi.org/10.3390/f10090714
Submission received: 30 May 2019 / Revised: 9 August 2019 / Accepted: 19 August 2019 / Published: 21 August 2019
(This article belongs to the Section Forest Ecophysiology and Biology)

Abstract

:
Research Highlights: In this study, the Generally Recognised as Safe (GRAS) compounds were applied in order to study mould-fungi growth on dried Scots pine sapwood. Background and Objectives: The transition to the use of more sustainable wood-material may be possible by applying GRAS compounds that can control and prevent contamination by primary colonising mould fungi. Materials and Methods: Kiln-dried sawn timber was treated with three different GRAS compounds, and different fungal inoculation methods applied in order to investigate differences in the development of fungal communities. Results: Substances based on potassium silicate significantly reduced fungal growth and mould contamination on the studied wood surfaces. By combining wood-surface treatments with GRAS compounds, fungal-area size as predictors and mould grade as response, a partial least squares (PLS) model that makes it possible to predict mould grade on wood surfaces was developed. The PLS model is a key component in the development of a smart grading-systems equipped by e.g. high-speed digital cameras for the early detection of fungal attack on wood surfaces in different applications. However, the measurements based on chemical characterisation should be the next step to take in order significantly to enhance the model and increase the range of robust applications. In the current study, a multivariate model describing the influence of each fungal-covering area on mould grade was presented for the first time.

1. Introduction

The negative load of fossil- and petrol-based biocidal substances on the environment and the reduction of volatile organic compounds (VOCs) emitted while using solvent-based coatings, require the introduction of new concepts for wood-surface treatment for outdoor and indoor applications [1,2]. A significant problem when wood is used and the moisture level is high, e.g. in outdoor conditions, is biodegradation caused primarily by fungi which have a unique nutrient-sensing mechanism [3] which makes the task of wood protection difficult. Environmental processes that affect the wood in outdoor use result in aesthetic concerns and increased maintenance costs [4]. Fungal bio-aerosols accumulating on outdoor building-material surfaces may also have a significant impact on indoor biological contamination, especially under sub-arctic conditions [5].
Toxigenic moulds, particularly ascomycetes, are ordinary food and indoor inhabitants associated with everyday human activity and they may present a health risk to humans. For example, information from public health monitoring programs related to secondary metabolites of toxigenic moulds known as mycotoxins has raised concern about health aspects [6]. Urinary multi-biomarker analysis among adults in Sweden revealed that “common and concurrent exposure to more than one toxin was found in 69% of the studied population” [7]. Nowadays, mycotoxin studies face many masked mycotoxins, and the analytical methods are quite complex due to the polydiversity of compounds’ properties. When modern regulations require “minimal fungi” levels and at the same time environmentally friendly solutions for bio-based materials such as wood and other related products.
Wood in the living tree is a durable material with an active defence mechanism including extractives enrichment [8,9,10,11]. The processing of a log to sawn timber was initially developed to meet the need for a cheap and easily available building material, and the sawmill drying procedure was aimed to lower the sawn-timber moisture content to reduce the board weight and the risk of fungal attack. Already during felling, the initial immunity of the tree starts to decrease, and the wood resistance is reduced during the further processing of the tree for use in wood-based products. Previous studies have shown, for example, that industrial wood drying leads to the migration of hydrophilic and hydrophobic substances towards the wood surface, resulting in the creation of a nutrient gradient in the sawn timber [8,9]. Despite the enrichment of extractives, the accessibility of the wood surface to mould attack may be greater after industrial kiln drying than in e.g. sawn timber seasoned in the open air [10]. The enormous biodiversity and short life cycles of fungi also emphasises other issues involved in wood protection. The application of traditional copper-based wood preservatives has led to the adaptation of fungi to these compounds and the appearance of copper-tolerant rot fungi [9]. Colonising mould fungi such as Aspergillus sp. and Penicillium sp. can early grow and sporulate on a copper-impregnated wood surface, but the fungi gave different growth-patterns [12]. These differences are addressed in the present study.
Those fungi that are most economically significant and deleterious, related to food spoilage, mycotoxin production and bio-deterioration head the list of fungi under observation by the authorities. Attention has been paid to Paecilomyces spp. for several years due to its feared negative impact on the human body. In the present study, these fungal species (all the fungi were from the same order Eurotiales and all cosmopolitans [13]) were selected for the study because of their dominance in the simultaneous tests and because it was planned to model the growth of the selected fungi and to develop a method to predict fungal growth after surface treatments with Generally Recognised as Safe (GRAS) compounds.
The standard fungal test uses the mould grade index in the assessment of the treatment and most of the models for the prediction of fungal and mould growth on wooden surfaces are based on moist conditions. There is, however, no reliable information about the interactions between mould fungi on wooden surfaces under different test conditions. In a previous study [12], the mould-area index was introduced for the assessment of mould growth on wooden surfaces, but more information about the influence of Ascomycete genera on wood degradation is required in order to better understand the biological phenomenon.
The concept of GRAS compounds used by the Food and Drug Administration (FDA) in the USA has been said by qualified experts to guarantee the use of adequately safe substances. This could be a “green alternative” to be applied as a wood-surface treatment to prevent biological attack by harmful microorganisms [14,15]. The GRAS database includes more than 370 active GRAS substances that can be applied in a “smart way” for wood protection without any threat to humans or the environment. For example, a study of post-harvest treatment of fruits to prevent microbiological disease successfully reported an effective control of fungal growth [16]. GRAS compounds can be grouped by their action: biocontrol agents, natural antimicrobials, decontaminating agents and physical barriers [16].
This study has investigated the efficiency of treatments using selected GRAS compounds of organic and inorganic origin to restrict mould-fungi growth on wood surfaces of industrial kiln-dried Scots pine sapwood. The primary objective was to establish criteria for modelling and predicting mould growth for those fungi and surface treatments using two inoculation methods and moisture changes during the test by applying selected ascomycete fungal cultures.

2. Materials and Methods

2.1. Preparation of Wood Specimens

Five Scots pine (Pinus sylvestris L.) sideboards with cross-sectional dimensions of 30 × 200 mm and a length of 4 m were randomly selected from a sawmill production in northern Sweden (Martinsons sawmill, Kroksjön, N 64° 42.3113′, E 20° 54.4597′). The trees from which the boards originated were winter felled, i.e. the temperature was considerably below 0 °C, and the boards were deeply frozen until they reached the kiln-drying stage. The boards were single-stacked and dried in a progressive kiln at a wet-bulb temperature of 52 °C and a maximum dry-bulb temperature of 67 °C. Ten clear wood specimens, i.e. free from defects and knots, with dimensions of 30 × 50 × 100 mm, were taken from each board so that they contained only sapwood, which was verified by a heartwood reagent containing sodium nitrite and sulfanilic acid. Two of these specimens were used for density and moisture content (MC) determinations, according to EN 13183-1 [17], the other eight were used for mould tests and were coded according to the GRAS treatment applied before the mould test (Table 1). The mean MC of the boards after kiln-drying was 15.5% ± 0.4%, and the mean density at this MC was 548 ± 12 kg/m3.
It was five board in total A, B, C, D and E. The coding was used accordingly (see Figure 1). The eight specimens from each board for the mould test were divided into two groups: set#1 for direct, and set#2 for indirect inoculation method (Figure 1). The surfaces used for the fungal and mould tests were either the tangential surfaces in the direction of bark-side of the log (bark-side specimens) or the opposite tangential surface in the direction of the pith (pith-side specimens). All specimens were sterilised in steam before the GRAS treatment.
In the case of treatments B and G, the stock solution of the GRAS compound at the original concentration was diluted with water whereas, for treatment S, it was used as delivered. Treatments B and G were deposited by spraying evenly on the bark-side and pith-side surfaces of each specimen by using an airbrush with the consumption of 0.20–0.25 L/m². Treatment S was used as follows: a first treatment was sprayed evenly on the bark-side and pith-side surfaces of each specimen using an airbrush with a consumption rate of 6–8 L/m2, and the boards were allowed to dry for 2 hours. A second treatment with GRAS was applied in the same way but with a consumption of 10–12 L/m2, and allowed to dry for 4 hours, than a third coating with first GRAS was applied to all surfaces of the specimens with a consumption of 8–2.12 L/m2, and dried.

2.2. Mould Test

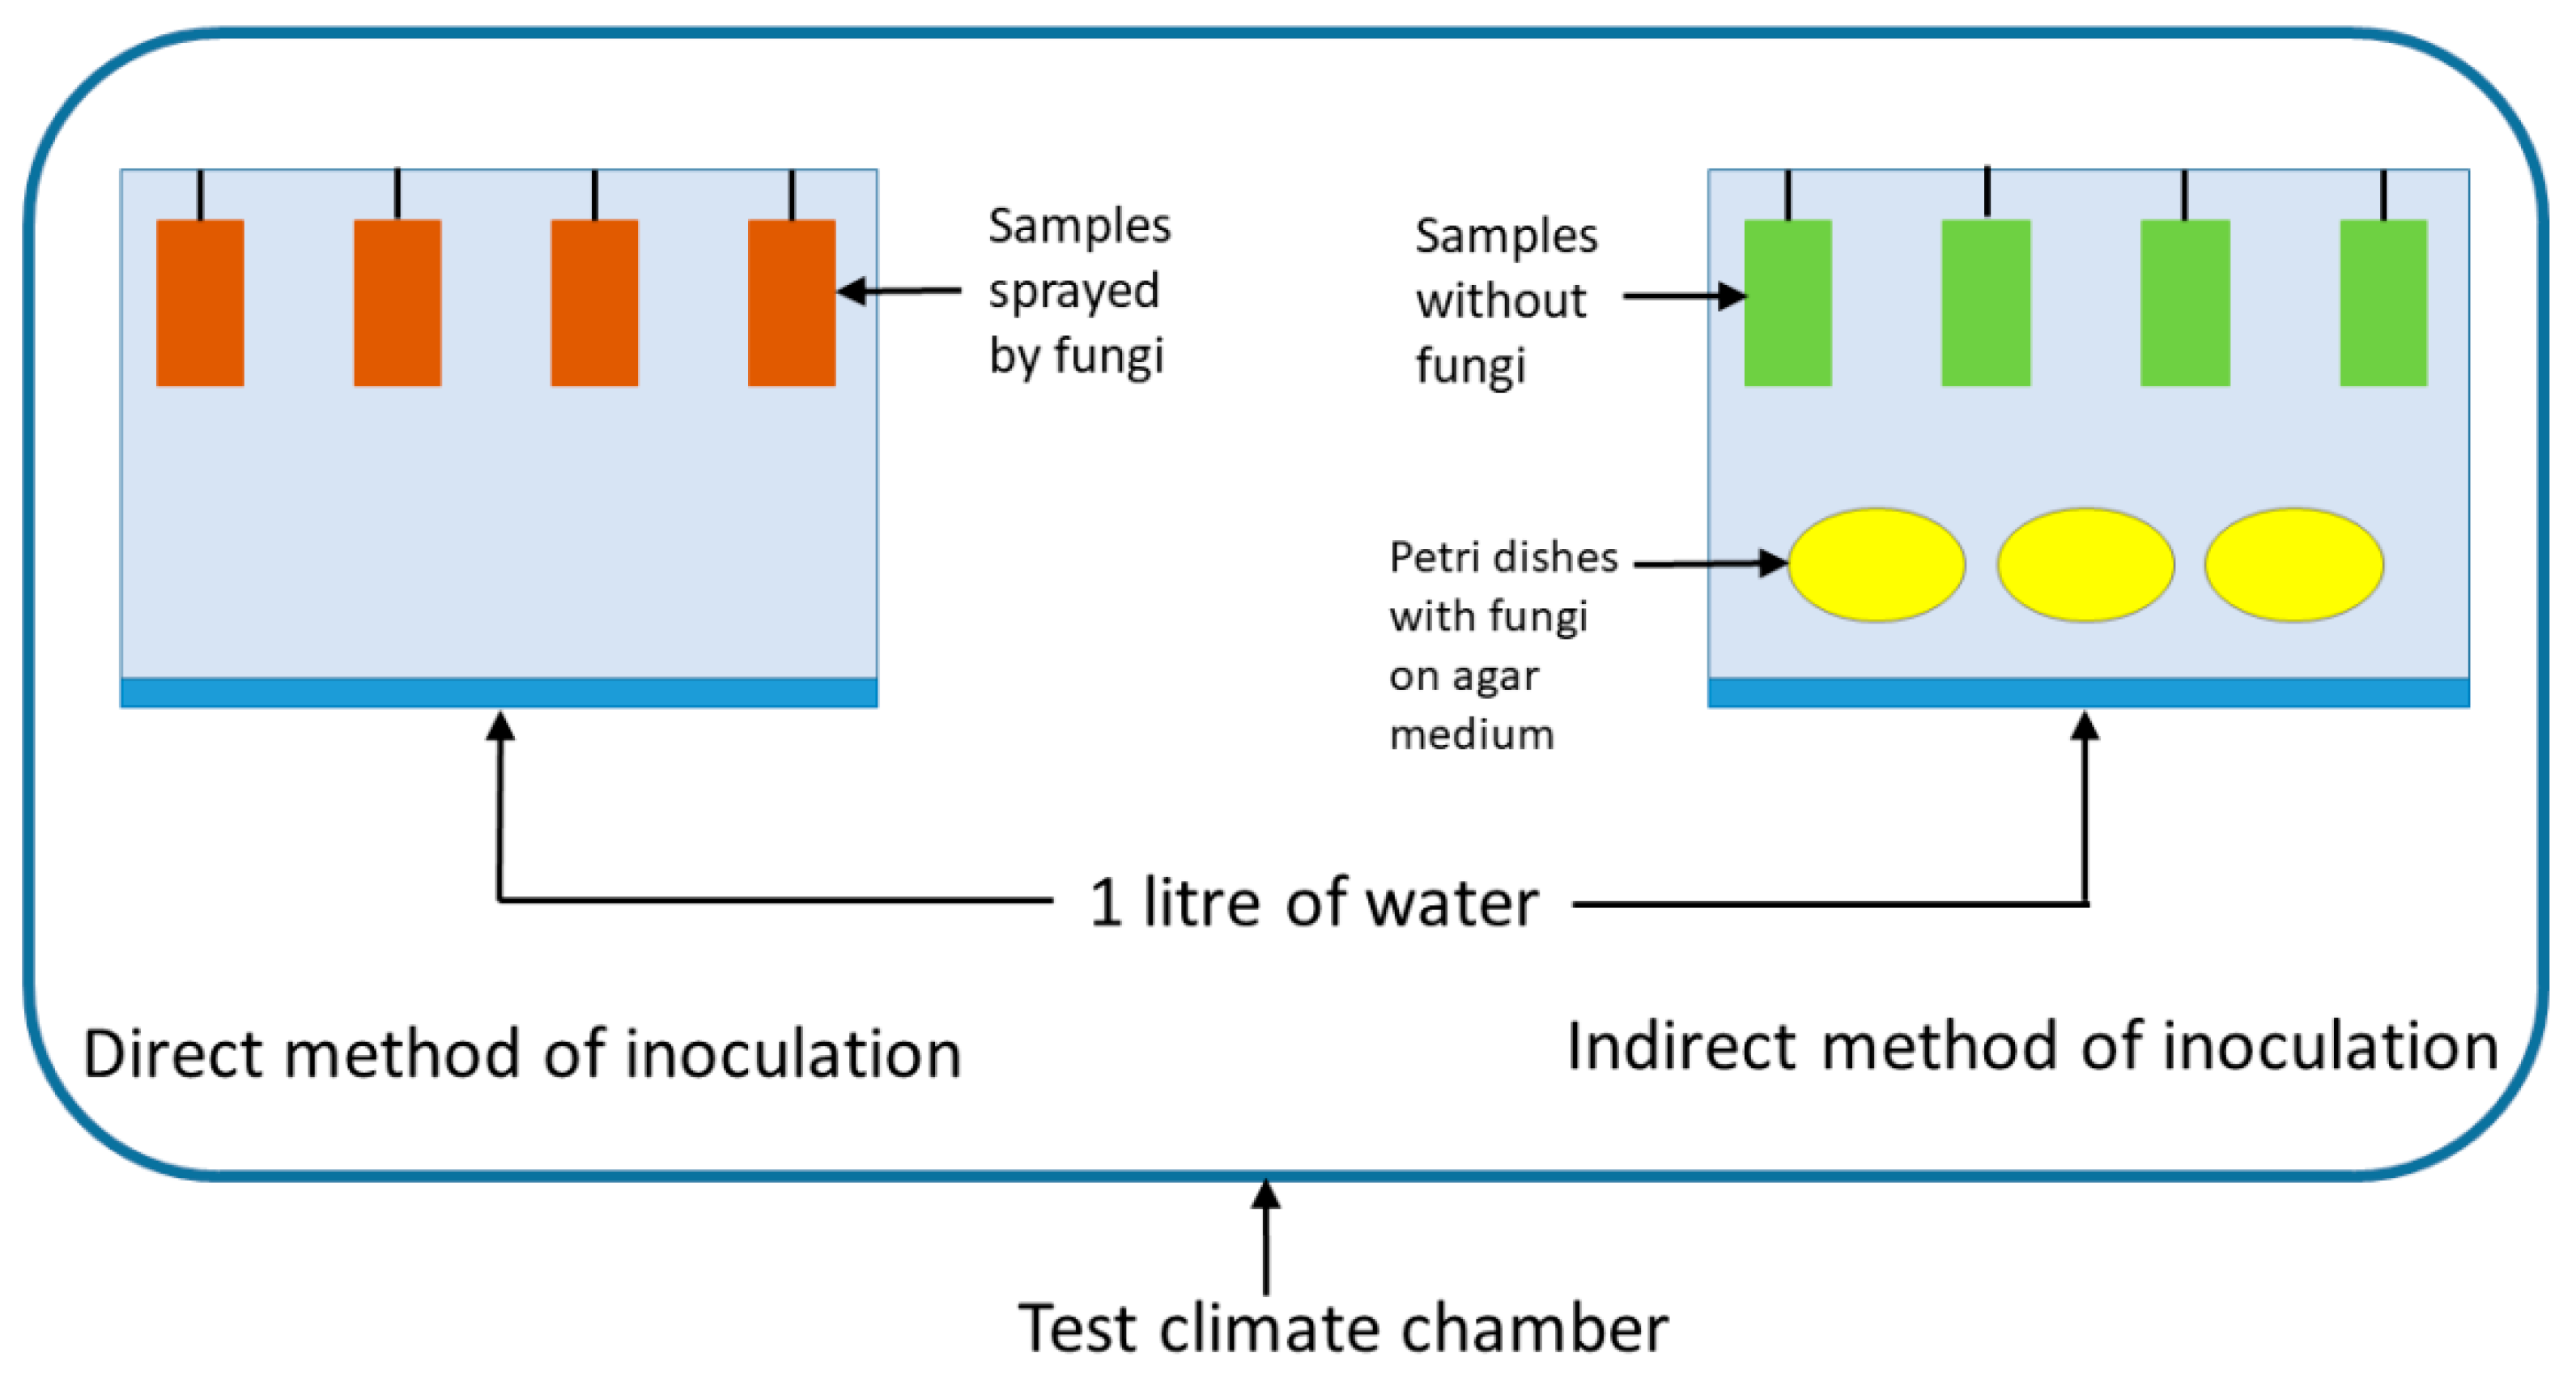
For the direct inoculation method, a mixture of spore suspension (ca. 106–107 spores/mL) from Aspergillus niger van Tieghem, Penicillium commune Thom, C., and Paecilomyces variotii Bainier (Culture collection, Division of Wood Science and Engineering, Luleå University of Technology) was sprayed onto the bark- and pith-side surfaces of each specimen in an amount of 0.4 mL using an airbrush attached to a mini-compressor with a pressure regulator giving a working pressure of 2 bar, and the samples were hung-up in plastic twines in a closed plastic container with a base area of 40 × 42 cm2, and a height of 60 cm with a bath containing one litre of water at the bottom to maintain a high humidity.
For the indirect inoculation method, the samples were hung-up in the same way as in the direct incubation method. Five Petri dishes of each mould species Aspergillus niger van Tieghem, Penicillium commune Thom, C., and Paecilomyces variotii Bainier were randomly placed the hanging specimens at the bottom of the box (Figure 2). All the sub-cultures of fungi were incubated at 24 ± 2 °C until good sporulation was achieved after seven days of growth. The choice of fungi was related to the dominant fungal species detected in simultaneous internal laboratory tests of Scots pine sapwood. A detailed description of the inoculation methods can be found in [12]. The choice of the two inoculation methods was related to the differences in processes of wood colonisation of fungi from the same order of Eurotiales.
The containers were placed in a climate chamber, and were incubated in darkness at a temperature of 25 ± 2 °C and a relative humidity (RH) of 95%–100% for the first three days, and at 25 ± 2 °C and 90% ± 3% RH for a further 25 days. The temperature and RH in the climate chamber were recorded by a logger, type AAC-2 (Intab, Sweden). The higher RH for the first three days was to give a better wetting of the samples, and to promote a faster spore germination. Before the test, the containers and the climate chamber were washed with 99% ethanol solution and then with 5% hydrogen peroxide solution in order to achieve an aseptic environment.

2.3. Mould Assessment

The grade scale used in the mould-growth assessment is presented in Table 2. The scale was modified compared to that published in standard EN 16492:2014 [18] by adding grade 4 for 51%–80%, and grade 5 for more than 80% mould growth. Examples of mould growth on wood surfaces representing the six mould grades 0–5 are shown in Figure 3.
After 28 days, the incubated specimens were removed from the climate chamber and weighed. The mould growth on the wood surfaces was evaluated by visual inspection and graded by two persons. The mould growth was graded by person A by the naked eyes in a laboratory environment, whereas person B graded the growth from images at 1× magnification where the ImageJ software [19] was used for the detection of mould growth. The individual mould species detected on the wood surfaces were identified with the optical microscope to classify the morphological characteristics of each fungus.
After assessment of mould growth, the specimens were dried in an oven at a temperature of 103 °C for 24 hours to determine the MC. The coefficient of variation (CV in %) was used to describe the scatter of the data around the mean value. The variables used for the univariate and the multivariate analysis (MVA) are described in Table 3.
The data set for statistical analysis represented in the Table S1. Univariate statistical analysis (descriptive statistics, analysis of variance (ANOVA) and post hoc tests for analysis of variance) was performed in IBM SPSS Statistics 20.0 (Armonk, NY, USA). Principal component analysis (PCA), soft independent modelling by class analogy (SIMCA) and partial least squares discriminant analysis (PLS-DA) were applied for a global overview, pattern recognition and display of relationships between variables. Partial least squares regression (PLS) was used to model how the GRAS treatments influenced the mould growth on the Scots pine sapwood surfaces. The multivariate analysis (MVA) was performed in SIMCA 14.0 (Umetrics, Umeå, Sweden).

3. Results

The local moisture content (MC) of a wood surface is one of the most important factors affecting mould-fungi spore germination, colony development and sporulation, and further spreading over the environment [13]. Table 4 shows variation in the MC between treatments of wood surfaces and inoculation methods. The one-way ANOVA test for the indirect method of inoculation showed no difference between treatments (B, S, G and reference R, see Table 1) regarding MC changes during the test, but direct spraying of spore suspension resulted in a significantly lower variable MC increase for treatment with bacteria B compared to reference material R.
Multiple comparisons using Tukey´s range test [20] was performed to analyse the influence of the different treatments on mould growth, i.e. within the inoculation-method groups, between methods of inoculation, and on bark-side and pith-side surfaces (see Tables S2 and S3). The corresponding p-values are presented in Table S2 in the supplemented material. It was not possible to show any influence of the type of treatments within the indirect inoculation group, but there were differences between the treatments within the direct inoculation group.
There were only slight differences in MC between the different treatments after the mould test.
There was no significant difference in the MC increase between the methods of inoculation for groups R, B, and S, but the MC increase differed between inoculation methods for group G (Table S3 in the supplementary material).
The variance of the fungal area and mould grade on different GRAS-treated wooden surfaces is shown in Table 5. The most effective GRAS treatment preventing mould growth was the SIOO treatment (Group S) in both the indirect and direct inoculation methods with average mould grades of 1.9 and 1.8, respectively.
The mould area was smallest for Aspergillus niger in the indirect inoculation method, but in general it was smallest for Paecilomyces variotii (Table 5). The G treatment gave a mould area for indirect inoculation with Aspergillus sp. greater than that with the other treatments and for the reference sample, but the variation (CV) was quite high. Univariate analysis performed to statistically access differences between the treatments showed little influence of the GRAS treatment on mould area.
Tukey test was used to obtain differences in mould area between the treatments within the inoculation methods. Analysis of the indirect method of inoculation revealed no influence of B treatment on the Aspergillus niger fungal area and the R group differed only from the G group (p = 0.008). There were clear similarities in the GRAS treatments, where groups S, R and B were similar with regard to the area of Aspergillus sp. but differed from G (p = 0.001). For the Penicillium commune fungal area, it can be concluded that the samples can be divided into two groups by their similarities (Table 5). The first group contains the R and B groups and the second the S and G groups. With the Paecilomyces variotii species the R group differed from the S group but was similar to the B and G groups and the S group was found to be distinct from R and B groups but similar to the G group.
Mould growth was characterised by the mould grade index, which does not relate directly to the mould type but includes the intensity of growth (see Figure 3). Wood surfaces treated with SIOO (group S) had the lowest mould grade index. The R group was similar to the B group, but differed from the S and G groups, but the S and G groups differed from each other and other treatments (R, B) also (see Table 5).
The direct method of inoculation showed significant differences between the treatments (Table 6). According to the Tukey criteria, the fungal areas of Aspergillus niger in the R, B, G groups were similar, but they differed from the S group. With Penicillium commune fungi, the R group differed only from G group. The B and S groups were similar to other treatments. The Paecilomyces variotii fungal area for group R was similar to that of group B but different for groups S and G. Groups S and G were similar to group B, but differed from group R. Group B was similar to all the groups. With regard to mould grade, the R, B, and G groups were similar, but differences were observed only for the S group. Thus, treatment with SIOO was most effective in preventing the growth of mould under the conditions used in this study.
It was expected that while drying, the nutrients, especially in the direction of the bark-side of the board, migrate towards the surfaces making the surface more attractive for mould growth [6]. This was not, however, clearly seen in the data, but direct inoculation of Aspergillus sp. let to a distinct colonisation on the bark side. This means that this fungus had a considerable influence on its metabolism of sugars. With indirect inoculation, other factors could be more influential. The S treatment has a significant influence on hindering the spreading of Aspergillus sp. fungus on both sides of the specimen. The S-treatment consisted of application of alkaline silicate followed by a silicon-containing aqueous-emulsion, which is thought to seal the wood surface, making it more difficult for fungi to penetrate the wood and access nutrients.
Regarding the influence of the bark/pith side surface index on mould growth, the highest growth was expected where the highest nutrient contents are found, usually on the bark-side surface. However, with Paecilomyces sp. directly inoculated, less mould growth was found on the bark side of the sapwood after R, B and G treatment, but not after S treatment although this seemed to be the most efficient treatment to hinder fungal growth (Table 6). Such a pattern was indicated for the S treatment which gave the lowest mould development for both methods of inoculation.
The pattern of fungal development on the bark side for R groups of both methods showed no significant difference in mould grade for areas colonised by Aspergillus sp. The fungal areas of Penicillium sp., Paecilomyces sp. for the bark- and pith side of sapwood surface differed significantly (p = 0.002, 0.005, and 0.031, respectively) with different methods of inoculation. Interestingly, the comparison of fungal areas in the R group between the inoculation methods revealed a significant difference for Aspergillus sp. and Penicillium sp. (p = 0.022 and 0.035), but not for Paecilomyces sp.
The B group mould-grade indices for bark/pith-side surfaces were not significantly different from each other, and showed the highest mould grade value, and the areas of Aspergillus sp., Penicillium sp., Paecilomyces sp. in group B significantly differed between the bark-side and pith-side surfaces (p = 0.001, 0.000, and 0.001, respectively). For B group, neither indirect nor direct treatments inoculation gave any significant difference in mould grade, but there was a significant difference for fungal areas of Aspergillus sp., Penicillium sp., Paecilomyces sp. with p = 0.000; 0.000 and 0.004 respectively. A significant difference in fungal area of pith-side surfaces after indirect and direct inoculation for the B group was found only for Paecilomyces sp. with p = 0.037.
With the S group there were no significant differences between bark/pith-side surfaces for Aspergillus sp. but there was a distinct difference with Penicillium sp. and Paecilomyces sp. with p = 0.008 and 0.005. With the samples from G group in terms of bark/pith-side surfaces the inoculation method had a significant differences only for Aspergillus sp. and Penicillium sp. with p = 0.004 and 0.040 respectively. The difference between inoculation methods for bark-side surfaces for group G was significant for the area of Penicillium sp. fungus with p = 0.044. For the pith-side surface, a significant difference between inoculation methods was obtained only for Aspergillus sp. with p = 0.014.
The average in variable mould area showed, in general, that the Aspergillus sp. area when inoculated indirectly was 3.6 times smaller than with the direct method (see Table 5 and Table 6). The area for Penicillium sp. was the opposite of the area in the indirect method being 2.5 times larger than with the direct method.
The behaviour of Paecilomyces sp. was similar to that of Penicillium sp. showing a 2.6 times higher value of fungal area after indirect rather than direct inoculation, but a value lower 3 times than the Penicillium sp. area. The mould grade averages was similar with both inoculation methods. The high variability of the data of all the samples from 0% to 316% (see Table 5 and Table 6) makes it difficult to draw relevant conclusions based on the univariate or comparison of average data. In order to find a possible deeper relationship between the variables, a multivariate statistical analysis was performed.
By plotting two principal components, it was possible to observe the spreading and grouping pattern in the dataset, but in PC analysis the model performance (R2) was low (see Model 1 in Table 6). Despite the weakness of model 1, it showed the correlation between Aspergillus area and the method of inoculation (Table 3), supporting the previous observation from Table 5 that for all surface treatments, the coverage area for Aspergillus was higher when the indirect inoculation method was applied. However, with Penicillium sp., the area depended on the type of treatment with a maximum in the R group for both inoculation methods and a minimum in the G group for direct inoculation (Table 5).
A stronger performance of the model was achieved by PLS-DA modelling, but the OPLS-DA classification was even stronger (Table 7). The critical variables for explaining the model were mould grade and area of fungi.
A stronger performance of the model was achieved when Mould grade was used as Y (response) and other variables as X (explanatory variables)— the results of PLS regression (model 4 in Table 6) described in Table 6. However, the R2X was quite low in comparison to the Q value due to high noise. The observation of the DModX plot (the distance of observation in training set to the X model plane or hyperplane) revealed a definite outlier, and its removal marginally improved the PLS model (No 5.) listed in Table 6.
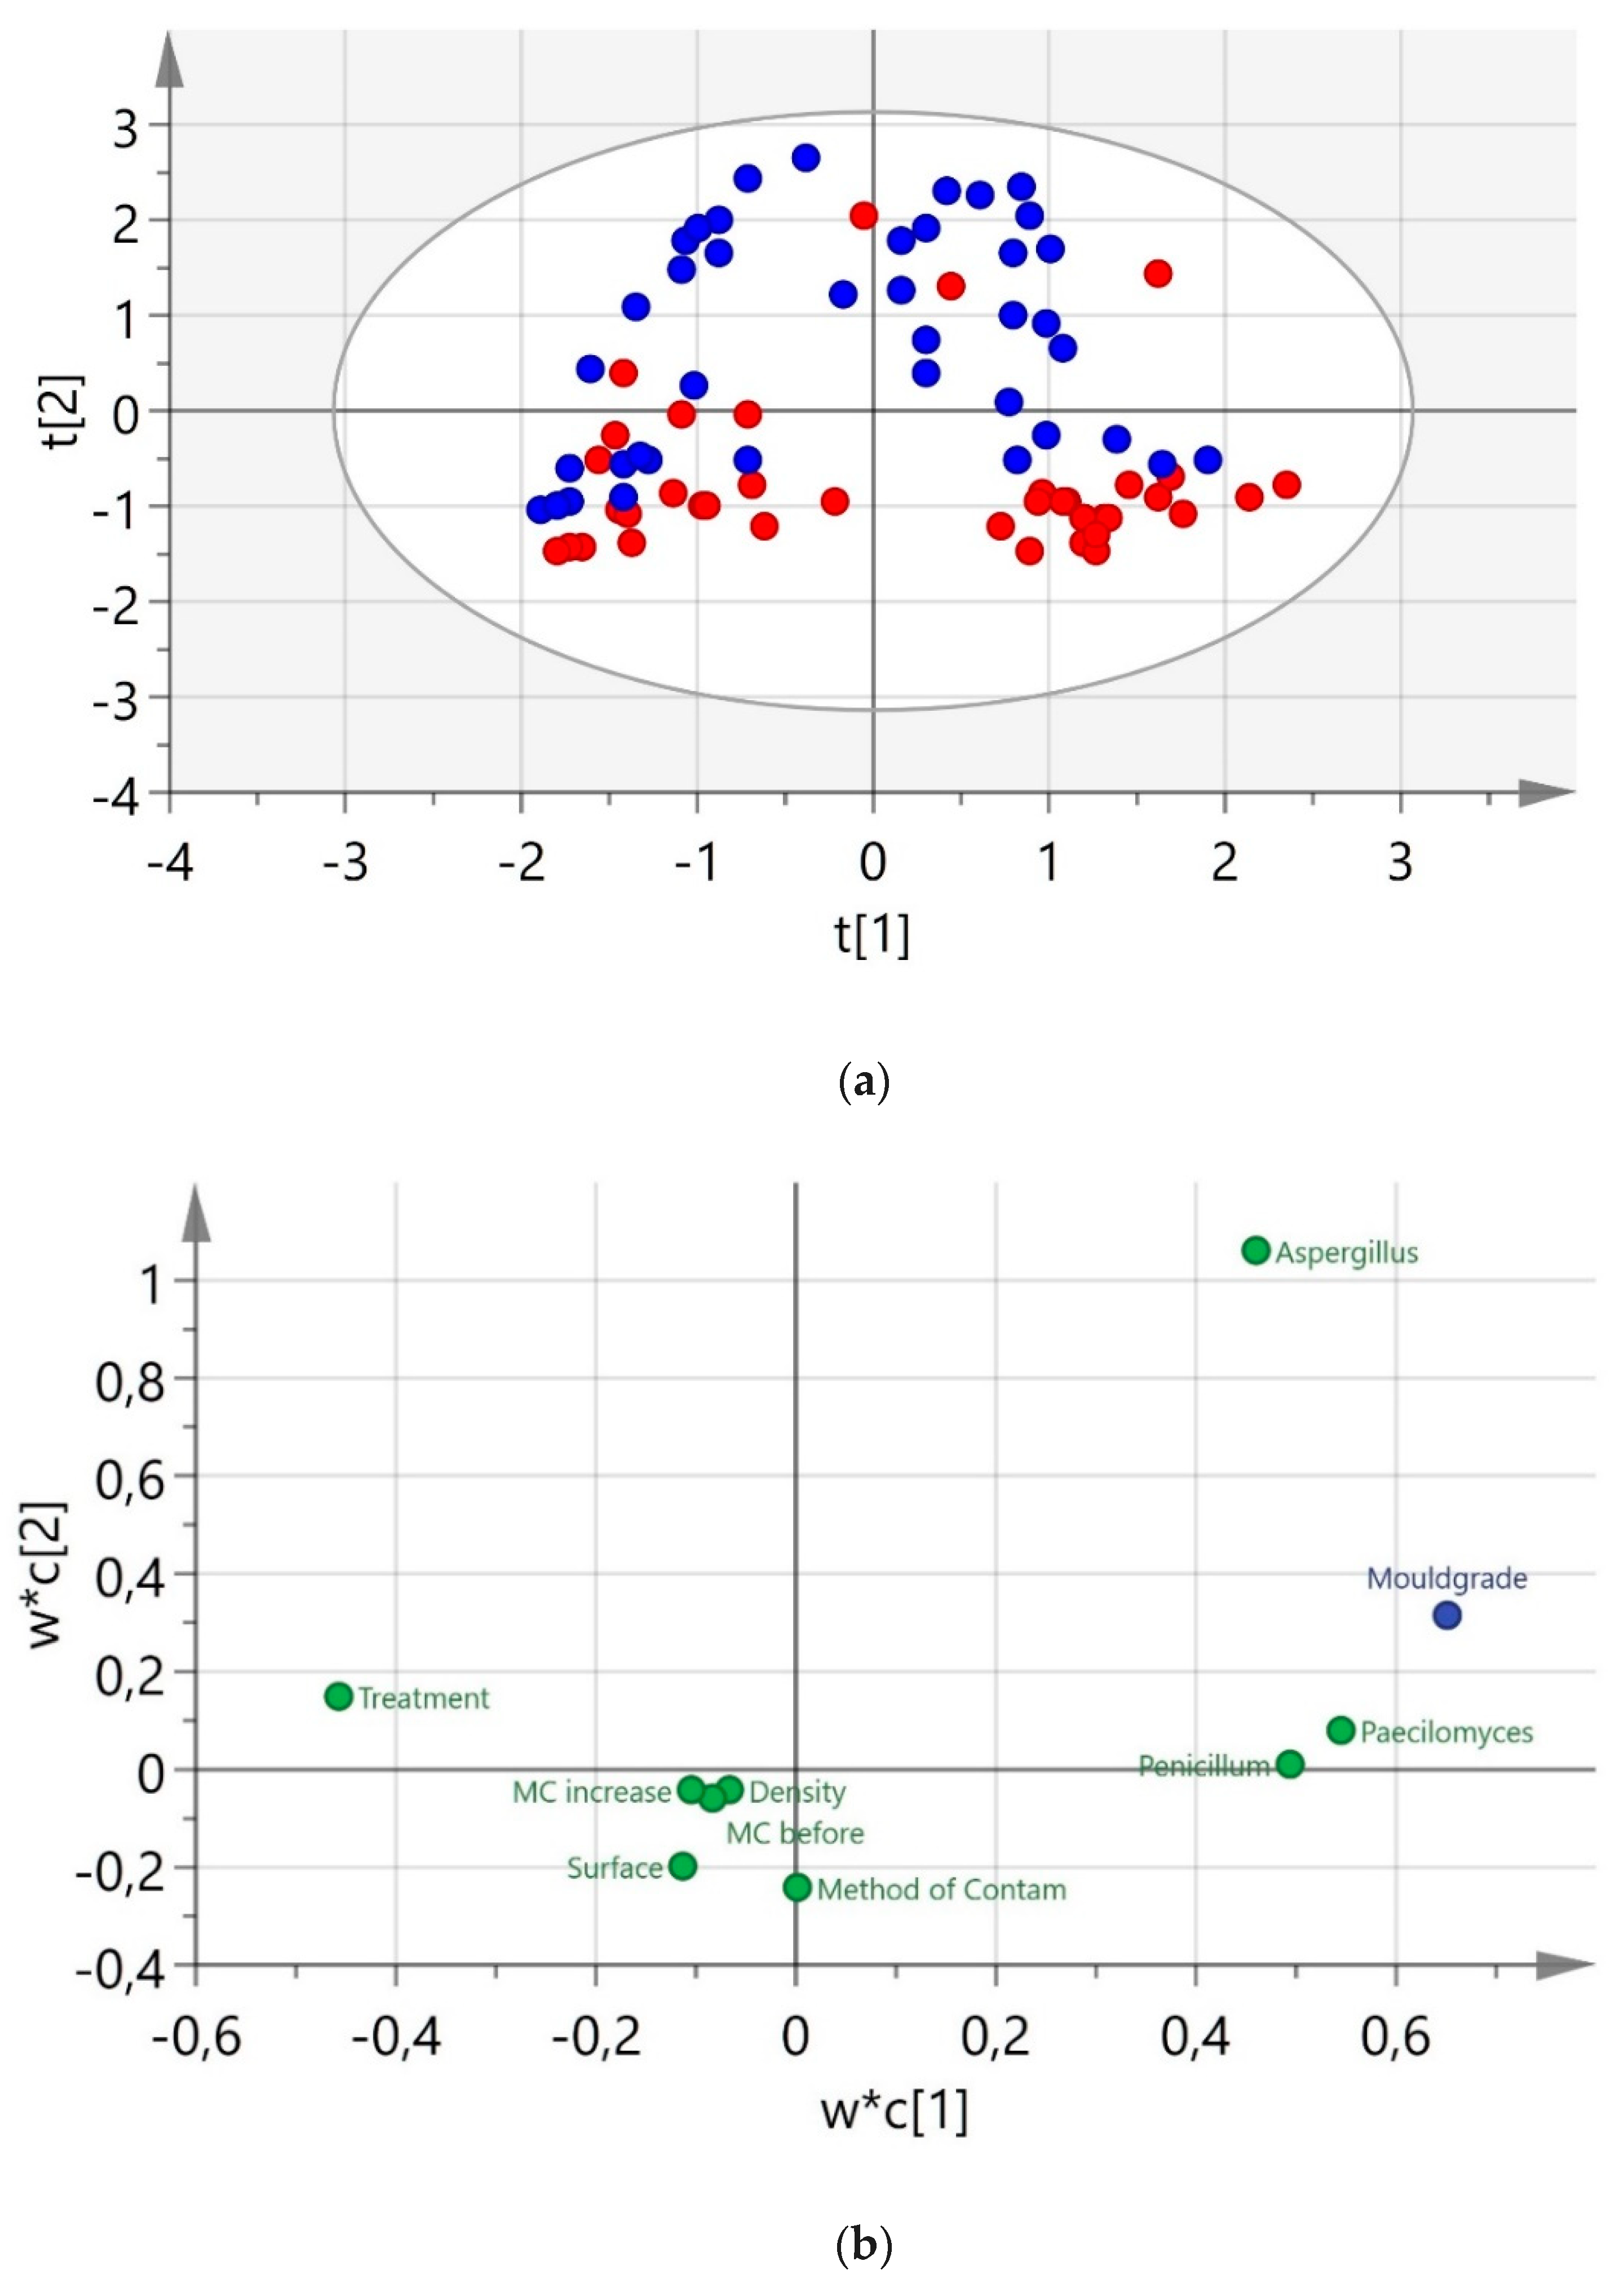
The scope and loading plot of the PLS model No. 5 is presented in Figure 4. It is evident that the Aspergillus sp. is highly associated with the indirect method of inoculation (Figure 4a) whereas the areas of Penicillium sp. and Paecilomyces sp. were found to be more influenced by the type of treatment. It is also evident that there are moderate relations between these two fungi (correlation coefficient 0.7), and the Paecilomyces sp. moderately contributed to mould grade development (Figure 4b).
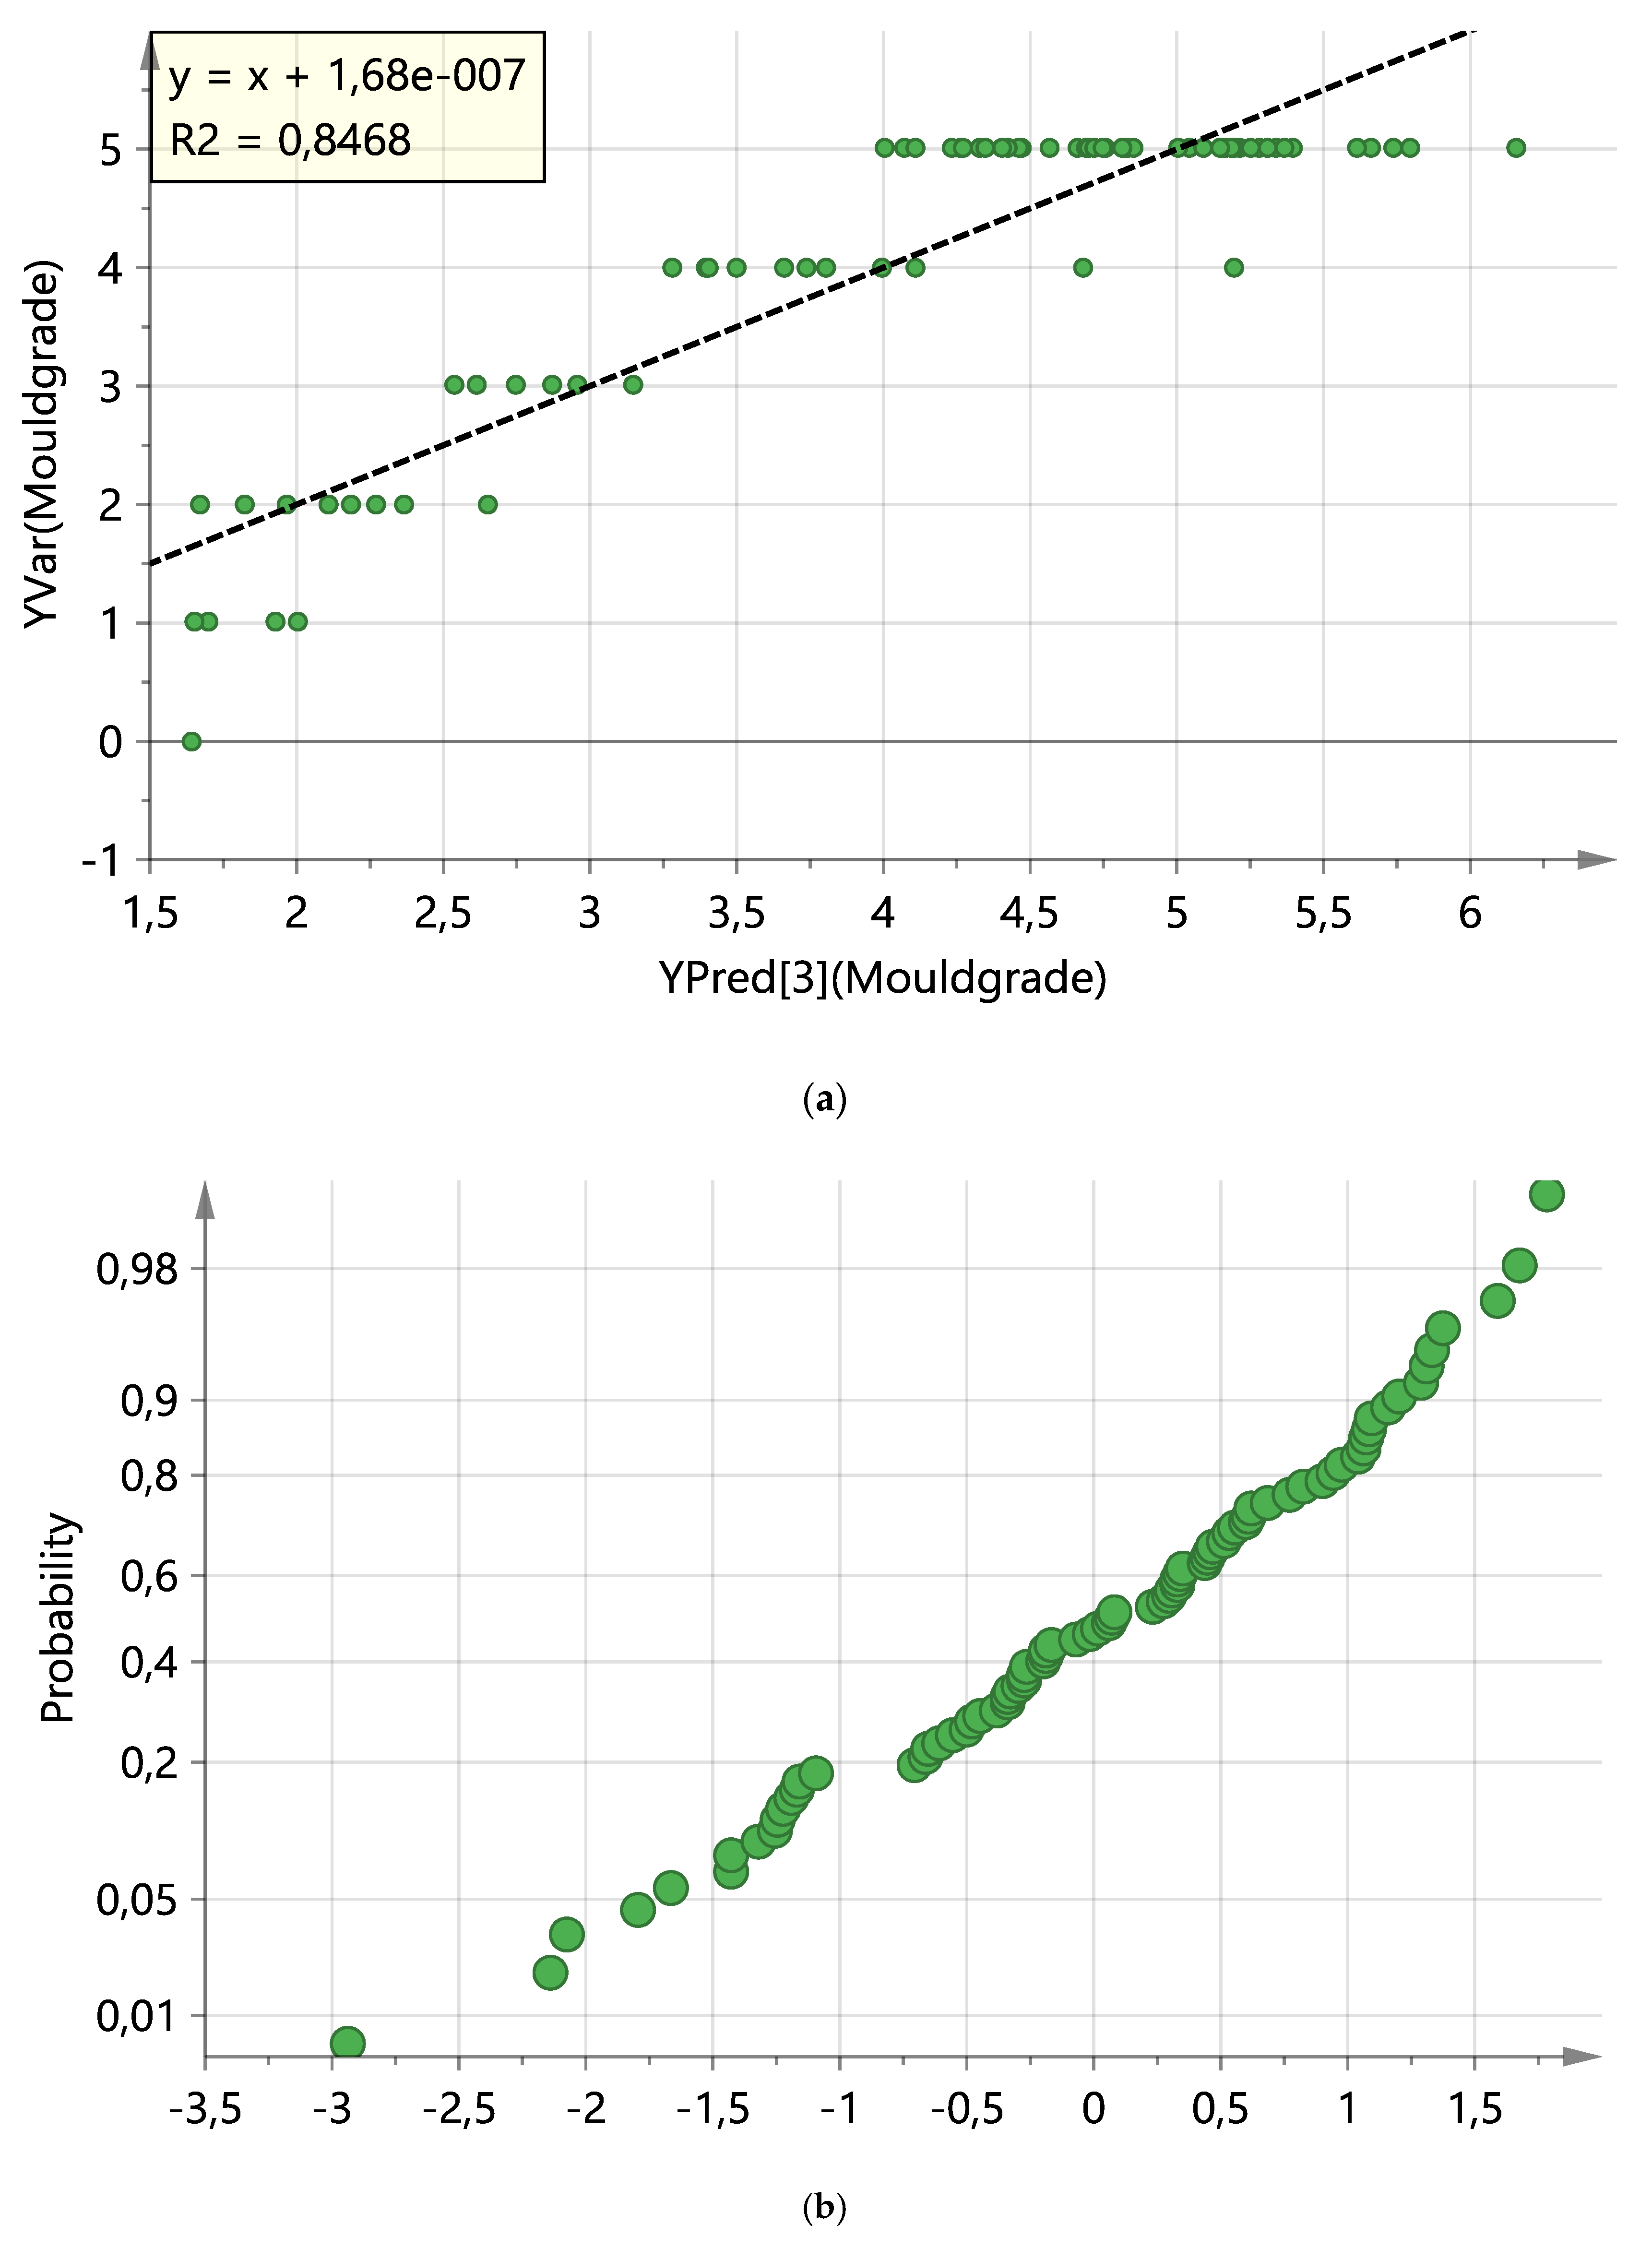
The variables that contributed most to the model or were essential for the projection of VIP were the areas of Aspergillus sp., Penicillium sp., Paecilomyces sp and the mould treatment method. The regression line for PC3 is presented in Figure 5a. In Figure 5b, residuals from normal and random distribution and absence of outliers are demonstrated.

4. Discussion

The present study provides an understanding of the influence of GRAS compounds of organic and inorganic origin in restricting mould fungi growth on dry Scots pine sapwood surfaces. The selected fungal species were isolated main primary colonisers [13]. Efforts were made to define criteria for multivariate modelling and the prediction of mould growth for various GRAS treatments under the influence of different inoculation methods.
Between selected GRAS treatments, the most effective treatment was treatment S (potassium silicate) which gave the greatest reduction in fungal growth in the direct method of inoculation with the lowest mould grade. The known fact that potassium silicate has a fungicidal effect via reinforcement of the wood surface and acts as a physical barrier for the fungi improves the properties of the material [21,22,23]. The efficiency of bacterial treatment was lowest and rather stimulated fungal growth. This effect is surprising because the biocidal role of Bacillus sp. has been reported in wood protection [24]. The biocidal action of quaternary ammonium compounds (group G) was found to be small and seemed not to be useful for mould control. The non-treated reference boards showed high mould grade, but it was lower in the direct method of inoculation than with indirect inoculation due to low fungal growth on the inner pith surface with a variation of 43%–67%. In general, the growth of fungi on inner pith surfaces was lower than on the bark side surface of the samples. This was expected because of the presence of extensive nutrients close to the cambium/bark. In this study, boards were single stacked during drying and the movement of nutrients occurred in all directions. Such a nutrient enrichment of the sapwood side influenced fungal growth even after subsequent preservative surface treatment [8,9,12]. Noticeable was the great variation in the data within the test results particularly when direct inoculation was applied (from 0% to over 300%). The equilibrium moisture content (EMC) for the reference wood sample was calculated to be ca 24.4% in our test conditions according to tables [25]. At the end of the test, the MC of all samples was higher than that EMC value but the final MC was found to have a negligible influence on fungal growth probably because the high moisture conditions are favourable for mould growth.
The method of inoculation influenced the development of Aspergillus sp. growth, the development of the fungal area was quite significant in the direct method of inoculation. It agrees with our previous study [12], and the necessity of a water reservoir for single dry spores’ germination of Aspergillus sp. was proposed [13]. The Penicillium sp. growth was more related to the type of treatment and was more intense with the indirect method of inoculation. It is reasonable since the growth of Penicillium sp. and Paecylomyces sp. were related in our study, and previous studies have shown that, for example, Penicillium sp. spores and probably Paecylomyces sp. do not require large amounts of water for germination and no influence on the growth of the method of inoculation was found [26]. The areas of all fungi in our study influenced the mould grade in the multivariate model the Paecylomyces sp. having most significant influence on the model performance. The three-component PLS model showed quite a strong performance and can predict about 77% of data variation (Q2 = 0.766).

5. Conclusions

This study contributes to the transition to sustainable wood materials by applying GRAS compounds that can control and prevent contamination by primary colonising mould fungi. Substances based on potassium silicate could be excellent sustainable substances for wood treatment. By combining wood surface treatments with the response to a fungal attack, a PLS model makes it possible to predict the contamination rate of wood. The model may be beneficial in the use of smart sorting systems equipped with high-speed digital cameras in industrial use. It shows the ability to model such a complicated phenomenon that standard tests do not provide. However, the measurements based on chemical characterisation should be the next step to take in order to significantly enhance model properties and increase the range of robust applications.

Supplementary Materials

The following are available online at https://www.mdpi.com/1999-4907/10/9/714/s1: Table S1: Data set used for data analysis in the article; Table S2: The p-value for the significance of moisture content changes after test difference between treatments in the indirect and direct method of inoculation, significant difference p ˂ 0.05; Table S3: The p-value for the significance of difference between treatments in both methods, significant difference p ˂ 0.05.

Author Contributions

Conceptualization, O.M., F.P., M.S.-P., and O.K.; methodology, O.M., M.S.-P., and O.K.; software, D.S.; validation, O.M., F.P., M.S.-P., and O.K., T.V., D.S., H.J.; formal analysis, O.M., F.P.; investigation, O.M., F.P.; resources, T.V., D.S., H.J.; data curation, O.M., F.P., M.S.-P., and O.K.; writing—original draft preparation, O.M., F.P.; writing—review and editing, O.M., F.P., M.S.-P., and O.K., T.V., D.S., H.J.; visualization, O.M..; supervision, M.S.-P., O.K.; project administration, M.S.-P., O.K.; funding acquisition, D.S., O.K.

Funding

This research was funded by the FORMAS (Swedish Research Council for the Environment Agricultural Sciences and Spatial Planning) (FORMAS), project number 419, 2017 and 942-2016-64, 2016.

Acknowledgments

Support from Martinsons Såg AB sawmill, The European Regional Development Fund, the County Administration of Västerbotten, the municipality of Skellefteå, and WoodCentreNorth is much appreciated and acknowledged. Also, the authors express appreciation for the support of COST Action FP1407. The European Commission is gratefully acknowledged for funding the InnoRenew CoE project (#Grant Agreement 739574) under the Horizon2020 Widespread-Teaming program.

Conflicts of Interest

The authors declare no conflict of interest.

References

  1. European Union. European Parliament and of the Council Directive 2004/42/CE on the Limitation of Emissions of Volatile Organic Compounds Due to the Use of Organic Solvents in Certain Paints and Varnishes and Vehicle Refinishing Products and Amending Directive 1999/13/EC; European Union: Brussels, Belgium, 2004. [Google Scholar]
  2. European Union. ECHA Directive 98/8/EC Concerning the Placing of Biocidal Products on the Market; European Union: Brussels, Belgium, 2011. [Google Scholar]
  3. Dijck, P.V.; Brown, N.A.; Goldman, G.H.; Rutherford, J.; Xue, C.; Zeebroeck, G.V. Nutrient Sensing at the Plasma Membrane of Fungal Cells. Microbiol. Spectr. 2017, 5. [Google Scholar] [CrossRef]
  4. Evans, P.D. Weathering of Wood and Wood Composites. In Handbook of Wood Chemistry and Wood Composites; Rowell, R.M., Ed.; Taylor & Francis Group: Abingdon, UK, 2013. [Google Scholar]
  5. Kujanpää, L.; Reiman, M.; Kujanpää, R.; Halonen, R.; Kokotti, H. The Influence of Outdoor Air Micro Flora and Season on the Indoor Surfaces of a Building. In Proceedings of the International Society of Indoor Air Quality and Climate, Beijing, China, 4–9 September 2005; pp. 1772–1776. [Google Scholar]
  6. Bennett, J.W.; Klich, M. Mycotoxins. Clin. Microbiol. Rev. 2003, 16, 497–516. [Google Scholar] [CrossRef] [PubMed] [Green Version]
  7. Wallin, S.; Gambacorta, L.; Kotova, N.; Lemming, E.W.; Nälsén, C.; Solfrizzo, M.; Olsen, M. Biomonitoring of concurrent mycotoxin exposure among adults in Sweden through urinary multi-biomarker analysis. Food Chem. Toxicol. 2015, 83, 133–139. [Google Scholar] [CrossRef] [PubMed]
  8. Terziev, N. Migration of Low-Molecular Sugars and Nitrogenous Compounds in Pinus sylvestris L. During Kiln and Air Drying. Holzforsch. Int. J. Biol. Chem. Phys. Technol. Wood 2009, 49, 565–574. [Google Scholar]
  9. Myronycheva, O.; Karlsson, O.; Sehlstedt-Persson, M.; Öhman, M.; Sandberg, D. Distribution of low-molecular lipophilic extractives beneath the surface of air- and kiln-dried Scots pine sapwood boards. PLoS ONE 2018, 13, e0204212. [Google Scholar] [CrossRef] [PubMed]
  10. Karlsson, O.; Myronycheva, O.; Sehlstedt-Persson, M.; Öhman, M.; Sandberg, D. Multivariate modeling of mould growth in relation to extractives in dried Scots pine sapwood. In Proceedings of the 48th Conference of the International Research Group on Wood Protection, IRG48, Ghent, Belgium, 4–8 June 2017. [Google Scholar]
  11. Guillén, Y.; Navias, D.; Machuca, Á. Tolerance to wood preservatives by copper-tolerant wood-rot fungi native to south-central Chile. Biodegradation 2009, 20, 135. [Google Scholar] [CrossRef] [PubMed]
  12. Myronycheva, O.; Sehlstedt-Persson, M.; Karlsson, O.; Sandberg, D. Growth of Mold and Rot Fungi on Copper-impregnated Scots Pine Sapwood: Influence of Planing Depth and Inoculation Pattern. BioResources 2018, 13, 8787–8801. [Google Scholar] [CrossRef]
  13. Adnan, O.C.G.; Samson, R.A. Fundamentals of Mold Growth in Indoor Environments and Strategies for Healthy Living; Wageningen Academic Publishers: Wageningen, The Netherlands, 2011; ISBN 978-90-8686-135-4. [Google Scholar]
  14. U.S. Food and Drug Administration Generally Recognized as Safe (GRAS). Available online: https://www.fda.gov/Food/IngredientsPackagingLabeling/GRAS/ (accessed on 16 January 2019).
  15. U.S. Food and Drug Administration GRAS Substances (SCOGS) Database. Available online: https://www.fda.gov/food/ingredientspackaginglabeling/gras/scogs/default.htm (accessed on 17 January 2019).
  16. Romanazzi, G.; Lichter, A.; Gabler, F.M.; Smilanick, J.L. Recent advances on the use of natural and safe alternatives to conventional methods to control postharvest gray mold of table grapes. Postharvest Biol. Technol. 2012, 63, 141–147. [Google Scholar] [CrossRef]
  17. CEN-European Committee for Standardization. EN 13183-1 Moisture Content of a Piece of Sawn Timber-Part 1: Determination by Oven Dry Method 2004; CEN-European Committee for Standardization: Brussels, Belgium, 2004. [Google Scholar]
  18. CEN-European Committee for Standardization. EN 16492:2014 Paints and Varnishes-Evaluation of the Surface Disfigurement Caused by Fungi and Algae on Coatings; CEN-European Committee for Standardization: Brussels, Belgium, 2014. [Google Scholar]
  19. Schindelin, J.; Arganda-Carreras, I.; Frise, E.; Kaynig, V.; Longair, M.; Pietzsch, T.; Preibisch, S.; Rueden, C.; Saalfeld, S.; Schmid, B.; et al. Fiji: An open-source platform for biological-image analysis. Nat. Methods 2012, 9, 676–682. [Google Scholar] [CrossRef] [PubMed]
  20. Tukey, J.W. Comparing Individual Means in the Analysis of Variance. Biometrics 1949, 5, 99–114. [Google Scholar] [CrossRef] [PubMed]
  21. Rodrigues, F.A.; Datnoff, L.E. Silicon and Plant Diseases; Springer International Publishing: Basel, Switzerland, 2015; ISBN 978-3-319-22929-4. [Google Scholar]
  22. Okon, K.E.; Lin, F.; Chen, Y.; Huang, B. Effect of silicone oil heat treatment on the chemical composition, cellulose crystalline structure and contact angle of Chinese parasol wood. Carbohydr. Polym. 2017, 164, 179–185. [Google Scholar] [CrossRef] [PubMed]
  23. Lahtela, V.; Kärki, T. Effects of impregnation and heat treatment on the physical and mechanical properties of Scots pine (Pinus sylvestris) wood. Wood Mater. Sci. Eng. 2016, 11, 217–227. [Google Scholar] [CrossRef]
  24. Kreber, B.; Morrell, J.J. Ability of Selected Bacterial and Fungal Bioprotectants to Limit Fungal Stain in Ponderosa Pine Sapwood. Wood Fiber Sci. 2007, 25, 23–34. [Google Scholar]
  25. Esping, B. Trätorkning: Grunder i Torkning; Trätek: Stockholm, Sweden, 1992; ISBN 978-91-88170-06-4. [Google Scholar]
  26. Nguyen Van Long, N.; Rigalma, K.; Coroller, L.; Dadure, R.; Debaets, S.; Mounier, J.; Vasseur, V. Modelling the effect of water activity reduction by sodium chloride or glycerol on conidial germination and radial growth of filamentous fungi encountered in dairy foods. Food Microbiol. 2017, 68, 7–15. [Google Scholar] [CrossRef] [PubMed]
Figure 1. The preparation of specimens from each of the five sideboards, and an example of labelling according to one of the boards: the first letter indicates the board from which the specimens were cut (A), the second letter indicates the GRAS treatment (see Table 1), and the third letter indicates the inoculation method: D indicates direct inoculation, and I indicates indirect inoculation.
Forests 10 00714 g001
Figure 2. Containers for the mould tests with hanging specimens, and Petri dishes of each mould species (right).
Forests 10 00714 g002
Figure 3. The six grades of mould growth on wood surfaces.
Forests 10 00714 g003
Figure 4. Partial least squares (PLS) model performance: (a) Score plot and (b) Loading plot with PC1 plotted against PC2. Colours indicate the method of inoculation: blue—indirect inoculation and red—direct inoculation.
Forests 10 00714 g004
Figure 5. PLS model diagnostics: (a) observed versus predicted values of Y response (mould grade) plot and (b) normal probability plot of residuals.
Forests 10 00714 g005
Table 1. Coding of specimens and description of the Generally Recognised as Safe (GRAS) treatments used in the study.
CodeActive Substance for Surface TreatmentOriginal ConcentrationConcentration Used
RReference
BBacteria Bacillus amyloliquefaciens
(trade company ABITEP, Germany)
25 bln spores/mL1%
SSilicon, potassium, natural parts of plants and water (trade company SIOO, Sweden)1st potassium silicate ca. 32%
2nd polymerizable alkoxylane
100%
GN-Alkylbensyldimethylammonium chloride (trade company JAPE, Sweden that)80 g/L20%
Table 2. Grades for assessment of mould growth on wood surfaces.
GradeDescription
0No visable mould growth
1Initial fungal growth consisting of scattered hyphae on the surface: less than 5% of the studied surface is covered by mould
2Still scattered growth, but more apparent than in 1. Conidiophores may have started to develop: 6% to 20% mould growth
3Patchily distributed, massive growth, and hyphae with developed conidiophores:
21% to 50% growth
4Heavy growth over the entire surface: 51% to 80% mould growth
5Very heavy growth: more than 80% mould growth
Table 3. Description of the variables used in the univariate and multivariate analysis.
VariableRange
Boards A, B, C, D, E1–5
Method of inoculation1-indirect
0-direct
GRAS treatment1-R
2-B
3-S
4-G
Surface0-bark side
1-pith side
Mould grade 0–5
Density548 ± 12 kg/m3
The initial moisture content of the board before the fungal test15.5% ± 0.4%
Moisture content increase12.1% ± 1.5%
Area covered by fungus Aspergillus niger0–87.3%
Area covered by fungus Penicillium commune0–91.9%
Area covered by fungus Paecilomyces variotii0–80.9%
Table 4. The moisture content (MC) of specimens after 30 days fungal test, and the percentage increase from the initial MC (Mean + standard deviation (SD)).
GRAS
Treatment
MC after the Test (%)MC Increase during the Test (%)
Indirect Fungal-Inoculation Method
R27.3 ± 0.811.8 ± 1.2
B28.0 ± 2.812.5 ± 2.6
S27.7 ± 0.811.8 ± 1.0
G28.9 ± 2.213.4 ± 2.0
Average27.4 ± 1.211.8 ± 1.0
Direct Fungal-Inoculation Method
R27.8 ± 1.112.3 ± 0.8
B26.4 ± 1.0 *10.9 ± 0.8 *
S28.1 ± 1.012.6 ± 0.8
G27.0 ± 1.011.5 ± 0.7
Average27.9 ± 1.912.4 ± 1.9
* significant difference between GRAS treatments according to one way ANOVA, p ˂ 0.05.
Table 5. The fungal area and mould grade on different GRAS treated surfaces, %.
GRAS
Treatment
Fungal Area of Aspergillus nigerFungal Area of Penicillium communeFungal Area of Paecylomyces variottiMould Grade
MeanRange (SE)CV, %MeanRange (SE)CV, %MeanRange (SE)CV, %
Indirect Fungal Inoculation
R
Bark side
Pith side
4.8
4.0
5.6
1.0–14.1 (1.6)
1.0–12.0 (2.1)
1.3–14.1 (2.6)
105
117
104
71.0
71.8
70.2
59.0–84.5 (2.9)
59.0–81.0 (4.1)
59.2–84.5 (4.8)
13
13
15
19.3
18.4
20.2
10.6–36.00 (2.9)
12.0–36.00 (4.6)
10.6–31.5 (4.0)
47
55
44
5.0
5.0
5.0
B
Bark side
Pith side
10.8
3.0
18.7
1.4–72.8 (6.9)
2.0–4.0 (0.5)
1.4–72.8 (13.6)
204
33
163
74.1
82.2
66.1
30.0–92.0 (5.9)
72.0–92.0 (3.9)
30.0–89.2 (10.3)
25
11
35
19.2
16.4
22.1
12.0–33.2 (2.0)
12.0–25.0 (2.3)
15.7–33.2 (3.1)
33
30
31
5.0
5.0
5.0
S
Bark side
Pith side
0.1
0
0.2
0–0.5 (0.1)
0–0.4 (0.1)
0–0.5 (0.1)
140
143
141
16.1
17.2
15.0
0–45.0 (4.9)
5.0–33.0 (6.3)
0–45.0 (8.3)
97
82
125
0.9
0.8
0.9
0–4.5 (0.5)
0–3.0 (0.6)
0–4.5 (3.1)
199
179
222
1.9
2.2
1.6
G
Bark side
Pith side
30.3
36.2
24.5
2.0–81.0 (7.7)
2.0–81.0 (14.9)
4.5–5.3 (5.3)
80
92
48
19.8
20.0
19.5
0–50.2 (5.5)
0–48.0 (8.4)
5.4–50.2 (8.1)
88
95
93
16.1
22.6
9.7
1.0–81.0 (7.4)
1.0–81.0 (14.8)
4.5–19.9 (2.8)
144
144
65
4.1
4.4
3.8
Average permethod11.545.213.94.0
* SE standard error.
Table 6. The fungal area and mould grade on different GRAS treated surfaces, %.
GRAS
Treatment
Aspergillus nigerPenicillium communePaecylomyces variottiMould Grade
MeanRange (SE)CV, %MeanRange (SE)CV, %MeanRange (SE)CV, %
Direct Fungal Inoculation
R
Bark side
Pith side
48.74
66.20
31.28
11.0–87.0 (9.7)
11.0–87.0 (14.1)
11.9–56.3 (8.7)
63
48
62
30.3
22.0
38.7
0–68.0 (8.5)
0–68.0 (12.5)
6.9–66.7 (11.6)
89
128
67
12.0
4.2
19.9
0–29.7 (3.5)
0–15.0 (2.9)
10.5–29.7 (3.8)
90
154
43
4.9
5.0
4.8
B
Bark side
Pith side
51.9
62.6
41.3
10.7–77.0 (8.1)
27.0–77.0 (9.2)
10.7–66.7 (12.4)
49
33
67
27.3
19.4
35.2
0–60.0 (6.6)
0–43.0 (7.2)
6.5–60.0 (10.6)
76
83
67
6.9
3.6
10.2
0–18.3 (2.3)
0–10.0 (2.3)
0–18.3 (3.7)
106
139
80
5.0
5.0
5.0
S
Bark side
Pith side
3.0
4.4
1.5
0–18.0 (1.8)
0–18.0 (3.4)
0–7.4 (1.5)
195
176
216
11.4
15.0
7.9
0–53.0 (5.0)
0–53.0 (9.9)
3.5–20.5 (3.2)
139
147
90
0.2
0.4
0
0–2.0 (0.2)
0–2.0 (0.4)
0
306
223
0
1.8
2.0
1.6
G
Bark side
Pith side
61.3
69.2
53.3
35.0–81.0 (5.1)
54.0–81.0 (5.1)
35.0–76.4 (7.6)
26
17
32
4.3
0
8.6
0–42.9 (4.3)
0
0–42.9 (8.6)
316
0
224
2.3
0
4.6
0–22.8 (2.3)
0
0–22.8 (4.6)
316
0
224
4.3
4.6
4.00
Average per method41.218.35.44.0
Table 7. Summary of multivariate analysis (MVA).
ModelPCObs.R2XR2YQ2 (cum)
1PCA2800.448−0.0139
2PLS-DA2800.4040.360.319Treatment class
3OPLS-DA2 + 1 + 0800.5340.3940.336Treatment class
4PLS3800.490.8430.75Y mould grade
5PLS3790.5190.8470.766Y mould grade