Article

Patterns of Biomass, Carbon, and Soil Properties in Masson pine (Pinus massoniana Lamb) Plantations with Different Stand Ages and Management Practices

1
College of Horticulture and Forestry Sciences/Hubei Engineering Technology Research Center for Forestry Information, Huazhong Agricultural University, Wuhan 430070, China
2
Laboratory of Integrated Forest Management, School of Forestry, Beijing Forestry University, Beijing 100083, China
3
Department of Forestry, Shaheed Benazir Bhutto University, Dir 18000, Pakistan
4
Institute of Nuclear Agricultural Sciences, College of Agriculture and Biotechnology, Zhejiang University, Hangzhou 310058, China
5
Academy of Forest Inventory and Planning, National Forestry and Grassland Administration, Beijing 100714, China
*
Author to whom correspondence should be addressed.
Forests 2019, 10(8), 645; https://doi.org/10.3390/f10080645
Submission received: 30 June 2019 / Revised: 24 July 2019 / Accepted: 25 July 2019 / Published: 30 July 2019
(This article belongs to the Special Issue Moisture Dynamics and Carbon Sequestration in Boreal Forest Soils)

Abstract

:
Masson pine (Pinus massoniana Lamb) has been planted extensively in different parts of China for timber production and habitat restoration. The effects of stand age and management of these plantations on biomass, carbon storage, and soil physicochemical properties are poorly understood. In this study, we investigated biomass, carbon storage, and soil physicochemical properties of Masson pine plantations. The plantations were divided into four age groups (9, 18, 28, and 48 years), and into managed (MS) and unmanaged stands (UMS) in Hubei province, Central China. Tree biomass increased with stand age. A growth model indicated that maximum tree growth occurred when the plantations were 17 years old, and the average growth rate occurred when plantations were 23 years old. Tree biomass in managed stands was 9.75% greater than that in unmanaged ones. Total biomass carbon was estimated at 27.4, 86.0, 112.7, and 142.2 Mg ha−1, whereas soil organic carbon was 116.4, 135.0, 147.4, and 138.1 Mg ha−1 in 9-, 18-, 28-, and 48-year-old plantations, respectively. Total carbon content was 122.6 and 106.5 Mg ha−1, whereas soil organic carbon content was 104.9 and 115.4 Mg ha−1 in MS and UMS, respectively. Total carbon storage in the plantations studied averaged 143.7, 220.4, 260.1, and 280.3 Mg ha−1 in 9-,18-, 28-, and 48-year-old stands, and 227.3 and 222.4 Mg ha−1 in MS and UMS, respectively. The results of our study provide a sound basis for estimating ecosystem carbon as it relates to forest management activity and stand age.

1. Introduction

Increasing carbon dioxide (CO2), methane (CH4), and nitrous oxide (N2O) are becoming a major global threat [1]. During photosynthesis trees sequester atmospheric carbon by turning it into biomass with a turnover of several decades [2,3,4]. Thus, forests play a critical role in the global carbon cycle, storing almost 31% of global atmospheric CO2 as tree biomass, and 81% in the soil. Carbon stored as biomass is critical for sustainable forest ecosystems, and has strong links to the global carbon cycle [5,6,7]. In the past few decades, forest biomass quantification has received much attention [8,9] because forests sequester 44% of global carbon emissions [10]; thus, their significance in countering climate change cannot be overestimated [11]. Other factors such as dominant tree species and forest stand age determine the capacity of a forest to sequester atmospheric CO2 [12]. This further highlights the importance of the accurate determination of carbon storage and CO2 sequestration by each specific forest ecosystem.
Forest structure is greatly affected by vegetation characteristics, such as aboveground biomass (AGB), belowground biomass (BGB), and soil properties [8,9]. For this reason, inventory-based approaches are widely used worldwide to estimate carbon storage [3,6]. The important variables required for a traditional forest inventory are tree diameter at breast height (DBH) and tree height (H), which can be converted to volume, biomass, and ultimately, carbon stocks [6,13]. Total stand biomass is the sum of the biomass of all single trees in a forest stand. The relative proportion of biomass components fluctuates with canopy closure, which is a time point based variable, because the amount of light varies during the development of forest ecosystems [14,15]. For example, a gradual decline in the relative amount of foliage biomass could be expected, while simultaneously, a continued increase in stem biomass is normally observed with tree development [16].
Direct measurement of total stand biomass cannot be achieved accurately. Therefore, single-tree biomass is estimated, and then the estimates for all trees in the stand are added together to estimate the stand total biomass [17]. Destructive harvesting methods can directly measure tree biomass; however, these are often avoided due to the damage caused by harvesting a large amount of trees [18]. Therefore, allometric equations are often recommended and used for tree biomass estimation. These may be species specific, such as those described by Wang [19], or general volume equations, such as those described by Ahmad et al. [4] and Saeed et al. [10]. A biomass conversion factor (0.5) is often used to convert biomass into carbon stock, assuming that 50% of the biomass of trees consists of elemental carbon [6,12,20].
According to Payn et al. [21], planted forests cover an area of approximately 290 million hectares, and approximately 7% of the global forest area. Planted forests are considered effective tools for countering climate change due to their ability to absorb carbon, and they play an important role in mitigating climate change effects [21]. Indeed, plantations globally absorb about 0.178 Pg C per year, and statistics show that plantations in China stored up to 0.77 Pg C from 1999 to 2003 [22]. Therefore, scientists believe that forest plantations are the fastest and most cost-effective method for reducing atmospheric CO2 concentration by actively and continuously absorbing CO2 and, subsequently, by storing carbon as biomass in growing trees [2,23]. Consequently, establishing new plantations under scientific management should effectively assist in reducing atmospheric CO2 levels and increasing carbon sequestration by forest ecosystems [4,16,23].
Terrestrial vegetation and soils are two important sources and sinks of atmospheric carbon [24], with land-use change accounting for 24% of net annual anthropogenic emission of greenhouse gases to the atmosphere [25]. Information on carbon budgets at national and global scales is, therefore, required for managing future climate change mitigation strategies [26]. Different studies have considered different forest management schemes to determine their effects. Thus, for example, the effects of thinning on the understory species communities have been studied, and it is of interest because it improves light availability for understory species [27]. However, management of public lands represents a policy challenge because there are certain alternative uses (such as carbon storage) that must also be considered [28]. Therefore, the potential values of carbon present in these lands and the impacts of management on carbon storage may become crucial in the management of these public lands [29]. Although a substantial amount of research has focused on the impact of different management strategies on forest biomass, carbon, and soil properties, the impact of practices such as weeding and cleaning remains unknown, although they have been extensively applied in different forest management scenarios. Such management practices may also substantially affect biomass and carbon storage in the soil; however, the magnitude of these effects is largely unknown.
There are many large forest plantations in China, most of which consist of native tree species, and new massive plantations are in progress under different programs at the national level. The primary goal of such planting projects is to mitigate environmental problems caused by the substantial loss of forests and the degradation of landscapes; however, additional goals include forest conservation and restoration of degraded soils [30]. A growing population results in an increasing demand for timber and fuelwood, ultimately causing overexploitation of natural forests and loss of biodiversity [31,32]. China has a rich biota, including 27,000 species of higher plants, among which 7000 are woody species [30]. Although much research has been conducted in Masson pine Masson pine (Pinus massoniana Lamb) plantations, the manner in which biomass, carbon storage, and soil physicochemical properties respond to stand age and management in central China, remains largely unknown.
Generally, it is believed that plant biomass will gradually increase with stand age, whereas soil carbon may exhibit a different pattern [33]. We hypothesized that biomass and carbon in P. massoniana plantations in central China are age- and management-dependent, whereas soil carbon storage may follow a different pattern in response to stand age and management. To test this hypothesis, biomass and carbon storage of various ecosystem components were investigated in the Taizishan Forestry Administration Bureau, Hubei Province, in central China. In the present study, the biomass, carbon storage, and soil organic carbon (SOC) of the major ecosystem components of a P. massoniana plantation were evaluated to model tree biomass growth and to determine the changes in size and contribution of the carbon stock to total ecosystem carbon storage with stand age and management.

2. Materials and Methods
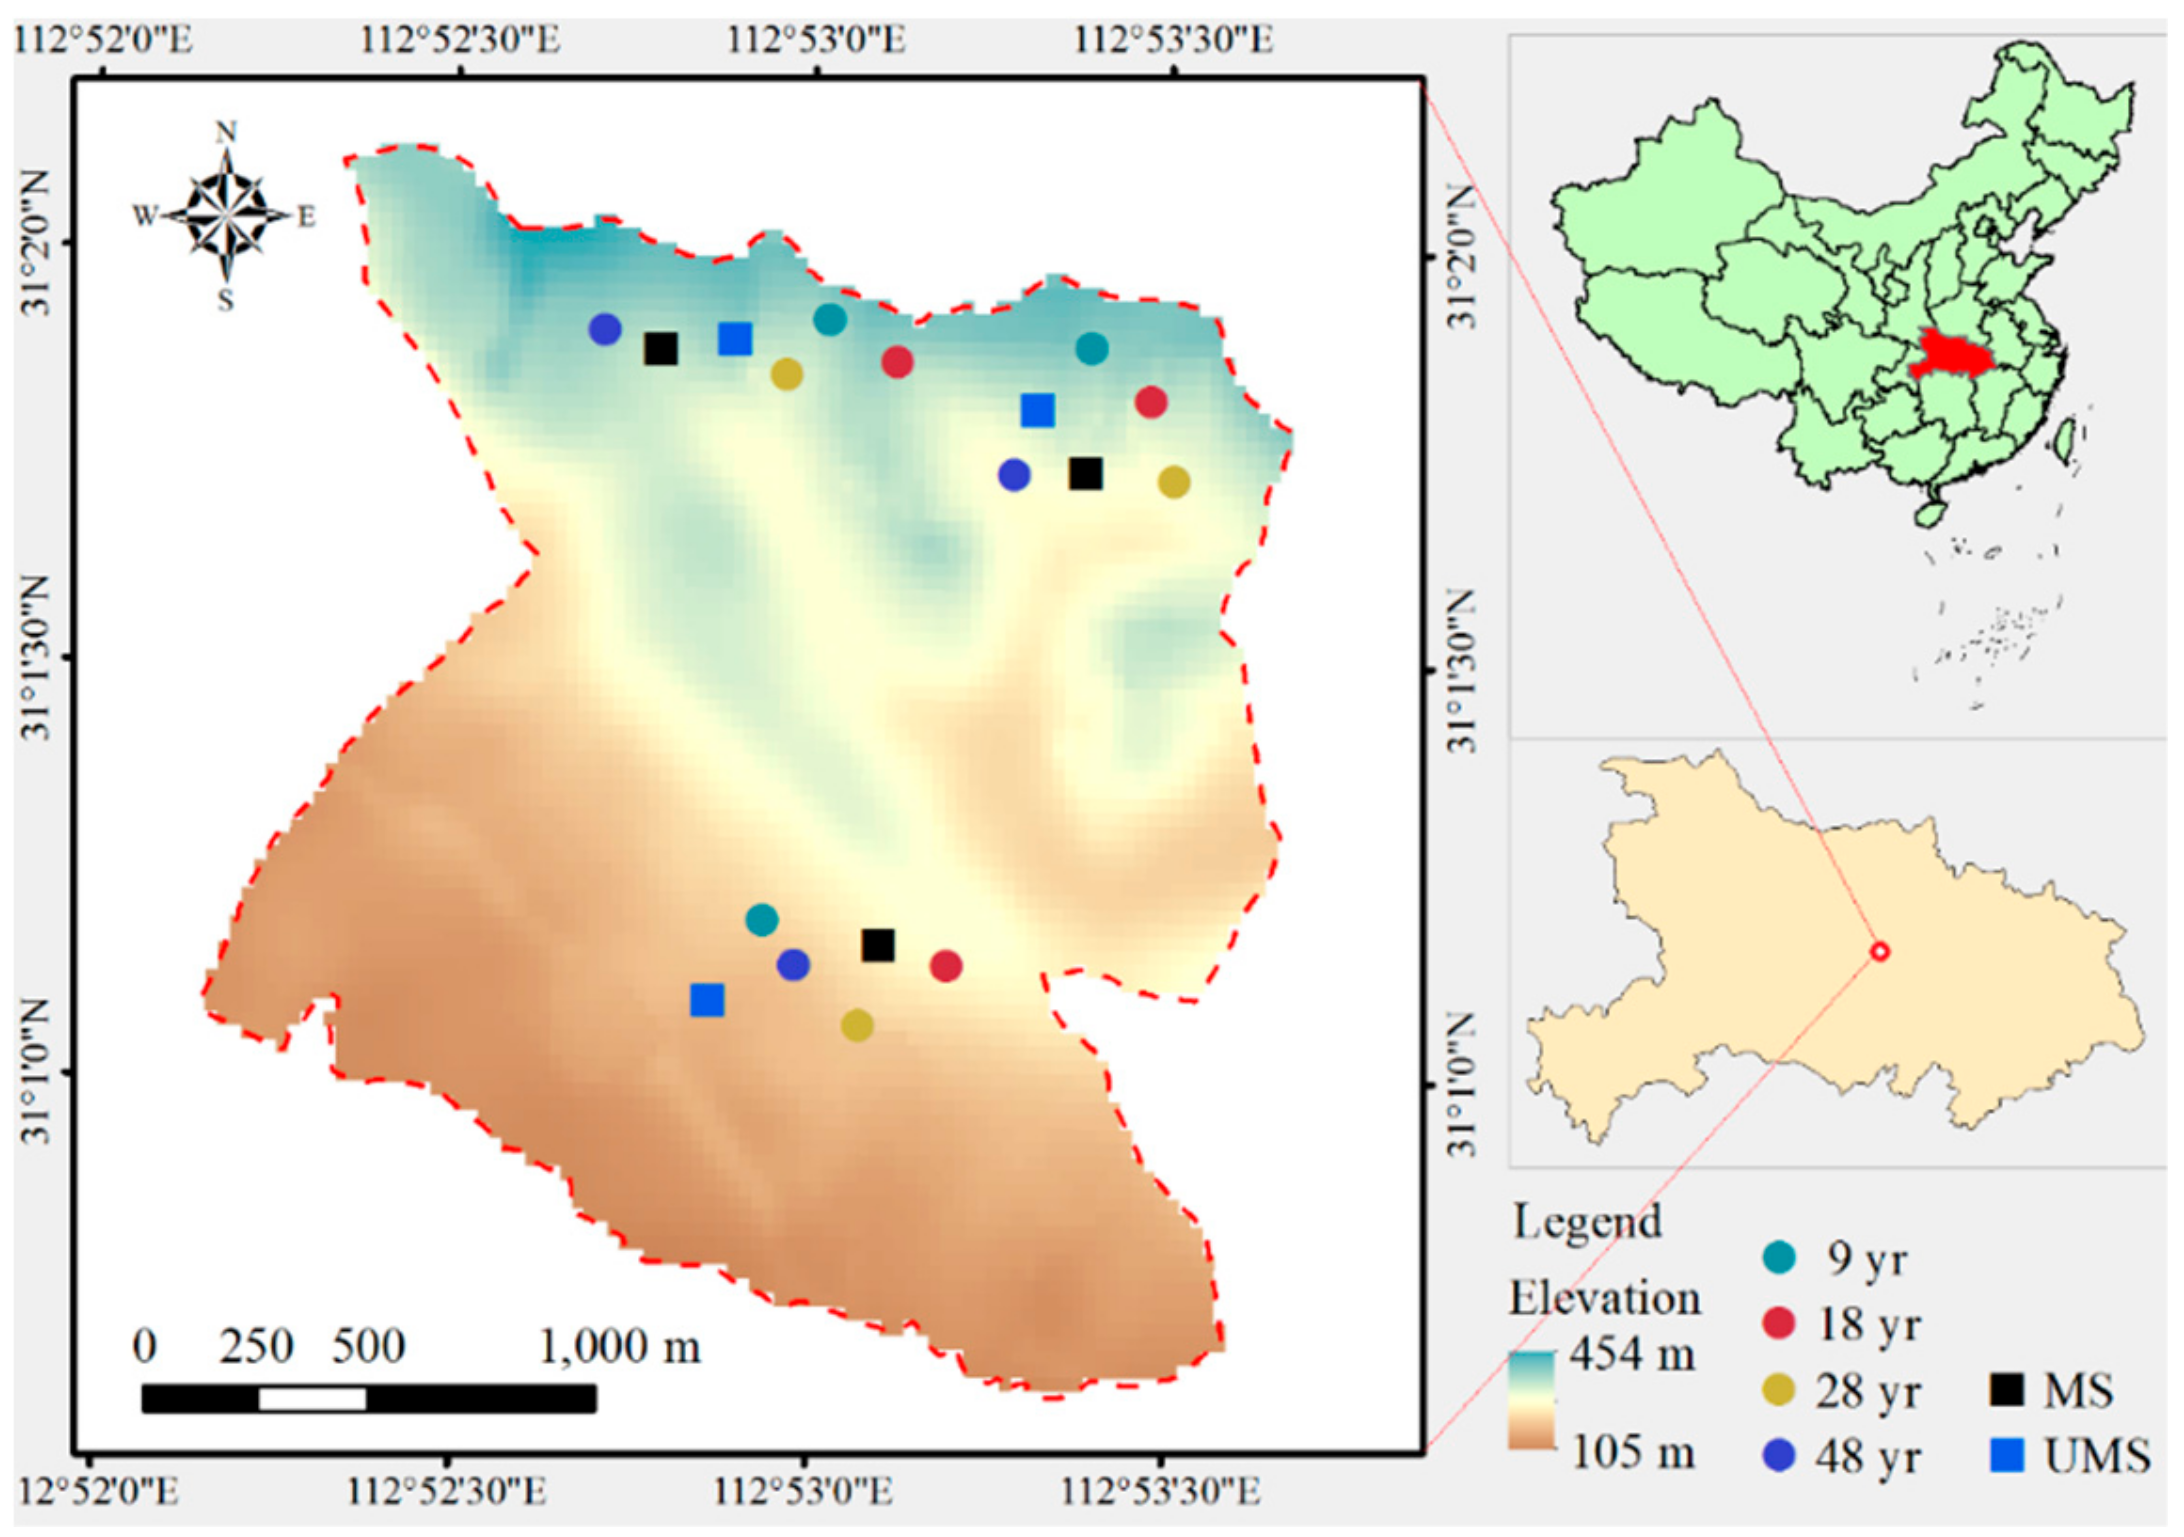
2.1. Study Site

This study was conducted at the Taizishan Forestry Administration Bureau (TFAB; 30°48′–31°02′ N, 112°48′–113°03′ E, 454 m a.s.l), located in Hubei province, Central China (Figure 1). It is located in a typical subtropical humid monsoon climate zone with cold winters and hot and rainy summers. The annual mean temperature is 16.4 °C, with an average annual rainfall of 1090 mm; the highest rainfall is recorded from July to September. The forests of the area comprise evergreen coniferous, mixed broad-leaved and coniferous, and broad-leaved forests. Mean soil bulk density is 2.3 g cm−3, and the surface soil layer density is lower than average. The major soil types in the study site are yellow–brown soils, mountain yellow–brown soils, and yellow–cinnamon soils. P. massoniana is an endemic pine species in China, and an extended plantation of the species was established over the entire study area in 1957 [34,35]. The initial planting density in the area was recorded as 2 m × 2.5 m, and thinning operations were conducted after six years in some parts of the area. The major understory herbaceous species include Carex stenophylloides V.Krecz. and Artemisia sacrorum Ledeb., and the shrub layer includes Lonicera japonica Thunb., Rosa xanthine Lindl., and Lonicera microphylla Willd. ex Schult. [36,37].

2.2. Field Sampling and Data Collection

According to the records at TFAB, P. massoniana plantation management includes some silvicultural practices such as cleaning and thinning. During the cleaning process, all understory shrubs and tree species are physically removed. In contrast, thinning targeted individual P. massoniana trees. In the TFAB, different age stands (9-, 18-, 28-, and 48-year-old) were selected to assess the effect of stand age on the biomass, carbon, and soil properties of P. massoniana plantations. We divided the stands in two management treatments: Managed stands (MS) and unmanaged stands (UMS). The MS were cleaned 2–5 years after planting and then consistently on a yearly basis, whereas some were thinned. On the other hand, UMS were left untouched, and none of the silvicultural practices have ever been conducted; the understories were allowed to undergo natural regrowth, whereas the large trees were selected for natural thinning [38]. The average tree density of MS was around 1244 tree ha−1, average DBH was 12 cm, and average height was 13 m. Similarly, the average tree density of UMS was 1453 tree ha−1, DBH was around 12.4 cm, and average height was 11.5 m.
Replicated 30 m × 30 m plots were established in stands of the four age groups, and in MS and UMS forests in March–November 2017 (three replicate plots per stand age group and management treatment for a total of 18 plots and 12 plots for MS). Specifically developed models for P. massoniana for Hubei Province, China, were used for biomass estimation [4,39]. The formulas are as follows:
AGB   =   M A   =     0.092349 D 2.02817   H 0.49763   ( D     5   cm M A   =   0.18166 D 1.60778   H 0.049763 D     5   cm ,
and:
M 1 = 1 1 + g 1 + g 2   + g 3   × M A M 2 =   g 1 1 + g 1 + g 2 + g 3   × M A M 3 = g 2 1 + g 1 + g 2 + g 3   × M A M 4 = g 3 1 + g 1 + g 2 + g 3   × M A     ,
where: MA is the aboveground biomass (AGB); M1, M2, M3, and M4 are stem, bark, branch, and leaf biomass, respectively; and g1, g2, g3, and g4 are the proportion functions of stem, bark, branch, and leaf biomass, respectively.
Similarly, for belowground biomass (BGB) the following equation was used:
BGB   =   M B   =     0.012238 D 2.67327   H 0.080255   ( D     5   cm M B   =     0.0667657 D 1.60778   H 0.080255   ( D     5   cm ,
where MB is the belowground biomass.
Density, DBH, and height (H) of individual trees were measured. The biomass of stem, bark, leaves, branches, and belowground components (roots) were estimated in each plot for all age groups and in both MS and UMS. Fifteen subplots of 5 m × 5 m for shrubs, and 45 subplots of 1 m × 1 m for herbs were set to evaluate the undergrowth vegetation (shrubs and herbs) biomass in each treatment. Herbs and shrubs were harvested from each subplot and the fresh weight was measured in the field. A 1 kg sample of evenly mixed subsamples was brought to the laboratory for oven drying at 72 °C for 48 h to determine the biomass and component carbon content of shrub and herb layers. Oven-dry to wet mass ratio was used to estimate the biomass [12,13,40].

2.3. Soil Properties

Soil samples were collected using a soil corer to a depth of 40 cm (0–10 cm, 10–20 cm, 20–40 cm), within the 1 m × 1 m subplots at nine sites from each stand age, and MS and UMS within the large plots. Soil samples of 500 g were also withdrawn at the center of each subplot and taken to the laboratory for analysis. Soil pH, total nitrogen (TN), alkaline nitrogen solution (AN), organic matter (OM), total phosphorus (TP), and available phosphorus (AP) were determined. A cytometer was used to measure soil pH, the Walkley–Black K2Cr2O7–H2SO4 wet oxidation method was used to measure soil OM [41], the Kjeldahl method was used to measure TN content, the HClO4–H2SO4 colorimetric method was used to measure TP, and acid solution-molybdenum antimony resistance was used to measure TP; the diffusion method was used to measure hydrolyzed nitrogen [42]. To investigate soil physical properties, intact soil cores were collected at three sites in each subplot from each soil layer using a 100 cm3 steel cylinder. Soil physical variables such as water holding capacity (WHC) (%), maximum water holding capacity (MXWHC-g kg−1), capillary water-holding capacity (CWHC-g kg−1), minimum water-holding capacity (MNWHC-g kg−1), soil density (SD) (g cm−3), noncapillary porosity (NCP) (%), capillary porosity (CP) (%), and total porosity (TPo) (%) were investigated [43,44]. Samples were air-dried to calculate SOC, whereas soil bulk density (g cm−3) was used to determine carbon values per hectare (Mg ha−1) following the methods described by Lu [45]. Soil bulk density was calculated using the following equation:
BD = Soil Sample (g)/Core Volume (cm3),
To estimate oxidizable soil carbon we used the method developed by Walkley and Black [46]. The following equation was used for calculating soil carbon:
Soil carbon (Mg ha−1) = BD (g cm−3) × SOC (%) × Soil thickness (cm) × 100,
Total ecosystem carbon was determined by summing up all the carbon stored in different carbon pools (tree, herbs, shrubs, and soil).

2.4. Data Analysis

Linear mixed models and ANOVA were used to determine the effect of stand age and management treatments on tree biomass, soil carbon, and understory vegetation. In addition to the relationship between the four age groups and two management treatments, the soil chemical and physical properties within three layers of soil were analyzed. A logistic function was used to develop the growth process of tree biomass in the four age groups and two management treatments, and the age groups achieving maximum annual biomass and average biomass were determined. Principal component analysis (PCA) was used to evaluate the overall differences in stand age at 0–40 cm soil depth, and both PCA and redundancy analysis (RDA) using Monte Carlo permutation (999 repetitions) were used to test the relationships among soil physical and chemical properties and carbon concentration in the plant biomass of different tree components. SPSS (version 20, IBM Corp., Armonk, NY, USA) was used to statistically analyze the data and Canoco 5 (Microcomputer Power, Ithaca, NY, USA) was used to conduct RDA and PCA of the data. The significance level was set to p < 0.05.

3. Results

3.1. Biomass of P. massoniana Stands of Different Age and under Management

The biomass of the tree layer components was ranked in the following naturally decreasing order: Stem > branches > roots > leaves > bark (Table 1). Stems showed the highest contribution to tree biomass among the different stand ages both in MS and UMS. The mean total tree biomass was 46.1, 158.0, 208.8, and 266.0 Mg ha−1 in 9-, 18-, 28-, and 48-year-old stands, respectively. On the other hand, total tree biomass averaged 218.4 and 195.4 Mg ha−1 in MS and UMS, respectively. Stems accounted for more than 60.5% of the total tree biomass, whereas bark contributed only 4.9% of biomass, thus representing the lowest contribution to total stand biomass.
Based on the data from 12 sample plots of different ages, the following logistic growth model was developed for total tree biomass:
TB = 259.85/(1 + 15.509 × exp(−0.16368 × A)) (R2 = 0.9687),
where TB is the total tree biomass (Mg ha−1) and A is the age of the stand (years). As shown by the growth model, a P. massoniana stand will achieve its maximum, annual growth rate and maximum average growth rate at approximately 17 and 23 years of age.
Based on the data of six sampled plots under the two management schemes, the biomass growth model with a dummy variable x (0 for UMS, 1 for MS) was as follows:
TB = (233.49 + 22.77 × x)/(1 + 10.589 × exp(−0.14899 × A)) (R2 = 0.9828),
The model shows that total tree biomass in MS was about 9.75% more than that in UMS (Figure 2).
Shrub biomass varied between 6.1 and 10.7 Mg ha−1 among stand age groups and was 8.3 and 10.4 Mg ha−1 in MS and UMS, respectively. Similarly, herbaceous biomass ranged from 2.7 to 7.7 Mg ha−1 for all age groups and averaged 5.7 and 7.1 Mg ha−1 in MS and UMS, respectively. Total vegetation biomass was 54.8, 172.1, 225.4, and 284.4 Mg ha−1 in 9-, 18-, 28-, and 48-year-old stands, respectively, while the values for MS and UMS were 245.4 and 212.9 Mg ha−1, respectively. Tree biomass comprised the largest proportion (75%) of the ecosystem biomass.
Stand biomass did not vary significantly between the two management schemes studied. Stem biomass consistently contributed the highest proportion of total stand biomass regardless of management scheme (124.8 ± 15.3 and 112.9 ± 14.2 Mg ha−1, in MS and UMS, respectively), whereas the smallest proportion was contributed by the leaves (10.1 ± 25 and 10.2 ± 1.2 Mg ha−1 in MS and UMS, respectively). Management had no significant effect on stem biomass but did affect bark biomass. Understory vegetation biomass changed significantly in response to management treatment (Table 1).

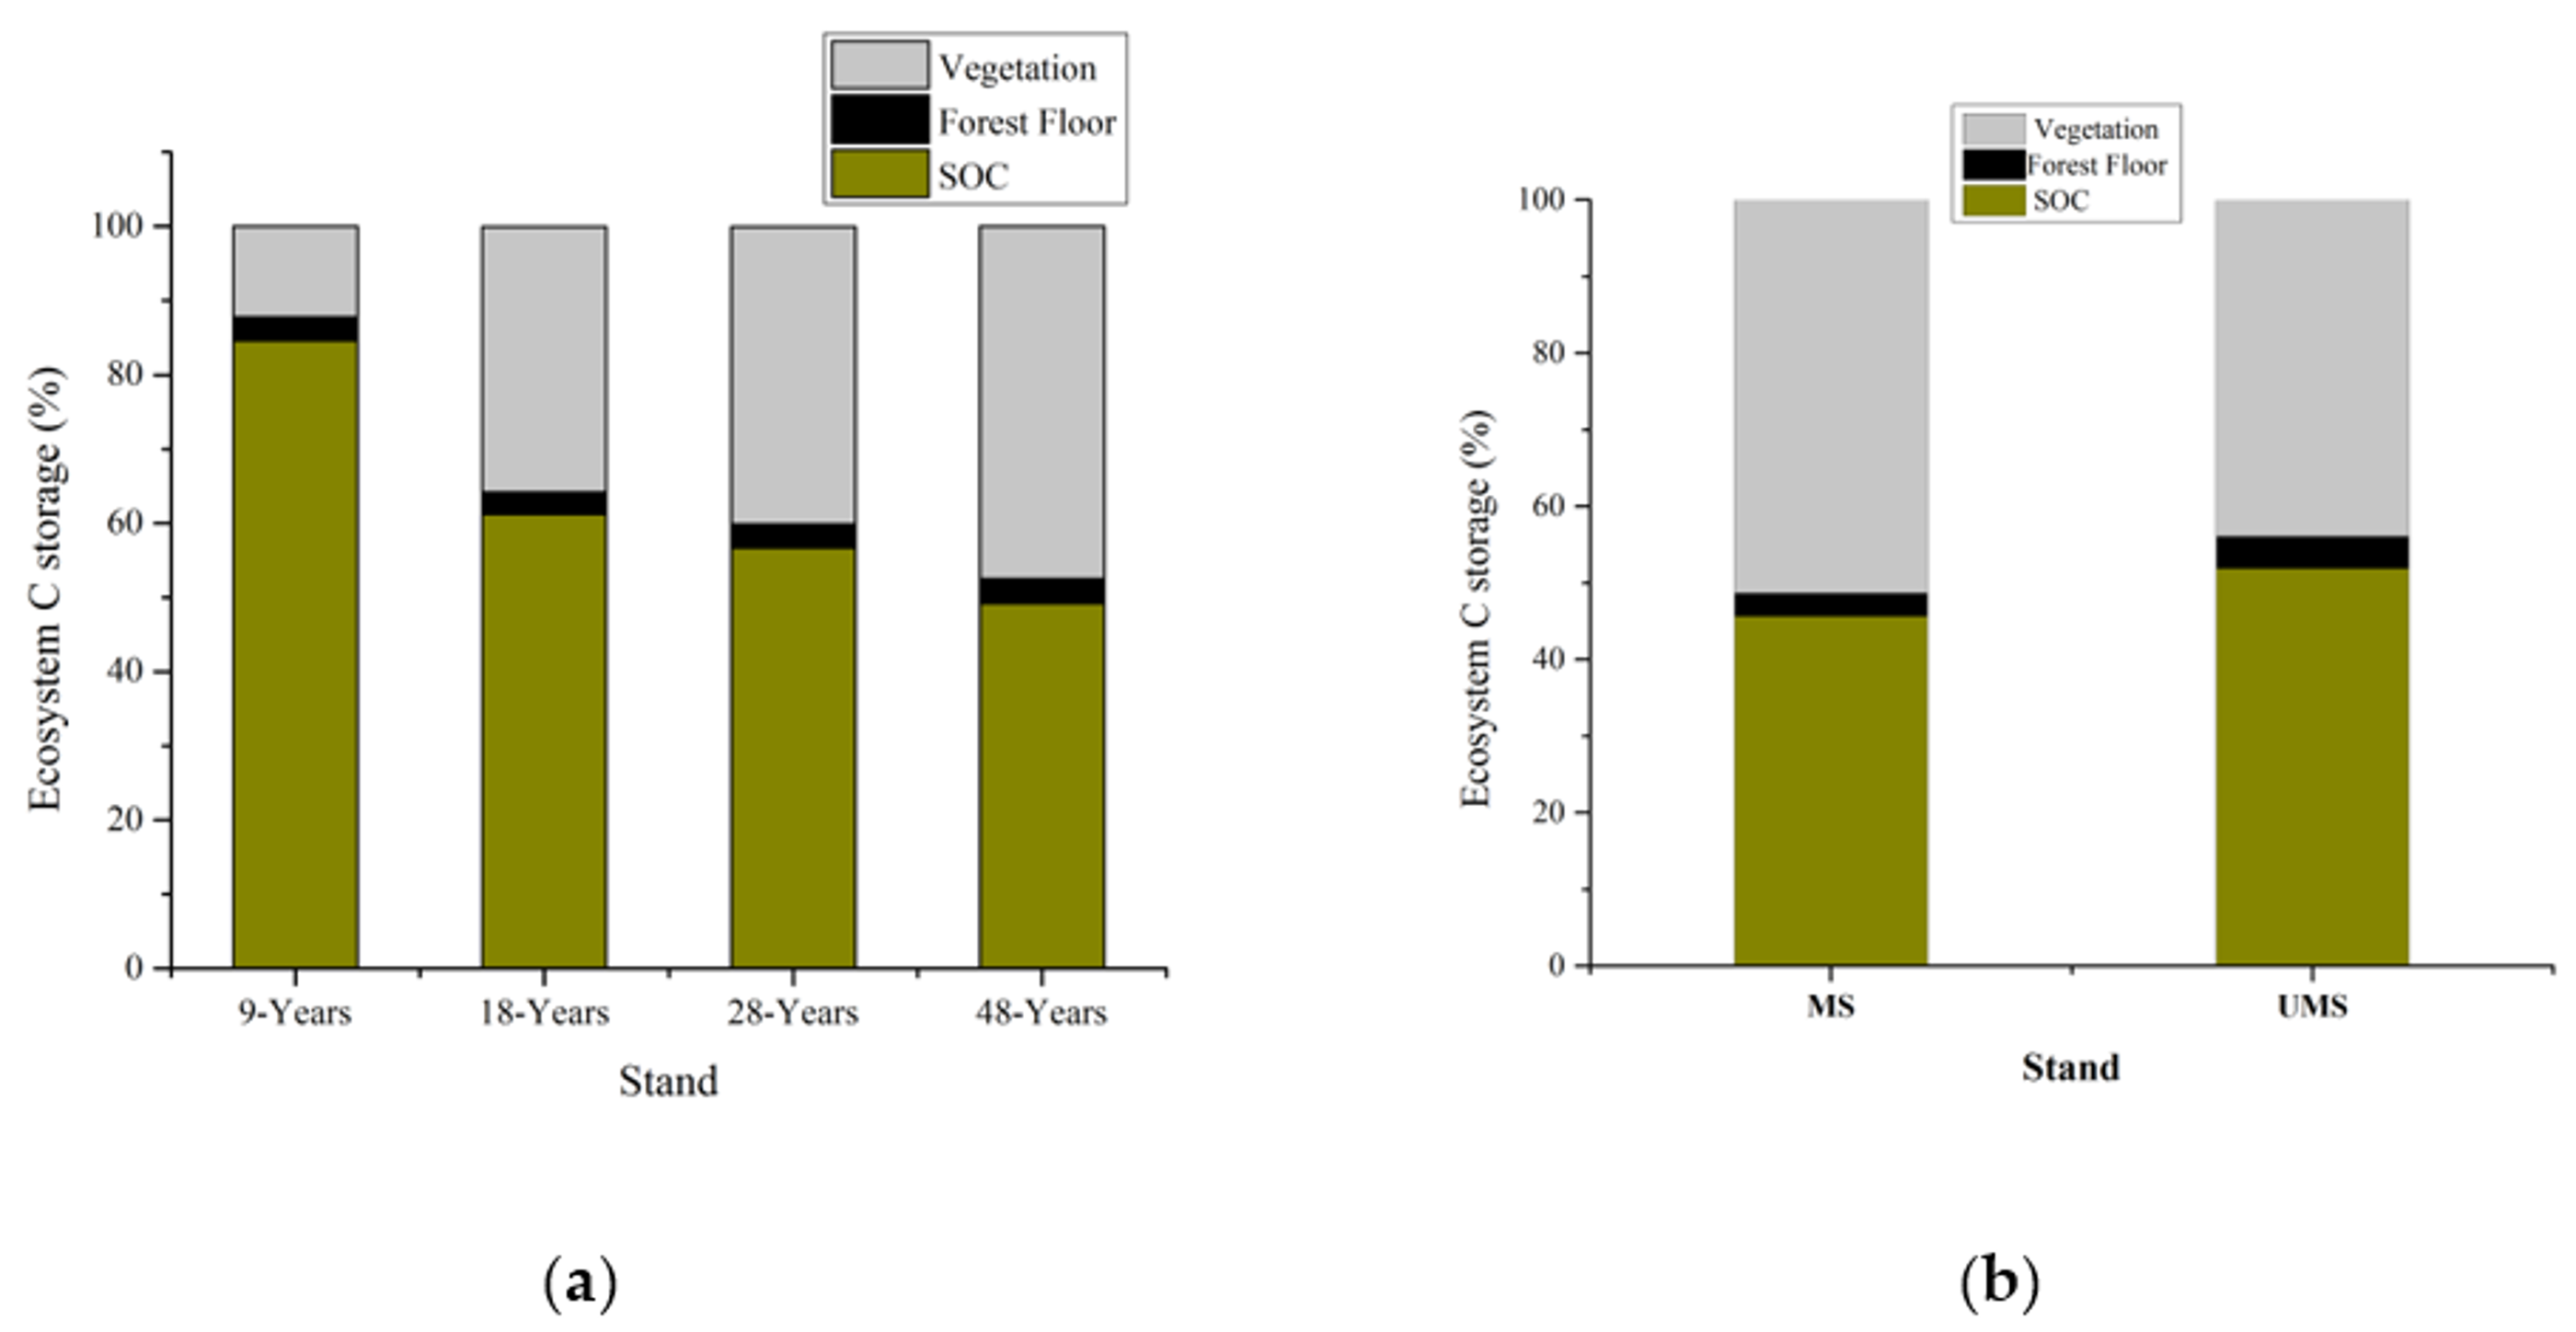
3.2. Vegetation Carbon and Soil Carbon

The mean total AGB carbon reached 18.6, 68.1, 88.7, and 106.4 Mg ha−1, and mean TBC reached 27.4, 86.0, 112.7, and 142.2 Mg ha−1 in the 9-, 18-, 28-, and 48-year-old stands, respectively. TBC in MS and UMS plots was 122.3 and 106.5 Mg ha−1, respectively (Table 2). Biomass carbon of all tree components increased steadily with increasing stand age. We consistently recorded that stems contributed the highest proportion to total TBC, whereas leaves contributed the least. The forest floor vegetation contributed on average 3.0, 4.3, 5.2, and 5.4 Mg ha−1 from shrubs, whereas herbaceous plants contributed 1.4, 2.7, 3.2, and 3.9 Mg ha−1 in the 9-, 18-, 28-, and 48-year-old P. massoniana stands, respectively, thus adding to the total carbon storage of these stands (Table 2). The tree layer carbon stock significantly increased with stand maturity and significant differences were observed in the biomass carbon stock among the sampled stands (Table 2). However, no significant differences were found among the shrub or herbaceous layers and the age groups (p < 0.001) (Table 2).
Biomass carbon did not differ significantly between management treatments, except for bark, shrubs, and herbaceous plants. MS accumulated more biomass carbon than UMS, with stems being the highest contributor of biomass carbon. In forest floor vegetation, there was a significant difference in the biomass contribution, which averaged 4.2 and 5.2 Mg ha−1 from shrubs, and 2.7 and 3.6 Mg ha−1 from herbaceous plants, in MS and UMS, respectively (Table 2).
Carbon concentration in the mineral soil layer of the stand age groups decreased significantly with increasing soil depth. The highest carbon concentration was observed in the topsoil layer. The highest carbon concentration (50%) was recorded in the upper 0–20 cm soil layer. The mean carbon stored in the upper 0–20 cm soil layer was 116.4, 135.0, 147.4, and 138.1 Mg ha−1 in 9-, 18-, 28-, and 48-year-old stands, respectively, and 122.9 and 135.4 Mg ha−1 in MS and UMS, respectively. UMS showed higher stored soil carbon content than MS, whereas mature stands stored more carbon than the other age groups. Overall, the total ecosystem carbon stocks for 9-, 18-, 28-, and 48-year-old stands were 143.7, 220.4, 260.1, and 280.3 Mg ha−1, respectively, whereas the total ecosystem carbon was 228.1 and 222.0 Mg ha−1 for MS and UMS, respectively (Table 3).

3.3. Effect of Age and Management on Soil Physicochemical Properties

Soil physical properties were significantly affected by age, stand management treatment, and soil depth (Table 4). Significant responses were observed for capillary porosity, total water holding capacity, and noncapillary porosity. However, no significant differences due to management were noted in total porosity, minimum and maximum water holding capacity, or soil density. Higher capillary porosity (21.7%), and capillary water holding capacity (180.2 g kg−1) were recorded for MS than for UMS, whereas a higher noncapillary porosity (5.1%) was observed for UMS. Similarly, stand age significantly affected soil physical properties, except for total porosity. Porosity, maximum and minimum water holding capacity, noncapillary porosity, and soil density were documented for 18-year-old stands. Higher minimum (149.0 g kg−1) and maximum (234.0 g kg−1) water holding capacity, as well as a noncapillary porosity (5.65%), were reported from 18-year-old stands. However, a capillary porosity of 23.2% and a capillary water holding capacity of 183.4 g kg−1 were reported for 28-year-old stands. Soil physical properties showed significant differences at different soil depths, with the topsoil layer showing higher values for different soil physical properties. Similarly, the interaction effect between stand age and soil depth showed significantly different results for total porosity, capillary porosity, capillary water holding capacity, and maximum water holding capacity (Figure 3, Figure 4 and Figure 5). Similarly, triple interaction among management, age, and soil depth showed significant differences in total porosity (Table 4).
Stand management significantly affected TP and AP content, whereas the variability in other soil chemical properties was nonsignificant (Table 5). Higher TP (4.86%) was reported for MS than for UMS, whereas the opposite was recorded in UMS for AP (4.06%). Tree age significantly affected soil TP, alkaline N solutions, and pH, but no significant effects were observed for AP, OM, and TN. Higher TP content (5.46) and soil pH (5.64) were observed in the 28-year-old group, and higher alkaline N solutions (148.97 and 119.1) were observed in the 48- and 28-year-old groups, respectively. However, there was no significant difference between the 18- and 28-year-old groups for alkaline N solutions. Further, there was no significant difference among different age groups in the AP, OM, and TN. The age–management and age–soil depth interactions significantly affected the TP, AN, and pH (Table 5); OM and TN were significantly affected by the age–soil depth interaction (Figure 3, Figure 4 and Figure 5).

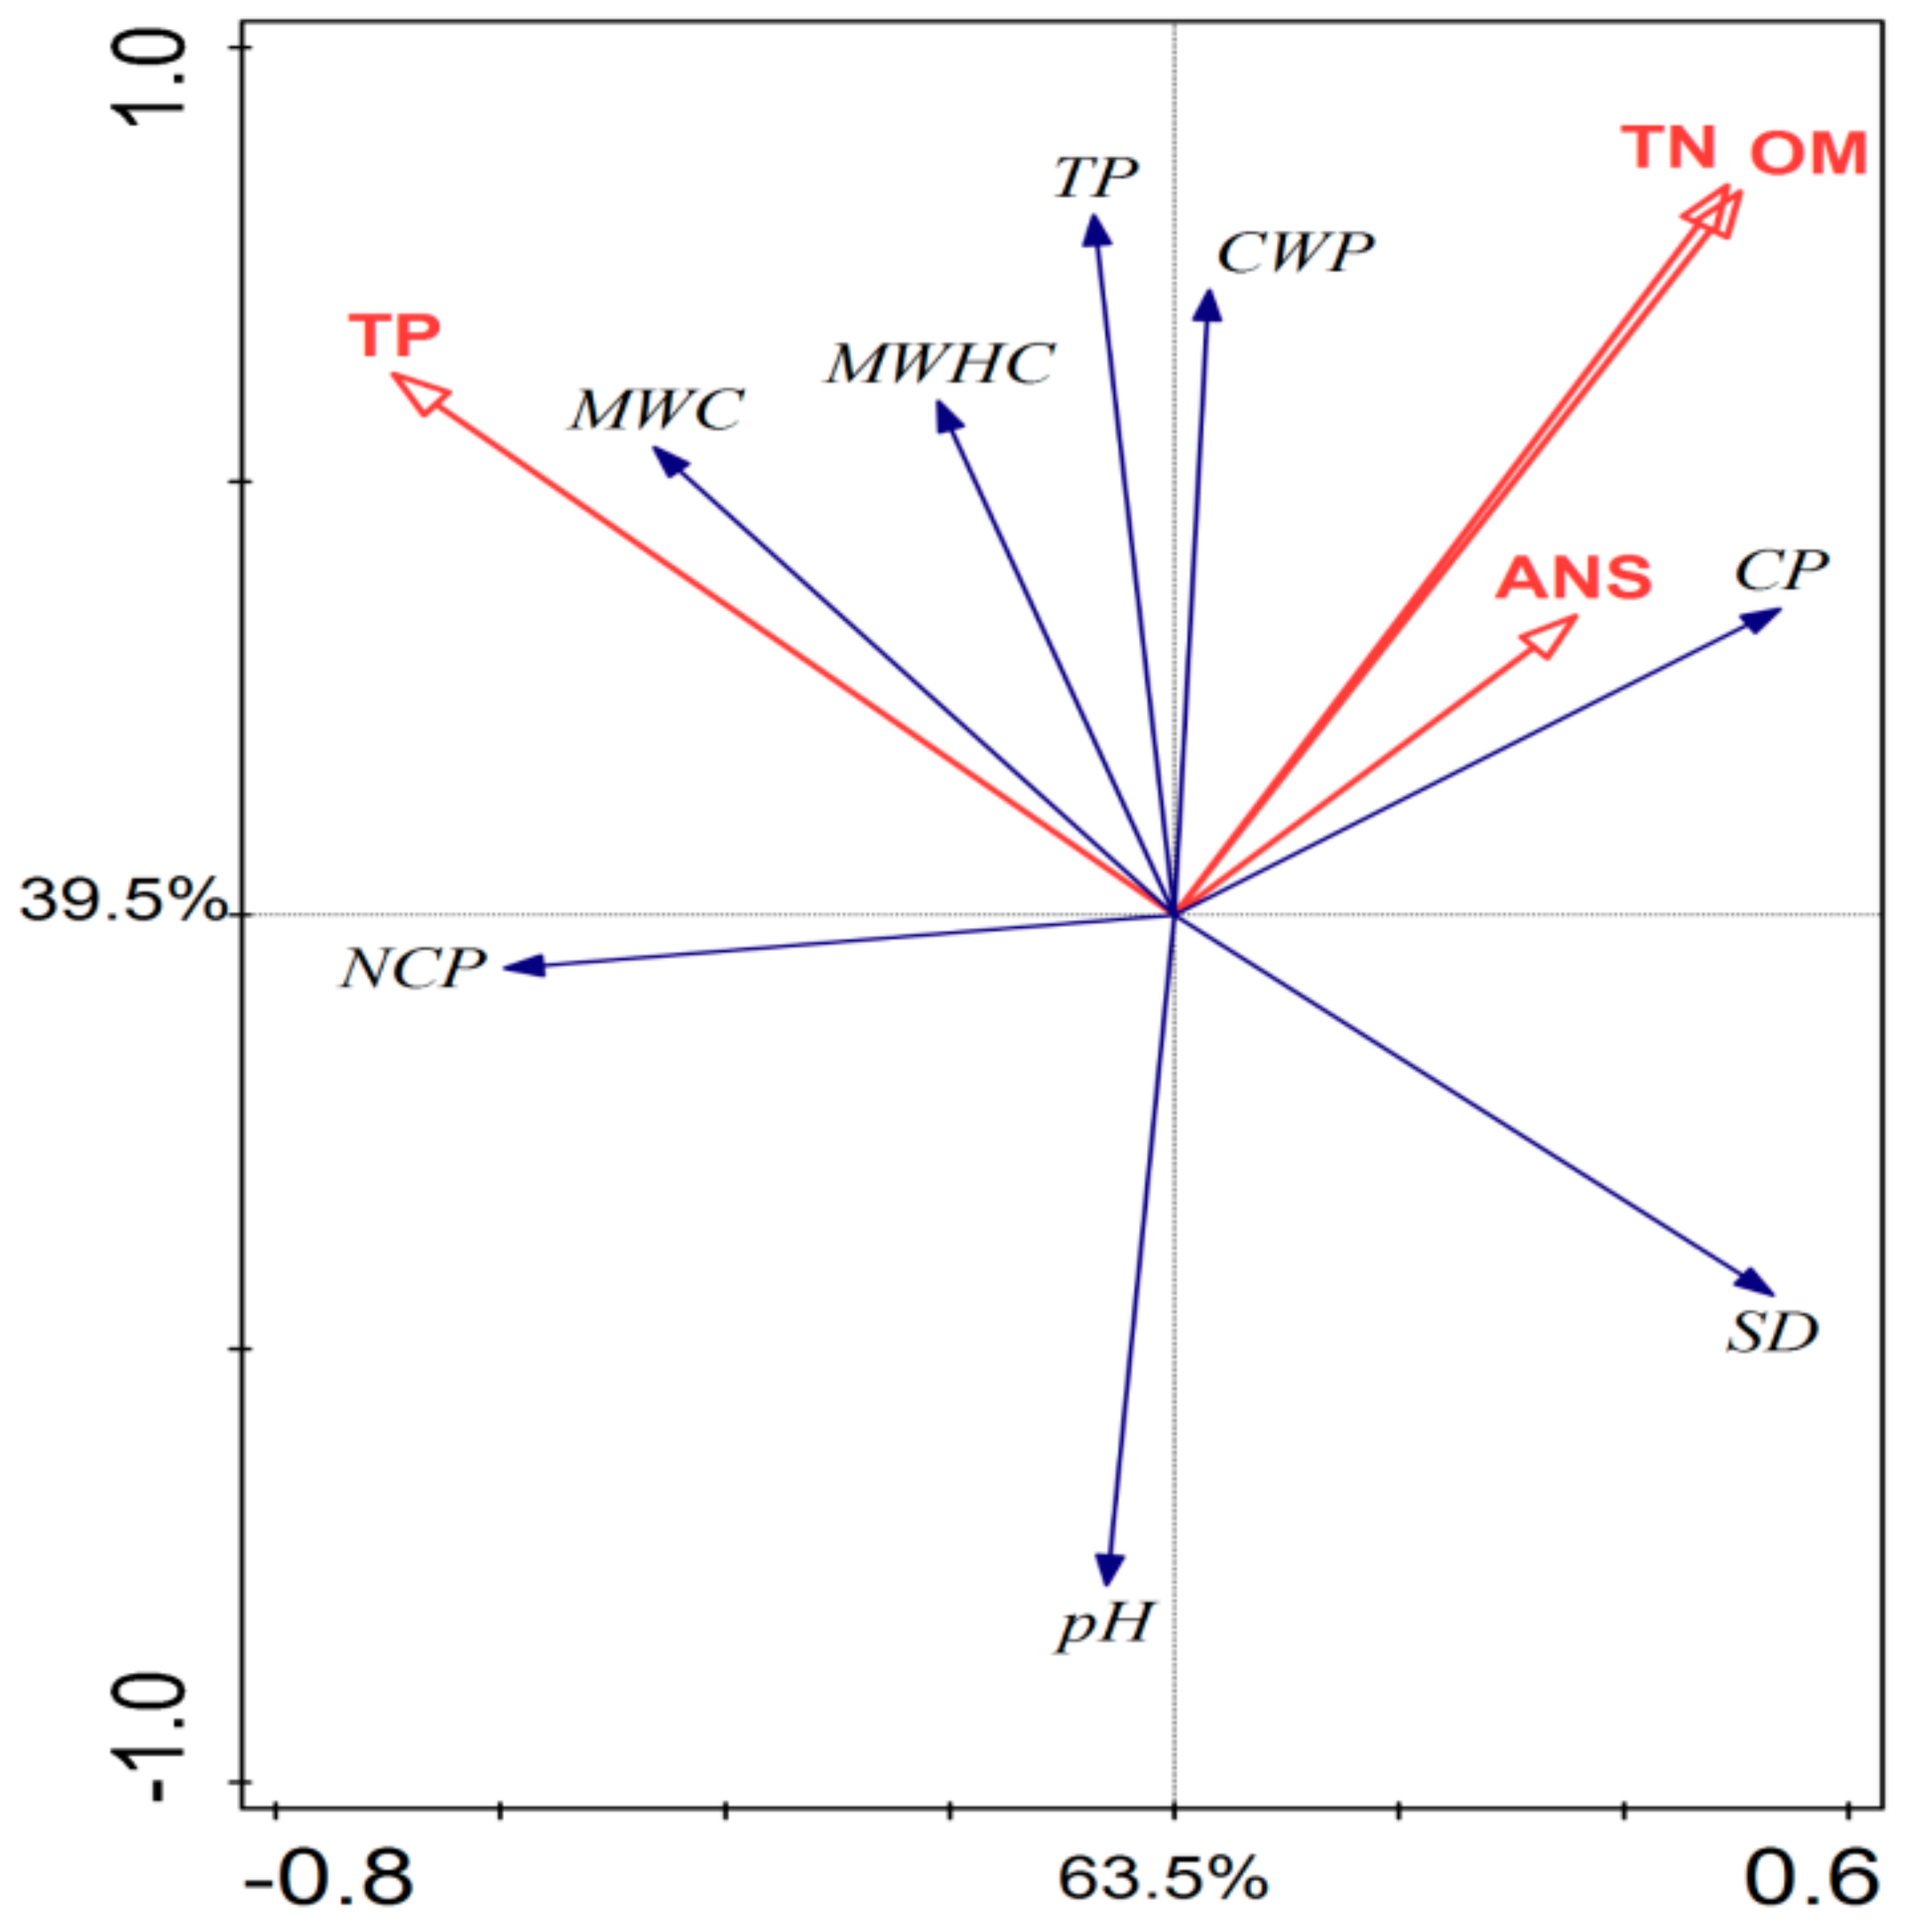
3.4. Relationship of Soil, Vegetation Carbon, and Soil Properties to Stand Age and Management

The relationship between soil physical and chemical properties is shown in Figure 3. The redundancy analysis showed that capillary porosity, capillary water capacity, and total porosity showed a closer relationship with TN, OM, and AN than any other soil variable. Figure 4 shows the relationship between soil carbon and tree component carbon content. Additionally, a strong correlation was observed between shrub foliage and litter carbon contents with respect to SOC. Further, the soil carbon stock exhibited a positive relationship with belowground, leaf, and branch carbon contents.
We found a positive correlation between stand age and soil carbon (R2 = 0.39). Further, stand age was highly and positively correlated with forest floor (R2 = 0.87), vegetation carbon (R2 = 0.86), and total ecosystem carbon contents (R2 = 0.78). (Table 6). Linear regression analysis of total tree biomass to SOC revealed a positive and significant correlation (R2 = 0.99) (Figure 5). A linear trend was clearly observed, with SOC increasing as the total tree biomass increased.

4. Discussion

4.1. Biomass and Carbon of P. massoniana Stands at Different Ages and under Management Schemes

In agreement with our hypothesis, the biomass and carbon of P. massoniana stands increased with stand age (in both the aboveground and belowground components). Similar results have been previously reported (e.g., [47]). Furthermore, biomass stock also increased with increasing stand age, which suggested that trees absorbed atmospheric carbon and stored it in plant tissues during different growth stages [48,49]. The biomass and carbon of the 18- and 28-year-old stands were elevated compared to those of the 48-year-old stands, which shows that they were still growing and absorbing CO2 from the atmosphere, as had been previously demonstrated by Justine et al. [46]. Younger stands were observed to accumulate more biomass and carbon at a faster rate than older stands, and the growth model (Figure 2) indicated that the maximum annual biomass growth rate was achieved at an age of 17 years, and the average biomass growth rate was achieved at an age of 23 years. Other researchers have concluded that the maximum annual growth in tree diameter and height of P. massoniana is achieved at 24 and 19 years of age [50]. The highest accumulation of belowground biomass and carbon was recorded in the 20–35-year age groups, which shows that P. massoniana may be able to increase root length during unfavorable conditions [40].
In this study, the biomass accumulated in the 18-year-old stands (172.1 Mg ha−1) was lower than that reported by other studies conducted in subtropical forests. For example, the values presented by Fu et al. [49] for P. massoniana were higher (183.5 Mg ha−1) in southern China, whereas lower values (153.1 Mg ha−1) were reported by Zhang et al. [40] for 20-year-old stands of Cyclobalanopsis glauca (Thunb.) Oerst. plantations. Some studies on Cunninghamia lanceolata (Lamb.) Hook, (e.g., [51]) also reported high values of 247.3 Mg ha−1 for the same stand age range as shown in the current study. An inconsistently lower mean value of shrub biomass stock was observed in the current study (8.4 Mg ha−1) than the value (14.4 Mg ha−1) reported by Kang et al. [16], although our mean value corresponded with the mean value (7.3 Mg ha−1) reported by Justine et al. [47], which are both higher than the mean value (5.0 Mg ha−1) observed by Turner and Long [52] in 30- and 75-year-old Douglas fir stands.
The herb layer carbon stock observed in the current study was 5.4 Mg ha−1, which was greater than the value for Korean pine (P. koraiensis Sieb. et Zucc.) (3.7 Mg ha−1) observed by Li et al. [53]. Such contrasting results could be due to stand age, plantation history, management, and prevailing disturbances at each site. A significant difference was observed in bark biomass between MS and UMS, which was probably due to the removal of understory vegetation from MS plots, thereby promoting an increase in tree height by the reduction of competition for light, water, and nutrients among individual trees in MS plots [13,54].

4.2. P. massoniana Plantations and SOC

Carbon storage in the mineral soil layer increased with stand age (Table 1), as has been reported previously [47]. Several other studies have also reported changes in SOC following the establishment of forests on degraded lands or agricultural farmland. Some researchers found that there was no significant increase in SOC storage [55,56], whereas others observed an increasing trend of SOC storage in the plantations in the early decades after afforestation [57]. Some important factors, such as the choice of plant species used for plantation, forest type, soil properties, land use, and climate may explain the different results observed in different studies. These factors may overshadow the effect of forest management and stand age on the accumulation of SOC [58,59].
In this study, we found that the amount of soil carbon in the topsoil layer (0–10 cm) slowly increased with increasing plantation age, whereas the concentration of carbon stored in the lower soil layers was not correlated with forest age (Table 2). Some researchers, (e.g., Sartori et al. [60]), found that the amount of carbon in the upper mineral soil layer increased with increasing stand age, but a gradually decreasing pattern was seen with increasing stand age at depths of 5–15 cm and 15–25 cm. Studies such as Brown et al. [61], and Sun et al. [62] have reported similar results. In addition to the intricate relationships among soil carbon content and plantation age, the results of this study suggest that mineral soil layers contain large amounts of stored carbon and play a vital role in the carbon budget of plantation ecosystems. Additionally, we observed that UMS showed greater SOC storage than MS plots because plant materials were removed from the MS plots; in contrast, these materials were left on the forest floor in UMS plots, where they were allowed to decompose naturally [13].

4.3. Ecosystem Carbon Storage and P. massoniana Stands

Our results show that P. massoniana plantations in Central China accumulate ecosystem carbon rapidly; this explains why the ecosystem carbon increases with stand age, and this has also been reported by Justine et al. [46]. Increased biomass carbon accumulation may explain the high amount of ecosystem carbon observed in the plantations, likely because stand age influences the ecosystem functions and structure [47]. The total mean ecosystem carbon (226.1 Mg ha−1) measured here was within the average range for the tropical lowlands of Costa Rica as reported by Fonseca et al. [63]. The biomass carbon accumulation of the 48-year-old stands of P. massoniana plantations reached up to 284.4 Mg ha−1 (Table 1). However, the values observed in the current study were higher than the values observed by Li et al. [53] for a 51-year-old stand of P. koraiensis (122.3 Mg ha−1) in central Korea, but were lower than the results of Justine et al. for P. massoniana stands [47]. Furthermore, Mao et al. [64] determined that the amount of SOC contributed to the total ecosystem carbon storage firstly increased and then decreased with increasing stand age, and that upper soil layers had higher levels of SOC than the lower soil layers. Soil carbon represented approximately 60% to 70% of total ecosystem carbon, which demonstrates that these forests represent a potential mitigation mechanism for global climate change (Figure 6). Fonseca et al. [63] showed that for a secondary forest in Costa Rica, the soil carbon storage represents approximately 74.3% of total carbon storage, which is 51.5% higher than the biomass carbon.
Since large areas in China have been planted with P. massoniana, the species plays a vital role in sequestering carbon in forest ecosystems. To understand its significance and its potential in carbon sequestration, it is essential to determine the effects of soil nutrients, topography, anthropogenic disturbances, and human decisions on the health of P. massoniana ecosystems. It is essential to increase the number of samples collected from the forest areas to further strengthen the results of soil investigations. Large-scale plantations play a key role in central China in addition to sequestering carbon, such as protecting fragile communities and restoring degraded land through ecological and social factors that affect these critical ecosystem goods and services. Therefore, further investigation is urgently required [33]. As China is amongst the countries that are severely affected by climate change, China is dedicated to combating climate by developing nationally determined contributions (NDC). The current study will provide information about carbon sequestration in P. massoniana plantations and will help policy makers in future planning.

4.4. Soil Physicochemical Properties under Contrasting Stand Management Schemes and Stand Ages

Soil properties were significantly affected by management scheme and stand age at different soil depths. The highest values for the soil physical properties under study were reported for MS, and 18-and 28-year-old stands. This might be due to the presence of more leaves and twigs from trees in these age groups [61]; additionally, improvements in soil properties have been reported due to the decomposition of litter [65]. However, capillary porosity, capillary water holding capacity, and NP were significantly affected by stand management; with the exception of total porosity, the remaining soil variables were significantly affected by stand age. Furthermore, soil physical properties in the topsoil layer (0–10 cm) showed the strongest response. Soil nutrients (TP and AN) were higher in MS, whereas the availability of P responded more in UMS. This showed that P and N availability was more responsive to stand management. Similarly, it has been reported in previous studies that stand age can increase the recovery of soil nutrient levels with forest development [12,20]. Moreover, studies on post afforestation conditions have shown both depletion of soil nutrients [66] and accumulation of soil organic N with increasing SOC [67] over time (e.g., tree age effect). Soil pH was decreased in the older age groups; thus, our results were supported by those of Berthrong et al. [68], who found that soil pH decreased significantly by an average of 0.3 units across reforestation types, at 27 years after reforestation.
Some important factors including choice of tree species, previous land use, and soil nutrient supply, are thought to explain contradictory tree–age effects on soil properties as related to management [67]. Furthermore, forest age itself (State Forestry Administration, Beijing, China, 2010), soil depth, and other tree management factors have been used to describe seasonal variations in nutrient accumulation [69,70], and increasing soil OM content by improving the litter decomposition rate [65,71]. We believe that increasing the scope of the current methods in the study area would further provide a more detailed information about carbon storage by the plantations and the effect of different stand age and management on the soil properties.

5. Conclusions

A significant increase in the biomass and carbon of P. massoniana plantations was observed with increasing stand age, and the maximum and average annual growth was achieved at approximately 17 and 23 years of age, respectively. MS showed about 9.75% higher biomass and carbon storage than UMS. Biomass carbon storage in the 9-, 18-, 28-, and 48-year-old stands of P. massoniana was age dependent, while managed stands had higher biomass carbon than unmanaged stands. Similarly, herbaceous and shrub carbon concentration and storage were also age dependent. SOC in the uppermost soil layer of the 9-, 18-, 28-, and 48-year-old stands was 116.4, 135.0, 147.4, and 138.1 Mg ha−1, respectively, and was 104.9 and 115.4 Mg ha−1 in each of the two management treatments. As soil depth increased, the SOC content decreased. Total carbon storage in the 9-, 18-, 28-, and 48-year-old stands averaged 143.7, 220.4, 260.1, and 280.3 Mg ha−1, respectively, and 228.1 and 222.3 Mg ha−1 in MS and UMS, respectively. Soil accounted for most of the ecosystem carbon (60% to 70%), followed by the tree biomass carbon (30% to 37%). Furthermore, management had a considerable effect on tree biomass, carbon storage, and soil physical and chemical properties, providing a basis for forest managers to justify such practices during forest planning. Due to the long history of the plantation, higher levels of carbon content were typically found in the upper 0–20 cm soil layer. To further realize the value of P. massoniana in habitat restoration and carbon storage in central China, we propose that the interactive effects of successional development and certain other factors on carbon storage in plantations are the most important. Our results demonstrate that taking stand age and management scheme into consideration is highly beneficial for ecosystem carbon estimation and underlines the potential of P. massoniana for carbon sequestration in plantation ecosystems.

Author Contributions

Conceptualization, Z.Z., M.T., and A.A. (Ashfaq Ali); Methodology, Z.Z., M.T., and A.A. (Ashfaq Ali); formal analysis, A.A. (Ashfaq Ali), M.T., and K.A.; investigation, A.A. (Ashfaq Ali); writing—original draft preparation, A.A. (Ashfaq Ali), K.A., and A.A. (Adnan Ahmad); editing, Z.Z., W.Z., A.A. (Adnan Ahmed), M.T., and Z.Y.; project administration, Z.Z. and M.T.; funding acquisition, Z.Z. and M.T.

Funding

This work was sponsored by the National Key R & D Program of China (Grant number 2016YFD0600201, 2017YFC0505603) and the Major Scientific and Technical Innovation Project of Hubei Province (Grant number 2018ABA074).

Acknowledgments

We express our deepest gratitude to Taizishan Forestry Administration Bureau of Hubei province for providing support and permission to conduct this research. The authors sincerely acknowledge the efforts of Xin Huang, Kuirong Zheng, and other colleagues for their assistance in data collection. We are grateful to Yongjian Wang and Wei He for technical inputs on the manuscript.

Conflicts of Interest

The authors report no potential conflict of interest.

References

  1. Zhou, W.; Gong, P.; Gao, L. A Review of Carbon Forest Development in China. Forests 2017, 8, 295. [Google Scholar] [CrossRef]
  2. Dangal, S.P.; Das, A.K.; Paudel, S.K. Effectiveness of management interventions on forest carbon stock in planted forests in Nepal. J. Environ. Manag. 2017, 196, 511–517. [Google Scholar] [CrossRef] [PubMed]
  3. Terakunpisut, J.; Gajaseni, N.; Ruankawe, N. Carbon sequestration potential in aboveground biomass of Thong Pha Phun National Forest, Thailand. Appl. Ecol. Environ. Res. 2007, 5, 93–102. [Google Scholar] [CrossRef]
  4. Chen, L.C.; Liang, M.J.; Wang, S.L. Carbon stock density in planted versus natural Pinus massoniana forests in sub-tropical China. Ann. For. Sci. 2016. [Google Scholar] [CrossRef]
  5. Hyvönen, R.; Ågren, G.I.; Linder, S.; Persson, T.; Cotrufo, F.; Ekblad, A.; Freeman, M.; Grelle, A.; Ivan, A.; Jarvis, P.G.; et al. The likely impact of elevated [CO2], nitrogen deposition, increased temperature and management on carbon sequestration in temperate and boreal forest ecosystems: A literature review. New Phytol. 2006, 173, 463–480. [Google Scholar] [CrossRef]
  6. Ahmad, A.; Moazzam, N.S.; Marwat, K.B.; Muhammad, J. Annual accumulation of carbon in the coniferous forest of Dir Kohistan: An inventory based estimate. Pak. J. Bot. 2016, 47, 115–118. [Google Scholar]
  7. Barford, C.C.; Wofsy, S.C.; Goulden, M.L.; Munger, J.W.; Pyle, E.H.; Urbanski, S.P.; Hutyra, L.; Saleska, S.R.; Fitzjarrald, D.; Moore, K. Factors Controlling Long- and Short-Term Sequestration of Atmospheric CO2 in a Mid-latitude Forest. Science 2001, 294, 1688–1692. [Google Scholar] [CrossRef]
  8. Vafaei, S.; Soosani, J.; Adeli, K.; Fadaei, H.; Naghavi, H.; Pham, T.D.; Bui, D.T. Improving accuracy estimation of Forest Aboveground Biomass based on incorporation of ALOS-2 PALSAR-2 and Sentinel-2A imagery and machine learning: A case study of the Hyrcanian forest area (Iran). Remote Sens. 2018, 10, 172. [Google Scholar] [CrossRef]
  9. Pham, T.D.; Yokoya, N.; Bui, D.T.; Yoshino, K. Remote Sensing Approaches for Monitoring Mangrove Species, Structure, and Biomass: Opportunities and Challenges. Remote Sens. 2019, 11, 230. [Google Scholar] [CrossRef]
  10. Malmsheimer, R.W.; Heffernan, P.; Brink, S.; Crandall, D.; Deneke, F.; Galik, C.; Gee, E.; Helms, J.A.; Mcclure, N.; Mortimer, M.; et al. Forest Management Solutions for Mitigating Climate Change in the United States. J. For. 2008, 106, 115–173. [Google Scholar]
  11. The Food and Agriculture Organization (FAO). Global Forest Resources Assessment 2015 Desk Reference; FAO: Rome, Italy, 2015. [Google Scholar]
  12. Saeed, S.; Yujun, S.; Beckline, M.; Chen, L.; Zhang, B. Forest edge effect on biomass carbon along altitudinal gradients in Chinese Forest edge effect on biomass carbon along altitudinal gradients in Chinese Fir (Cunninghamia lanceolata): A study from Southeastern China. Carbon Manag. 2019, 11–22. [Google Scholar] [CrossRef]
  13. Ahmad, A.; Liu, Q.; Nizami, S.M.; Mannan, A.; Saeed, S. Carbon emission from deforestation, forest degradation and wood harvest in the temperate region of Hindukush Himalaya, Pakistan between 1994 and 2016. Land Use Policy 2018, 78, 781–790. [Google Scholar] [CrossRef]
  14. Berninger, F.; Nikinmaa, E. Implications of varying pipe model relationships on Scots Pine growth in different climates. Funct. Ecol. 1997, 11, 146–156. [Google Scholar] [CrossRef]
  15. Schulze, E.D.; Aas, G.; Grimm, G.W.; Gossner, M.M.; Walentowski, H.; Ammer, C.; Kühn, I.; Bouriaud, O.; von Gadow, K. A review on plant diversity and forest management of European beech forests. Eur. J. For. Res. 2016, 135. [Google Scholar] [CrossRef]
  16. Kang, B.; Liu, S.R.; Zhang, G.J.; Chang, J.G.; Wen, Y.G.; Ma, J.M.; Hao, W.F. Carbon accumulation and distribution in Pinus massoniana and Cunninghamia lanceolata mixed forest ecosystem in Daqingshan, Guangxi of China. Acta Ecol. Sin. 2006, 26, 1320–1329. [Google Scholar] [CrossRef]
  17. Zianis, D.; Mencuccini, M. On simplifying allometric analyses of forest biomass. For. Ecol. Manag. 2004, 187, 311–332. [Google Scholar] [CrossRef]
  18. Sonogyi, Z.; Cienciala, E.; Makipaa, R.; Muukkonen, P.; Lehtonen, A.; Weiss, P. Indirect methods of large-scale forest biomass estimation. Eur. J. For. Res. 2007. [Google Scholar] [CrossRef]
  19. Wang, C. Biomass allometric equations for 10 co-occurring tree species in Chinese temperate forests. For. Ecol. Manag. 2006, 222, 9–16. [Google Scholar] [CrossRef]
  20. Dixon, R.K.; Brown, S.; Houghton, R.A.; Solomon, A.M.; Trexler, M.C.; Wispniewski, J. Carbon Pools and Flux of Global Forest Ecosystems. Science 1991, 63, 185–190. [Google Scholar] [CrossRef] [PubMed]
  21. Payn, T.; Carnus, J.M.; Freer-Smith, P.; Kimberley, M.; Kollert, W.; Liu, S.; Orazio, C.; Rodriguez, L.; Silva, L.N.; Wingfield, M.J. Changes in planted forests and future global implications. For. Ecol. Manag. 2015, 352, 57–67. [Google Scholar] [CrossRef] [Green Version]
  22. Justine, M.F.; Yang, W.; Wu, F.; Tan, B.; Khan, M.N.; Zhao, Y. Biomass stock and carbon sequestration in a chronosequence of Pinus massoniana plantations in the upper reaches of the Yangtze River. Forests 2015, 6, 3665–3682. [Google Scholar] [CrossRef]
  23. Chen, Y.; Yu, S.; Liu, S.; Wang, X.; Zhang, Y.; Liu, T.; Zhou, L.; Zhang, W.; Fu, S. Reforestation makes a minor contribution to soil carbon accumulation in the short term: Evidence from four subtropical plantations. For. Ecol. Manag. 2017, 384, 400–405. [Google Scholar] [CrossRef]
  24. Karu, H.; Szava-Kovats, R.; Pensa, M.; Kull, O. Carbon sequestration in a chronosequence of Scots pine stands in a reclaimed opencast oil shale mine. Can. J. For. Res. 2009. [Google Scholar] [CrossRef]
  25. Houghton Revised estimates of the annual net flux of carbon to the atmosphere from changes in land use and land management 1850—2000. Tellus 2003, 558, 378–390.
  26. Malins, C. Indirect Land Use Change in Europe—Considering the Policy Options; The International Council on Clean Transportation: Washington, DC, USA, 2011. [Google Scholar]
  27. Atauri, J.A.; De Pablo, C.L.; De Agar, P.M.; Schmitz, M.F.; Pineda, F.D. Effects of management on understory diversity in the forest ecosystems of northern Spain. Environ. Manag. 2004. [Google Scholar] [CrossRef] [PubMed]
  28. Duguid, M.C.; Ashton, M.S. A meta-analysis of the effect of forest management for timber on understory plant species diversity in temperate forests. For. Ecol. Manag. 2013, 303, 81–90. [Google Scholar] [CrossRef]
  29. Pendleton, L.; Donato, D.C.; Murray, B.C.; Crooks, S.; Jenkins, W.A.; Megonigal, P.; Pidgeon, E.; Herr, D.; Gordon, D.; Baldera, A. Estimating Global “Blue Carbon” Emissions from Conversion and Degradation of Vegetated Coastal Ecosystems. PLoS ONE 2012, 7, e43542. [Google Scholar] [CrossRef]
  30. Brockerhoff, E.G.; Jactel, H.; Parrotta, J.A.; Quine, C.P.; Sayer, J. Plantation forests and biodiversity: Oxymoron or opportunity? Biodivers. Conserv. 2008, 17, 925–951. [Google Scholar] [CrossRef]
  31. Cao, S.; Chen, L.; Shankman, D.; Wang, C.; Wang, X.; Zhang, H. Excessive reliance on afforestation in China’s arid and semi-arid regions: Lessons in ecological restoration. Earth Sci. Rev. 2011, 104, 240–245. [Google Scholar] [CrossRef]
  32. Xue, L.; Li, Q.; Chen, H. Effects of a wildfire on selected physical, chemical and biochemical soil properties in a Pinus massoniana forest in South China. Forests 2014, 5, 2947–2966. [Google Scholar] [CrossRef]
  33. Wang, F.; Xu, X.; Zou, B.; Guo, Z.; Li, Z.; Zhu, W. Biomass Accumulation and Carbon Sequestration in Four Different Aged Casuarina equisetifolia Coastal Shelterbelt Plantations in South China. PLoS ONE 2013, 8, e77449. [Google Scholar] [CrossRef] [PubMed]
  34. Hu, W.J.; Wang, P.C.; Zhang, Y.; Teng, M.J.; Zhou, Z.X. Effect of gap disturbances on soil properties and understory plant diversity in a pinus massoniana plantation in hubei, central China. J. Anim. Plant Sci. 2016, 26, 988–1001. [Google Scholar]
  35. Chen, D.; Ali, A.; Yong, X.H.; Lin, C.G.; Niu, X.H.; Cai, A.M.; Dong, B.C.; Zhou, Z.X.; Wang, Y.J.; Yu, F.H. A multi-species comparison of selective placement patterns of ramets in invasive alien and native clonal plants to light, soil nutrient and water heterogeneity. Sci. Total Environ. 2019. [Google Scholar] [CrossRef] [PubMed]
  36. Xiuhong, J.; Yi, Z.; Zhixiang, Z.; Daxiong, G.; Jingrong, X.; Guozhi, G. Hydrological characteristics of forest litter and soil in different successional stages in Hill region of central Hubei. J. Soil Water Conserv. 2013, 27, 125–129. [Google Scholar]
  37. Wang, Y.; Müller-Schärer, H.; van Kleunen, M.; Cai, A.; Zhang, P.; Yan, R.; Dong, B.; Yu, F. Invasive alien plants benefit more from clonal integration in heterogeneous environments than natives. New Phytol. 2017, 216, 1072–1078. [Google Scholar] [CrossRef] [PubMed] [Green Version]
  38. Hirata, A.; Sakai, T.; Takahashi, K.; Sato, T.; Tanouchi, H.; Sugita, H.; Tanaka, H. Effects of management, environment and landscape conditions on establishment of hardwood seedlings and saplings in central Japanese coniferous plantations. For. Ecol. Manag. 2011, 262, 1280–1288. [Google Scholar] [CrossRef]
  39. State Forestry Administration (SFA). Tree Biomass Methods and Related Parameters of Carbon Accumulating in Pinus massonina; SFA: Beijing, China, 2014. [Google Scholar]
  40. Zhang, H.; Song, T.; Wang, K.; Du, H.; Yue, Y. Biomass and carbon storage in an age-sequence of Cyclobalanopsis glauca plantations in southwest China. Ecol. Eng. 2014, 73, 184–191. [Google Scholar] [CrossRef]
  41. Cheng, X.; Yu, M.; Wang, G.G. Effects of Thinning on Soil Organic Carbon Fractions and Soil Properties in Cunninghamia lanceolata Stands in Eastern China. Forests 2017, 8, 198. [Google Scholar] [CrossRef]
  42. Lal, R.; Shukla, M.K. Principles of Soil Physics; Marcel Dekker, Inc.: New York, NY, USA, 2004; ISBN 0-203-02123-1. [Google Scholar]
  43. Chen, Y.; Cao, Y. Response of tree regeneration and understory plant species diversity to stand density in mature Pinus tabulaeformis plantations in the hilly area of the Loess Plateau, China. Ecol. Eng. 2014, 73, 238–245. [Google Scholar] [CrossRef]
  44. Cao, Y.; Chen, Y. Ecosystem C: N: P stoichiometry and carbon storage in plantations and a secondary forest on the Loess Plateau, China. Ecol. Eng. 2017, 105, 125–132. [Google Scholar] [CrossRef]
  45. Lu, R.K. Analytical Methods of Soil Agrochemistry; China Agricultural Science and Technology Publishing House: Beijing, China, 1999; pp. 18–99. [Google Scholar]
  46. Walkley, A.; Black, I.A. An examination of the Degtjareff method for determining soil organic matter, and a proposed modification of the chromic acid titration method. Soil Sci. 1934, 37, 29–38. [Google Scholar] [CrossRef]
  47. Justine, M.F.; Yang, W.; Wu, F.; Khan, M.N. Dynamics of biomass and carbon sequestration across a chronosequence of masson pine plantations. J. Geophys. Res. Biogeosci. 2017, 122, 578–591. [Google Scholar] [CrossRef]
  48. Ali, A.; Ma, W.J.; Yang, X.D.; Sun, B.W.; Shi, Q.R.; Xu, M.S. Biomass and carbon stocks in Schima superba dominated subtropical forests of eastern China. J. For. Sci. 2014, 60, 198–207. [Google Scholar] [CrossRef] [Green Version]
  49. Yadav, D.; Wang, J. Modelling carbon dioxide emissions from agricultural soils in Canada. Environ. Pollut. 2017, 230, 1040–1049. [Google Scholar] [CrossRef] [PubMed]
  50. Fu, L.; Zeng, W.; Zhang, H.; Wang, G.; Lei, Y.; Tang, S. Generic linear mixed-effects individual-tree biomass models for Pinus massoniana in southern China. South. For. J. For. Sci. 2014, 76, 47–56. [Google Scholar] [CrossRef]
  51. Yu, Y.F.; Song, T.Q.; Zeng, F.P.; Peng, W.X.; Wen, Y.G.; Huang, C.B.; Wu, Q.B.; Zeng, Z.X.; Yu, Y. Dynamic changes of biomass and its allocation in Cunninghamia lanceolata plantations of different stand ages. Chin. J. Ecol. 2013, 32, 1660–1666. [Google Scholar]
  52. Turner, J.; Long, J.N. Accumulation of organic matter in a series of Douglas fir stands. Can. J. For. Res. 1975, 5, 681–690. [Google Scholar] [CrossRef]
  53. Li, X.; Yi, M.J.; Son, Y. Biomass and Carbon Storage in an Age-Sequence of Korean Pine (Pinus koraiensis) Plantation Forests in Central Korea. J. Plant Biol. 2011, 54, 33–42. [Google Scholar] [CrossRef]
  54. Noormets, A.; Epron, D.; Domec, J.C.; McNulty, S.G.; Fox, T.; Sun, G.; King, J.S. Effects of forest management on productivity and carbon sequestration: A review and hypothesis. For. Ecol. Manag. 2015, 355, 124–140. [Google Scholar] [CrossRef] [Green Version]
  55. Farley, K.A.; Kelly, E.F.; Hofstede, R.G.M. Soil Organic Carbon and Water Retention after Conversion of Grasslands to Pine Plantations in the Ecuadorian Andes. Ecosystems 2004, 7, 729–739. [Google Scholar] [CrossRef]
  56. Pan, Y. A large and persistent carbon sink in the world’s Forests. Science 2011, 333, 988–993. [Google Scholar] [CrossRef] [PubMed]
  57. Gelfand, I.; Fried, Y.; Yakir, D. Biogeochemical factors contributing to enhanced carbon storage following afforestation of a semi-arid shrubland. Biogeosciences 2007, 4, 891–904. [Google Scholar] [Green Version]
  58. Laganiere, J.; Angers, D.A.; Pare, D. Carbon accumulation in agricultural soils after afforestation: A meta-analysis. Glob. Chang. Biol. 2010, 16, 439–453. [Google Scholar] [CrossRef]
  59. Han, X.; Gao, G.; Chang, R.; Li, Z.; Ma, Y.; Wang, S.; Wang, C.; Lü, Y.; Fu, B. Changes in soil organic and inorganic carbon stocks in deep pro fi les following cropland abandonment along a precipitation gradient across the Loess Plateau of China. Agric. Ecosyst. Environ. 2018, 258, 1–13. [Google Scholar] [CrossRef]
  60. Sartori, F.; Lal, R.; Ebinger, M.H.; Eaton, J.A. Changes in soil carbon and nutrient pools along a chronosequence of poplar plantations in the Columbia Plateau, Oregon, USA. Agric. Ecosyst. Environ. 2007, 122, 325–339. [Google Scholar] [CrossRef] [Green Version]
  61. Brown, S.; Pare, D. Dynamics of carbon and nitrogen mineralization in relation to stand type, stand age and soil texture in the boreal mixedwood. Soil Biol. Biochem. 2000, 32, 1079–1090. [Google Scholar]
  62. Sun, O.J.; Campbell, J.; Law, B.E.; Wolf, V. Dynamics of carbon stocks in soils and detritus across chronosequences of different forest types in the Pacific Northwest, USA. Glob. Chang. Biol. 2004, 10, 1470–1481. [Google Scholar] [CrossRef]
  63. Fonseca, W.; María, J.; Benayas, R.; Alice, F.E. Carbon accumulation in the biomass and soil of different aged secondary forests in the humid tropics of Costa Rica. For. Ecol. Manag. 2011, 262, 1400–1408. [Google Scholar] [CrossRef]
  64. Mao, R.; Zeng, D.-H.; Hu, Y.-L.; Li, L.-J.; Yang, D. Soil organic carbon and nitrogen stocks in an age-sequence of poplar stands planted on marginal agricultural land in Northeast China. Plant Soil 2010, 332, 277–287. [Google Scholar] [CrossRef]
  65. Prescott, C.E. Litter decomposition: What controls it and how can we alter it to sequester more carbon in forest soils? Biogeochemistry 2016, 101, 133–149. [Google Scholar] [CrossRef]
  66. Huang, L.; Zhu, W.; Ren, H.; Chen, H.; Wang, J. Impact of atmospheric nitrogen deposition on soil properties and herb-layer diversity in remnant forests along an urban—Rural gradient in Guangzhou, southern. Plant Ecol. 2012, 1187–1202. [Google Scholar] [CrossRef]
  67. Piao, S.; Fang, J.; Ciais, P.; Peylin, P.; Huang, Y.; Sitch, S.; Wang, T. The carbon balance of terrestrial ecosystems in China. Nature 2009, 458, 1009–1013. [Google Scholar] [CrossRef] [PubMed]
  68. Berthrong, S.T.; Jobbagy, E.G.; Jackson, R.B. A global meta-analysis of soil exchangeable cations, pH, carbon, and nitrogen with afforestation. Ecol. Appl. 2009, 19, 2228–2241. [Google Scholar] [CrossRef] [PubMed] [Green Version]
  69. Pibumrung, P.; Gajaseni, N.; Popan, A. Profiles of carbon stocks in forest, reforestation and agricultural land. J. For. Res. 2008, 19, 11–18. [Google Scholar] [CrossRef]
  70. Stinson, G.; Kurz, W.A.; Smyth, C.E.; Neilson, E.T.; Dymond, C.C.; Metsaranta, J.M.; Boisvenue, C.; Rampley, G.J.; Li, Q.; White, T.M.; et al. An inventory-based analysis of Canada’ s managed forest carbon dynamics, 1990 to 2008. Glob. Chang. Biol. 2011, 2227–2244. [Google Scholar] [CrossRef]
  71. Alifragis, D.; Smiris, P.; Maris, F.; Kavvadias, V.; Konstantinidou, E.; Stamou, N. The effect of stand age on the accumulation of nutrients in the aboveground components of an Aleppo pine ecosystem. For. Ecol. Manag. 2001. [Google Scholar] [CrossRef]
Figure 1. Map of the study area showing stand age and management classes in the Taizishan Forestry Administration Bureau, Hubei Province, China.
Forests 10 00645 g001
Figure 2. Growth of managed and unmanaged stands of Masson pine (Pinus massoniana Lamb) in the Taizishan Forestry Administration Bureau, Central China.
Forests 10 00645 g002
Figure 3. Ordination plot of results from redundancy analysis to identify the relationship of soil chemical properties with soil physical properties. Note: Maximum water capacity (MWC); maximum water holding capacity (MWHC); capillary water capacity (CWP); capillary porosity (CP); non-capillary porosity (NCP); total porosity (TPo); soil density (SD); soil pH (pH:); total phosphorus (TP); organic matter (OM); total nitrogen (TN); available phosphorus (AP); alkaline N solution (AN).
Forests 10 00645 g003
Figure 4. (A,B). Principal component analysis (PCA) of soil physical properties from different stand age groups and management treatments in P. massoniana plantations. Note: Maximum water capacity (MWC); maximum water holding capacity (MWHC); capillary water capacity (CWP); capillary porosity (CP); noncapillary porosity (NCP); total porosity (TPo); soil density (SD); soil pH (pH); total phosphorus (TP); organic matter (OM); total nitrogen (TN); available phosphorus (AP); available N (AN).
Forests 10 00645 g004
Figure 5. Relationship of age (year) and soil organic carbon (Mg ha−1), forest floor carbon (Mg ha−1), vegetation carbon (Mg ha−1) and total ecosystem carbon (Mg ha−1), in Masson pine (P. massoniana) stands.
Forests 10 00645 g005
Figure 6. Ecosystem carbon allocation by stand age and two management treatments in P. massoniana plantations (a) represents the carbon storage in age sequence while (b) demonstrates the carbon storage in the two management practices).
Forests 10 00645 g006
Table 1. Biomass (Mg ha−1) in tree and forest floor vegetation, in 9, 18, 28, and 48 year age groups and the two management treatments of Masson pine (Pinus massoniana Lamb) in the Taizishan Forestry Administration Bureau. Data are means ± SD of each component in the sampled forest stands. Means within columns followed by different lower-case letters were significantly different (p = 0.05) as per ANOVA followed by the LSD test. (TB = total biomass).
VariablesBiomass Components
Stand Age (Years)StemBarkBranchesLeavesAbovegroundBelowgroundTotal TreeShrubsHerbsTB
918.3 ± 5.7d3.1 ± 0.9c9.6 ± 4.5c6.2 ± 2.5b37.3 ± 10.2d8.7 ± 2.4d46.1 ± 12.16.1 ± 4.2a2.7 ± 0.8a54.8 ± 10.1d
1898.5 ± 8.3c8.7 ± 1.4b20.5 ± 5.1b8.6 ± 1.2b136.3 ± 15.6c21.7 ± 5.4c158.0 ± 21.68.6 ± 6.1a5.5 ± 3.5a172.1 ± 41.5c
28142.5 ± 13.3b11.2 ± 2.7ab13.7 ± 66.2b10.0 ± 1.7a177.5 ± 19.3b31.3 ± 8.2b208.8 ± 18.710.3 ± 4.2a6.3 ± 5.2a225.4 ± 56.1b
48149.3 ± 15.4a12.9 ± 3.4a38.6 ± 6.2a12.1 ± 3.1a212.8 ± 21.1a53.2 ± 5.3a266.0 ± 22.410.7 ± 7.3a7.7 ± 3.2a284.4 ± 44.7a
Management Scheme
MS134 ± 15.3a12.0 ± 2.2b28.6 ± 5.8a14.1 ± 2.5a188.7 ± 13.2a42.6 ± 7.2a231.3 ± 17.58.3 ± 5.3b5.7 ± 5.5b245.4 ± 51.4b
UMS114.9 ± 14.2a10.9 ± 2.4a26.3 ± 5.1a11.2 ± 1.2a163.3 ± 16.4b32.1 ± 8.3b195.4 ± 14.210.4 ± 9.7a7.1 ± 6.8a212.9 ± 36.1a
Table 2. Biomass carbon (Mg ha−1) in trees and forest floor vegetation in the 9, 18, 28, and 48 year age groups and the two management treatments of Masson pine (P. massoniana) in the studied area. (TC = Total Carbon). Different lower-case letters within columns indicate the significance level among different variables.
pTree Components
Stand Age (Years)StemBarkBranchLeavesAbovegroundBelowgroundTotal treeShrubsHerbaceousTC
99.2 ± 2.7d1.5 ± 0.5c4.8 ± 2.2c3.1 ± 1.3b18.6 ± 5.6d4.4 ± 1.2d23.0 ± 6.53.0 ± 2.2a1.4 ± 0.4a27.4 ± 9.2d
1849.2 ± 4.2c4.4 ± 0.7b10.2 ± 2.5b4.3 ± 0.6b68.1 ± 7.8c10.9 ± 2.3c79.0 ± 10.34.3 ± 3.1a2.7 ± 1.7a86.0 ± 22.1c
2871.3 ± 6.6b5.6 ± 1.4ab6.9 ± 3.1b5.0 ± 0.8a88.7 ± 9.6b15.7 ± 4.1b104.4 ± 9.35.2 ± 1.1a3.2 ± 2.6a112.7 ± 28.4b
4874.6 ± 7.9a6.5 ± 1.8a19.3 ± 3.1a6.0 ± 1.5a106.4 ± 10.2a26.6 ± 2.6a133.0 ± 11.25.4 ± 3.6a3.9 ± 1.8a142.2 ± 21.4a
Management Schemes
MS66.9 ± 7.6a6.0 ± 1.1b14.3 ± 3.1a7.1 ± 1.2a94.3 ± 6.6a21.8 ± 3.6a116 ± 11.44.2 ± 2.1b2.7 ± 1.3b122.6 ± 25.7a
UMS57.5 ± 7.1a5.5 ± 1.2a13.2 ± 2.5a5.5 ± 0.6a81.6 ± 8.2b16.0 ± 4.1a97.7 ± 10.75.2 ± 4.7a3.6 ± 2.4a106.5 ± 17.2a
Table 3. Ecosystem carbon storage (Mg ha−1) in the four stand age groups and two management treatments of P. massoniana plantations. Different lower-case letters within columns indicate the significance level among different variables.
Variables Stand Age (Years)SOCForest FloorTotal TreeEcosystem
9116.4 ± 12.5ab4.3 ± 1.6a23.0 ± 6.5a143.7 ± 24.2b
18135.0 ± 10.5ab6.4 ± 2.2b79.0 ± 10.3ab220.4 ± 21.7b
28147.4 ± 17.1a8.3 ± 2.5b104.4 ± 9.3b260.1 ± 33.5a
48138.1 ± 14.4a9.2 ± 2.8ab133.0 ± 11.2b280.3 ± 49.1a
Mean134.2 ± 13.1ab7.1 ± 3.3ab84.8 ± 15.4ab226.1 ± 26.7ab
Management Schemes
MS104.9 ± 15.6a6.4 ± 2.1a116 ± 11.4a227.3 ± 21.5a
UMS115.4 ± 18.2b9.3 ± 3.4a97.7 ± 10.7b222.4 ± 18.7b
Mean110.1 ± 15.1ab7.9 ± 3.3ab112.1 ± 13.5ab225.0 ± 14.5ab
Table 4. Soil physical properties in different stand age groups and management treatments in Masson pine (P. massoniana) plantations. Different lower-case letters within columns indicate significant differences among means.
Soil Physical Properties
TPo (%)CP (%)CTWHC (g kg−1)MNWHC (g kg−1)MXWHC (g kg−1)NCP (%)SD (g cm−3)
Management Schemes
MS5.7a20.6b168.6b135.4a212.9a5.1a1.2a
UMS6.2a21.7a180.2a140.3a217.6a4.4b1.2a
Age
9 years25.3a20.7b159.2b117.1b195.5b4.5b1.3a
18 years26.2a20.5b182.3a148.9a233.9a5.6a1.1c
28 years26.1a23.2a183.5a145.6a207.6b2.9c1.2a
48 years26.3a20.4b172.7a139.7a223.8a5.8a1.2b
Soil Depth
1st layer26.4a20.8a183.5a145.3a235.4a5.6a1.1b
2nd layer26.4a21.2a170.5b133.6a212.8b5.2a1.2a
3rd layer25.1b21.6a169.2b134.6a197.3c3.5b1.2a
Interactions
A*MNsNSNSNSNSNSNS
A*SD*****NS*NSNS
M*SDNSNSNSNSNSNSNS
M*A*SD**NSNSNSNSNSNS
Age (A); management (M); soil depth (SD); maximum water capacity (MWC); maximum water holding capacity (MWHC); capillary tube water holding capacity (CTWHC); capillary porosity (CP); noncapillary porosity (NCP); total porosity (TPo); soil density (SD). Soil layers: 1st layer (0–10 cm), 2nd layer (10–20 cm), and 3rd layer (20–40 cm). * means low significance, ** means high significant level.
Table 5. Soil chemical properties in different age groups and management treatments in Masson pine (P. massoniana) plantations. Different lower-case letters within columns indicate the significance level among different variables.
Soil Chemical Properties
TP (g kg−1)AP (g kg−1)AN (mg kg−1)OM (%)TN (g kg−1)pH
Management Schemes
UMS3.7b4.1a113.7a3.9a0.7a5.5a
MS4.8a2.7b130.5a3.8a0.7a5.5a
Age
9 years3.7b3.8a118.8ab3.5a0.7a5.6a
18 years5.4a3.4a107.6b4.1a0.8a5.6a
28 years2.6c3.3a119.0ab3.8a0.7a5.5a
48 years5.4a2.9a142.9a4.1a0.8a5.3b
Soil Depth
soil Layer5.4a4.5a197.1a6.5a1.3a5.2c
(0–10 cm)
3.9b3.1b100.5b3.1b0.6b5.5b
(10–20 cm)
3.6b2.4b68.7c2.1c0.4c5.8a
(20–40 cm)
Interactions
A*M***NS***NSNS**
A*SD*NS*******
M*SDNSNSNSNSNSNS
A*M*SDNSNSNSNSNSNS
Age (A); management (M); soil depth (SD); soil pH (pH:); total phosphorus (TP); organic matter (OM); total nitrogen (TN); available phosphorus (AP); alkaline N solution (AN). The PCA revealed clear differences in soil properties in response to management (Figure 4A) and stand age (Figure 4B). The different age groups were clearly clustered into four groups, whereas management treatments were clustered into two groups. For management treatment, PC1 explained 55.3% and PC2 explained 35.4% of cumulative variance (Figure 4A). For the age groups, PC1 explained 94.2% and PC2 explained 41.5% of cumulative variance (Figure 4B). The analysis revealed that the 18-year-old groups were optimal for increasing soil properties and soil carbon storage in different tree components. However, the effect of management was observed to be associated with an increase in the value of most soil variables. * means low significance, ** means high significant level, *** means highly significant.
Table 6. Regression equation for age groups (year) and soil organic carbon (Mg ha−1), forest floor carbon (Mg ha−1), vegetation carbon (Mg ha−1), and total ecosystem carbon (Mg ha−1) in P. massoniana stands.
CorrelationR2RMSE
Age and Soil organic carbon0.398.66
Age and Forest Floor carbon0.870.88
Age and Vegetation carbon0.8616.10
Age and Total Ecosystem carbon0.7825.24
Soil organic carbon (SOC); forest floor carbon (FFC); vegetation carbon (VC); total ecosystem carbon (TEC); Root Mean Square Error (RMSE).

