Article

Seasonal Variation in Phenolic Compounds and Antioxidant Activity in Leaves of Cyclocarya paliurus (Batal.) Iljinskaja

1
College of Forestry, Nanjing Forestry University, Nanjing 210037, China
2
Research Center of Forestry and Fruit, Lianyungang Academy of Agricultural Science, Lianyungang 222000, China
3
Co-Innovation Center for Sustainable Forestry in Southern China, Nanjing Forestry University, Nanjing 210037, China
*
Author to whom correspondence should be addressed.
Forests 2019, 10(8), 624; https://doi.org/10.3390/f10080624
Submission received: 6 June 2019 / Revised: 20 July 2019 / Accepted: 22 July 2019 / Published: 26 July 2019
(This article belongs to the Special Issue Forest, Foods and Nutrition)

Abstract

:
Cyclocarya paliurus (Batal.) Iljinskaja is a plant with nutraceutical importance since its leaves have been used historically as folk medicines for hundreds of years. The content of 10 phenolic compounds was determined throughout the growing season by high-performance liquid chromatography (HPLC) with UV detector, while the antioxidant activities of C. paliurus leaf extracts were evaluated by 1,1-diphenyl-2-picrylhydrazyl (DPPH), 2,2′-azino-bis (3-ethylbenzothiazoline-6-sulfonic acid) diammonium salt radical cation (ABTS), and ferric reducing antioxidant power (FRAP) methods. Seasonal variations in phenolic concentration and antioxidant activity as well as linkage between the phenolic composition and antioxidant activity were assessed. A significant seasonal variation of phenolic compounds was observed in the leaves and the highest content appeared in May, July, and November. Seventy percent ethanol extract of C. paliurus leaves possessed a good radical scavenging potency. Meanwhile, a significant correlation between antioxidant activities and contents of phenolics was detected. Results of the relationship between molecular structures and their antioxidant activities showed that both the number and configuration of H-donating hydroxyl groups are the main structural features influencing the antioxidant capacity of phenolics, while glycosylation may reduce the antioxidant capacity. The information provided by this study not only revealed the accumulative dynamics of phenolic compounds, but also established a basis for determining the optimal time for harvesting to improve the content of beneficial compounds in the leaves of C. paliurus in the future.

1. Introduction

Phenolic compounds are known to be food constituents of health-beneficial nature. As a large group of plant secondary metabolites, they are present in most plants. So far, more than 8000 dietary phenolic substances have been identified [1,2]. Phenolic compounds have shown diverse pharmaceutical and health-promoting effects, including antibacterial, anticarcinogenic, antioxidant, antimutagenic, anti-inflammatory, antiallergic, anti-obesity, and antidiabetic activities [3,4,5]. Among them, flavonoids are the largest and predominant group with important health value. There is a lot of research interest in the antioxidant activity of flavonoids and other plant phenolic compounds owing to their tremendous potential in health promotion and disease prevention [6,7,8,9]. Antioxidant substances are able to scavenge free radicals through a variety of mechanisms, thereby helping to protect biologically important cellular components, such as DNA, proteins, and membrane lipids, from free radical attacks leading to cell damage, which has been linked to aging, inflammation, atherosclerosis, ischemic injury, and cancer [7,10,11]. Consequently, phenolic compounds from plants, which were not only used as functional food ingredients but also for other preparations of health-promoting products, have become a hot topic for research and development [12]. As a kind of major secondary metabolites, the biosynthesis and accumulation of phenolic compounds are not only dependent on intrinsic factors and developmental stage, but they can be greatly influenced also by external factors such as light, temperature, and wounding, as well as a cultivation technique and the soil permeability and its depth [13,14,15,16].
Cyclocarya paliurus (Batal.) Iljinskaja, a member of Juglandaceae, is naturally scattered in the highland areas in southern China. Traditionally, C. paliurus leaves have been used as a nutraceutical tea for a long time in China due to its health promotion effects and special flavor and taste [17,18]. Moreover, the leaves of C. paliurus have been widely used for the treatment of obesity, hypertensive, lipid peroxidation, and diabetes in Chinese folk medicine [12,19,20,21]. Additionally, their immunity enhancement, anti-aging, anti-bacterial, and anti-cancer activities have also been reported [22,23,24]. It is believed that the physiologically active substances in C. paliurus leaves are responsible for its therapeutic effects. Recently, 10 phenolic compounds have been isolated and identities from the 70% ethanol extract of C. paliurus leaves by HPLC-Q-TOF-MS [25]. Previous phytochemical investigation also reported the presence of some other bioactive nature compounds, such as triterpenoids, steroids, alkaloids, and polysaccharides, from Cyclocarya species [26,27,28]. Due to its various benefits to health, a huge production of C. paliurus leaves is required [29]. Thus, recently, attempts have been made to develop plantations of C. paliurus as a functional food or an important raw material for pharmaceutical industry [30]. The accumulation of physiologically active substances in C. paliurus are related to many factors, but determination of the best harvesting time is one of most important silvicultural practices in the plantation management.
Temporal variations are quite common for natural compounds. For example, the camptothecin content in leaves of Camptotheca acuminata showed a reduction trend during the growth season [31], while the contents of saponins, dencichine, flavonoid, and polysaccharide in root of Panax notoginseng showed a seasonal variation [32]. The contents of vitamin C and flavonoids in lemon tree were significantly affected by harvest times [33]. Apparently, temporal variations are related to the plant species and can contribute to variations of the finished botanical products. Our previous studies also showed the seasonal variations of water soluble polysaccharides, selected flavonoids, and microelement contents in C. paliurus leaves [30,34,35]. However, little information about variation in quantities of phenolic constituents in leaves of C. paliurus during the whole year is available. The objective of the present study was to investigate temporal variation of phenolic acids and flavonoids contents as well as their antioxidative effectiveness of C. paliurus leaves collected over the whole growth period and to illustrate the structure–activity relationship of phenolic compounds in C. paliurus leaves. The results of the present study may shed light on the accumulative dynamics of phenolic compounds in the leaves of C. paliurus and provide a valuable reference for determining the appropriate harvesting time.

2. Materials and Methods

2.1. Plant Materials

Seeds of 10 C. paliurus families were collected from natural forests of Lushan, Jiangxi province (29°33′ N, 116°30′ E) in late October 2006. The collected seeds were prepared according to the method proposed by Fang et al. [17]. After stratification treatment, the germinated seeds were first sown in plastic containers (5 cm in diameter and 15 cm in height) before being transplanted to the C. paliurus germplasm nursery when the seedlings were about 6 cm in height. Following one year of growth in the nursery, seedlings of the 10 families were transplanted to Nanjing Forestry University Base (31°66′ N, 119°01′ E, 368 m about sea level), with an average annual temperature of 15.5 °C, average annual precipitation of 1037 mm, annual sunshine hour of 2146 h, and an annual frost-free period of 237 days. Briefly, the plantation was established with a planting spacing of 3 × 4 m in 2008 and each family consisted of 10 to 30 seedlings.

2.2. Sample Collection

To investigate the accumulative dynamic of phenolic in the leaves of C. paliurus during the growing period, approximately 200 g fresh fully developed leaves of the 10 families were sampled at 4 weeks intervals from May to November (24 May, 21 June, 19 July, 16 August, 13 September, 11 October, and 9 November in 2017). For each family, samples were randomly collected from 3 individual trees with similar canopy, which were mixed to form a pool representing the family.

2.3. Chemical Reagents and Reference

Acetonitrile was of HPLC grade from Tedia (Fairfied, OH, USA); Water was deionized using a Milli-Q water purification system (Millipore, Millford, MA, USA); formic acid was purchased from Aladdin Co., Ltd. (Shanghai, China), and other reagents were all of analytical reagent grade. The following standards were used for quantification of phenolic compounds including 3-O-caffeoylquinic acid (3-CQA), 4-O-caffeoylquinic acid (4-CQA), 4,5-di-O-caffeoylquinic acid (4,5-CQA), quercetin-3-O-glucuronide (Q-3-Glu), quercetin-3-O-galactoside (Q-3-Gal), quercetin-3-O-glucoside (Q-3-Glc) quercetin-3-O-rhamnoside (Q-3-Rha), kaempferol-3-O-glucuronide (K-3-Glu), kaempferol-3-O-glucoside (K-3-Glc), kaempferol-3-O-rhamnoside (K-3-Rha), quercetin (Quer), and kaempferol (Kaempf), which were purchased from Shanghai Yuanye Biotechnology Co., Ltd. (Shanghai, China) with purities of over 98%. 1,1-diphenyl-2-picrylhydrazyl (DPPH) was obtained from Sigma-Aldrich (St. Louis, MO, USA), while the ferric reducing antioxidant power (FRAP) assay kit and 2,2′-azino-bis (3-ethylbenzothiazoline-6-sulfonic acid) diammonium salt radical cation (ABTS) assay kit were purchased from the Beyotime Institute of Biotechnology (Nantong, China).
All solvents and samples were filtered through 0.22 μm filter before injecting into HPLC.

2.4. Sample and Standard Solutions Preparation

All samples were oven-dried to constant weight at 60 °C. Subsequently, the dried leaves were ground to a fine powder with a tissue grinder. Then the powder samples were stored at room temperature prior to analysis. Approximately 1 g of leaf powder sample was extracted with 100 mL of petroleum ether in a soxhlet extractor and refluxed for 4 h in a water bath at 80 °C to remove the fat soluble impurities such as pigment contained in the sample. The extract was discarded, while the residues were retained and dried at the room temperature. Phenolic compounds in the residue were extracted using an ultrasonic-assisted method [25]. Briefly, 15 mL of 70% ethanol was added to each sample and the samples were sonicated in an ultrasonic cleaner (ultrasonic instruments, Kunshan, China) at 70 °C for 45 min and then centrifuged for 10 min in a high-speed centrifuge (10,000 rpm).
Standard solutions were prepared by weighing the 10 reference compounds accurately and dissolving them in methanol. Then the stock solutions of the 10 reference compounds were further diluted to appropriate concentrations for establishment of calibration curves. The external standard calibrations were constructed at six data points covering the concentration range of each compound according to the levels of these compounds reported by our previous survey for this species. The calibration regression was plotted after linear regression of the peak areas versus concentrations. All the solutions were stored in a refrigerator at 4 °C and brought to room temperature before use, and all solvents were filtered with a 0.22 um organic phase filter into an HPLC vial and subjected to HPLC analysis.

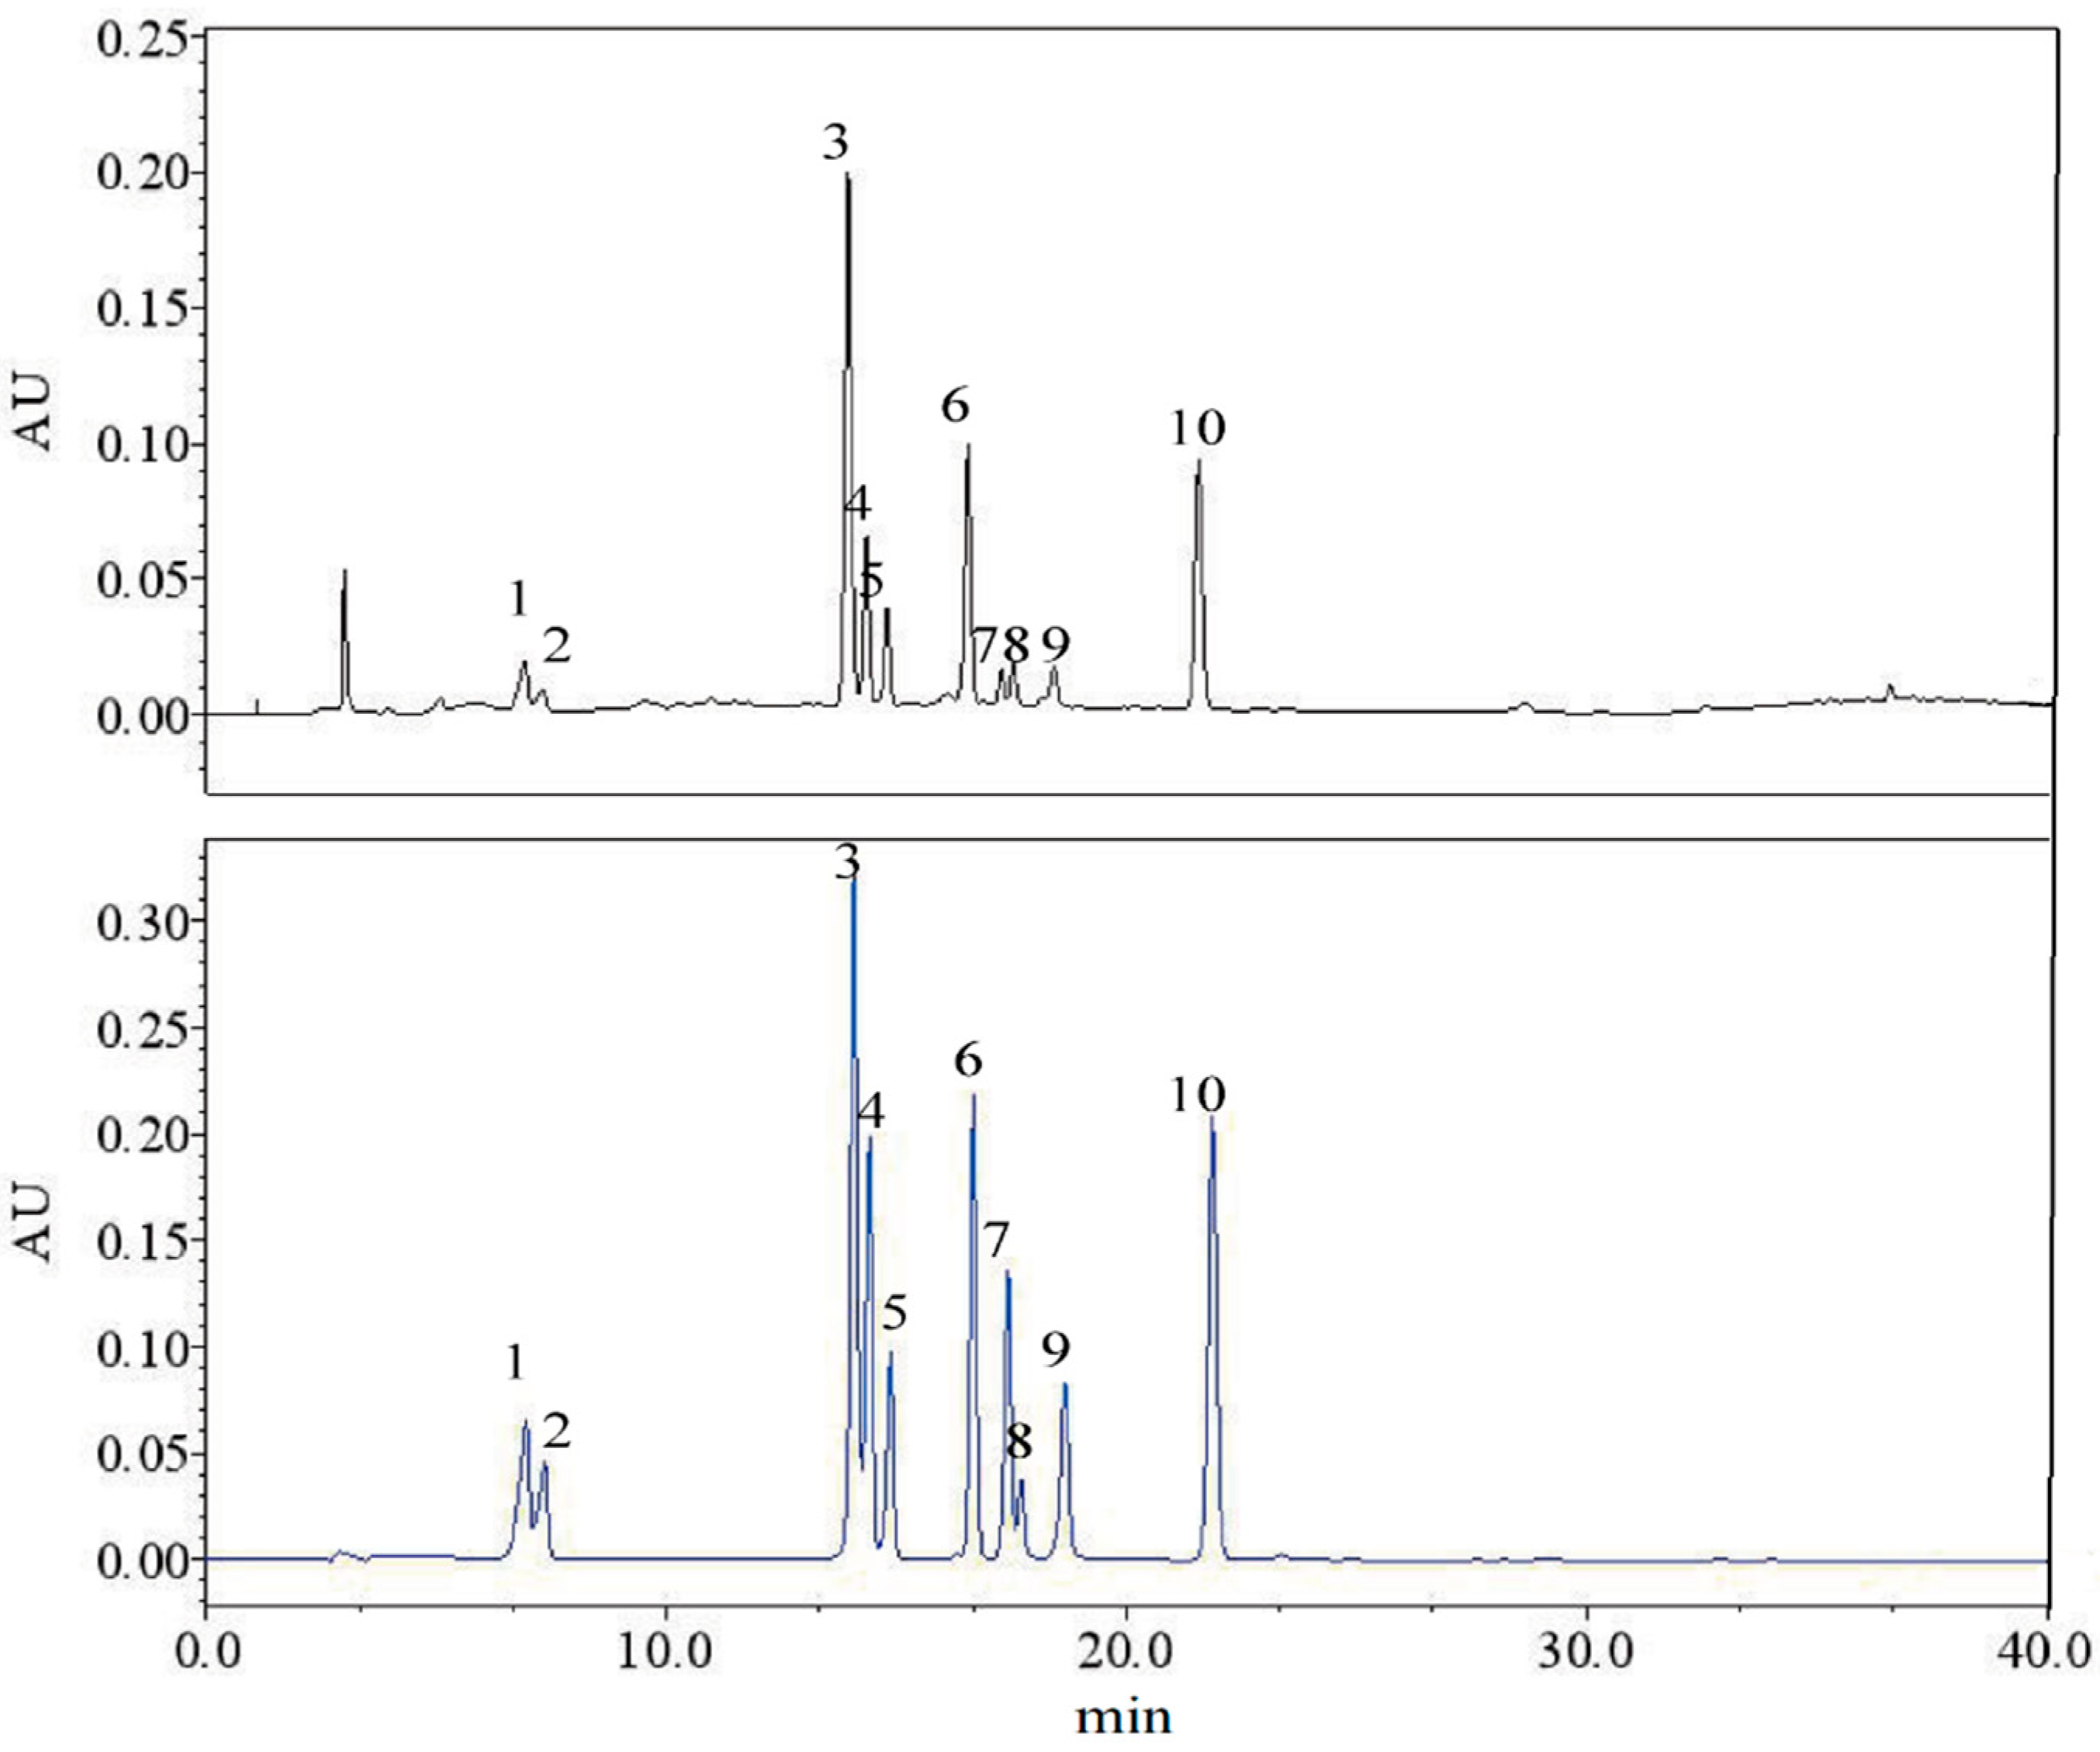
2.5. HPLC Determination of Phenolic Compounds

The quantification of the individual phenolic compounds of C. paliurus was performed on a Waters e2695 Alliance High Performance Liquid Chromatography (HPLC) system (Waters Crop., Milford, MA, USA), consisting of a Waters 2695 separation unit (a quaternary pump solvent management system, an autosampler, an online degasser, a column heater and a gasket cleaning system), an ultraviolet detector (Waters 2489) and an Empower 3 data processing system. The quantification of the individual phenolic compounds was achieved on a reversed-phase X-Bridge C18 column (250 × 4.6 mm internal diameter, 5 μm particle size) with flow rate of 1.0 mL/min and the column was operated at 45 °C. The detection wavelength was kept at 360 nm and the injection volume was 10.0 μL.
The mobile phases were (A) acetonitrile with 0.01% formic acid and (B) water with 0.01% formic acid. For the analysis of phenolic compounds, a gradient elution protocol as follows was used: 8%–19% A at 0–13 min, 19%–21% A at 13–28 min, 21%–50% A at 28–40 min, and re-equilibration over 10 min to the initial composition. Contents of individual phenolics were quantified from their external standards. The representative chromatograms of a sample of C. paliurus and mixed standards of phenolic compounds are presented in Figure 1.

2.6. Measurement of Antioxidant Activities

Leaves collected from family 4# monthly were used as a representative sample to determine the seasonal variation of antioxidant activity of C. paliurus leaf extracts. Additionally, in order to assess to what extent these detected phenolics contribute to the antioxidative effectiveness of the leaf extracts; antioxidant activities were performed on each individual phenolic compound. For this purpose, pure standard molecules were used. For antioxidant activity assay, all determinations were carried out in triplicate.

2.6.1. DPPH Radical Scavenging Activity

The DPPH radical scavenging capacities of C. paliurus leaf extracts and phenolic individuals were determined by using a colorimetric method according to a previous study with slight modification [24]. Briefly, 100 μL of the extracts 70% ethanol solution and phenolic individuals with gradient concentrations were mixed with ethanol (1.4 mL), respectively. Then all the mixtures were added to 0.004% DPPH (1 mL, Sigma-Aldrich) in ethanol. The mixtures were shaken vigorously and left to stand in the dark at room temperature for 30 min, and then the reduction of DPPH radical was evaluated spectrophotometrically by monitoring the decrease in absorbance at 517 nm against a blank of pure ethanol. The DPPH radical scavenging activities of each sample were calculated as the percent inhibition according to the following equation: DPPH radical scavenging (%) = ((A0 − A1)/A0) × 100, where A0 was the absorbance of the DPPH solution without the sample and A1 was the absorbance of the tested samples.
Finally, the data obtained from above experiments were used to establish calibration curves and to calculate the IC50 values (μg/mL), which were defined as the concentration of the test material producing 50% reduction of the DPPH free radical. IC50 was used as an index to compare the antioxidant activity of individuals.

2.6.2. Ferric Reducing Antioxidant Power (FRAP)

The assay was performed according to the instruction by Beyotime Institute of Biotechnology. Stock solutions included detective buffer, TPTZ (2,4,6-tripyridyl-s-triazine) solution, TPTZ dilution, 0.5 mL 10 mM FeSO4 solution and 0.1 mL 10 mM Trolox solution. A working solution was prepared freshly by mixing TPTZ dilution, detective buffer, and TPTZ solution in a ratio of 10:1:1 (v/v), respectively. The working solution was warmed to 37 °C before use. A sample (5 μL) was mixed with 180 μL of FRAP working solution and kept for 5 min at 37 °C. The absorbance of the reaction mixture was then monitored at 593 nm. Trolox, a water-soluble analogue of vitamin E, was used as the reference compound to prepare a calibration curve for a concentration range of 0.15–1.5 mM. Results were expressed as trolox equivalent antioxidant capacity (TEAC), which was defined as the mmol of trolox whose antioxidant activity is equivalent to the activity of 1 g of extracts. Higher TEAC values demonstrate higher antioxidant activity.

2.6.3. ABTS Radical Cation Scavenging Activity

The total antioxidant capacity of each sample was determined by a total antioxidant capacity assay kit with the ABTS method (Beyotime Institute of Biotechnology, Shanghai, China). ABTS assay is based on the inhibition by antioxidants of the absorbance of ABTS+ and this inhibition depends on the antioxidant capacity of the tested sample. The stock solutions included ABTS solution and oxidant solution. The working solution was prepared by mixing the two stock solutions at a ratio of 1:1 (v/v), and the mixture was incubated in the dark at room temperature for 12 to 16 h before use. The resulting ABTS+ solution was then diluted with 80% ethanol to obtain an absorbance value of 0.70 ± 0.05 at 734 nm. A fresh ABTS+ solution was prepared for each assay. Plant extracts or phenolic individuals (10 μL) were mixed with 200 μL of the diluted ABTS+ solution for 6 min in the dark at room temperature. Then the absorbance of the mixture was recorded at 734 nm. The ABTS radical scavenging activity of the sample was calculated as follows: ABTS radical scavenging (%) = ((A0 − A1)/A0) × 100, where A0 is the absorbance of the control (ABTS solution without test sample) and A1 is the absorbance in the presence of the test sample. Trolox was used as the reference compound to prepare a calibration curve for a concentration range of 0.15 to 1.5 mM. Results were expressed as trolox equivalent antioxidant capacity (TEAC), too. Higher TEAC values demonstrate higher antioxidant activity.

2.7. Data Analysis

Data are expressed as the mean ± standard deviation (SD) of samples of the ten families. All statistical was performed using the SPSS 19.0 statistical software program (SPSS Inc., Chicago, IL, USA). A one-way analysis of variance (ANOVA) was conducted to compare the contents of phenolics in C. paliurus leaves collected monthly, followed by Duncan’s multiple-range test. Different superscripts within columns represent significant differences at p < 0.05. Pearson correlation coefficient was used to reflect relationship between contents of phenolics and antioxidant activities.
Contents of total phenolic acids (TPA), total quercetin glycoside (TQ), total kaempferol glycosides (TK), and total flavonoids (TF) were calculated as the sums of their corresponding individuals.

3. Results

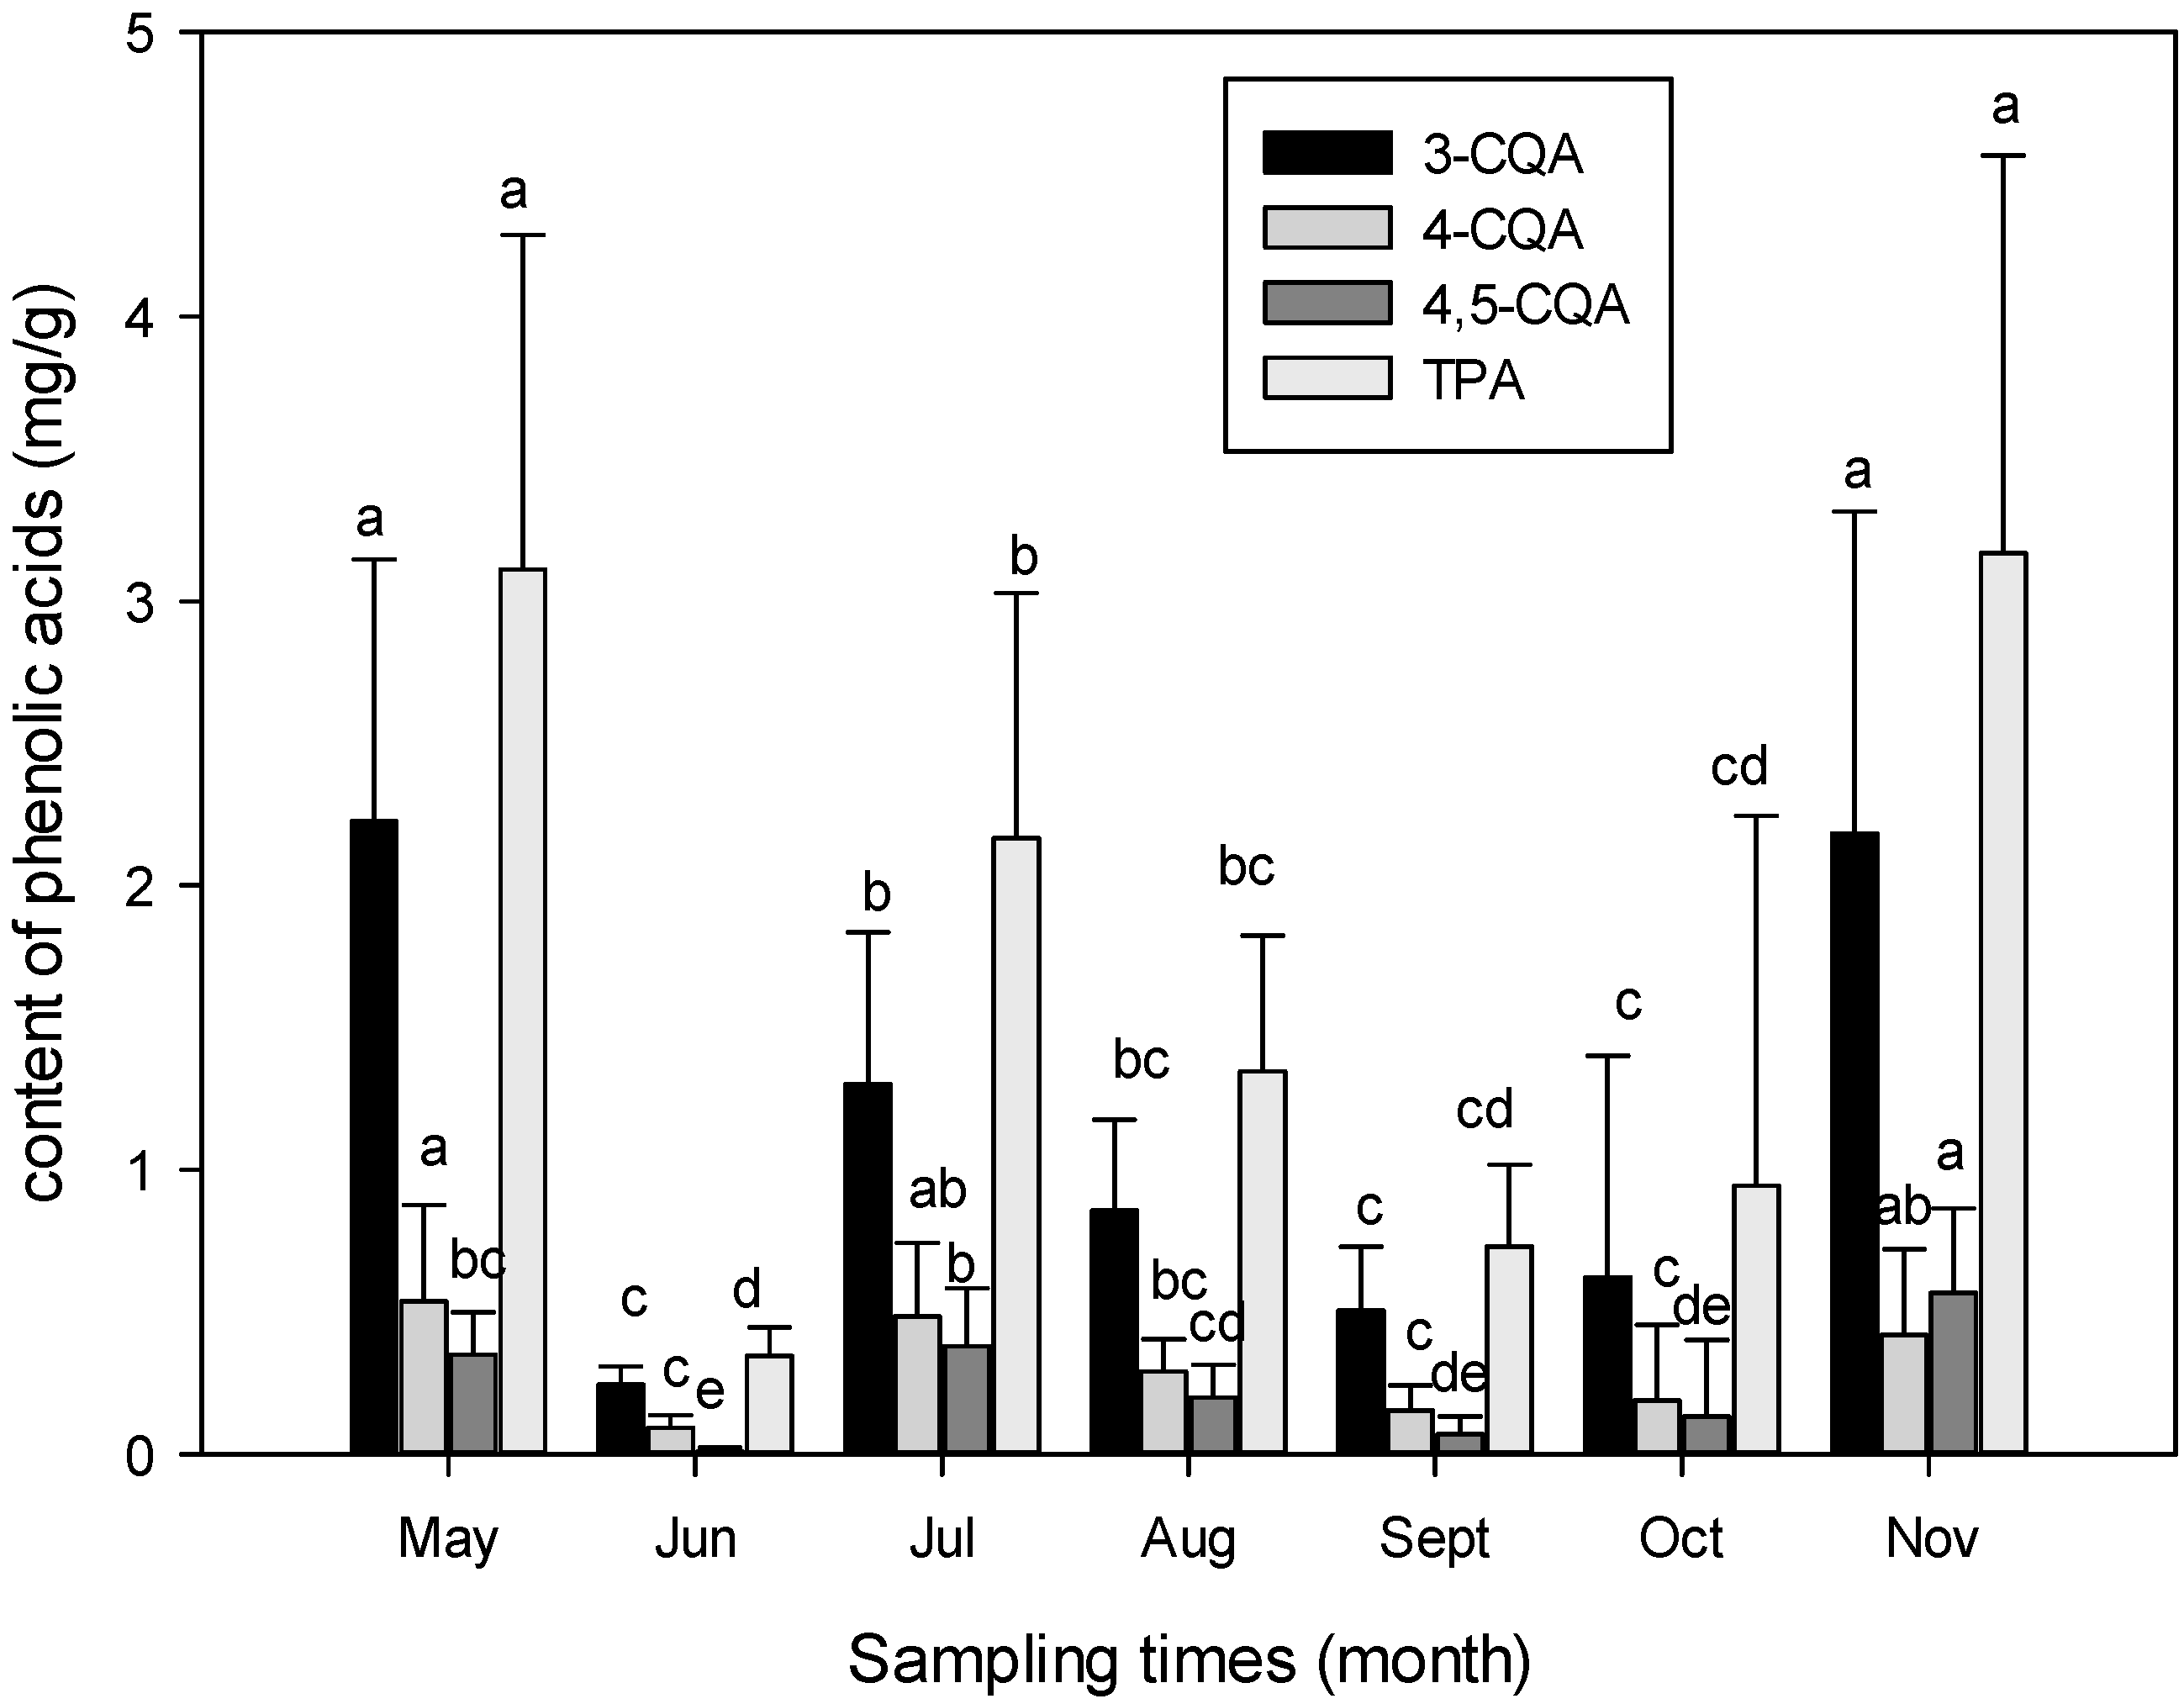
3.1. Seasonal Variation of Phenolic Acids Contents

The seasonal fluctuation patterns of phenolic acids content were almost synchronous among the 10 families we investigated. Therefore, the seasonal dynamics of leaf phenolic acids contents in C. paliurus are presented as the means of ten families and are given in Figure 2. The results revealed that the accumulation of phenolic acids in leaves of C. paliurus was significantly affected by the sampling time. 3-O-caffeoylquinic acid (3-CQA) was always the major phenolic acid during the whole growth period, and the content of 4-O-caffeoylquinic acid (4-CQA) was always higher than the content of 4,5-di-O-caffeoylquinic acid (4,5-CQA), except that of November.
The 3-CQA contents showed a clear seasonal variation, ranging from 0.24 to 2.22 mg/g. The highest content of 3-CQA was measured in November, followed by July, while the lowest one was monitored in June and September. 4-CQA exhibited generally similar seasonal variation patterns as that of 3-CQA. The highest content of 4-CQA was found in May, up to 0.54 mg/g, followed by July and November, while the lowest one was measured in June, which was less than 0.10 mg/g. Among the three tested phenolic acids, 4,5-CQA levels varied most noticeably, approximately 64-fold. The highest content of 4,5-CQA was recorded in November, reaching 0.57 mg/g, whereas the lowest one was detected in June with 0.009 mg/g. The contents of 4,5-CQA in May and July were in the moderate level. Moreover, the total phenolic acid (TPA) content was calculated by summing the individual phenolic acid compounds based on HPLC determination of individuals. TPA also changed considerably during the year. The highest content of TPA was found in May and November, more than 3.10 mg/g, followed by July, while the lowest one was measured in June, less than 0.35 mg/g.

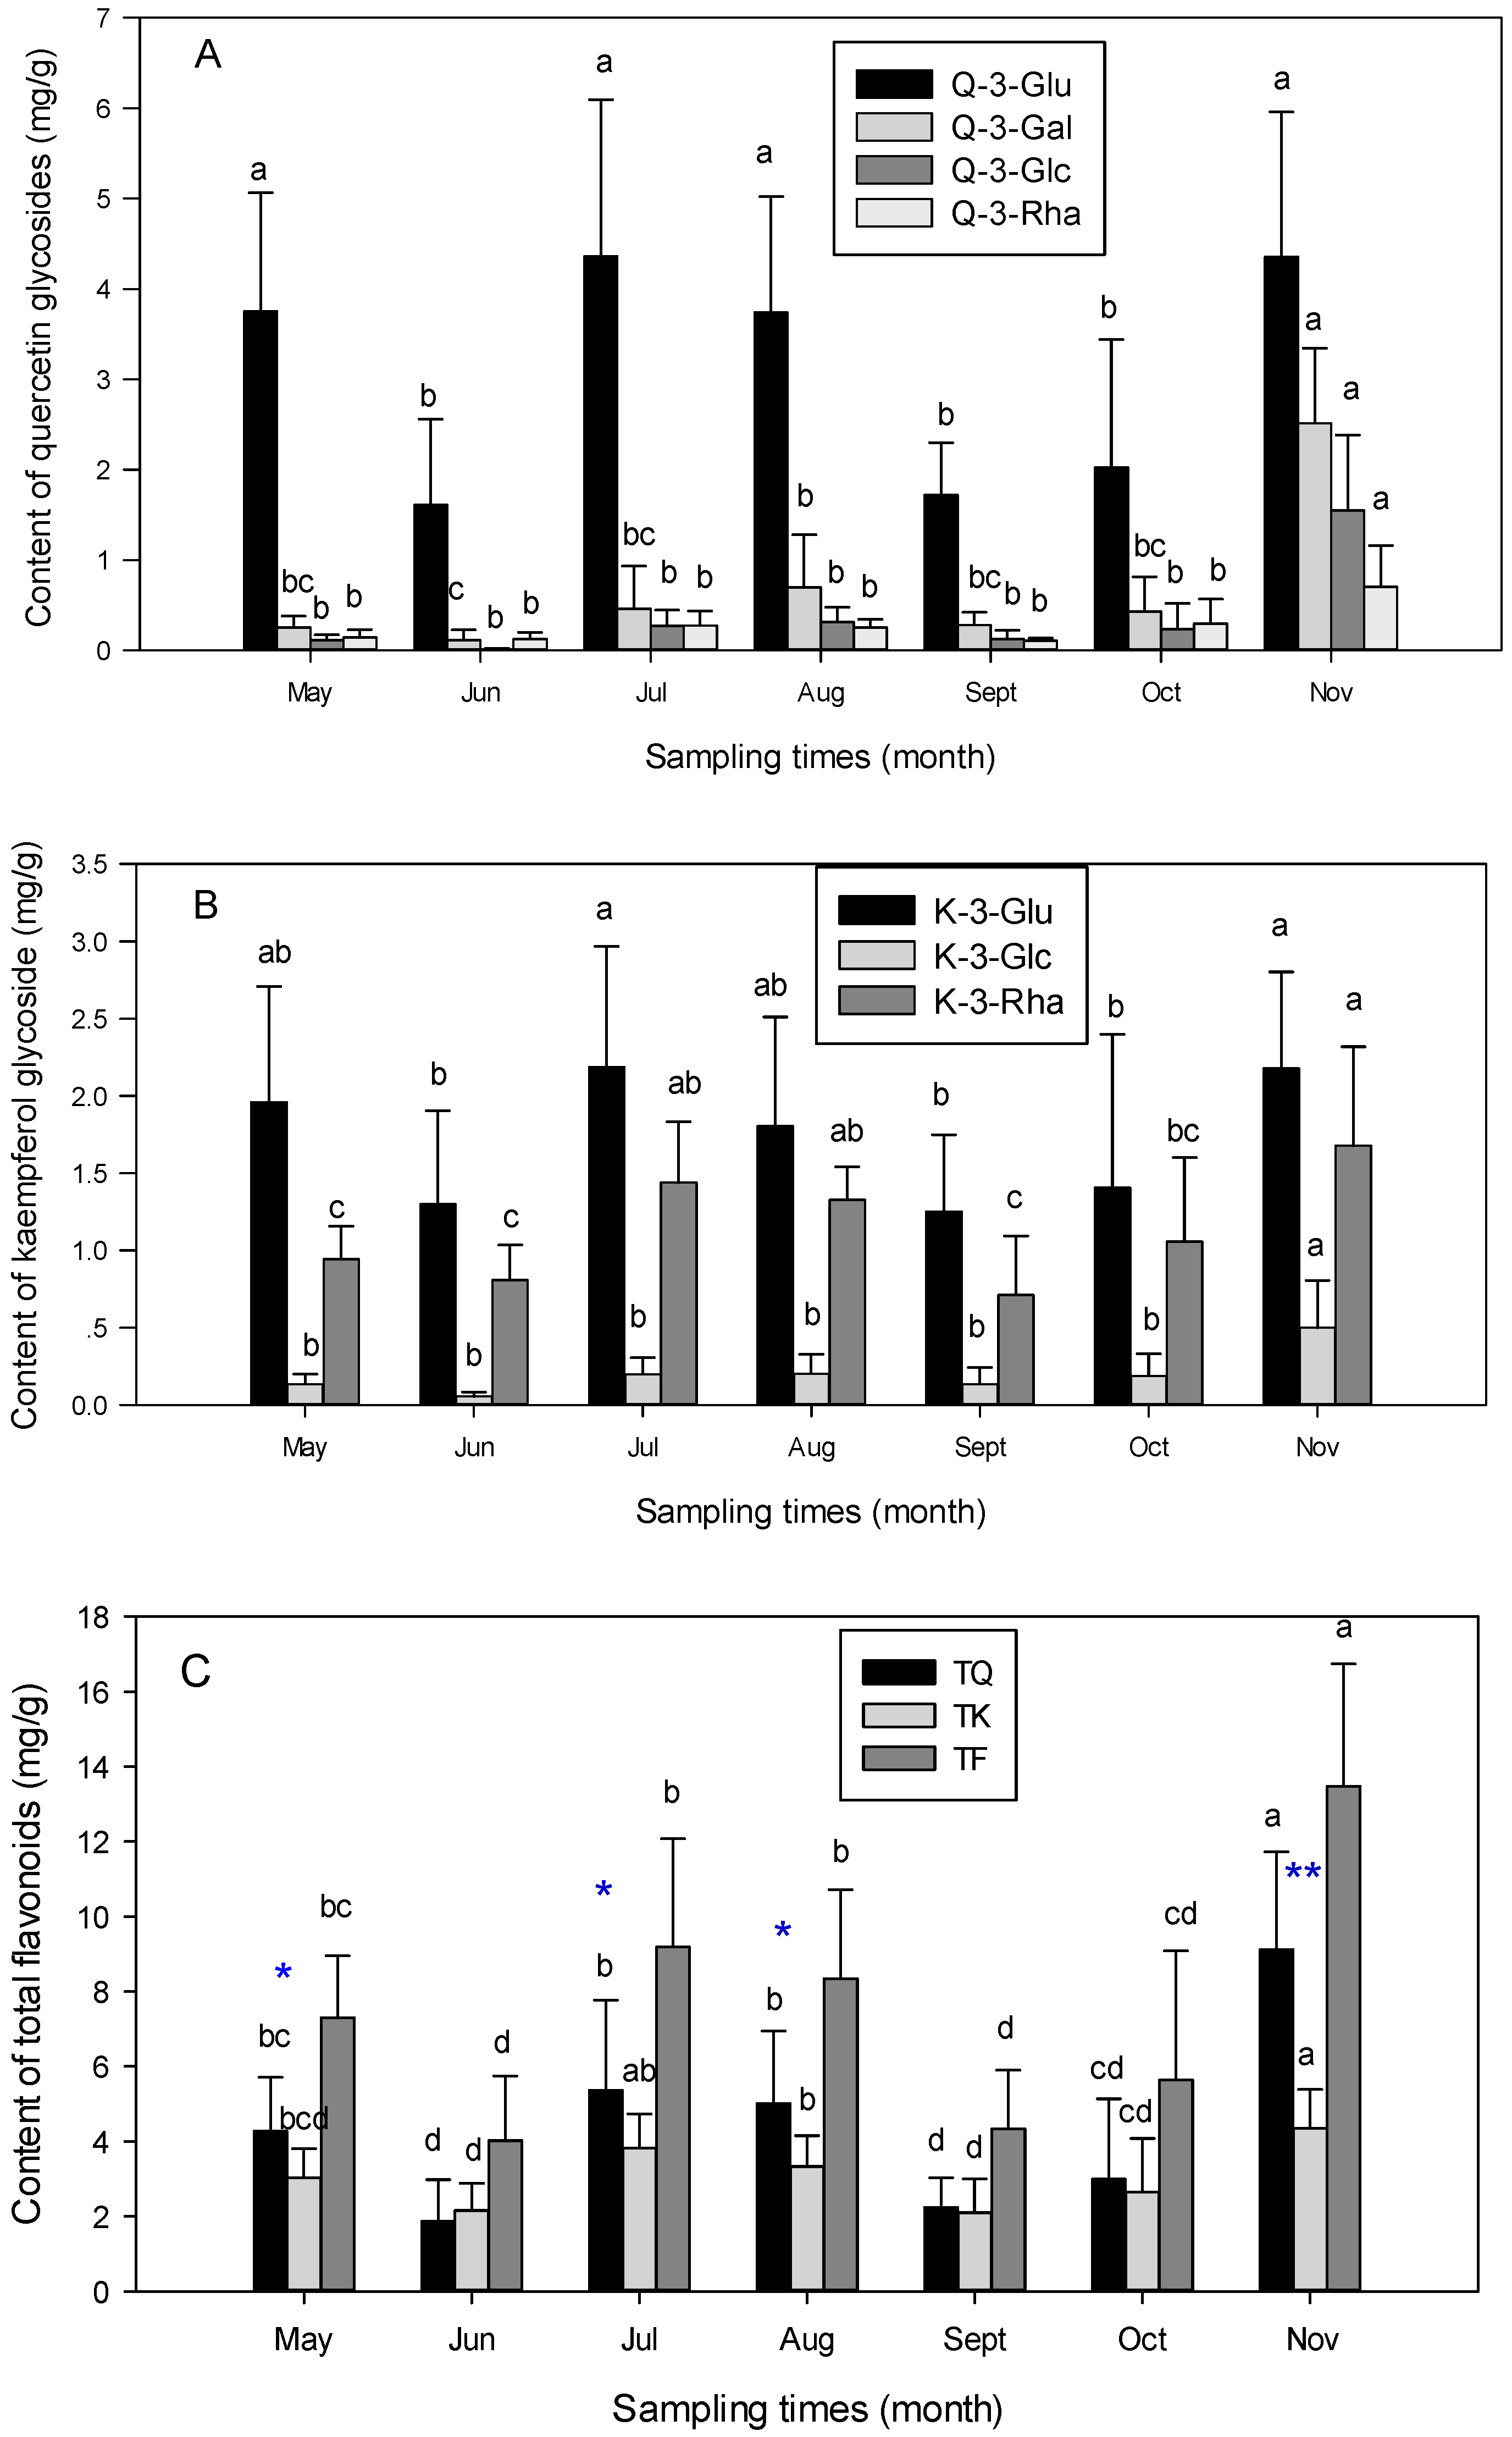
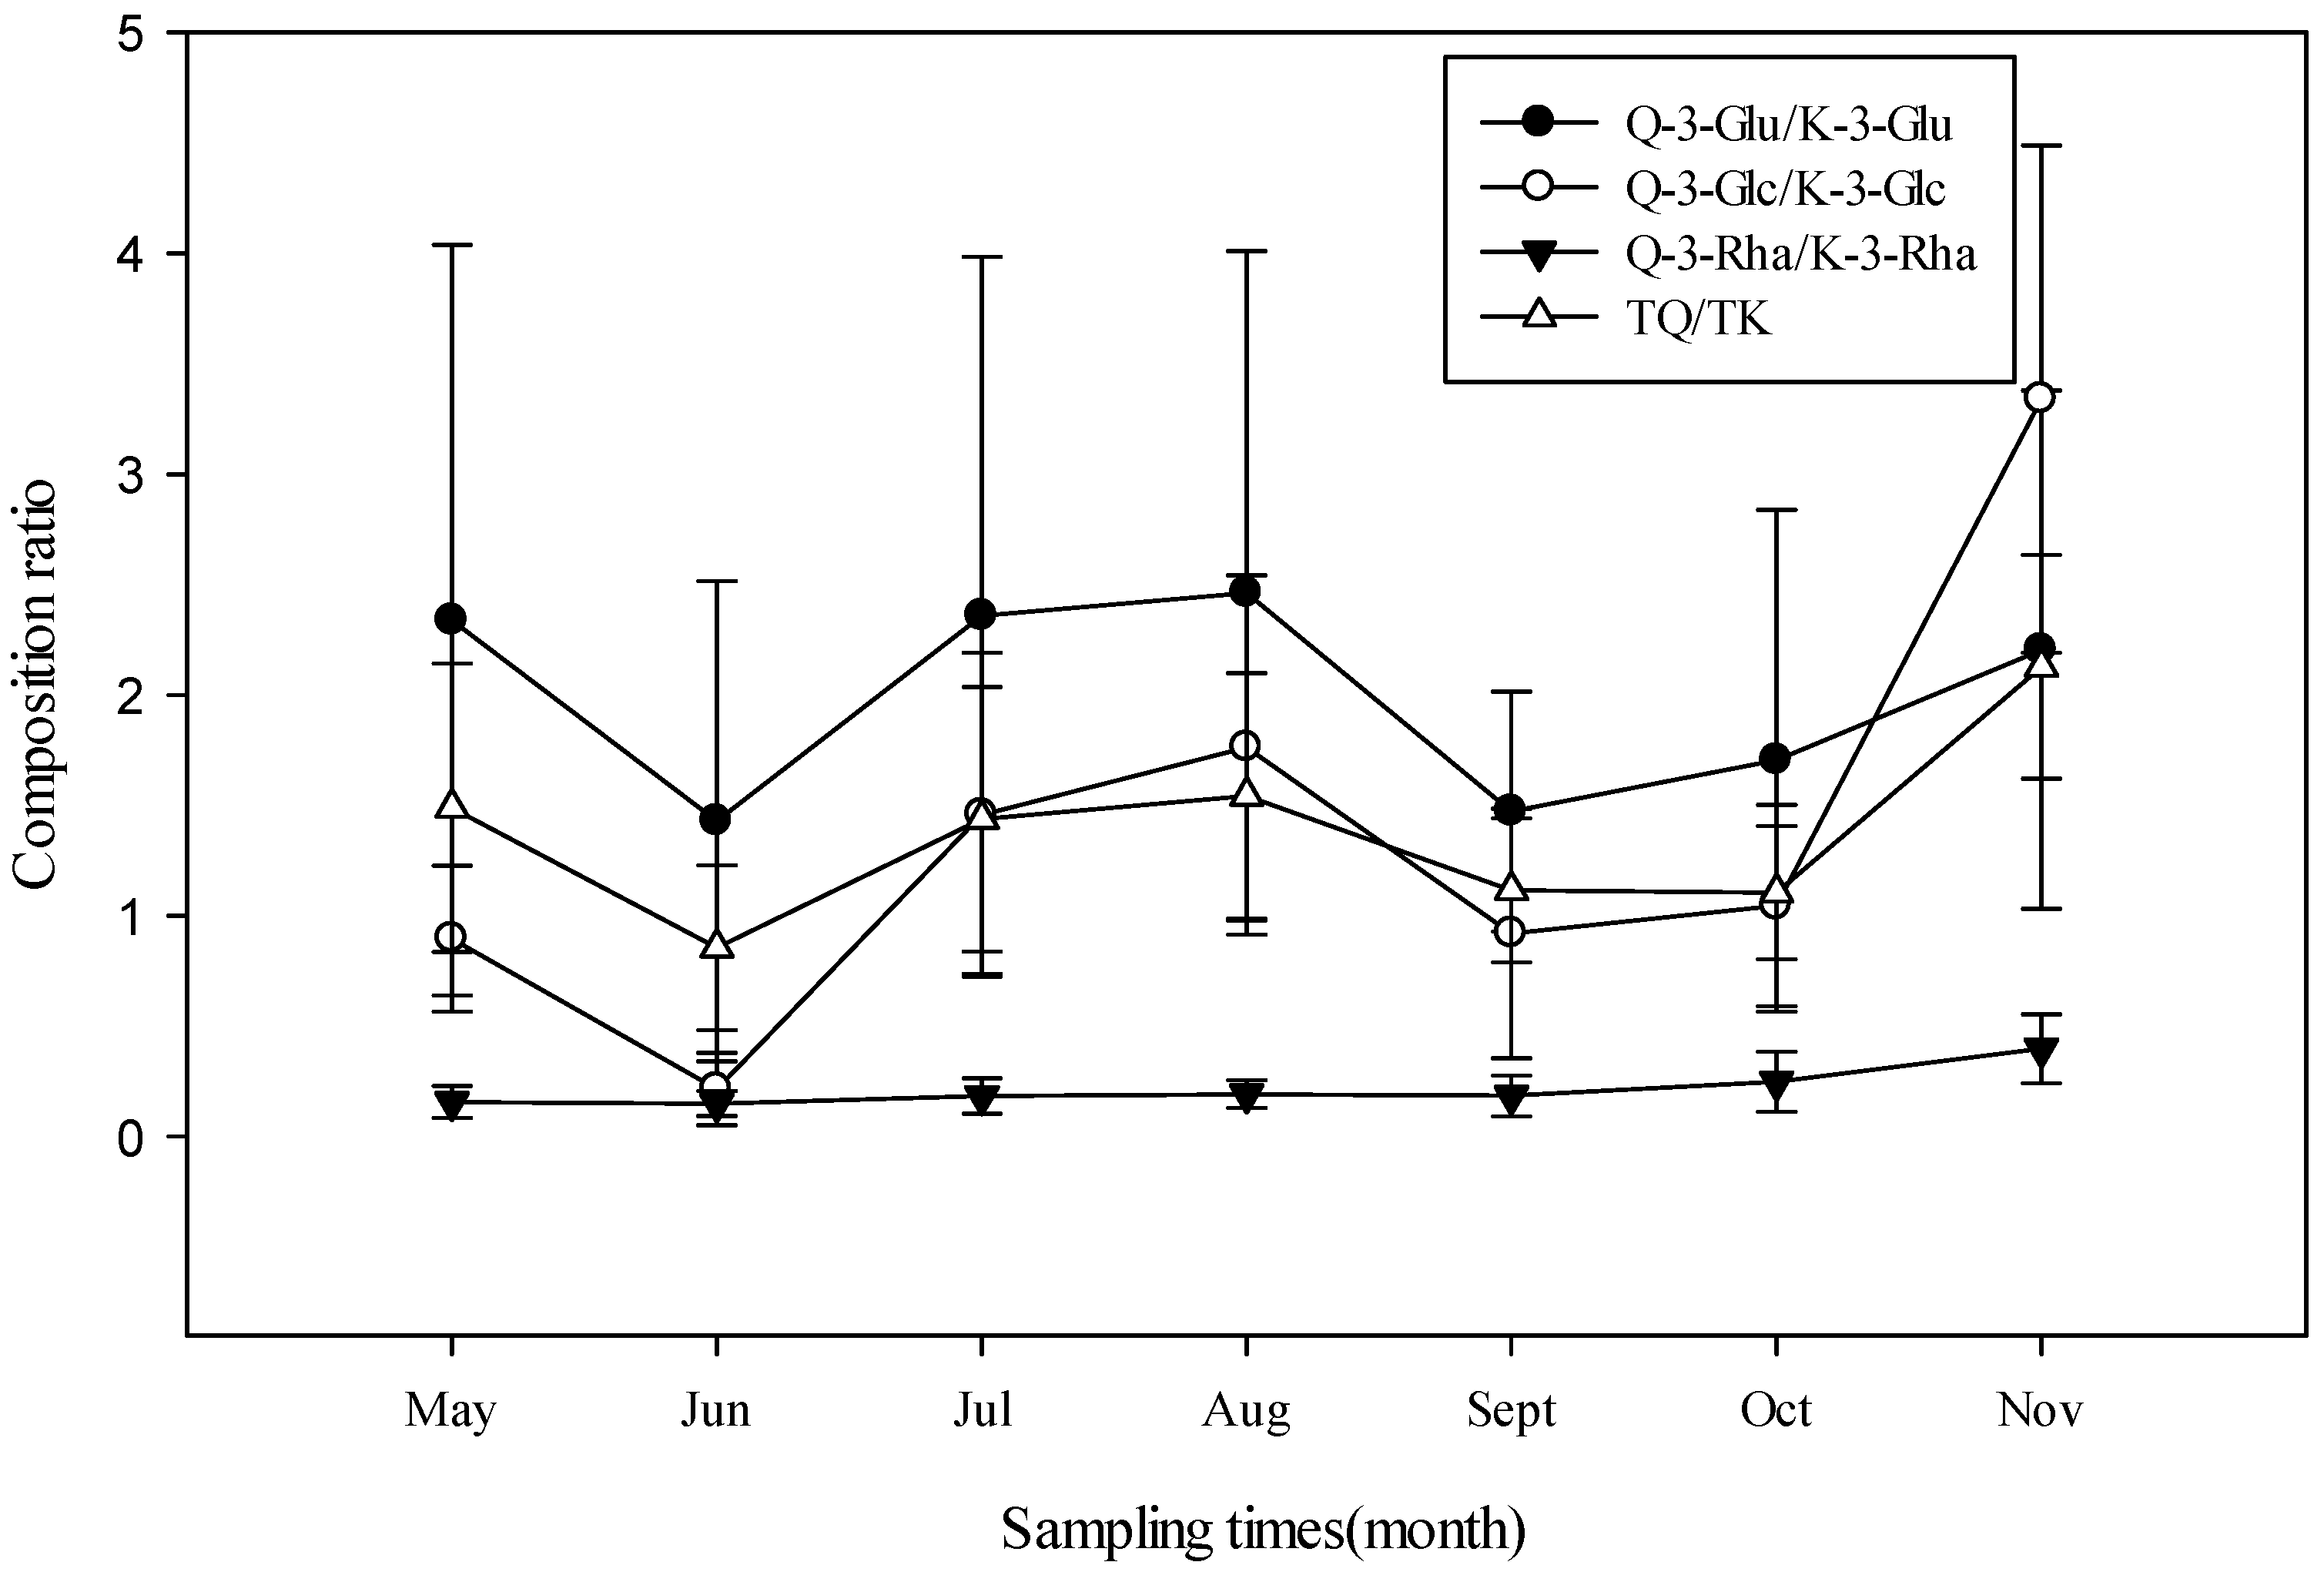
3.2. Seasonal Variation of Flavonoids Content

In general, flavonoids are present as glycosides in plants, usually conjugated with glucose. In our experiment, seven individual flavonoid compounds, namely quercetin-3-O-glucuronide (Q-3-Glu), quercetin-3-O-galactoside (Q-3-Gal), quercetin-3-O-glucoside (Q-3-Glc), quercetin-3-O-rhamnoside (Q-3-Rha), kaempferol-3-O-glucuronide (K-3-Glu), kaempferol-3-O-glucoside (K-3-Glc), and kaempferol-3-O-rhamnoside (K-3-Rha), were detected in C. paliurus leaves. The seasonal variation patterns of the investigated flavonoids were almost synchronous among the 10 sampled families. Thus, the seasonal fluctuations of leaf flavonoids content are shown in Figure 3 based on the means of the 10 families. The results of ANOVA indicated that the contents of flavonoids in C. paliurus leaves were statistically significantly influenced by seasonal progression. Q-3-Glu was considered as the major flavonoid compound and the crucial component in C. paliurus leaves, ranging from 1.61 (June) to 4.36 (July) mg/g. However, the seasonal variation of the other three quercetin glycosides in C. paliurus leaves was found to a slight difference (Figure 3). The contents of Q-3-Gal, Q-3-Glc and Q-3-Rha were at a low level until the last sampling time. Their highest contents were all achieved in November, and the lowest in June. Among the three quercetin glycosides, content of Q-3-Glc varied to a relatively large extent during the year, and its content in November was 83-fold larger compared to the content in June. For kaempferol glycosides, the contents of K-3-Glu and K-3-Rha were notably higher than that of K-3-Glc. The contents of K-3-Glu and K-3-Rha were at a high level in July, August and November. Compared to K-3-Glu and K-3-Rha contents, the content of K-3-Glc showed a relatively large extent variation throughout the growing period, ranging from 0.05 (June) to 0.5 (November) mg/g.
The total content of the four quercetin glycosides determined in this study was defined as TQ. Similarly, TK was defined as the total content of the three kaempferol glycosides investigated. Therefore, the total content of all the flavonoid individuals measured in this study was defined as TF. As shown in Figure 3C, contents of TQ, TK, and TF in November were the highest, and the lowest contents were detected in June and September. Interestingly, the content of TQ was always higher than TK during the seasonal progression except for June, and the difference was statistically significant in May, July, August, and November.

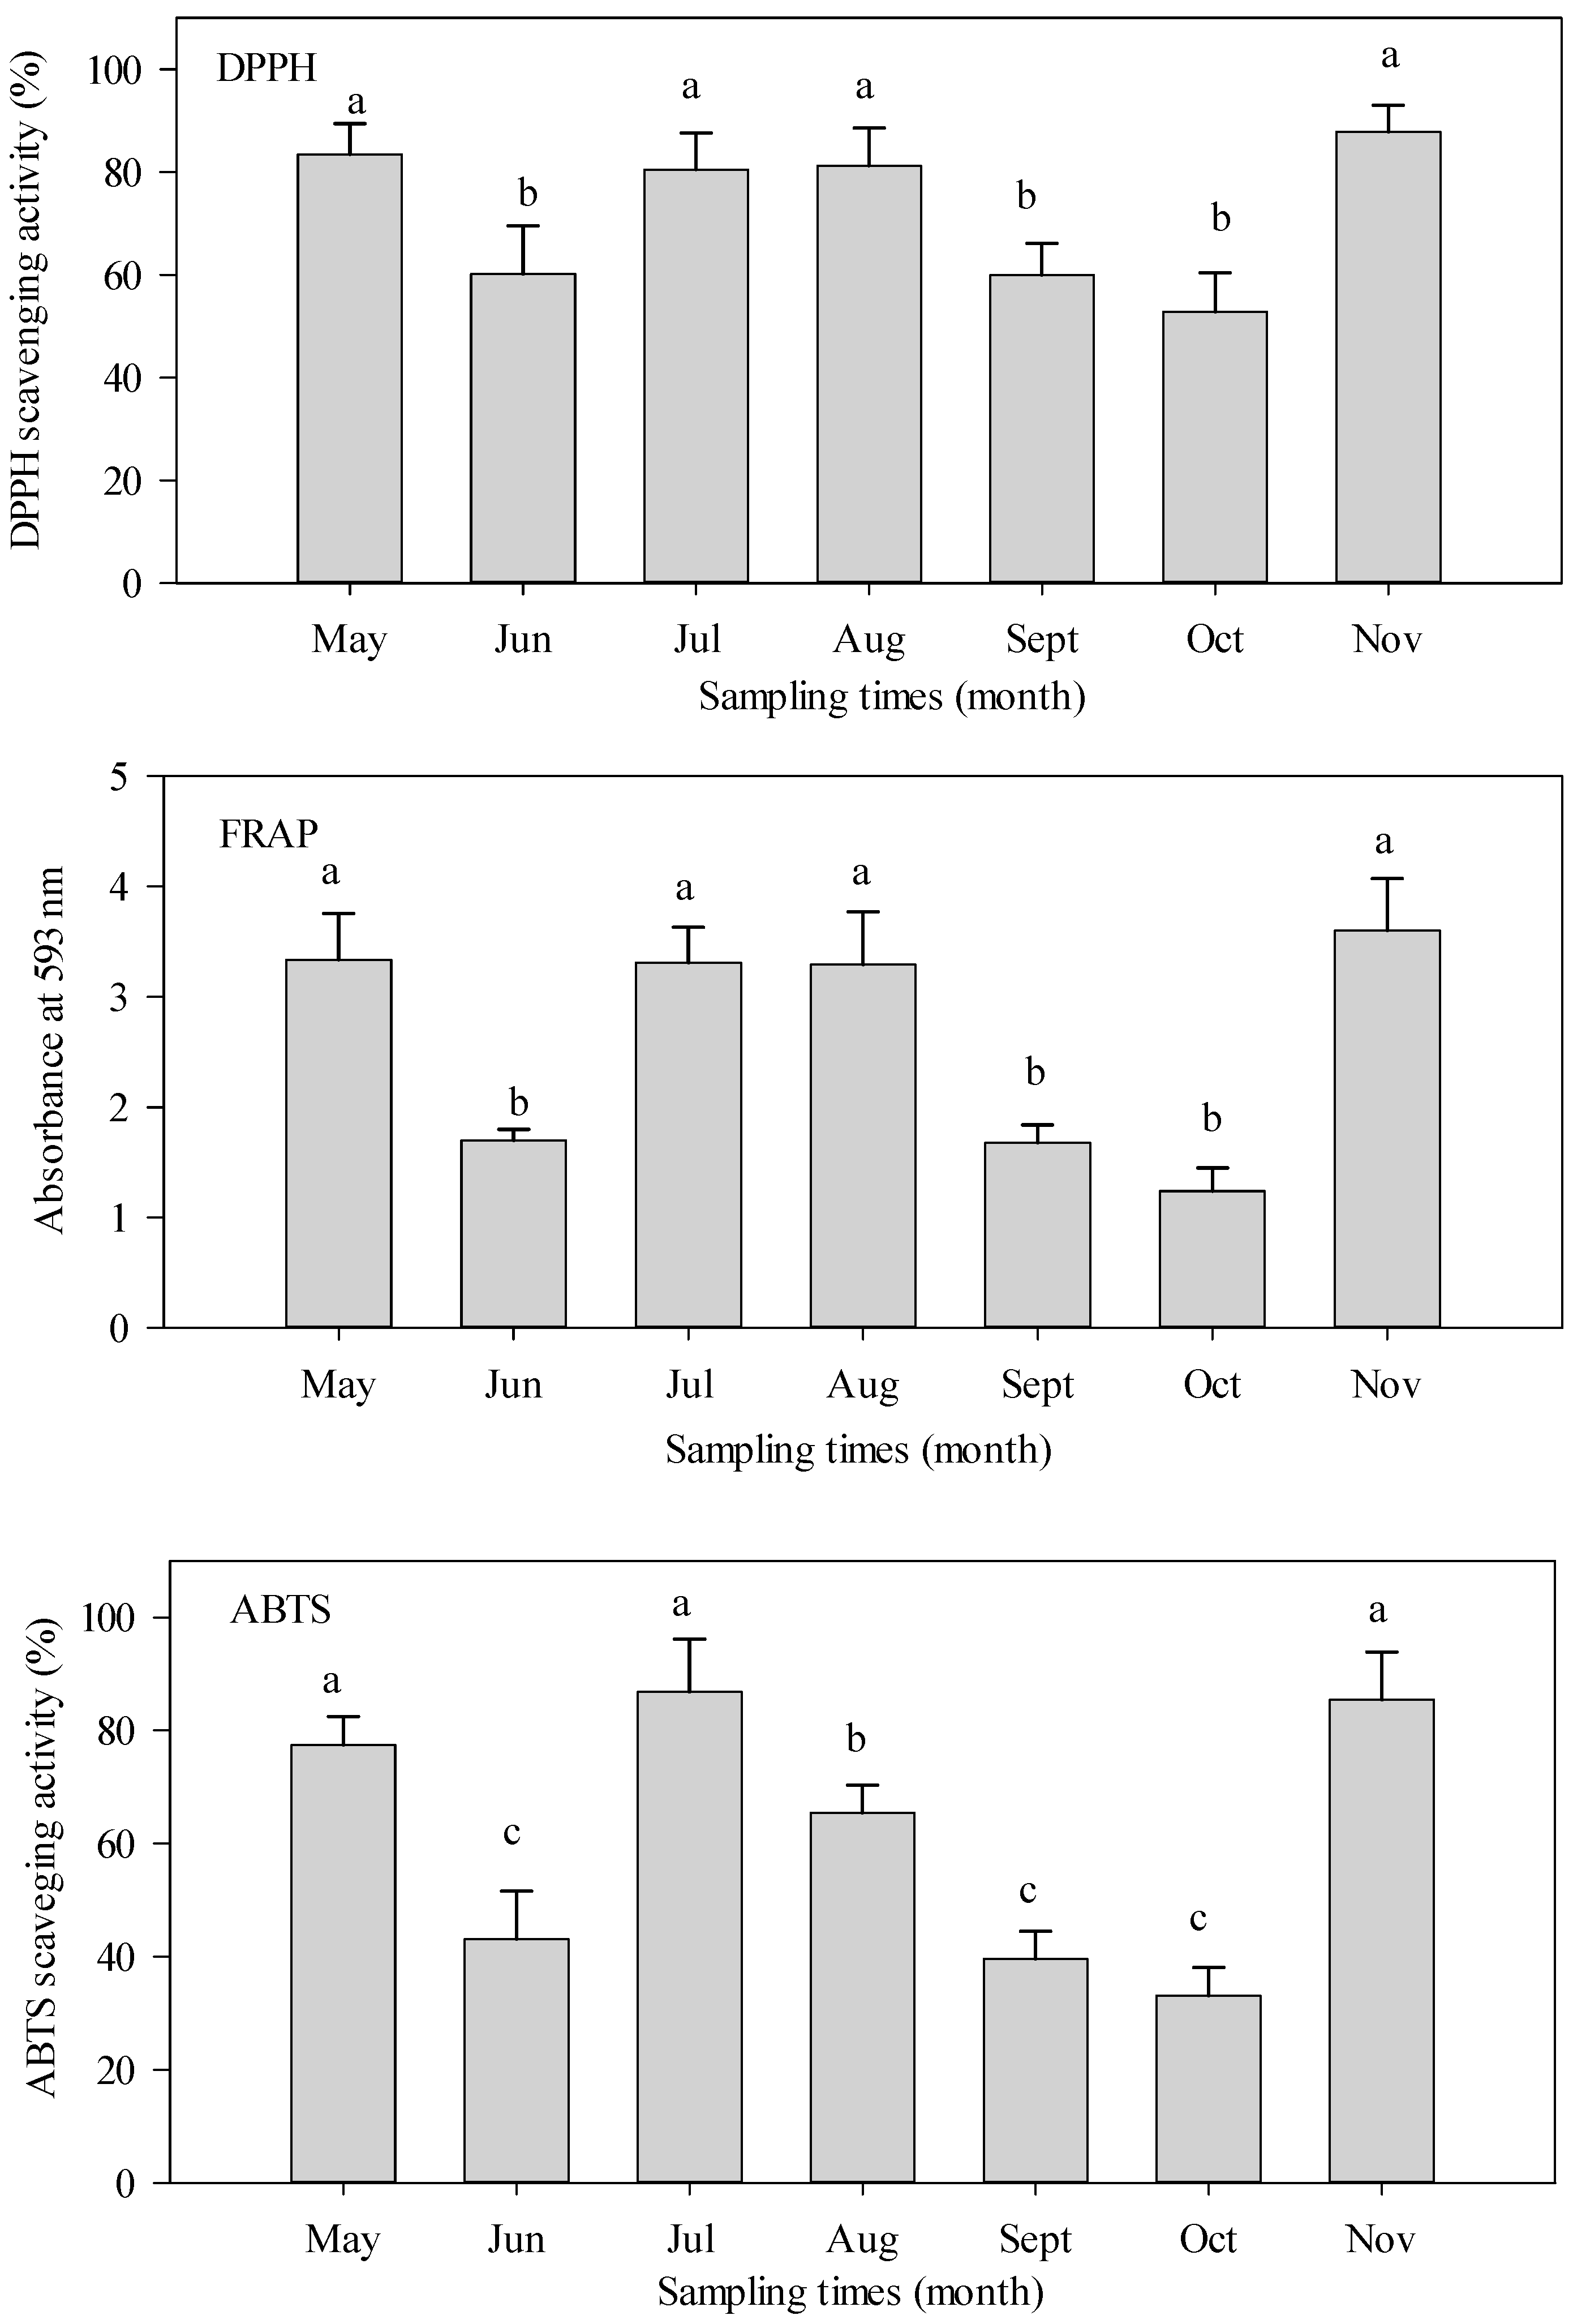
3.3. Seasonal Variation of Antioxidant Activities

Significant seasonal fluctuations of antioxidant activities were observed in C. paliurus leaf extracts (Figure 4). Samples collected in May, July, August, and November showed good performance in the three antioxidant activities assays (DPPH, FRAP, and ABTS). Generally, these three assays showed consistent results with the seasonal variations of phenolic acids and flavonoids, as shown in Figure 2 and Figure 3. The higher antioxidant activities of the samples collected in May, July, August, and November might be attributed to higher phenolic contents at those periods.

3.4. Correlation between Contents of Phenolic Compounds and Antioxidant Activity

In order to determine the possible association between phenolic contents and antioxidant capacities of the leaf extracts, Pearson’s correlation analysis was conducted based on the results of phenolic contents and antioxidant activities we investigated at seven sampling times (Table 1 and Supplementary Materials Table S1). Strong correlations between antioxidant activities and contents of phenolic acids as well as flavonoids were observed in DPPH, FRAP, and ABTS assays. Moreover, Pearson’s correlation coefficients between antioxidant activities and total phenolic acid contents or total quercetin glycosides contents were higher than that between antioxidant activities and total kaempferol glycosides, indicating that the contribution of quercetin glycosides and phenolic acids to antioxidant activity was greater than that of kaempferol glycosides.

3.5. Effects of Individual Phenolic Compounds on Antioxidant Capacity

In order to evaluate to what extent these identified phenolic substances contribute to the antioxidative effectiveness of C. paliurus extracts, antioxidant capacity assays were performed on each individual phenolic compound by DPPH, ABTS, and FRAP methods (Table 2). It was observed that quercetin exerted the strongest antioxidant activity in DPPH radical scavenging assay with the lowest IC50 value of 0.008 mg/mL, followed by quercetin glycosides. Kaempferol and three phenolic acids also showed good DPPH radical scavenging capacity, while a striking difference between DPPH assay results of kaempferol and kaempferol-glycosides was observed, and kaempferol-glycosides were practically invisible to DPPH. Consistent results were observed in the FRAP and ABTS assays. These results indicated that quercetin and its glycosides as well as phenolic acids might be the main contributors to the antioxidant capacity for C. paliurus extracts.

4. Discussion

4.1. Effects of Environment and Development Phase on Leaf Phenolic Accumulation

Phenolic compounds distribute ubiquitously in the plants kingdom [1,2,36,37]. Many studies have reported phenolic compounds possess various biological activities [3,4,5,23,24]. For the plant itself, one of the well-known and important functions of phenolic compounds is their role in plant defense mechanisms [14,38,39]. As in the case of other plant secondary metabolites, the biosynthesis and accumulation of phenolic compounds can be greatly influenced by many endogenous and exogenous factors. The intrinsic factors contain genotype and physiological condition [15,30,33]. The exogenous factors reflect the biotic and abiotic environmental stimuli that occur during the plant growing period, including feeding of phytophagous insects or herbivorous animals, the availability of light and water, soil composition, temperature, and interaction with pathogens and parasites [13,14,15,16,39,40]. In our study, the phenolic profiles were similar in terms of chemical composition throughout the growing season in C. paliurus leaves, but they were significantly different in terms of quantity. All families we investigated presented higher values of phenolic substances in May and July. The temporal variation pattern in phenolic compounds presented here is partly in tune with the results of Amaral et al., who attributed the increase in phenolics in walnut in July to the higher solar radiation level [15]. In our previous study, the accumulation of selected flavonoids in C. paliurus was found to be stimulated under higher radiation [41]. Tsormpatsisidis et al. (2008) found the contents of total flavonoids in Lollo Rosso lettuce “Revolution” in June was lower compared to that of July, due to the higher radiation levels in July [42]. Phenolics are responsible for protecting the plants from damage caused by radiation, in particular UV-B. Accordingly, exposure to global radiation stimulated the synthesis and accumulation of these shielding compounds, such as flavonoids, especially in the epidermis of fully developed leaves [43]. It is reported that Ligustrum vulgare leaves grown under full sunlight exposure contained three-fold more polyphenols than those from the shade side of a bush [44]. Wang et al. also found that the contents of anthocyanin and flavanol in Vaccinium uliginosum berries show a growing trend with increase in altitude [45]. In leaves of bilberry (Vaccinium myrtillus) exposed to sunlight, an increasing expression of genes encoding phenylalanine ammonium lyase, chalcone synthase, and flavanone 3-β-hydroxylase was found, owing to higher level of reactive oxygen species (ROS) [46].
Reyes et al. reported that the phenolic content of potato tubers can be affected both by longer days and cooler temperature [47]. An enhancement of the total flavonoids in winter wheat was also determined at lower temperatures during cultivation [48], as we found for flavonoids in C. paliurus leaves gathered in November. Lower temperatures are related to higher concentrations of flavonoids due to the higher level of ROS [48]. Flavonoids act directly as antioxidants, as they are strong scavengers of ROS. It’s reported the mRNAs of phenylalanine ammonia lyase and chalcone synthase are enhanced or accumulated in maize seedlings and Arabidopsis thaliana at lower temperatures [49,50]. Herein, it could be concluded that cooler climate might promote the formation of flavonoids in the leaves of C. paliurus.
It is well known that plants produce ROS during normal metabolism and under various environmental stress conditions. Additionally, with ongoing plant development an increasing ROS is accompanied by physiological aging [51]. There is increasing evidence that phenolic compounds may act as antioxidants under certain physiological conditions and, thereby, protect plants against oxidative stress [52]. Camptothecin contents in Camptotheca acuminata leaves exhibited a decreasing trend as leaves age as well as seasonal progression [53]. Both concentration and composition of secondary metabolites are usually different during tree ontogeny, and can interfere with the quality of medicinal plants [30]. In our study, the higher phenolics content in early November infers that increased phenolic accumulation is likely in senescent leaves of C. paliurus.
Previous studies have demonstrated that primary and secondary metabolisms share the common precursors and intermediates, which results in competition for common substrates in the processes of phenolic biosynthesis and growth [54,55,56]. Ma et al. found the quercetin contents decreased significantly in the leaves of both Apocynum venetum and Poacynum hendersonii after flowering, because a considerable amount of photosynthates flows into reproductive organs when plants come into reproductive growth [57]. Amaral et al. also indicated the association between the decline of phenolic content in the walnut leaves in June and the rapid development of the fruits at the time, because most of the nutrients and photosynthetic products are employed in fruit growth [40]. In C. paliurus, reduced accumulation of phenolics in June implies that higher quantities of photoassimilates are allocated for vegetative growth and reproductive growth. Taken the growth of C. paliurus into consideration, the collection of C. paliurus leaves should be performed in early November when the weather began to turn cold.
The contents of Q-3-Glu, Q-3-Glc, Q-3-Rha, K-3-Glu, K-3-Glc, and K-3-Rha have already been described in C. paliurus leaves, but no information is published about their ratios. In the current study, we investigated seasonal changes of ratios of Q-3-Glu/K-3-Glu, Q-3-Glc/K-3-Glc, and Q-3-Rha/K-3-Rha. As shown in Figure 5, the ratios of Q-3-Glu/K-3-Glu, Q-3-Glc/K-3-Glc, and Q-3-Rha/K-3-Rha ranged from 1.43 to 2.46, 0.22 to 3.34, 0.15 and 0.40, respectively, demonstrating a wider range of seasonal variation with exception of Q-3-Rha/K-3-Rha. These results revealed that the flavonoid composition ratios in C. paliurus leaves were markedly affected by environmental factors, even if the detailed mechanisms affecting this are not very clear. The value of Q-3-Glu/K-3-Glu was always more than 1.0 during the whole growing season, indicating that Q-3-Glu became the predominant flavonoid accompanied with changed environment. It is reported that a more pronounced increase of quercetin glycosides than that of kaempferol glycosides was induced by ultraviolet light [58]. Schmidt et al. also found the responding of quercetin and kaempferol to radiation was different, and quercetin may be more sensitive to the variation of environmental factors, as shown in the present studies, but the detailed mechanisms are not very clear [59].

4.2. Relationship between Phenolic Composition and Antioxidant Capacity

As an ingredient of dietary or traditional medicine, both flavonoids and phenolic acids possess high antioxidant capacities and hence protect humans against free radical-induced diseases [59,60]. In C. paliurus, flavonoids are generally present as quercetin glycosides and kaempferol glycosides, while the aglycones of quercetin and kaempferol are found in quantitatively non-detectable traces [25]. Our results found the antioxidant activity of flavonoids glycosides was dramatically reduced compared to its aglycone (Table 2). Furthermore, a positive correlation between antioxidant activity and contents of phenolic acids as well as flavonoids was observed in DPPH, FRAP, and ABTS assays (Table 1). Our result was in accordance with the recent publications, which suggested the higher the phenolic content, the stronger the antioxidant activity [61,62]. Therefore, the C. paliurus leaves with the high content of phenolic compounds showed a great potential as a natural source of antioxidant for health promotion.
The different antioxidant capacity presented by phenolic compounds is closely related to their chemical structures in regard to the number and location of phenolic hydroxyl groups [63]. The flavonoids are a series of compounds consisting of a backbone with two benzene rings linked by a pyran chain (C6-C3-C6) (Figure 6). It is well-known that hydroxyl substitution is essential for the antioxidant activity of a flavonoid [64]. Generally, compounds with more hydroxyl substitutions on the B ring might show stronger antioxidant activity [65]. Accordingly, quercetin with a 3′,4′-catechol substitution in the B ring revealed more effective radical scavenging capacity than kaempferol that has a single 4′-hydroxy in the B ring (Table 2). However, flavonoids are generally present as glycosides in plants, whereas glycosylated flavonoids were found have lower antioxidant capacity than their corresponding aglycones, which was conformable to our result [64,66]. In addition, there were likely synergistic interactions among the phenolics in C. paliurus leaves that contribute to its excellent antioxidant capacity, but further research is needed to illuminate the synergistic effects of phenolics in C. paliurus leaf extracts.

5. Conclusions

In conclusion, our results clearly demonstrated that there existed higher content of phenolics in leaves of C. paliurus, and relatively higher antioxidant activities were observed in C. paliurus leaf extract. Both phenolic concentrations and antioxidant activities in the C. paliurus extracts showed a significant seasonal variation, and variation patterns were similar. The contents of phenolic compounds in C. paliurus leaf extract were strongly correlated with antioxidant activities, indicating that extracts with higher phenolic contents had higher antioxidant activities. Moreover, the antioxidant capacity of phenolics is dependent upon the arrangement of functional group on the nuclear structure. Overall, harvest season significantly impacts the contents of phenolics in the leaves of C. paliurus, and consequently affects the antioxidant activity. Based on the results, we suggest early November is the optimal time to harvest C. paliurus leaves. As a potential source of natural antioxidants, C. paliurus could be very useful supplements for pharmaceutical products and functional food ingredients in both nutraceutical and food industries.

Supplementary Materials

The following are available online at https://www.mdpi.com/1999-4907/10/8/624/s1, Table S1: Pearson correlation coefficients between contents of individual phenolics in C. paliurus leaves and antioxidant activities of C. paliurus leaf extracts (n = 21).

Author Contributions

S.F. and X.F. conceived and designed the experiments; X.S. and W.Y. collected the leaf samples; Y.C. performed the experiments, analyzed the data, and wrote the manuscript. S.F. revised the manuscript.

Funding

This work was funded by the National Natural Science Foundation of China (No. 31470637) and the Priority Academic Program Development of Jiangsu Higher Education Institutions (PAPD).

Conflicts of Interest

The authors declare no conflict of interest.

References

  1. Del Rio, D.; Rodriguez-Mateos, A.; Spencer, J.P.E.; Tognolini, M.; Borges, G.; Crozier, A. Dietary (poly) phenolics in human health: Structures, bioavailability, and evidence of protective effects against chronic diseases. Antioxid. Redox Signal. 2013, 18, 1818–1892. [Google Scholar] [CrossRef] [PubMed]
  2. Crozier, A.; Jaganath, I.B.; Clifford, M.N. Dietary phenolics: Chemistry, bioavailability and effects on health. Nat. Prod. Rep. 2009, 26, 1001–1043. [Google Scholar] [CrossRef] [PubMed]
  3. Cicerale, S.; Lucas, L.J.; Keast, R.S.J. Antimicrobial, antioxidant and anti-inflammatory phenolic activities in extra virgin olive oil. Curr. Opin. Biotechnol. 2012, 23, 129–135. [Google Scholar] [CrossRef] [PubMed]
  4. Noratto, G.D.; Bertoldi, M.C.; Krenek, K.; Talcott, S.T.; Stringheta, P.C.; Mertens-Talcott, S.U. Anticarcinogenic effects of polyphenolics from mango (Mangifera indica) varieties. J. Agric. Food Chem. 2010, 58, 4104–4112. [Google Scholar] [CrossRef] [PubMed]
  5. Yang, D.J.; Chang, Y.Y.; Hsu, C.L.; Liu, C.W.; Lin, Y.L.; Lin, Y.H.; Liu, K.C.; Chen, Y.C. Antiobesity and hypolipidemic effects of polyphenol-rich longan (Dimocarpus longans Lour.) flower water extract in hypercaloric-dietary rats. J. Agric. Food Chem. 2010, 58, 2020–2027. [Google Scholar] [CrossRef] [PubMed]
  6. Dillard, C.J.; German, J.B. Phytochemicals: nutraceuticals and human health. J. Sci. Food Agric. 2000, 80, 1744–1756. [Google Scholar] [CrossRef]
  7. Su, L.; Yin, J.J.; Charles, D.; Zhou, K.; Moore, J.; Yu, L. Total phenolic contents, chelating capacities, and radical-scavenging properties of black peppercorn, nutmeg, rosehip, cinnamon and oregano leaf. Food Chem. 2007, 100, 990–997. [Google Scholar] [CrossRef]
  8. Pereira, D.M.; Valentão, P.; Pereira, J.A.; Andrade, P.B. Phenolics: From chemistry to biology. Molecules 2009, 14, 2202–2211. [Google Scholar] [CrossRef]
  9. Parr, A.J.; Bolwell, G.P. Phenols in the plant and in man. The potential for possible nutritional enhancement of the diet by modifying the phenols content or profile. J. Sci. Food Agric. 2000, 80, 985–1012. [Google Scholar] [CrossRef]
  10. Ghosh, S.; Padilla-González, G.F.; Rangan, L. Alpinia nigra seeds: A potential source of free radical scavenger and antibacterial agent. Ind. Crops Prod. 2013, 49, 348–356. [Google Scholar] [CrossRef]
  11. Stanojević, L.; Stanković, M.; Nikolić, V.; Nikolić, L.; Ristić, D.; Čanadanovic-Brunet, J.; Tumbas, V. Antioxidant activity and total phenolic and flavonoid contents of Hieracium pilosella L. extracts. Sensors 2009, 9, 5702–5714. [Google Scholar] [CrossRef] [PubMed]
  12. Zhang, J.; Shen, Q.; Lu, J.C.; Li, J.Y.; Liu, W.Y.; Yang, J.J.; Li, J.; Xiao, K. Phenolic compounds from the leaves of Cyclocarya paliurus (Batal.) Ijinskaja and their inhibitory activity against PTP1B. Food Chem. 2010, 119, 1491–1496. [Google Scholar] [CrossRef]
  13. Treutter, D. Biosynthesis of phenolic compounds and its regulation in apple. Plant Growth Regul. 2001, 34, 71–89. [Google Scholar] [CrossRef]
  14. Bennett, R.N.; Wallsgrove, R.M. Secondary metabolites in plant defense mechanisms. New Phytol. 1994, 127, 617–633. [Google Scholar] [CrossRef]
  15. Amaral, J.S.; Seabra, R.M.; Andrade, P.B.; Valentão, P.; Pereira, J.A.; Ferreres, F. Phenolic profile in the quality control of walnut (Juglans regia L.) leaves. Food Chem. 2004, 88, 373–379. [Google Scholar] [CrossRef]
  16. Radix, P.; Bastien, C.; Jay-Allemand, C.; Charlot, G.; Seigle-Murandi, F. The influence of soil nature on polyphenols in walnut tissues. A possible explanation of differences in the expression of walnut blight. Agronomie 1998, 18, 627–637. [Google Scholar] [CrossRef]
  17. Fang, S.Z.; Wang, J.Y.; Wei, Z.Y.; Zhu, Z.X. Methods to break seed dormancy in Cyclocarya paliurus (Batal.) Iljinskaja. Sci. Hortic. 2006, 110, 305–309. [Google Scholar] [CrossRef]
  18. Birari, R.B.; Bhutani, K.K. Pancreatic lipase inhibitors from natural source: unexplored potential. Drug Discov. Today 2007, 12, 879–889. [Google Scholar] [CrossRef]
  19. Hou, X.L.; Liu, X.X.; Wang, S.; Zhou, X.L.; Wei, F.; Miao, J.H. Effect of the flavonoids from Cyclocarya paliurus on spontaneous hypertension rats. Pharm. Clin. Chin. Mater. Med. 2014, 30, 62–69. [Google Scholar]
  20. Kurihara, H.; Fukami, H.; Kusumoto, A.; Toyoda, Y.; Shibata, H.; Matsui, Y. Hypoglycemic action of Cyclocarya paliurus (Batal.) Iljinskaja in normal and diabetic mice. Biosci. Biotechnol. Biochem. 2003, 67, 877–880. [Google Scholar] [CrossRef]
  21. Wu, Z.F.; Gao, T.H.; Zhong, R.L.; Lin, Z.; Jiang, C.H.; Ouyang, S.; Zhao, M.; Che, C.T.; Zhang, J.; Yin, Z.Q. Antihyperlipidaemic effect of triterpenic acid-enriched fraction from Cyclocarya paliurus leaves in hyperlipidaemic rats. Pharm. Biol. 2017, 55, 712–721. [Google Scholar] [CrossRef] [PubMed]
  22. Liu, X.; Xie, J.H.; Jia, S.; Huang, L.X.; Wang, Z.J.; Li, C.; Xie, M.Y. Immunomodulatory effects of an acetylated Cyclocarya paliurus polysaccharide on murine macrophages raw264.7. Int. J. Biol. Macromol. 2017, 98, 576–581. [Google Scholar] [CrossRef] [PubMed]
  23. Xie, J.H.; Liu, X.; Shen, M.Y.; Nie, S.P.; Zhang, H.; Li, C.; Gong, D.M.; Xie, M.Y. Purification, physicochemical characterization and anticancer activity of a polysaccharide from Cyclocarya paliurus leaves. Food Chem. 2013, 136, 1453–1460. [Google Scholar] [CrossRef] [PubMed]
  24. Xie, J.H.; Shen, M.Y.; Xie, M.Y.; Nie, S.P.; Chen, Y.; Li, C.; Huang, D.F.; Wang, Y.X. Ultrasonic-assisted extraction, antimicrobial and antioxidant activities of Cyclocarya paliurus (Batal.) Iljinskaja polysaccharides. Carbohydr. Polym. 2012, 89, 177–184. [Google Scholar] [CrossRef] [PubMed]
  25. Cao, Y.N.; Fang, S.Z.; Yin, Z.Q.; Fu, X.X.; Shang, X.L.; Yang, W.X.; Yang, H.M. Chemical fingerprint and multicomponent quantitative analysis for the quality evaluation of Cyclocarya paliurus leaves by HPLC–Q–TOF–MS. Molecules 2017, 22, 1927. [Google Scholar] [CrossRef] [PubMed]
  26. Shu, R.G.; Xu, C.R.; Li, L.N.; Yu, Z.L. Cyclocariosides II and III: two secodammarane triterpenoid saponins from Cyclocarya paliurus. Planta Med. 1995, 61, 551–555. [Google Scholar] [CrossRef] [PubMed]
  27. Kennelly, E.J.; Cai, L.; Long, L.; Shamon, L.; Zaw, K.; Zhou, B.N.; Pezzuto, J.M.; Kinghorn, A.D. Novel highly sweet secodammarane glycosides from Pterocarya paliurus. J. Agric. Food Chem. 1995, 43, 2602–2607. [Google Scholar] [CrossRef]
  28. Xie, J.H.; Xie, M.Y.; Nie, S.P.; Shen, M.Y.; Wang, Y.X.; Li, C. Isolation, chemical composition and antioxidant activities of a watersoluble polysaccharide from Cyclocarya paliurus (Batal.) Iljinskaja. Food Chem. 2010, 119, 1626–1632. [Google Scholar] [CrossRef]
  29. Deng, B.; Fang, S.Z.; Shang, X.L.; Fu, X.X.; Li, Y. Influence of provenance and shade on biomass production and triterpenoid accumulation in Cyclocarya paliurus. Agrofor. Syst. 2019, 93, 483–492. [Google Scholar] [CrossRef]
  30. Cao, Y.N.; Deng, B.; Fang, S.Z.; Shang, X.L.; Fu, X.X.; Yang, W.X. Genotypic variation in tree growth and selected flavonoids in leaves of Cyclocarya paliurus. South. For. 2018, 80, 67–74. [Google Scholar] [CrossRef]
  31. Liu, Z.; Carpenter, S.B.; Bourgeois, W.J.; Yu, Y.; Constantin, R.J.; Falcon, M.J.; Adams, J.C. Variations in the secondary metabolite camptothecin in relation to tissue age and season in Camptotheca acuminata. Tree Physiol. 1998, 18, 265–270. [Google Scholar] [CrossRef] [PubMed]
  32. Dong, T.T.; Cui, X.M.; Song, Z.H.; Zhao, K.J.; Ji, Z.N.; Lo, C.K.; Tsim, K.W. Chemical assessment of roots of Panax notoginseng in China: regional and seasonal variations in its active constituents. J. Agric. Food Chem. 2003, 51, 4617–4623. [Google Scholar] [CrossRef] [PubMed]
  33. González-Molina, E.; Moreno, D.A.; García-Viguera, C. Genotype and harvest time influence the phytochemical quality of Fino lemon juice (Citrus limon (L.) Burm. F.) for industrial use. J. Agric. Food Chem. 2008, 56, 1669–1675. [Google Scholar] [CrossRef] [PubMed]
  34. Fu, X.X.; Zhou, X.D.; Deng, B.; Shang, X.L.; Fang, S.Z. Seasonal and genotypic variation of water-soluble polysaccharide content in leaves of Cyclocarya paliurus. South. For. 2015, 77, 231–236. [Google Scholar] [CrossRef]
  35. Fang, S.Z.; Yang, W.X.; Chu, X.L.; Shang, X.L.; She, C.Q.; Fu, X.X. Provenance and temporal variations in selected flavonoids in leaves of Cyclocarya paliurus. Food Chem. 2011, 124, 1382–1386. [Google Scholar] [CrossRef]
  36. Moyer, R.A.; Hummer, K.E.; Finn, C.E.; Frei, B.; Wrolstad, R.E. Anthocyanins, phenolics, and antioxidant capacity in diverse small fruits: vaccinium, rubus, and ribes. J. Agric. Food Chem. 2002, 50, 519–525. [Google Scholar] [CrossRef] [PubMed]
  37. Kalt, W.; Ryan, D.A.; Duy, J.C.; Prior, R.L.; Ehlenfeldt, M.K.; Kloet, S.P. Interspecific variation in anthocyanins, phenolics, and antioxidant capacity among genotypes of highbush and lowbush blueberries (Vaccinium section cyanococcus spp.). J. Agric. Food Chem. 2001, 49, 4761–4767. [Google Scholar] [CrossRef] [PubMed]
  38. Rühmann, S.; Leser, C.; Bannert, M.; Treutter, D. Relationship between growth, secondary metabolism, and resistance of apple. Plant Biol. 2002, 4, 137–143. [Google Scholar] [CrossRef]
  39. Dixon, R.A.; Paiva, N.L. Stress-induced phenylpropanoid metabolism. Plant Cell 1995, 7, 1085–1097. [Google Scholar] [CrossRef]
  40. Lindroth, R.L.; Peterson, S.S. Effects of plant phenols of performance of southern armyworm larvae. Oecologia 1988, 75, 185–189. [Google Scholar] [CrossRef]
  41. Deng, B.; Shang, X.L.; Fang, S.Z.; Li, Q.Q.; Fu, X.X.; Su, J. Integrated effects of light intensity and fertilization on growth and flavonoid accumulation in Cyclocarya paliurus. J. Agric. Food Chem. 2012, 60, 6286–6292. [Google Scholar] [CrossRef] [PubMed]
  42. Tsormpatsidis, E.; Henbest, R.G.C.; Davis, F.J.; Battey, N.H.; Hadley, P.; Wagstaffe, A. UV irradiance as a major influence on growth, development and secondary products of commercial importance in Lollo Rosso lettuce ‘Revolution’ grown under polyethylene films. Environ. Exp. Bot. 2008, 63, 232–239. [Google Scholar] [CrossRef]
  43. Edreva, A. The importance of non-photosynthetic pigments and cinnamic acid derivatives in the photoprotection. Agric. Ecosyst. Environ. 2005, 106, 135–146. [Google Scholar] [CrossRef]
  44. Tattini, M.; Galardi, C.; Pinelli, P.; Massai, R.; Remorini, D.; Aggati, G. Differential accumulation of flavonoids and hydroxycinnamates in leaves of Ligustrum vulgare under excess light and drought stress. New Phytol. 2004, 163, 547–561. [Google Scholar] [CrossRef]
  45. Wang, L.J.; Su, S.; Wu, J.; Du, H.; Li, S.S.; Huo, J.W.; Zhang, Y.; Wang, L.S. Variation of anthocyanins and flavonols in Vaccinium uliginosum berry in lesser khingan mountains and its antioxidant activity. Food Chem. 2014, 160, 357–364. [Google Scholar] [CrossRef] [PubMed]
  46. Jaakola, L.; Määttä-Riihinen, K.; Kärenlampi, S.; Hohtola, A. Activation of flavonoid biosynthesis by solar radiation in bilberry (Vaccinium myrtillus L.) leaves. Planta 2004, 218, 721–728. [Google Scholar] [PubMed]
  47. Reyes, L.F.; Miller, J.C.; Cisneros-Zevallos, L. Environmental conditions influence the content and yield of anthocyanins and total phenolics in purple- and red-flesh potatoes during tuber development. Am. J. Potato Res. 2004, 81, 187–193. [Google Scholar] [CrossRef]
  48. Klimov, S.V.; Burakhanova, E.A.; Dubinina, I.M.; Alieva, G.P.; Sal’nikova, E.B.; Olenichenko, N.A.; Zagoskina, N.V.; Trunova, T.I. Suppression of the source activity affects carbon distribution and frost hardiness of vegetating winter wheat plants. Russ. J. Plant Physiol. 2008, 55, 308–314. [Google Scholar] [CrossRef]
  49. Christie, P.J.; Alfenito, M.R.; Walbot, V. Impact of low-temperature stress on general phenylpropanoid and anthocyanin pathways: Enhancement of transcript abundance and anthocyanin pigmentation in maize seedlings. Planta 1994, 194, 541–549. [Google Scholar] [CrossRef]
  50. Leyva, A.; Jarillo, J.A.; Salinas, J.; Martinez-Zapater, J.M. Low-temperature induces the accumulation of Phenylalanine Ammonia-Lyase and Chalcone Synthase m-RNAs of Arabidopsis thaliana in a light-dependent manner. Plant Physiol. 1995, 108, 39–46. [Google Scholar] [CrossRef]
  51. Vogt, T.; Gul, P.G. Accumulation of flavonoids during leaf development in Citrus laurifolius. Phytochemistry 1994, 36, 591–597. [Google Scholar] [CrossRef]
  52. Crespo-Sempere, A.; Selma-Lázaro, C.; Palumbo, J.D.; González-Candelas, L.; Martínez-Culebras, P.V. Effect of oxidant stressors and phenolic antioxidants on the ochratoxigenic fungus Aspergillus carbonarius. J. Sci. Food Agric. 2016, 96, 169–177. [Google Scholar] [CrossRef] [PubMed]
  53. Liu, Z.J.; Zhou, G.M.; Xu, S.Y.; Wu, J.S.; Yin, E.Q. Provenance variation in camptothecin concentrations of Camptotheca acuminata grown in China. New For. 2002, 24, 215–224. [Google Scholar] [CrossRef]
  54. Margna, U. Control at the level of substrate supply-an alternative in the regulation of phenylpropanoid accumulation in plant cells. Phytochemistry 1977, 16, 419–426. [Google Scholar] [CrossRef]
  55. Margna, U.; Margna, E.; VainjÄrv, T. Influence of nitrogen nutrition on the utilization of L-phenylalanine for building flavonoids in buckwheat seedling tissues. J. Plant Physiol. 1989, 134, 697–702. [Google Scholar] [CrossRef]
  56. Phillips, R.; Henshaw, G.G. The regulation of synthesis of phenolics in stationary phase cell cultures of Acer pseudoplatanus L. J. Exp. Bot. 1977, 28, 785–794. [Google Scholar] [CrossRef]
  57. Ma, M.; Hong, C.L.; An, S.Q.; Li, B. Seasonal, spatial, and interspecific variation in quercetin in Apocynum venetum and Poacynum hendersonii, Chinese traditional herbal teas. J. Agric. Food Chem. 2003, 51, 2390–2393. [Google Scholar] [CrossRef]
  58. Hofmann, R.W.; Swinny, E.E.; Bloor, S.J.; Markham, K.R.; Ryan, K.G.; Campbell, B.D.; Jordan, B.R.; Fountain, D.W. Responses of nine Trifolium repens L. populations to ultraviolet-B radiation: Differential flavonol glycoside accumulation and biomass production. Ann. Bot. 2000, 86, 527–537. [Google Scholar] [CrossRef]
  59. Schmidt, S.; Zietz, M.; Schreiner, M.; Rohn, S.; Kroh, L.W.; Krumbein, A. Genotypic and climatic influence on the concentration and composition of flavonoids in kales (Brassica oleracea var. sabellica). Food Chem. 2010, 119, 1293–1299. [Google Scholar] [CrossRef]
  60. André, C.M.; Oufir, M.; Hoffmann, L.; Hausman, J.F.; Rogez, H.; Larondelle, Y.; Evers, D. Influence of environment and genotype on polyphenol compounds and vitro antioxidant capacity of native Andean potatoes (Solanum tuberosum L.). J. Food Compos. Anal. 2009, 22, 517–524. [Google Scholar] [CrossRef]
  61. Zhang, W.N.; Zhao, X.Y.; Sun, C.D.; Li, X.; Chen, K.S. Phenolic composition from different loquat, (Eriobotrya japonica Lindl.) cultivars grown in China, and their antioxidant properties. Molecules 2015, 20, 542–555. [Google Scholar] [CrossRef] [PubMed]
  62. Kim, Y.; Goodner, K.L.; Park, J.D.; Choi, J.; Talcott, S.T. Changes in antioxidant phytochemicals and volatile composition of Camellia sinensis by oxidation during tea fermentation. Food Chem. 2011, 129, 1331–1342. [Google Scholar] [CrossRef]
  63. Csepregi, K.; Neugart, S.; Schreiner, M.; Hideg, É. Comparative evaluation of total antioxidant capacities of plant polyphenols. Molecules 2016, 21, 208–224. [Google Scholar] [CrossRef] [PubMed]
  64. Rice-Evans, C.A.; Miller, N.J.; Paganga, G. Structure antioxidant activity relationships of flavonoids and phenolic acids. Free Radic. Biol. Med. 1996, 20, 933–956. [Google Scholar] [CrossRef]
  65. Cao, G.H.; Sofic, E.; Prior, R.L. Antioxidant and prooxidant behavior of flavonoids: Structure–activity relationships. Free Radic. Biol. Med. 1997, 22, 749–760. [Google Scholar] [CrossRef]
  66. Burda, S.; Oleszek, W. Antioxidant and antiradical activities of flavonoids. J. Agric. Food Chem. 2001, 49, 2774–2779. [Google Scholar] [CrossRef]
Figure 1. The representative HPLC chromatograms of C. paliurus leaf extract (top) and a mixed standards (bottom). 1. 3-O-caffeoylquinic acid; 2. 4-O-caffeoylquinic acid; 3. quercetin-3-O-glucuronide; 4. quercetin-3-O-galactoside; 5. quercetin-3-O-glucoside; 6. kaempferol-3-O-glucuronide; 7. kaempferol-3-O-glucoside; 8. quercetin-3-O-rhamnoside; 9. 4,5-di-O-caffeoylquinic acid; 10. kaempferol-3-O-rhamnoside.
Forests 10 00624 g001
Figure 2. Seasonal variation of phenolic acids in leaves of C. paliurus (mean ± SD). 3-CQA, 4-CQA, 4,5-CQA, and TPA represent 3-O-caffeoylquinic acid, 4-O-caffeoylquinic acid, 4,5-di-O-caffeoylquinic acid, and total phenolic aids, respectively. Different letters in this figure indicate significant differences between the sampling times for the same category according to Duncan’s test (p < 0.05). Each value presented is the mean of the 10 sampled families.
Forests 10 00624 g002
Figure 3. Seasonal variation of quercetin glycosides (A), kaempferol glycosides (B) and total flavonoids (C) in leaves of C. paliurus (mean ± SD). Q-3-Glu, Q-3-Gal, Q-3-Glc, Q-3-Rha, K-3-Glu, K-3-Glc, K-3-Rha, TK, TQ, and TF represent quercetin-3-O-glucuronide, quercetin-3-O-galactoside, quercetin-3-O-glucoside, quercetin-3-O-rhamnoside, kaempferol-3-O-glucuronide, kaempferol-3-O-glucoside, kaempferol-3-O-rhamnoside, total quercetin glycosides, total kaempferol glycosides, and total flavonoids, respectively. Different letters in this figure indicate significant differences between the sampling times for the same category according to Duncan’s test (p < 0.05). Each value presented is the mean of 10 families. * and ** indicate variation between total content of quercetin glycosides and total content of kaempferol glycosides in the same month is significant at the 0.05 and 0.01 level, respectively.
Forests 10 00624 g003
Figure 4. Seasonal variation of antioxidant activities of C. paliurus leaf extracts (mean ± SD). Different letters in this figure indicate significant differences between the sampling times for the same category according to Duncan’s test (p < 0.05). Each value presented is the mean of triplicate of family of 4#.
Forests 10 00624 g004
Figure 5. Seasonal variation in ratios of quercetin glycosides to kaempferol glycosides for the leaves of C. paliurus. The meaning of Q-3-Glu, Q-3-Glc, Q-3-Rha, K-3-Glu, K-3-Glc, K-3-Rha, TQ, and TK is the same as Figure 3. Each value presented is the mean of 10 families.
Forests 10 00624 g005
Figure 6. Chemical structure of flavonoids used in the present study.
Forests 10 00624 g006
Table 1. Pearson correlation coefficients between phenolic contents in C. paliurus leaves and antioxidant activities of C. paliurus leaf extracts (n = 21).
CompoundsDPPHFRAPABTS
Total phenolic aids0.71 *0.80 *0.85 **
Total quercetin glycosides0.73 *0.86 **0.91 **
Total kaempferol glycosides0.60.76 *0.74 *
Total flavonoids0.70.85 **0.90 **
* and ** indicate correlation is significant at the 0.05 and 0.01 level, respectively. DPPH: 1,1-diphenyl-2-picrylhydrazyl. ABTS: 2,2′-azino-bis (3-ethylbenzothiazoline-6-sulfonic acid) diammonium salt radical cation. FRAP: ferric reducing antioxidant power.
Table 2. The antioxidant performances of different phenolic compounds in C. paliurus leaves.
CompoundsDPPH
(IC50 mg/mL)
FRAP
(mmol TEAC/g)
ABTS
(mmol TEAC/g)
3-O-caffeoylquinic acid0.24 ± 0.0033.51 ± 0.024.58 ± 0.03
4-O-caffeoylquinic acid0.17 ± 0.0013.38 ± 0.064.91 ± 0.07
4,5-di-O-caffeoylquinic acid0.24 ± 0.0024.70 ± 0.04 5.13 ± 0.03
Quercetin-3-O-glucuronide0. 12 ± 0.0003.77 ± 0.02 4.44 ± 0.04
Quercetin-3-O-galactoside0.13 ± 0.0023.33 ± 0.014.41 ± 0.01
Quercetin-3-O-glucoside0.13 ± 0.0022.80 ± 0.03 4.27 ± 0.06
Quercetin-3-O-rhamnoside0.13 ± 0.0002.65 ± 0.02 4.39 ± 0.06
Kaempferol-3-O-glucuronideinactive0.22 ± 0.000.55 ± 0.01
Kaempferol-3-O-glucosideinactive0.30 ± 0.00.57 ± 0.00
Kaempferol-3-O-rhamnosideinactive0.30 ± 0.030.68 ± 0.04
Quercetin0.008 ± 0.00011.25 ± 0.246.37 ± 0.21
Kaempferol0. 26 ± 0.0023.36 ± 0.053.67 ± 0.09

