Article

Primary and Secondary Branch Growth in Black Spruce and Balsam Fir after Careful Logging around Small Merchantable Stems (CLASS)

1
Département des sciences fondamentales, Université du Québec à Chicoutimi, 555 boulevard de l’Université, Chicoutimi, QC G7H 2B1, Canada
2
Département des sciences du bois et de la forêt, Université Laval, 2405 rue de la Terrasse, Québec, QC G1V 0A6, Canada
*
Author to whom correspondence should be addressed.
Forests 2019, 10(6), 500; https://doi.org/10.3390/f10060500
Submission received: 8 May 2019 / Revised: 6 June 2019 / Accepted: 8 June 2019 / Published: 12 June 2019
(This article belongs to the Section Forest Ecology and Management)

Abstract

:
Careful logging around small merchantable stems (CLASS) is a partial cutting treatment that consists of the harvest of 70%–90% of the merchantable volume of an irregular coniferous stand. In this treatment, regeneration, saplings and small merchantable stems (DBH < 15 cm) are preserved and can continue to grow and develop into the dominant layer of the new stand. The aim of this project was to examine the effects of CLASS on the primary and secondary growth of branches, as well as on branch diameter in black spruce and balsam fir trees in the boreal forest of Quebec, Canada. Primary and secondary growth were measured on five branches per tree while branch diameter was analysed from 15 whorls distributed within the crown of the 48 black spruce and 48 balsam fir trees sampled. Branch primary and secondary growth significantly increased after CLASS in the lower part of the crown in both species, and both types of growth increased proportionally. These findings suggest that CLASS may delay crown recession as the lower branches tend to survive and grow for a longer period. However, although radial growth increased in the years post-CLASS, this did not significantly influence the final branch diameter and should not lead to lumber downgrade.

1. Introduction

In the province of Quebec, Canada, the application and study of the partial cutting treatment known as careful logging around small merchantable stems (CLASS) began in 1997 [1]. CLASS consists of the harvest of 70%–90% of the merchantable volume of an irregular coniferous stand, while regeneration, saplings—diameter at breast height (DBH) = 1.1–9.0 cm—and small merchantable stems (DBH = 9.1–15.0 cm) are preserved [1,2]. These residual protected stems can continue to grow and develop into the dominant layer of the new stand [3], which can then be harvested in a shortened rotation.
Stem growth can increase after silvicultural treatments such as CLASS or thinning [4,5,6]. Branch growth and size can also be influenced by stand conditions and modified through silviculture, with larger branches occurring generally on trees from stands that have been thinned or planted at a wider spacing [7,8,9]. Stand thinning and partial cutting can increase space and light availability for the lower branches of the crown, thereby allowing residual trees to have a larger, more productive green crown for photosynthesis. Increases in length of individual shoots and frequency of branching in response to increased light availability have been observed in conifers [10]. A decrease in stand density can also increase the radial growth of branches and produce larger branches that can affect wood quality and value [8,11,12]. Studies dealing with branches often focus on branch characteristics (number, diameter, angle) that have an effect on knots, and thus on wood quality [13,14,15,16,17]. However, the allocation prioritisation patterns in terms of elongation of branch shoots (primary growth) or radial growth (secondary growth) remain poorly documented, and studies addressing the effect of silvicultural treatment on such branch growth patterns are scarce.
Given the physiological importance of the crown and its branches on the development and survival of a tree, more information regarding the effects of silvicultural treatments on primary and secondary growth of branches is needed, especially for the main species that dominate the forest landscape in eastern Canada: black spruce (Picea mariana (Mill.) B.S.P.) and balsam fir (Abies balsamea (L.) Mill.). The more abundant of the two, black spruce is a slow-growing species adapted to a wide range of environmental conditions [18]. It is recognized and preferred for the high quality of its wood [19]. Balsam fir can become established and grow under the shade of larger trees, and it can respond vigorously to a canopy opening [4,20]. Both balsam fir and black spruce are economically valuable species, used mainly for structural lumber and pulp production [18,19,21].
This project aimed to examine the effects of CLASS on the growth response and diameter of branches from black spruce and balsam fir trees in the boreal forest of Quebec, Canada. Our specific objectives were to compare branch primary and secondary growth between residual trees following a CLASS treatment and untreated control trees, and to evaluate whether the silvicultural treatment influenced branch diameters 10 years after CLASS. As CLASS has a higher harvesting intensity than a conventional thinning, we hypothesized that branches benefit strongly from the canopy opening and increased light availability following CLASS and that primary and secondary growth increase proportionally.

2. Materials and Methods

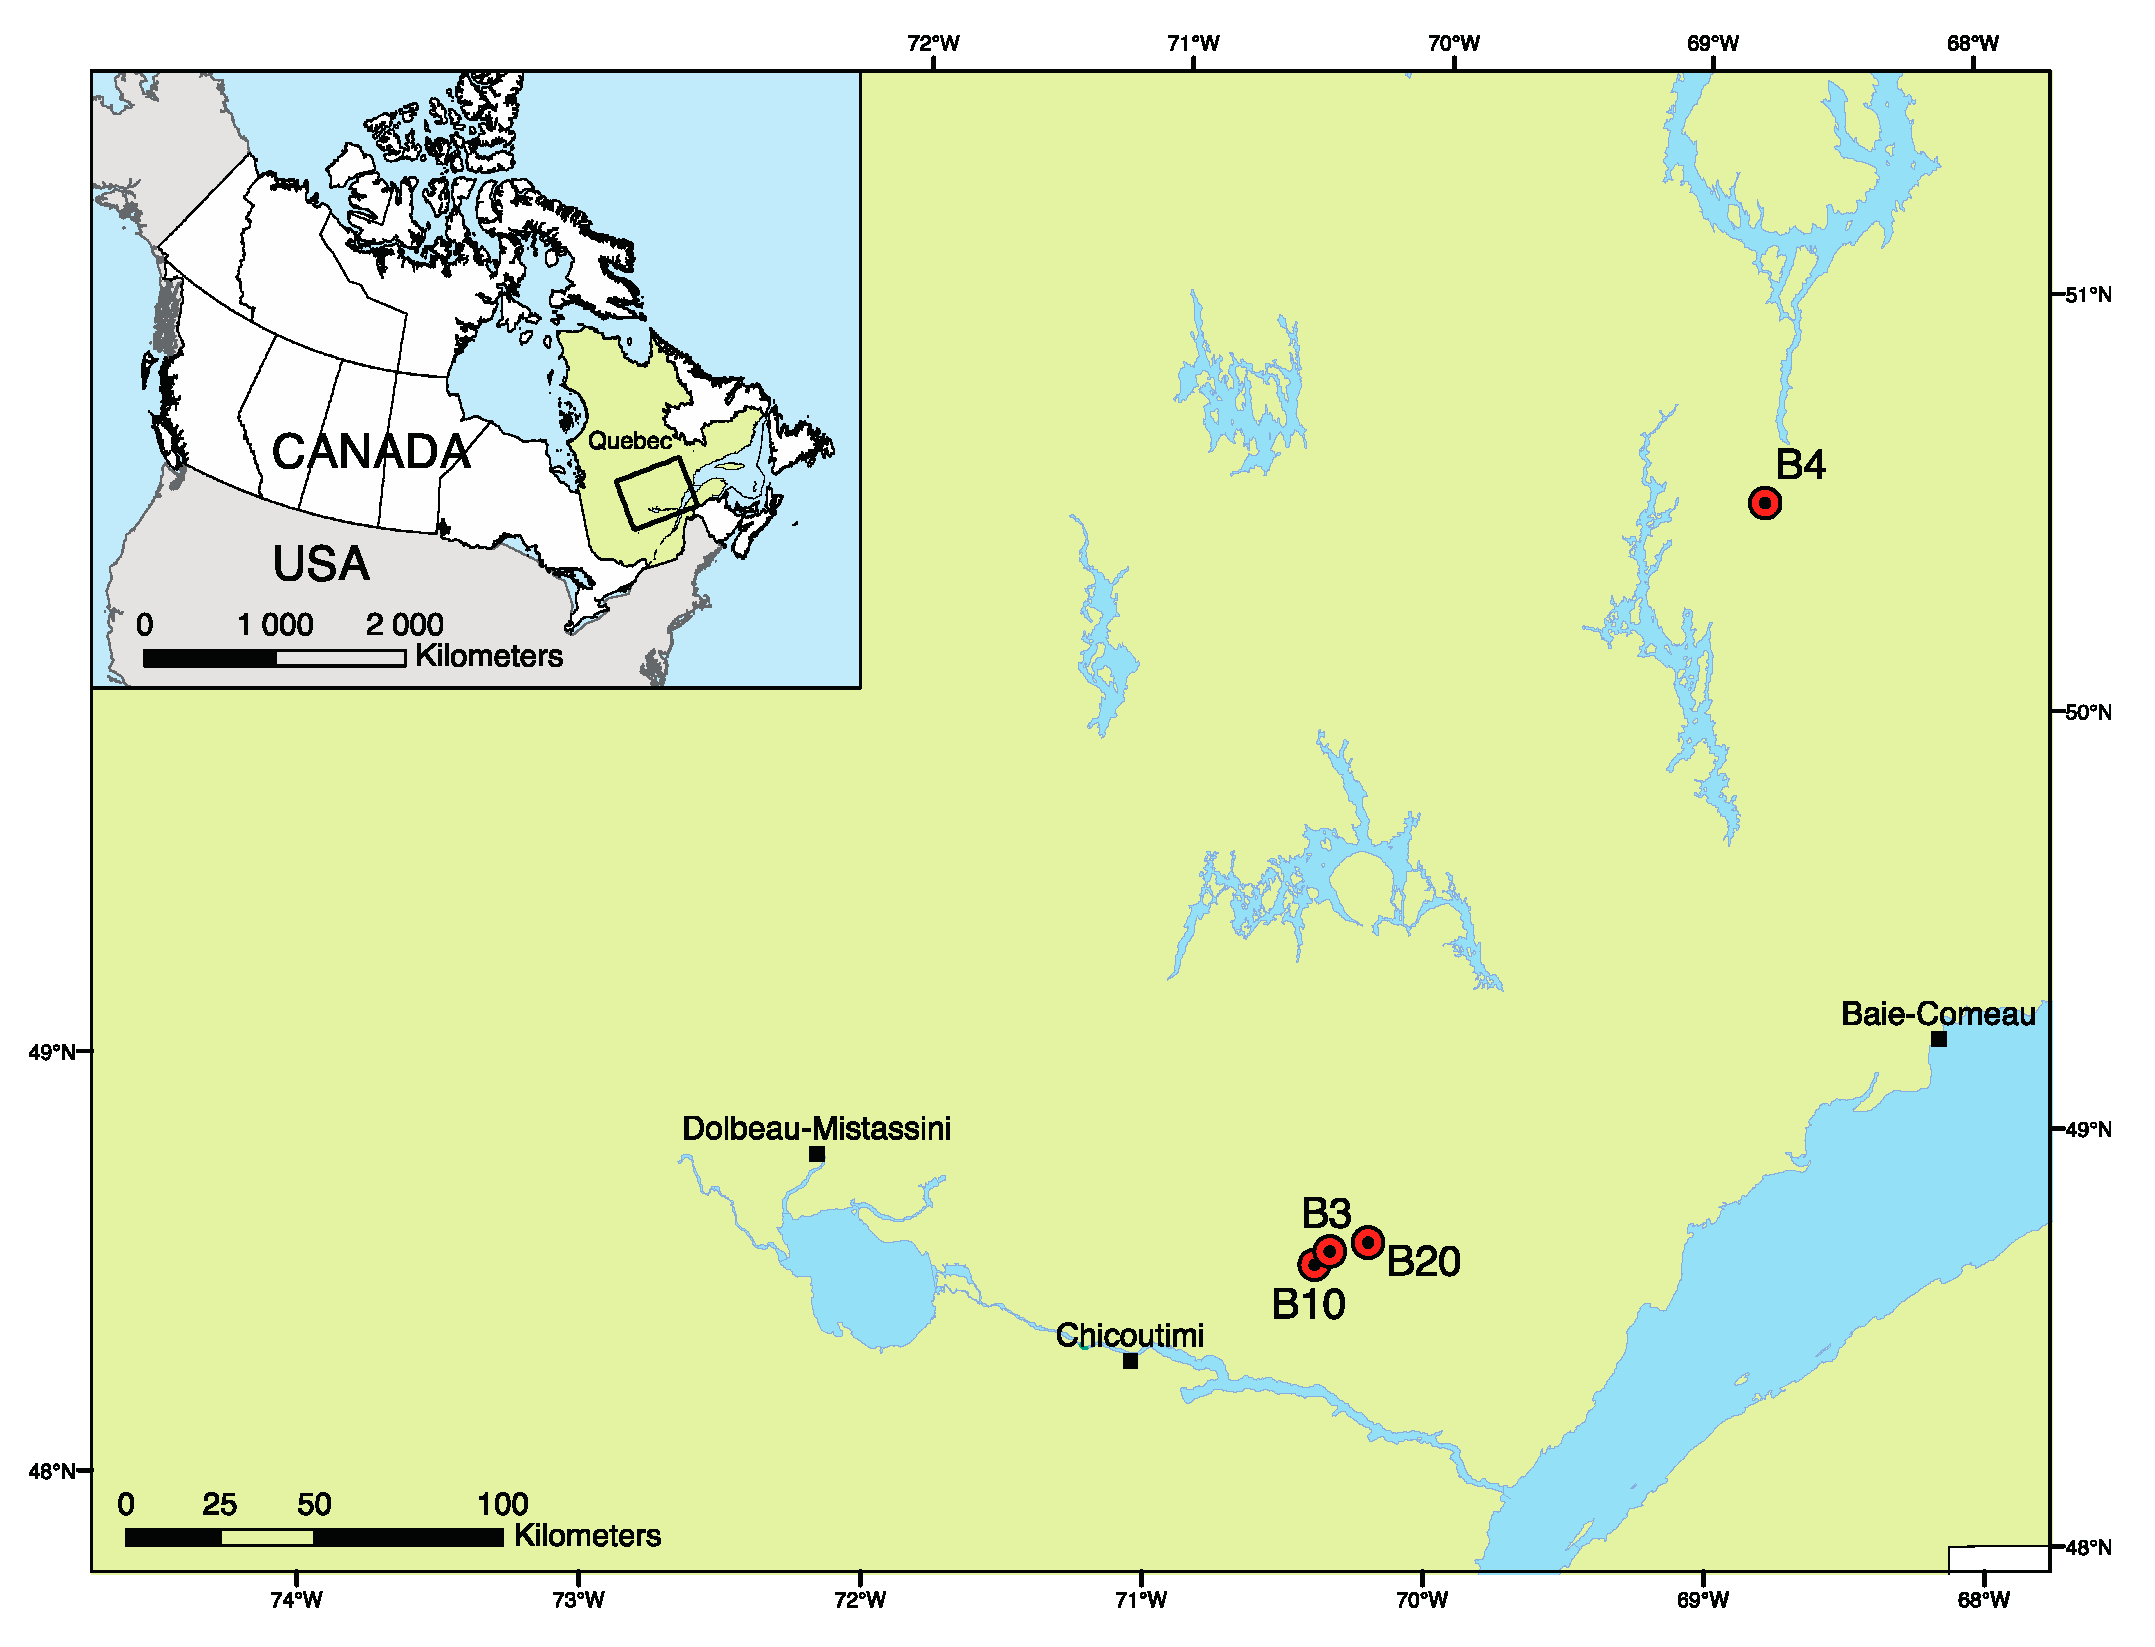
2.1. Experimental Design and Tree Sampling

Four uneven-aged black spruce–balsam fir stands were sampled in the Saguenay–Lac-Saint-Jean and Côte-Nord regions of Quebec, Canada, in the balsam-fir-white birch and spruce moss bioclimatic zones (Figure 1). These stands were part of a project for which permanent plots were established between 1997 and 2002 in 27 experimental blocks in Quebec [1,22]. CLASS was applied to one part of each stand (8–12 years prior to sampling, the specific amount of time depending on the site), and another part of the stand was left untreated to be used as a control. CLASS was applied in 1997 for sites B3 and B4, in 1999 for site B10 and 2000 for site B20. Details on species composition and stand density before and after CLASS are presented in Table 1. We established a 150 m² plot within each control and three plots of the same size in the CLASS-treated area to better represent the variability induced by the treatment.
In each plot, we randomly sampled three black spruce and three balsam fir trees that had DBH comprised between 8 and 15 cm, for a total of 96 trees. Trees having no visible signs of damage and located at least 2 m from a logging trail were selected randomly from the dominant and co-dominant trees of the stand. During a destructive sampling, tree height, DBH, height of the first live branch and crown length were measured for each stem. Crown ratio was calculated from these measurements. Trees from the CLASS treatments and those from the associated control sites had relatively similar mean age, DBH, and height, as well as crown ratio (Table 2). The only notable exception was found in site B20, where the age of the control trees was lower than the age of the treated trees. Age was calculated from a disc taken at the base of the stem.
To assess the primary and secondary growth along the crown, we divided the live crown into five sections, each having 20% of the total crown length. We collected one branch (representative of all the others) from the middle of each section, for a total of 480 collected branches. In addition to the five branches, we also collected three whorls (representative of all the others) from each of the five sections to evaluate the diameter of the branches along the stem of each sample tree. The distance of whorls from the stem base was noted and the whorls were brought back to the lab for measurements.

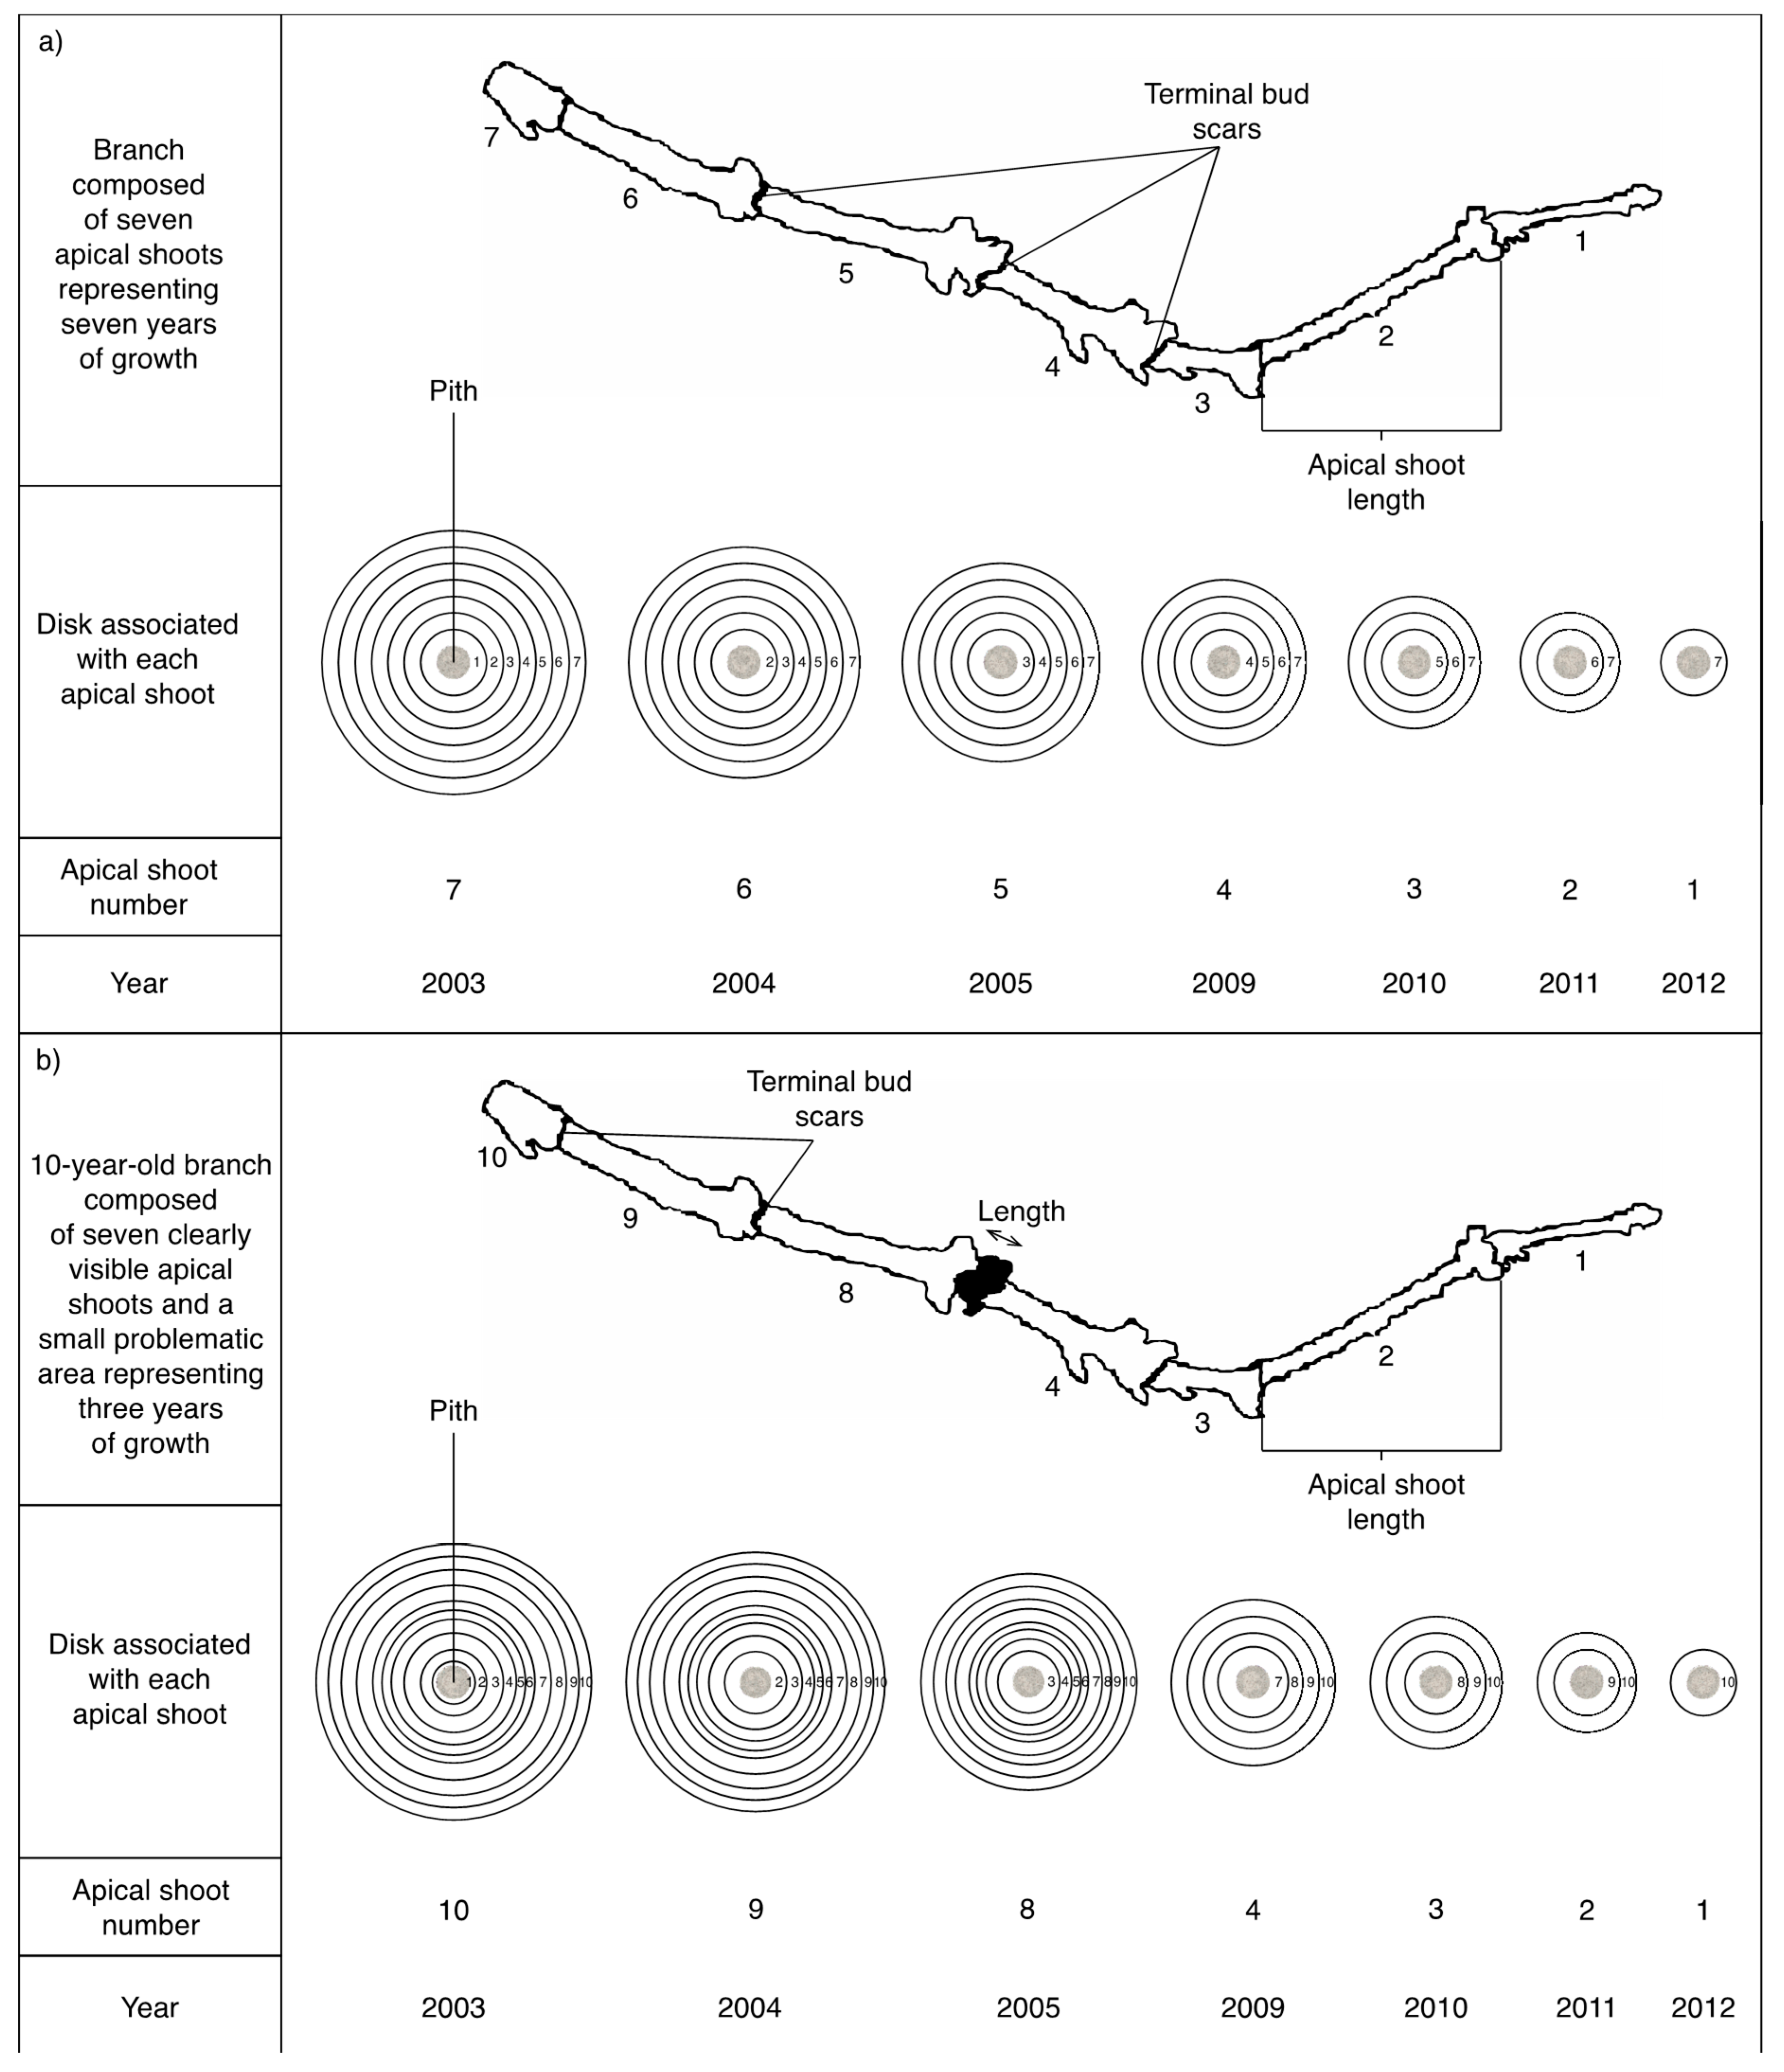
2.2. Branch Annual Primary Growth (Apical Shoot Length Increment)

Branch primary growth was measured using the five branches collected within the live crown. To evaluate annual primary growth in the branches, we measured the distance between each terminal bud scar, as in Niinemets and Lukjanova [10]. We also counted the number of growth rings in each shoot to confirm that the measurements were associated to the correct apical shoot number and year (Figure 2a). However, some branches had areas where terminal bud scars were difficult to detect. In these cases, knowing that each growth ring corresponded to a bud scar, it was therefore necessary to count the number of rings upward and downward of the problematic area. The difference between the number of rings before and after indicated the exact number of apical shoots that were not clearly visible (Figure 2b). The formula used to obtain a value of primary growth increment for these shoots was:
P r i m a r y   g r o w t h =   L e n g t h   o f   t h e   p r o b l e m a t i c   a r e a N u m b e r   o f   a p i c a l   s h o o t s   p r e s e n t   i n   t h e   p r o b l e m a t i c   a r e a
Measurements of primary growth increments were limited to the 20 years prior to CLASS until 10 years post-CLASS, offering a chronology of up to 30 years, depending on branch age.
To minimize differences in age and growth between branches, primary growth chronologies were standardized by dividing each annual measurement by the mean increment of the branch before CLASS to obtain an index value for each year [24].

2.3. Branch Annual Secondary Growth (Radial Increment)

From the same branches used for annual primary growth measurements, we collected a disc at the base of the branch for the analysis of secondary growth. All discs were air-dried, sanded with progressively finer grade sandpaper, and their ring widths were measured with a LINTAB™ using the TSAP-Win software (RINNTECH, Heidelberg, Germany). To reduce the growth variability of the branches, we measured a single radius [25] avoiding compression wood present on the underside of branches [26]. As the series were short, and there was little variation between annual growth rings, only visual cross-dating was made. We used branch secondary growth measurements from 20 years prior to CLASS until 10 years post-CLASS, and the standardization method was similar to that used for the primary growth measurements.
An annual ratio of branch primary to secondary growth was calculated from the indices of primary growth and secondary growth using the formula:
R a t i o   o f   p r i m a r y   t o   s e c o n d a r y   g r o w t h =   P r i m a r y   g r o w t h   i n d e x S e c o n d a r y   g r o w t h   i n d e x
A ratio > 1 indicated that more resources were allocated to primary growth rather than secondary growth of branches.

2.4. Branch Diameter along the Live Crown

Diameter was measured for each branch present on all of the collected whorls, for a total of 5980 branch diameter measurements. Since most branches were not perfectly circular, the diameter of each branch was averaged from the vertical and horizontal diameters measured at the base of the branch after base swell [27]. The relative height of the branch in the live crown was calculated from the height of the whorl in the crown relative to the crown length:
B r a n c h   r e l a t i v e   h e i g h t   i n   t h e   c r o w n =   W h o r l   h e i g h t   i n   t h e   l i v e   c r o w n L i v e   c r o w n   h e i g h t   ×   100
where 0% = crown base and 100% = stem apex.

2.5. Statistical Analyses

To assess the treatment effect on branch annual primary and secondary growth, and on the ratio of primary to secondary growth, mixed-effect modelling techniques were used as they can account for the nested structure of the data (branches nested within trees, which are themselves nested within plots and within sites). Standardized branch increment values of the 10-year period following CLASS were used as dependant variables. Treatment (CLASS or control), year (time since treatment) and their interaction were entered in the model as fixed effects, whereas site, plot and tree were designated as random factors, and year was a repeated measure on each tree. An AR(1) autoregressive covariance structure was used to account for the autocorrelation of successive individual measurements within trees. Analyses were done separately for each section of the live crown and for each species. All models were fitted using the ‘nlme’ package [28] in the R statistical programming environment [29], using an estimate of the restricted maximum likelihood (REML). The contrast function of the R package ‘emmeans’ was used to identify differences between the control and CLASS trees for every level of factor year. Branch increment indices (both primary and secondary growth) and ratio of primary to secondary growth were log-transformed to meet the assumptions of normality and homoscedasticity [30]. Standard procedures for model diagnostics were conducted and verified for all analyses.
To model branch diameter within the live crown, a generalized additive model (GAM) was used. A GAM is a regression that combines linear and nonlinear relationships between predictor and response variables [31]. Branch diameter was expressed as a function of treatment, branch height in the crown, tree DBH before treatment, tree height, and crown ratio:
y =   α + T r e a t m e n t + s ( R e l H e i g h t ) +   s ( D B H b t ) + s ( H e i g h t ) + s ( C r o w n R a t i o ) + s ( S i t e ) + s ( P l o t ) +   s ( T r e e ) + ε
where y is the vector of the branch diameter, Treatment is either CLASS or control, RelHeight is the vector of the position of the branch in the crown, DBHbt is the vector of the tree diameter at breast height before treatment, Height is the vector of the tree height, CrownRatio is the vector of the crown length relative to the total tree height, Site, Plot and Tree are the vector for the site, plot and tree respectively (all three treated as random effects), α is the intercept, s is a non-parametric smoothing function specific to each term, determined by the statistical software, and ε is the error term. A distinct smoothing function for each level of the factor Treatment was modelled using the ‘by’ argument of the smooth function; this way, the model matrix provides a separate smoother for each level of the by factor [32]. The fitted values obtained after the application of the smooth functions were then compared for CLASS and control trees using a set of prediction matrices, as explained in Rose, Yang, Turner and Simpson [32]. The analysis was conducted using the R ‘mgcv’ package [33]. To visualize the model’s prediction, a conditional plot of the branch diameter as a function of the relative position in the live crown, where all other explanatory variables were held fix (at their median value), was produced with the help of the R package ‘visreg’ [34].
Both species were treated separately and compared only visually. Differences were considered significant when p was < 0.05. All statistical analyses were performed using R 3.5.2 [29].

3. Results

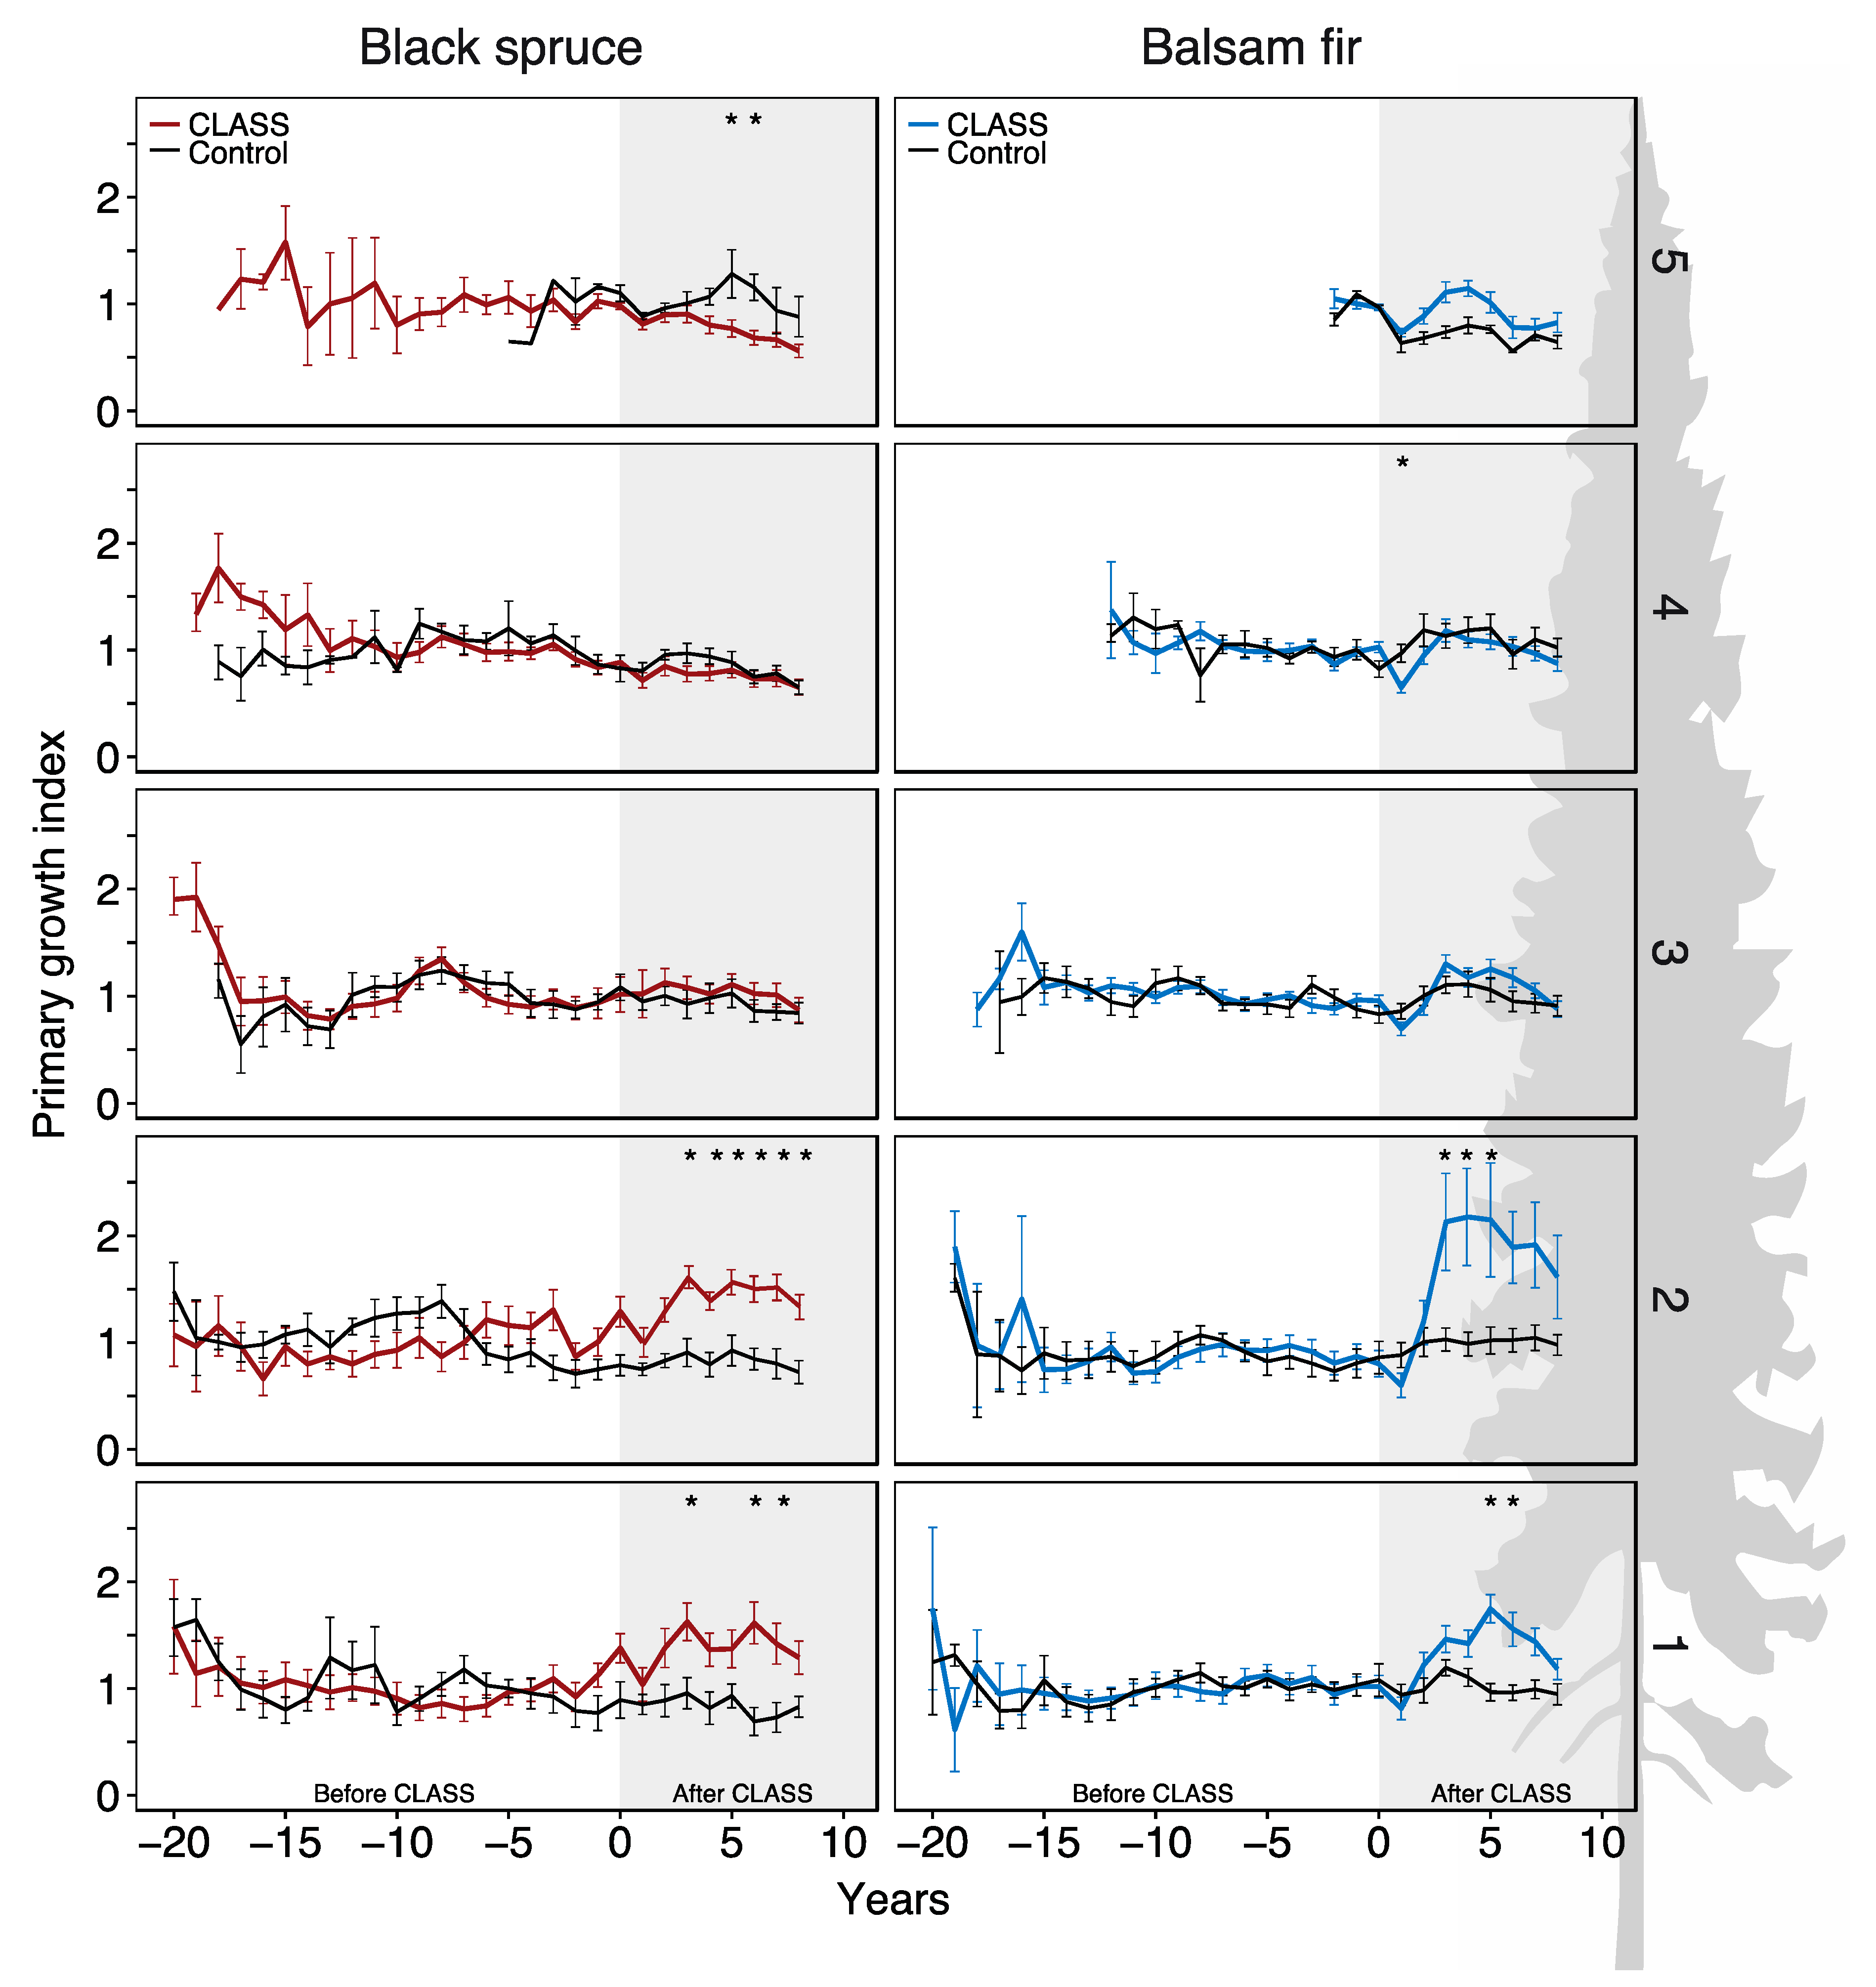
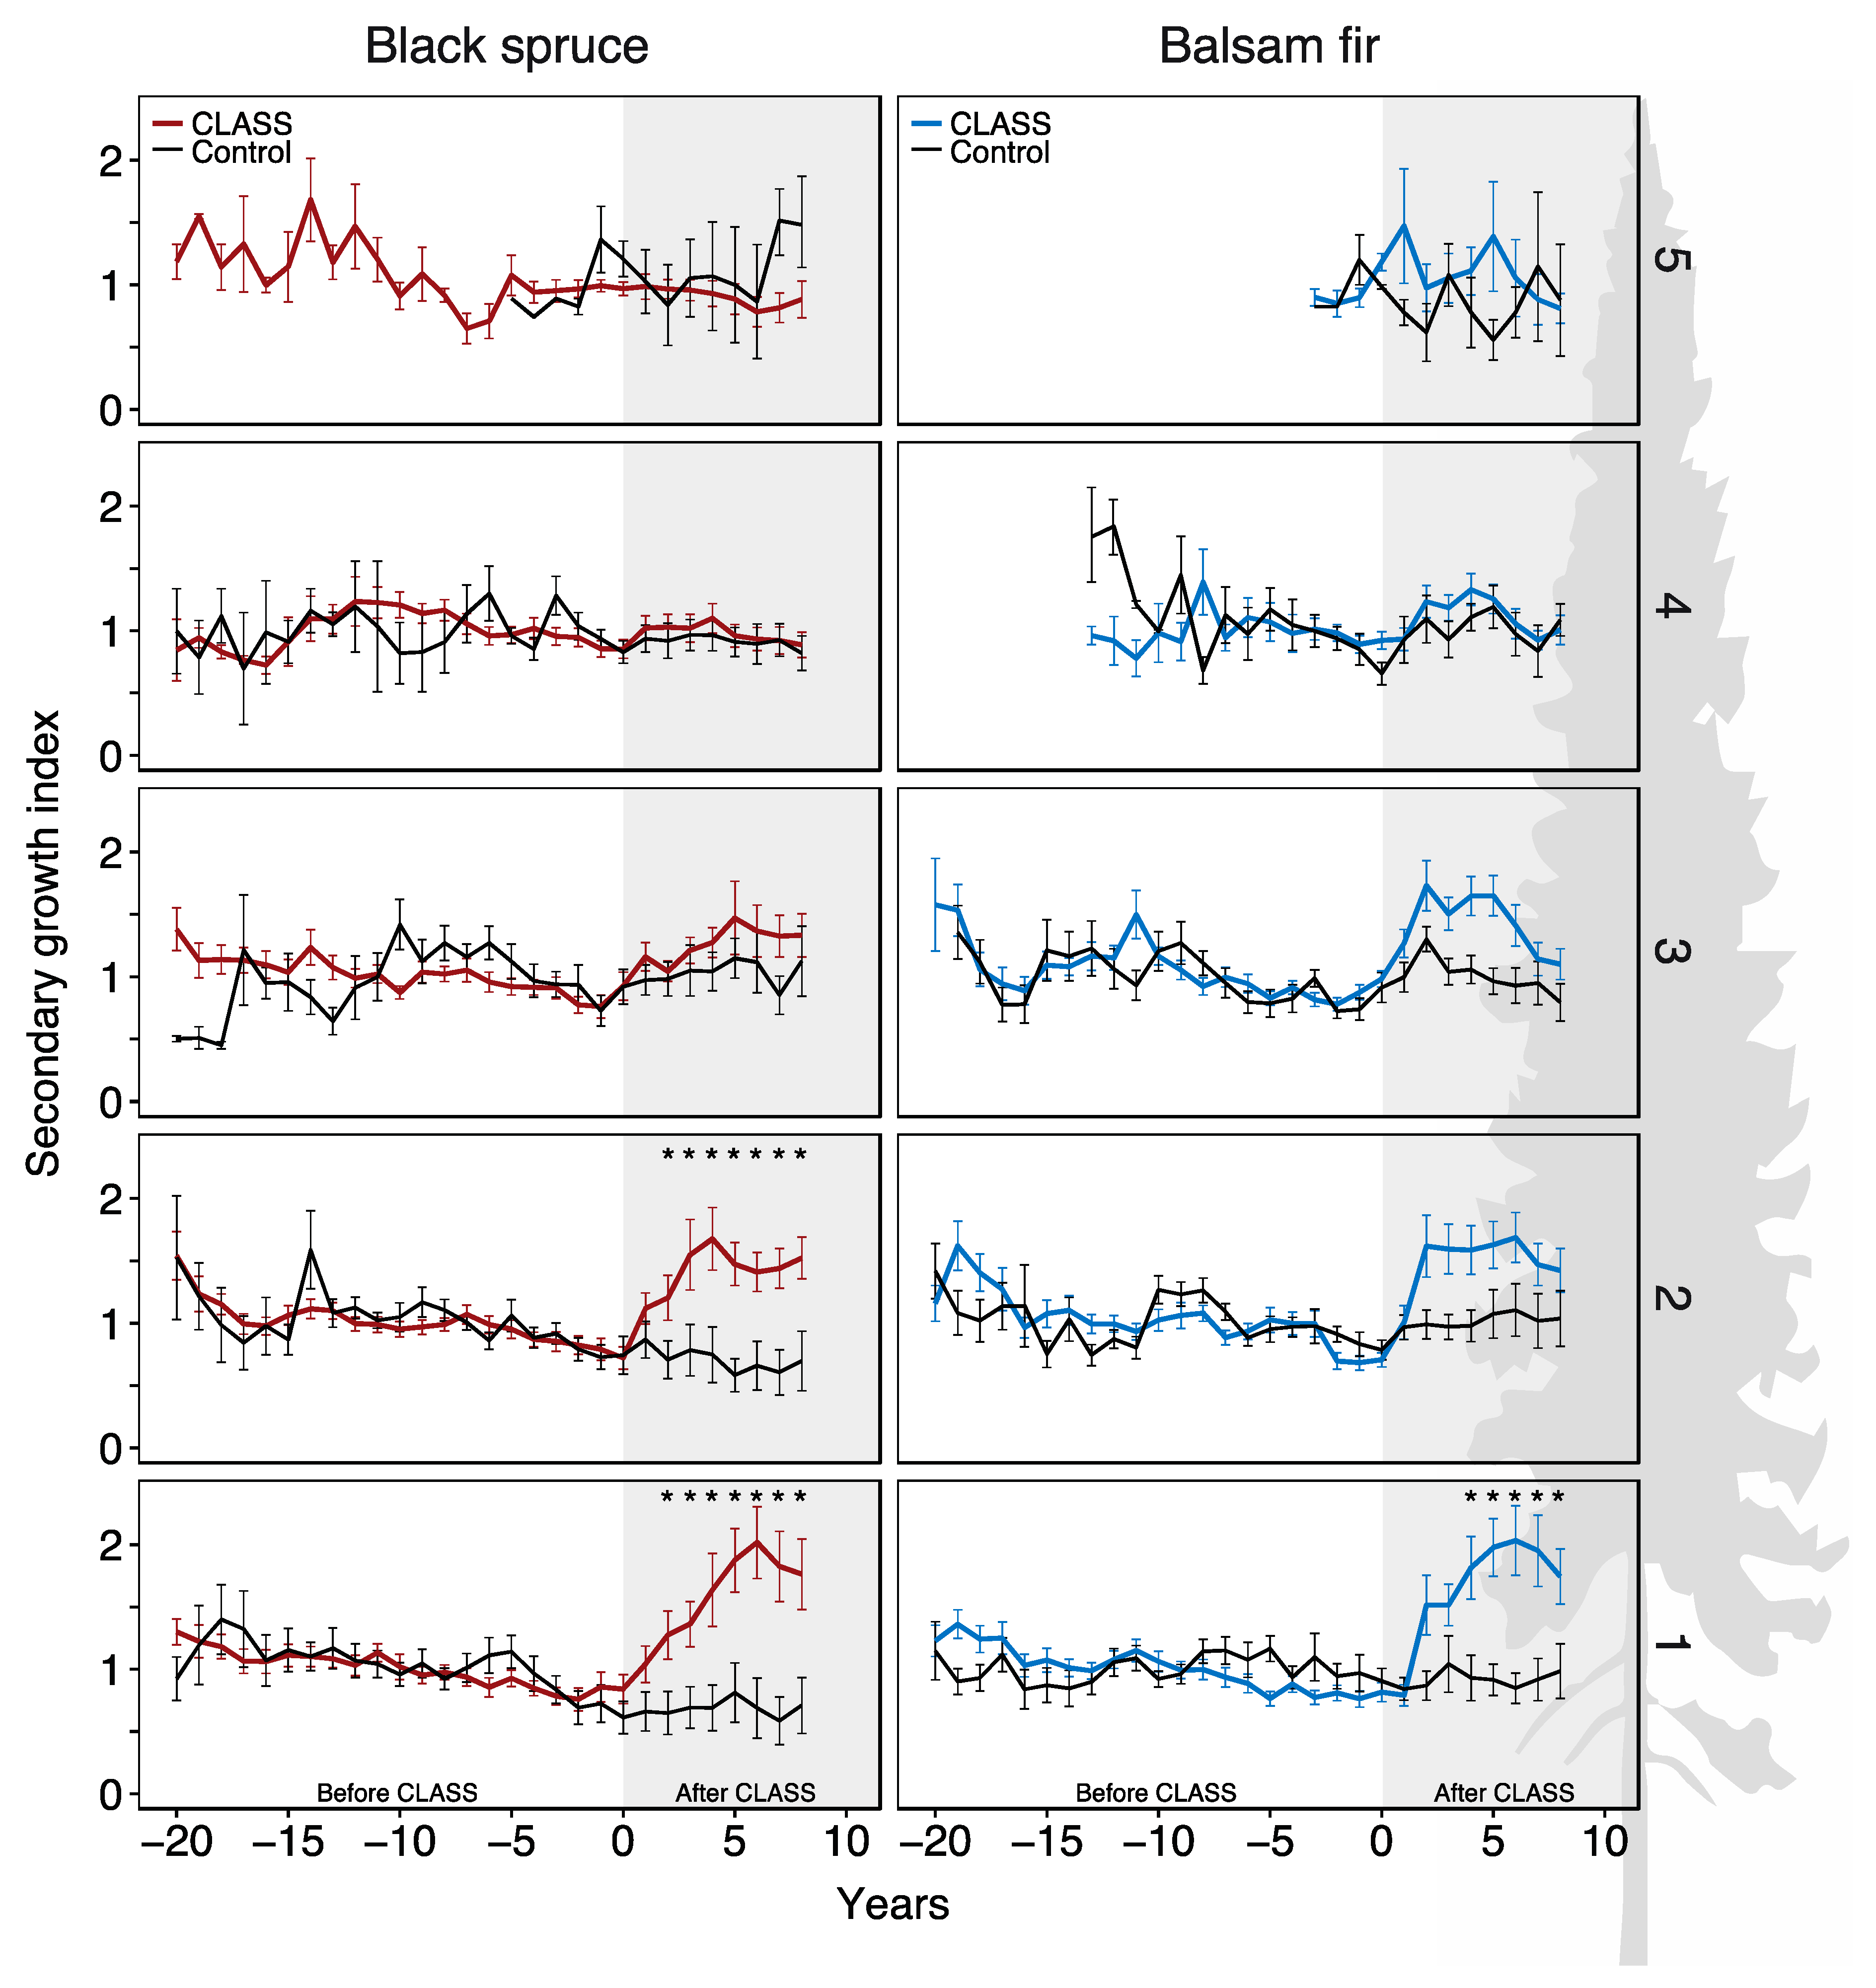
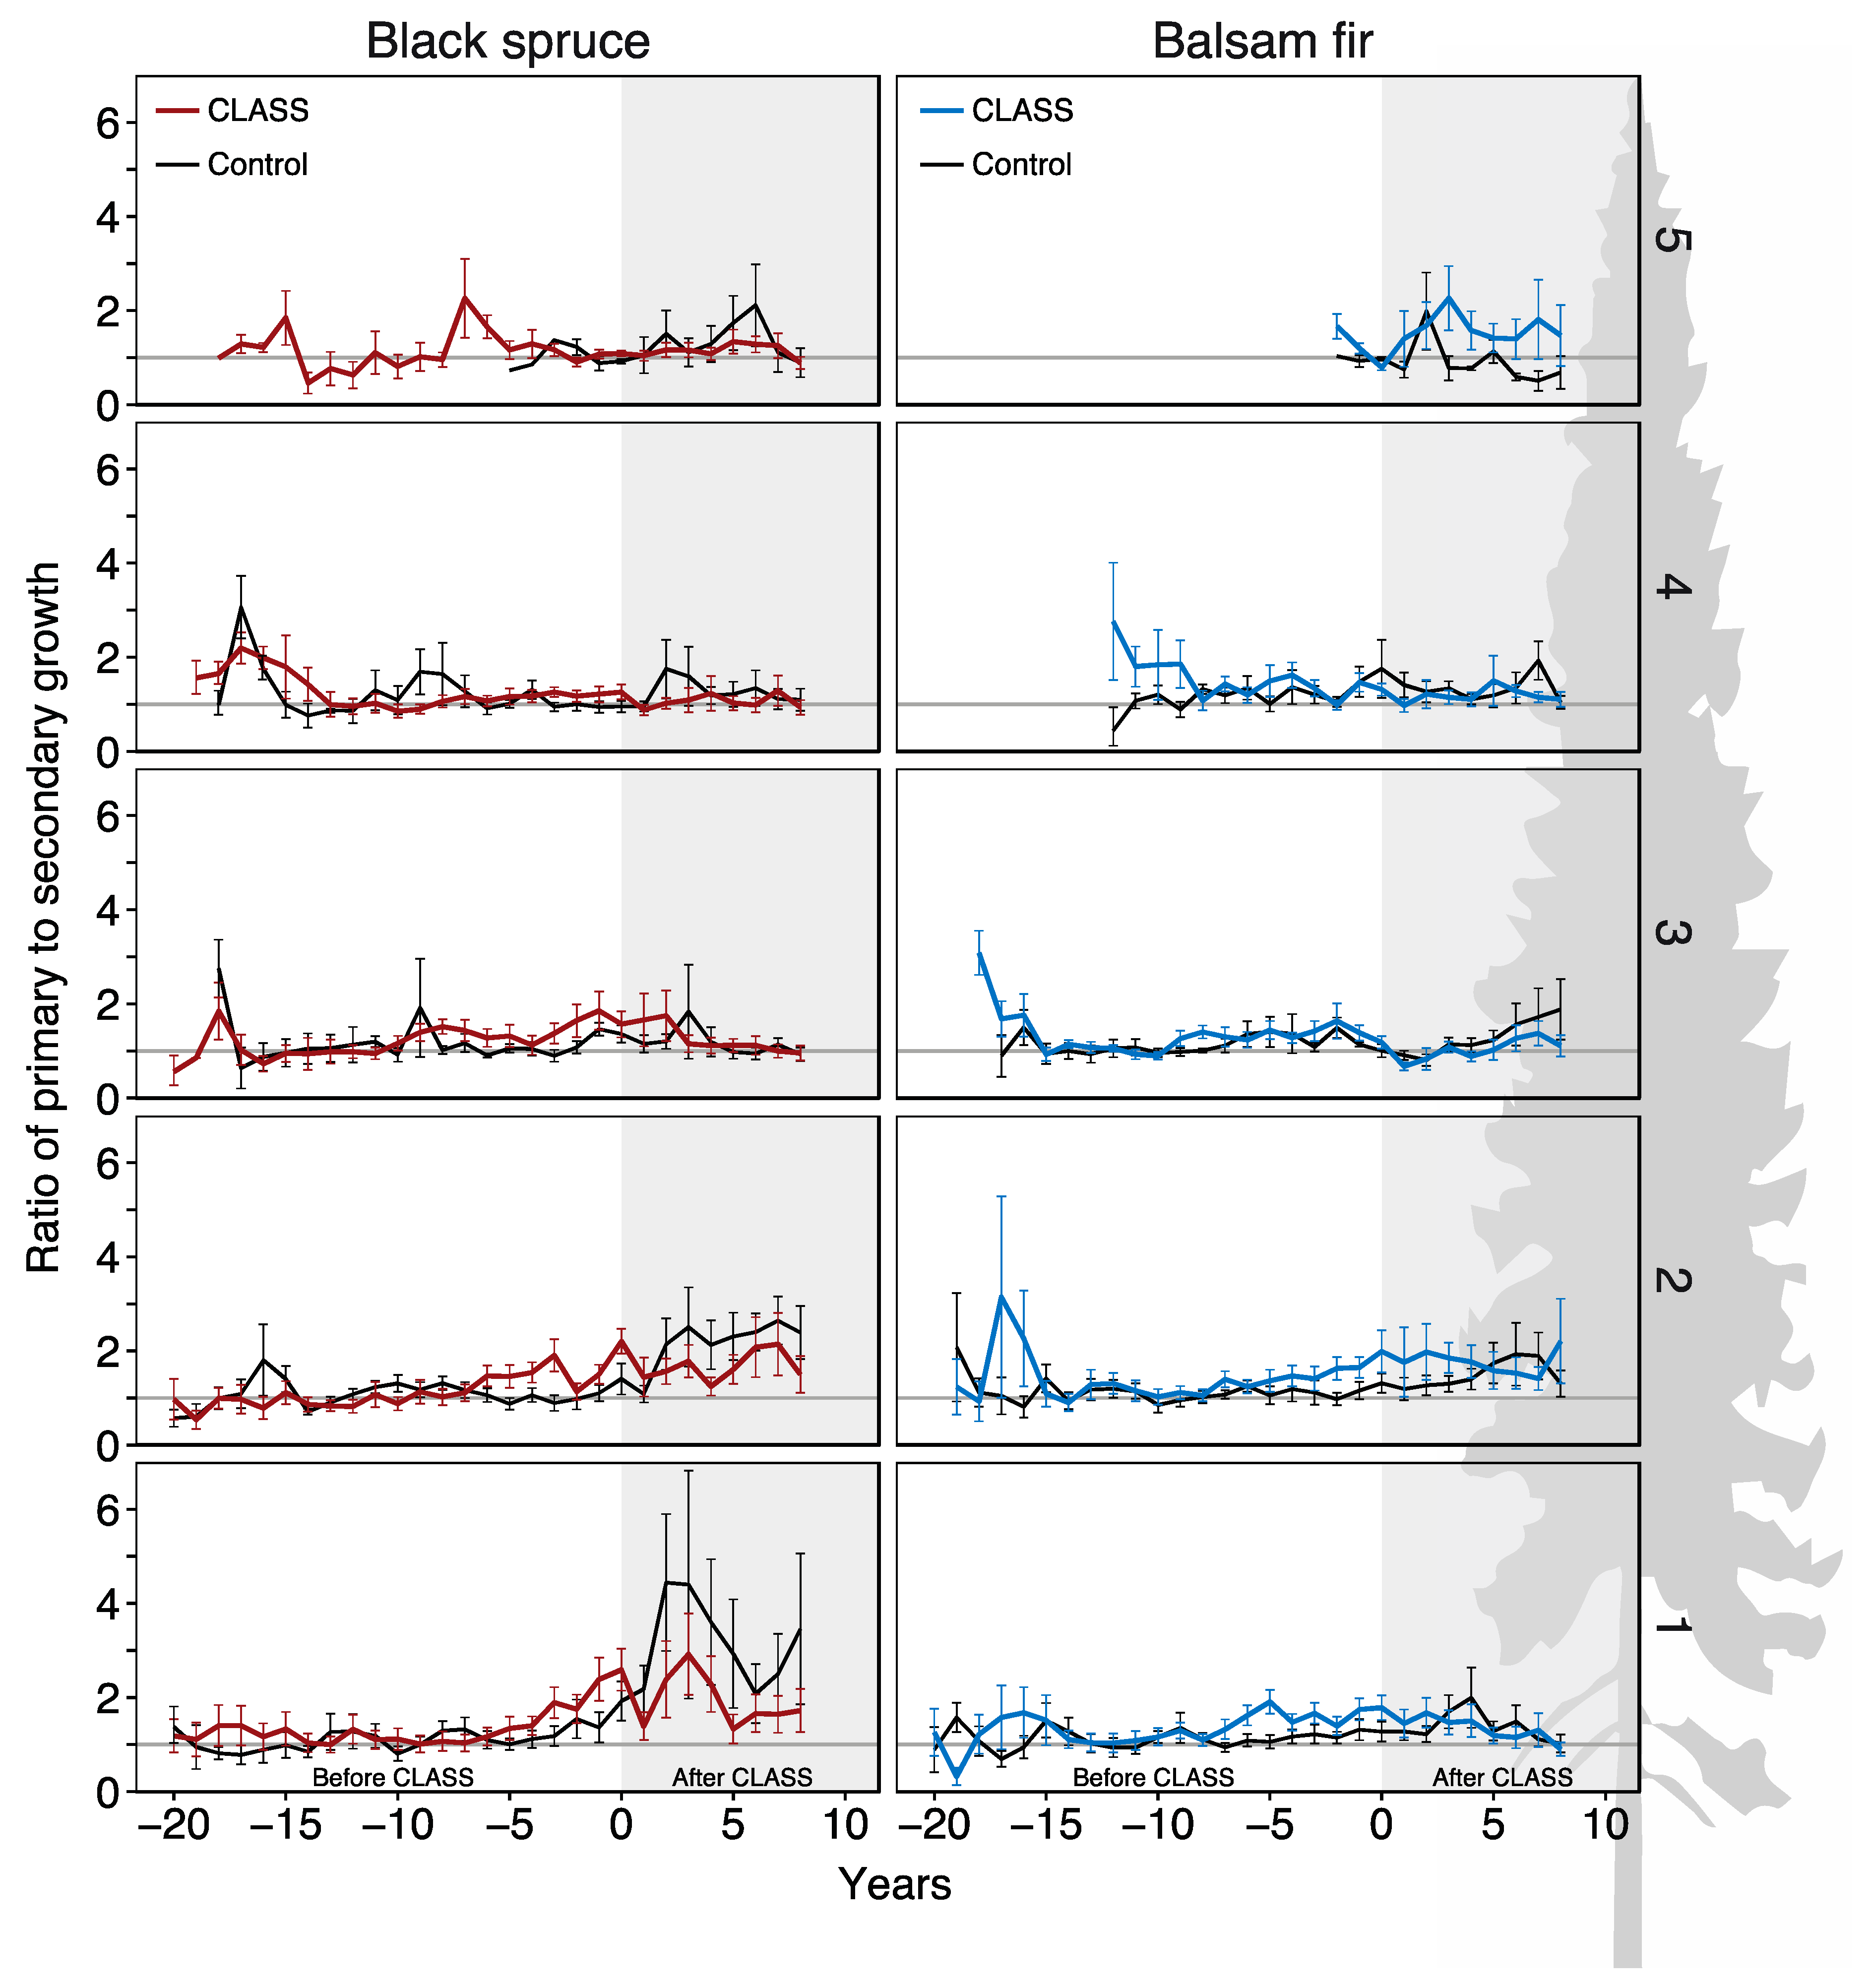
3.1. Branch Annual Increment

For both species, branch primary growth increased after CLASS in the lower part of the live crown (Figure 3). For black spruce, annual primary growth in branches was ca. 28 mm in the lower two sections of the crown in CLASS trees, an increase of 20% compared to increments before CLASS. No significant differences were observed between CLASS trees and control trees over time in the middle part of the black spruce crown, whereas primary growth at the top of the crown was lower for CLASS than for the control trees (Figure 3, Table 3). In balsam fir CLASS trees, primary growth averaged 35 mm at the base of the crown, a 20% increase compared to the pre-CLASS increments. We also observed significant differences between the CLASS and the control trees in the upper middle portion of the balsam fir crown, while no change was observed at the top of the crown (Figure 3, Table 3). A decrease in primary growth can be observed in the year immediately following the application of CLASS in every section of the live crown for both species, but more markedly in balsam fir (Figure 3). However, primary growth had returned to a pre-treatment level or higher by the following year.
As with primary growth, branch secondary growth differed significantly over time between the treated and control trees in the lower part of the tree crown. Before CLASS, secondary growth in branches was similar or lower in the treated trees (about 0.12 mm in black spruce, 0.15 mm in balsam fir) but started to increase following CLASS in the lower part of the live crown in both species (20% and 25% increase for black spruce and balsam fir, respectively; Figure 4). For black spruce branches, annual secondary growth indices were significantly higher after CLASS than for the control trees by the second year post-CLASS in the two lowest sections of the live crown. In balsam fir, secondary growth was significantly higher by the fourth year in CLASS trees, but only in the lowest section of the crown. Higher up the crown, branch secondary growth was similar between the treated and control trees for both species, and no significant differences were observed (Figure 4, Table 3).
As for the ratio of primary to secondary growth, no treatment effect was observed over the entire length of the live crown for both species (Table 4). Branches from the upper part of the crown in both treated and control trees presented a ratio of primary to secondary growth that remained relatively constant around 1 over time (Figure 5). In the lower part of the crown, especially for black spruce and in both CLASS and control trees, the ratio was >1, indicating a larger allocation to primary growth that is however unrelated to the treatment.

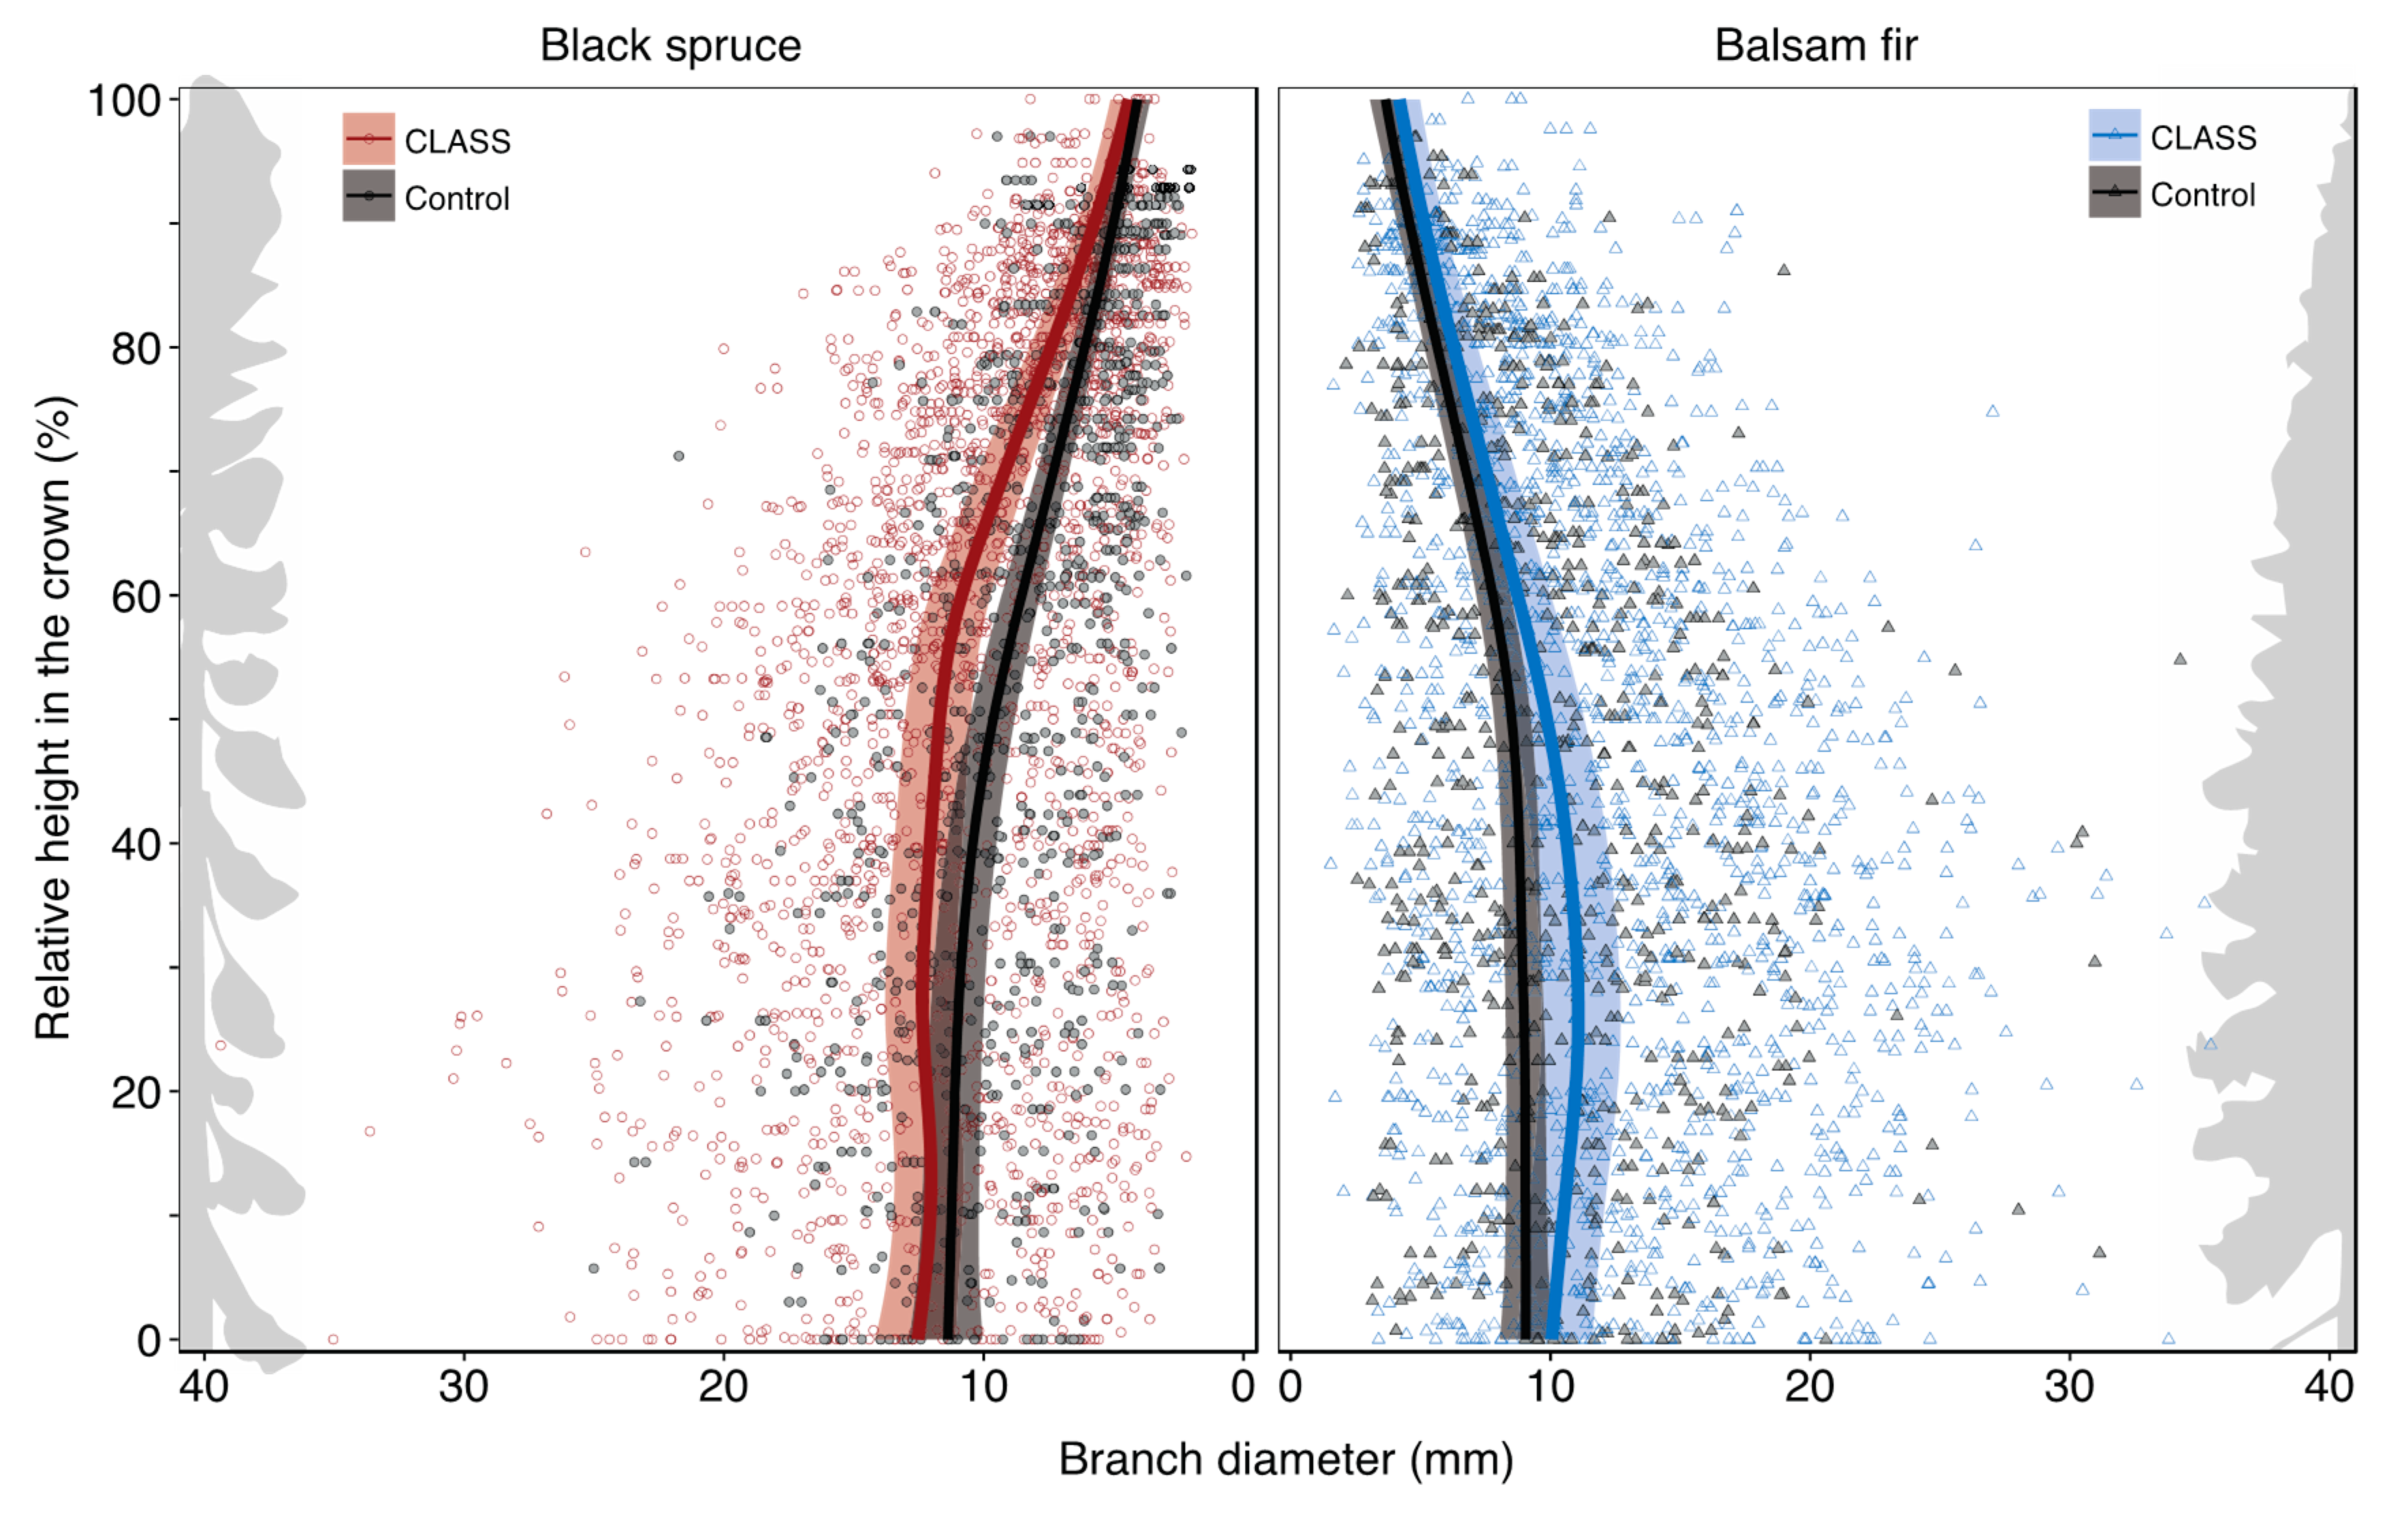
3.2. Branch Diameter

For the 5980 branches measured along the crown, diameter at the base of the branch varied from 2.0–39.4 mm in black spruce and 1.5–35.5 mm in balsam fir, with 90% of the measurements falling in the range of 5–20 mm (Figure 6). Branch diameter was about 1.5 mm higher in balsam fir than black spruce within the entire live crown.
In control trees, the smooth functions showed that the largest branches were located in the lower half of the crown, whereas in CLASS trees, the largest-diameter branches were found between 20% and 60% of the crown in black spruce and between 10% and 50% in balsam fir. The largest differences between treated and control trees were in the upper middle of the crown for black spruce (55%–75% of the crown), whereas for balsam fir, the largest differences were found in the lower middle portion of the live crown (24%–38% of the crown). Differences between treatments were significant for black spruce (p < 0.0001) but not for balsam fir (p = 0.0968).

4. Discussion

4.1. Branch Annual Increment

At the branch level, the reaction to the canopy opening after CLASS was present mainly in the lower part of the live crown. The increase in branch growth in the lower crown, observed after a delay of two to five years, is synchronous with growth in the stem following CLASS [4,35]. Stem and branch growth are visibly related, and the factors that influence stem growth affect branch growth in a similar way, as observed in previous studies [8,36,37,38].
Forward and Nolan [37], Mäkinen [38] and Weiskittel et al. [39] also noted that it is mainly the middle and lower branches of the crown that take advantage of a canopy opening after a reduction in stand density by an increase in their radial and length growth. As for the branches of the upper crown, they did not increase in growth after CLASS because, as suggested by some authors [8,38], they were already receiving full sunlight and were not subject to strong competition from nearby trees, even before CLASS. Our results match those of other studies in which branch size in the upper crown does not differ between different thinning intensities [8,39], and confirm that branch growth in the upper crown is not closely related to between-tree competition [27]. Branches that were shaded by the younger branches of the tree or by branches from competing adjacent trees were those that most benefited from the increase in light availability post-CLASS. This indicates that light availability may be the most important factor for branch growth [40].
CLASS could have the effect of allowing formerly suppressed lower branches to remain alive and develop [38,41,42,43]. In the longer term, this may increase knot size [44] and thus reduce wood quality and product value [11]. However, even though secondary growth was significantly higher than before treatment, the growth increments that we measured in the lower branches of the crown after CLASS were still very low (averaging 0.1–0.2 mm year−1 for black spruce, 0.15–0.25 mm year−1 for balsam fir). At these rates, several years would be required to significantly alter knot size. It is likely that the canopy will have time to close and branch secondary growth to return to pre-treatment values before the size of these branches can become large enough to degrade wood quality.
In some instances, thinning can reduce tree growth, especially height increment. This phenomenon, fairly common after thinning or partial cutting such as CLASS, is often referred to as ‘thinning shock’, and it generally results in a few years of slower primary growth immediately after canopy opening [45]. Thinning shock could explain the primary growth decrease in the year immediately following CLASS, which was clearly visible in the treated trees of our study (Figure 3). This decrease, which occurred over the entire length of the live crown, lasted only one year and was more pronounced in balsam fir. The opening created by CLASS and the sudden increase in available sunlight could have provoked a thinning shock for the residual trees of the stand, and these trees required a year to adapt and take full advantage of their new environment. The cause and mechanisms of thinning shock have not been established, although some hypotheses have been put forward, including sunscald, damage to needles by sudden exposure to intense solar radiation, hormonal effects related to increased light exposure, and an increased allocation of assimilated carbon to roots, buds, or respiration [43,46]. Another plausible cause for the primary growth reduction observed in the first year after CLASS could be a reaction of thigmomorphogenesis [47,48,49] triggered by increased wind exposure within the entire live crown post-CLASS. A thigmomorphogenesis reaction is consistent with our results and could have led to a reduced primary growth and an a more prominent secondary growth that strengthens and stiffens the branch so that it becomes better able to withstand wind stimuli and support the increased foliage biomass and branch length resulting from CLASS [7,43]. However, the absence of a treatment effect in the ratio of primary to secondary growth after CLASS indicates that for the first few years after the silvicultural treatment, residual trees did not modify the allocation to primary and secondary growth, except maybe for that single year immediately following CLASS.
Silvicultural treatments such as CLASS create an opening in the canopy and an increase in light availability, especially for lower branches. This modification in the microclimatic conditions can increase the frequency of ramification and the foliage mass in branches, and improve light interception [43,50]. In the years post-CLASS, trees probably exploit the newly available space and sunlight by increasing the ramification of the branches and the subsequent development of these new shoots in addition to the elongation the apical shoot of the main axis of the branch [50,51]. Niinemets and Lukjanova [10] showed that high-intensity light stimulated branching in several tree species. A proportionally increased secondary growth and larger branch diameters are thus necessary to mechanically support the increased weight resulting from these changes in branch dimensions, and to increase resistance to wind forces sustained by the more isolated and exposed crown in the first few years. Besides the mechanical importance, the larger secondary growth also has a physiological importance. More resources invested in secondary growth implies that more cells are produced by the vascular cambium of the branches [5]. These additional cells can transport more water to the site of photosynthesis. Several studies have demonstrated that photosynthesis rates are enhanced after thinning, but mainly in the lower portion of the crown [52,53]. The increase in photosynthesis is probably due to the new ramifications in branches that have formed new needles, since thinning generally increases photosynthesis only in current- and one-year needles [54]. This increase in photosynthesis probably also contributes to keeping the lower branches alive and delaying crown recession.

4.2. Branch Diameter

The size of branches, or knots in finished products, is a critical factor affecting the quality and value of wood [11]. Branch size increases when the space between trees increases either through thinning or initial spacing [8,55,56,57]. We did observe an increase in branch secondary growth in the years after CLASS. In Figure 6, the resulting increase in branch diameter of black spruce appears large enough to create a significant difference between the treated and control trees nearly ten years post-CLASS. However, the branches in the upper three sections of the canopy in black spruce CLASS trees were older than the branches of the control trees (Figure 3 and Figure 4). Therefore, these branches accumulated growth for some years before the control trees, which could explain the significantly higher diameters observed in treated trees in the upper middle part of the crown. The fact that the significant secondary growth increases observed in CLASS trees were located in the lower part of the crown (Figure 4) also supports this explanation.
Although the average branch diameter for both species was slightly higher in trees of the CLASS treatment, the impact on wood quality will be mitigated by the fact that larger stems are also observed after CLASS [4,6,35]. Larger-diameter stems allow the production of wider lumber widths for which larger knots are tolerated [11,58].

5. Conclusions

Careful logging around small merchantable stems (CLASS) affects branch growth, but only in the middle and lower portions of the live crown of black spruce and balsam fir trees. In these lower portions of the crown, both the primary and secondary growth of branches increased significantly after CLASS, but the ratio of primary to secondary growth remained unaffected by CLASS. This may allow lower branches to remain alive for a longer period and delay crown recession [7,57]. The increase in diameter growth of these lower branches is not enough to degrade wood quality or alter the potential wood use ten years post-treatment and probably for even a longer period.

Author Contributions

C.K. and A.L. conceived and designed the experiments; A.L. and C.K. collected the samples for analyses; measurements were performed by A.L.; A.L. analyzed the data with input from A.A.; A.L. wrote the paper with input from C.K. and A.A. Funding was acquired by C.K.

Funding

This research was funded by the Natural Sciences and Engineering Research Council of Canada (NSERC) and by Gouvernement du Québec (Ministère des Forêts, de la Faune et des Parcs).

Acknowledgments

The authors wish to thank Manon Vincent, Émilie Pamerleau-Couture, Isabelle Grenon, Charles-Augustin Déry-Bouchard, Maxime Tremblay and Jean-Guy Girard for their help during fieldwork, and Boris Luszczynski, Mireille Boulianne and Marie-Josée Tremblay for their assistance in the lab. We would also like to thank François Rousseau for statistical advice, Murray Hay for checking the English text, and the two anonymous reviewers who provided helpful comments to improve the manuscript.

Conflicts of Interest

The authors declare no conflicts of interest.

References

  1. Riopel, M.; Bégin, J.; Ruel, J.-C. Probabilités de pertes des tiges individuelles, cinq ans après des coupes avec protection des petites tiges marchandes, dans des forêts résineuses du Québec. Can. J. For. Res. 2010, 40, 1458–1472. [Google Scholar] [CrossRef]
  2. Ministère des Ressources Naturelles. Coupe avec Protection des Petites Tiges Marchandes (CPPTM)—Avis Scientifique; Comité Consultatif Scientifique du Manuel d’Aménagement Forestier; Gouvernement du Québec, Direction de la Recherche Forestière: Québec, QC, Canada, 2002; 146p.
  3. Pothier, D.; Doucet, R.; Boily, J. The effect of advance regeneration height on future yield of black spruce stands. Can. J. For. Res. 1995, 25, 536–544. [Google Scholar] [CrossRef]
  4. Lemay, A.; Krause, C.; Achim, A.; Bégin, J. Growth and wood quality of black spruce and balsam fir following careful logging around small merchantable stems (CLASS) in the boreal forest of Quebec, Canada. Forestry 2018, 91, 271–282. [Google Scholar] [CrossRef]
  5. Lemay, A.; Krause, C.; Rossi, S.; Achim, A. Xylogenesis in stems and roots after thinning in the boreal forest of Quebec, Canada. Tree Physiol. 2017, 37, 1554–1563. [Google Scholar] [CrossRef] [PubMed]
  6. Pamerleau-Couture, É.; Krause, C.; Pothier, D.; Weiskittel, A.R. Effect of three partial cutting practices on stand structure and growth of residual black spruce trees in north-eastern Quebec. Forestry 2015, 88, 471–483. [Google Scholar] [CrossRef] [Green Version]
  7. Baldwin, V.C.; Peterson, K.D.; Clark, A.; Ferguson, R.B.; Strub, M.R.; Bower, D.R. The effects of spacing and thinning on stand and tree characteristics of 38-year-old Loblolly Pine. For. Ecol. Manag. 2000, 137, 91–102. [Google Scholar] [CrossRef]
  8. Mäkinen, H.; Hein, S. Effect of wide spacing on increment and branch properties of young Norway spruce. Eur. J. For. Res. 2006, 125, 239–248. [Google Scholar] [CrossRef]
  9. Zhang, S.Y.; Chauret, G.; Ren, H.Q.; Desjardins, R. Impact of initial spacing on plantation black spruce lumber grade yield, bending properties, and MSR yield. Wood Fiber Sci. 2002, 34, 460–475. [Google Scholar]
  10. Niinemets, Ü.; Lukjanova, A. Needle longevity, shoot growth and branching frequency in relation to site fertility and within-canopy light conditions in Pinus sylvestris. Ann. For. Sci. 2003, 30, 195–208. [Google Scholar] [CrossRef]
  11. Jozsa, L.A.; Middleton, G.R. A Discussion of Wood Quality Attributes and Their Practical Implications; Special Publication No. SP-34; Forintek Canada Corp.: Vancouver, BC, Canada, 1994; 42p. [Google Scholar]
  12. MacDonald, E.; Hubert, J. A review of the effects of silviculture on timber quality of Sitka spruce. Forestry 2002, 75, 107–138. [Google Scholar] [CrossRef] [Green Version]
  13. Weiskittel, A.R.; Seymour, R.S.; Hofmeyer, P.V.; Kershaw, J.A. Modelling primary branch frequency and size for five conifer species in Maine, USA. For. Ecol. Manag. 2010, 259, 1912–1921. [Google Scholar] [CrossRef]
  14. Hein, S.; Makinen, H.; Yue, C.F.; Kohnle, U. Modelling branch characteristics of Norway spruce from wide spacings in Germany. For. Ecol. Manag. 2007, 242, 155–164. [Google Scholar] [CrossRef]
  15. Auty, D.; Weiskittel, A.R.; Achim, A.; Moore, J.R.; Gardiner, B.A. Influence of early re-spacing on Sitka spruce branch structure. Ann. For. Sci. 2012, 69, 93–104. [Google Scholar] [CrossRef]
  16. Grace, J.C.; Brownlie, R.K.; Kennedy, S.G. The influence of initial and post-thinning stand density on Douglas-fir branch diameter at two sites in New Zealand. N. Z. J. Forest. Sci. 2015, 45, 14. [Google Scholar] [CrossRef] [Green Version]
  17. Wang, C.-S.; Tang, C.; Hein, S.; Guo, J.-J.; Zhao, Z.-G.; Zeng, J. Branch development of five-year-old Betula alnoides plantations in response to planting density. Forests 2018, 9, 42. [Google Scholar] [CrossRef]
  18. Viereck, L.A.; Johnston, W.F. Picea mariana (Mill.) B. S. P. Black spruce. In Silvics of North America, Volume 1: Conifers; Burns, R.M., Honkala, B.H., Eds.; Agriculture Handbook 654; U.S. Department of Agriculture, Forest Service: Washington, DC, USA, 1990; Volume 1, pp. 227–237. [Google Scholar]
  19. Zhang, S.Y.; Koubaa, A. Softwoods of Eastern Canada: Their Silvics, Characteristics, Manufacturing and End-Uses; FPInnovations: Quebec, QC, Canada, 2008; 363p. [Google Scholar]
  20. Sullivan, J.H.; Peterson, K.M. The importance of seedling competition in the segregation of spruce and fir in the southern Appalachians. New For. 1994, 8, 105–121. [Google Scholar] [CrossRef]
  21. Frank, R.M. Abies balsamea (L.) Mill. Balsam fir. In Silvics of North America, Volume 1: Conifers; Burns, R.M., Honkala, B.H., Eds.; Agriculture Handbook 654; U.S. Department of Agriculture, Forest Service: Washington, DC, USA, 1990; Volume 1, pp. 26–35. [Google Scholar]
  22. Riopel, M.; Bégin, J.; Ruel, J.-C. Coefficients de distribution de la régénération, cinq ans après des coupes avec protection des petites tiges marchandes appliquées dans des sapinières et des pessières noires du Québec. For. Chron. 2011, 87, 669–683. [Google Scholar] [CrossRef]
  23. Luszczynski, B. Croissance des Branches et des Tiges d’Épinette Noire: Effet de la Tordeuse des Bourgeons de l’Épinette et de l’Éclaircie Commerciale. Master’s thesis, Université du Québec à Chicoutimi, Chicoutimi, QC, Canada, 2009. [Google Scholar]
  24. Methods of Dendrochronology. Applications in the Environmental Sciences; Cook, E.R.; Kairiukstis, L.A. (Eds.) Springer Science+Business Media: Dordrecht, The Netherlands, 1990; 394p. [Google Scholar]
  25. Krause, C.; Luszczynski, B.; Morin, H.; Rossi, S.; Plourde, P.Y. Timing of growth reductions in black spruce stem and branches during the 1970s spruce budworm outbreak. Can. J. For. Res. 2012, 42, 1220–1227. [Google Scholar] [CrossRef]
  26. Du, S.; Yamamoto, F. An overview of the biology of reaction wood formation. J. Integr. Plant Biol. 2007, 49, 131–143. [Google Scholar] [CrossRef]
  27. Hein, S.; Weiskittel, A.R.; Kohnle, U. Branch characteristics of widely spaced Douglas-fir in south-western Germany: Comparisons of modelling approaches and geographic regions. For. Ecol. Manag. 2008, 256, 1064–1079. [Google Scholar] [CrossRef]
  28. Pinheiro, J.; Bates, D.; DebRoy, S.; Sarkar, D.; R Core Team. Package ‘nlme’: Linear and Nonlinear Mixed Effects Models; R Package Version 3.1-137; R Foundation for Statistical Computing: Vienna, Austria, 2018; Available online: https://CRAN.R-project.org/package=nlme (accessed on 8 May 2019).
  29. R Core Team. R: A Language and Environment for Statistical Computing. R Foundation for Statistical Computing; R Core Team: Vienna, Austria, 2018. [Google Scholar]
  30. Quinn, G.P.; Keough, M.J. Experimental Design and Data Analysis for Biologists; Cambridge University Press: Cambridge, UK, 2002; 537p. [Google Scholar]
  31. Hastie, T.J.; Tibshirani, R.J. Generalized Additive Models; Chapman & Hall: London, UK, 1990; 352p. [Google Scholar]
  32. Rose, N.L.; Yang, H.; Turner, S.D.; Simpson, G.L. An assessment of the mechanisms for the transfer of lead and mercury from atmospherically contaminated organic soils to lake sediments with particular reference to Scotland, UK. Geochim. Cosmochim. Acta 2012, 82, 113–135. [Google Scholar] [CrossRef]
  33. Wood, S. Package ‘mgcv’: Mixed GAM Computation Vehicle with Automatic Smoothness Estimation; R Package Version 1.8-23; R Foundation for Statistical Computing: Vienna, Austria, 2018; Available online: https://CRAN.R-project.org/package=mgcv (accessed on 8 May 2019).
  34. Breheny, P.; Burchett, W. Visualization of Regression Models Using visreg. R J. 2017, 9, 56–71. [Google Scholar] [CrossRef]
  35. Thorpe, H.C.; Thomas, S.C.; Caspersen, J.P. Residual-tree growth responses to partial stand harvest in the black spruce (Picea mariana) boreal forest. Can. J. For. Res. 2007, 37, 1563–1571. [Google Scholar] [CrossRef]
  36. Hein, S.; Weiskittel, A.R.; Kohnle, U. Effect of wide spacing on tree growth, branch and sapwood properties of young Douglas-fir [Pseudotsuga menziesii (Mirb.) Franco] in south-western Germany. Eur. J. For. Res. 2008, 127, 481–493. [Google Scholar] [CrossRef]
  37. Forward, D.F.; Nolan, N.J. Growth and morphogenesis in the Canadian forest species. V. Further studies of wood growth in branches and mean axis of Pinus resinosa Ait. under conditions of open growth, suppession, and release. Can. J. Bot. 1961, 39, 413–436. [Google Scholar]
  38. Mäkinen, H. Effect of stand density on radial growth of branches of Scots pine in southern and central Finland. Can. J. For. Res. 1999, 29, 1216–1224. [Google Scholar] [CrossRef]
  39. Weiskittel, A.R.; Maguire, D.A.; Monserud, R.A. Modeling crown structural responses to competing vegetation control, thinning, fertilization, and Swiss needle cast in coastal Douglas-fir of the Pacific Northwest, USA. For. Ecol. Manag. 2007, 245, 96–109. [Google Scholar] [CrossRef]
  40. Mäkinen, H. Effect of stand density on the branch development of silver birch (Betula pendula Roth) in central Finland. Trees-Struct. Funct. 2002, 16, 346–353. [Google Scholar]
  41. Duchateau, E.; Auty, D.; Mothe, F.; Longuetaud, F.; Ung, C.H.; Achim, A. Models of knot and stem development in black spruce trees indicate a shift in allocation priority to branches when growth is limited. PeerJ 2015, 3, e873. [Google Scholar] [CrossRef] [Green Version]
  42. Weiskittel, A.R.; Maguire, D.A.; Monserud, R.A. Response of branch growth and mortality to silvicultural treatments in coastal Douglas-fir plantations: Implications for predicting tree growth. For. Ecol. Manag. 2007, 251, 182–194. [Google Scholar] [CrossRef]
  43. Brix, H. Effects of thinning and nitrogen fertilization on branch and foliage production in Douglas-fir. Can. J. For. Res. 1981, 11, 502–511. [Google Scholar] [CrossRef]
  44. Benjamin, J.G.; Kershaw, J.A.; Weiskittel, A.R.; Chui, Y.H.; Zhang, S.Y. External knot size and frequency in black spruce trees from an initial spacing trial in Thunder Bay, Ontario. For. Chron. 2009, 85, 618–624. [Google Scholar] [CrossRef] [Green Version]
  45. Harrington, C.A.; Reukema, D.L. Initial shock and long-term stand development following thinning in a Douglas-fir plantation. For. Sci. 1983, 29, 33–46. [Google Scholar]
  46. Emmingham, W.H.; Elwood, N.E. Thinning—An Important Timber Management Tool; Pacific Northwest Extension Publication 184; Oregon State University: Corvallis, OR, USA, 1983; 8p. [Google Scholar]
  47. Jaffe, M.J. Morphogenetic responses of plants to mechanical stimuli or stress. BioScience 1980, 30, 239–243. [Google Scholar] [CrossRef]
  48. Telewski, F.W.; Jaffe, M.J. Thigmomorphogenesis: Field and laboratory studies of Abies fraseri in response to wind or mechanical perturbation. Physiol. Plant. 1986, 66, 211–218. [Google Scholar] [CrossRef] [PubMed]
  49. Telewski, F.W.; Jaffe, M.J. Thigmomorphogenesis: Anatomical, morphological and mechanical analysis of genetically different sibs of Pinus taeda in response to mechanical perturbation. Physiol. Plant. 1986, 66, 219–226. [Google Scholar] [CrossRef] [PubMed]
  50. Valladares, F.; Niinemets, Ü. The Architecture of Plant Crowns: From Design Rules to Light Capture and Performance. In Functional Plant Ecology, 2nd ed.; CRC Press/Taylor & Francis Group: Boca Raton, FL, USA, 2007; pp. 101–149. [Google Scholar]
  51. Chen, L.; Sumida, A. Effects of light on branch growth and death vary at different organization levels of branching units in Sakhalin spruce. Trees 2018, 32, 1123–1134. [Google Scholar] [CrossRef]
  52. Peterson, J.A.; Seiler, J.R.; Nowak, J.; Ginn, S.E.; Kreh, R.E. Growth an physiological responses of young loblolly pine stands to thinning. For. Sci. 1997, 43, 529–534. [Google Scholar]
  53. Tang, Z.; Chambers, J.L.; Guddanti, S.; Barnett, J.P. Thinning, fertilization, and crown position interact to control physiological responses of loblolly pine. Tree Physiol. 1999, 19, 87–94. [Google Scholar] [CrossRef] [Green Version]
  54. Li, R.-S.; Yang, Q.-P.; Zhang, W.-D.; Zheng, W.-H.; Chi, Y.-G.; Xu, M.; Fang, Y.-T.; Gessler, A.; Li, M.-H.; Wang, S.-L. Thinning effect on photosynthesis depends on needle ages in a Chinese fir (Cunninghamia lanceolata) plantation. Sci. Total Environ. 2017, 580, 900–906. [Google Scholar] [CrossRef]
  55. Weiskittel, A.R.; Kenefic, L.S.; Seymour, R.S.; Phillips, L.M. Long-term effects of precommercial thinning on the stem dimensions, form and branch characteristics of red spruce and balsam fir crop trees in Maine, USA. Silva. Fenn. 2009, 43, 397–409. [Google Scholar] [CrossRef]
  56. Bendtsen, B.A. Properties of wood from improved and intensively managed trees. For. Prod. J. 1978, 28, 61–72. [Google Scholar]
  57. Maguire, D.A.; Kershaw, J.A.; Hann, D.W. Predicting the effects of silvicultural regime on branch size and crown wood core in Douglas-fir. For. Sci. 1991, 37, 1409–1428. [Google Scholar]
  58. Lowell, E.; Maguire, D.; Briggs, D.; Turnblom, E.; Jayawickrama, K.; Bryce, J. Effects of Silviculture and Genetics on Branch/Knot Attributes of Coastal Pacific Northwest Douglas-Fir and Implications for Wood Quality—A Synthesis. Forests 2014, 5, 1717–1736. [Google Scholar] [CrossRef]
Figure 1. Location of the four sampling sites in the Saguenay–Lac-Saint-Jean (B3, B10, B20) and Côte-Nord (B4) regions of Quebec, Canada.
Forests 10 00500 g001
Figure 2. Determination of branch annual primary growth in: (a) a normal branch; (b) in a branch containing a problematic area (non-visible terminal bud scars). Adapted from Luszczynski [23].
Forests 10 00500 g002
Figure 3. Mean branch primary growth index (± se) in the five sections of the live crown for black spruce and balsam fir before and after CLASS. The grey area represents the years post-treatment, with Year 0 being the treatment year. Stars indicate a significant difference between the treated and control trees for a given year, obtained from the contrasts. The missing data for the years before treatment for branches from the highest two sections indicates that these are newly formed branches.
Forests 10 00500 g003
Figure 4. Mean branch secondary growth index (± se) in the five sections of the live crown for black spruce and balsam fir before and after CLASS. The grey area represents the years post-treatment, with Year 0 being the treatment year. Stars indicate a significant difference between the treated and control trees for a given year, obtained from the contrasts. The missing data for the years before treatment for branches from the highest two sections indicates that these are newly formed branches.
Forests 10 00500 g004
Figure 5. Mean ratio of primary to secondary growth (± se) of branches in the five sections of the live crown for black spruce and balsam fir before and after CLASS. The grey area represents the years post-treatment, with Year 0 being the treatment year.
Forests 10 00500 g005
Figure 6. Conditional plot of the effect of relative branch height in the crown on branch diameter for all the control and treated trees of black spruce and balsam fir obtained from the generalized additive model (GAM) when all other predictor variables are held fixed at their median value. Diameter of all branches measured along the live crown are superimposed. Shaded bands represent the 95% confidence interval.
Forests 10 00500 g006
Table 1. Description of sampling sites before and after careful logging around small merchantable stems (CLASS). Merchantable refers to stems with a DBH > 9.1 cm. BS = Black spruce, BF = Balsam fir.
Before CLASSAfter CLASS
SiteStand CompositionBasal Area
(m² ha−1)
Merchantable Density
(stems ha−1)
Merchantable Volume
(m³ ha−1)
Residual Basal Area
(m² ha−1)
Merchantable Volume Harvested
(%)
Merchantable Density
(stems ha−1)
B374% BS
26% BF
2069145.210.679.0652
B467% BS
33% BF
26.01091156.58.284.5466
B1062% BS
38% BF
39.81947147.013.480.0788
B2058% BS
42% BF
39.42036132.016.672.01010
† Information not available.
Table 2. Characteristics of the black spruce and balsam fir trees sampled in the CLASS and control plots in the four study sites.
Black SpruceBalsam Fir
SiteTreatmentMean Age
(years)
Mean DBH
(cm)
Mean Height
(m)
Crown Ratio
(%)
Mean Age
(years)
Mean DBH
(cm)
Mean Height
(m)
Crown Ratio
(%)
B3CLASS85.012.79.558.6104.712.37.855.8
Control92.011.110.140.2117.710.68.348.7
B4CLASS171.813.710.266.7116.414.38.767.1
Control173.014.211.362.1119.713.18.274.1
B10CLASS87.212.99.072.697.913.39.557.2
Control90.311.89.459.3100.711.79.053.2
B20CLASS126.213.610.464.3123.311.88.158.9
Control78.713.29.565.3103.311.38.859.8
CLASS117.613.29.865.5110.612.98.559.7
Control108.512.610.156.7110.311.78.659.0
Table 3. Results from mixed model of the branch annual primary and secondary growth along the live crown for black spruce and balsam fir in the years after CLASS. Section 1 represents the base of the crown, and Section 5 represents the top of the tree. Significant results are presented in bold.
Black SpruceBalsam Fir
Crown SectionSourceDFFProb > FDFFProb > F
Annual primary growth indexSection 5Treatment12.050.163715.580.0457
Year76.84<0.000176.19<0.0001
Treatment × Year76.23<0.000171.230.3017
Section 4Treatment11.370.247911.430.2382
Year77.26<0.000178.62<0.0001
Treatment × Year70.600.748572.560.0145
Section 3Treatment10.260.612410.110.7328
Year73.070.0039711.23<0.0001
Treatment × Year70.720.653772.550.0145
Section 2Treatment16.180.017211.360.2484
Year75.73<0.0001712.90<0.0001
Treatment × Year72.380.0222711.70<0.0001
Section 1Treatment14.070.049912.650.1100
Year73.840.000575.87<0.0001
Treatment × Year72.500.016374.320.0001
Annual secondary growth indexSection 5Treatment10.150.699311.530.2556
Year73.960.000471.240.2913
Treatment × Year71.450.187371.220.3034
Section 4Treatment10.010.897710.030.8519
Year72.460.017973.100.0037
Treatment × Year70.270.964970.480.8434
Section 3Treatment10.520.473713.250.0782
Year70.950.463477.61<0.0001
Treatment × Year70.560.786270.670.6912
Section 2Treatment116.170.000211.400.2424
Year71.710.104772.730.0090
Treatment × Year75.24<0.000170.980.4428
Section 1Treatment110.310.002613.670.0618
Year74.79<0.0001710.69<0.0001
Treatment × Year73.100.003574.260.0002
Table 4. Results from mixed model of the ratio of primary to secondary growth along the live crown for black spruce and balsam fir in the years after CLASS. Section 1 represents the base of the crown, and Section 5 represents the top of the tree. Significant results are presented in bold.
Black SpruceBalsam Fir
Crown SectionSourceDFFProb > FDFFProb > F
Ratio of primary to secondary growthSection 5Treatment10.800.379210.010.9352
Year72.530.016271.200.3137
Treatment × Year70.860.540871.680.1286
Section 4Treatment12.050.159612.590.1158
Year71.450.183971.480.1758
Treatment × Year70.640.719671.120.3538
Section 3Treatment10.070.793513.760.0591
Year71.780.090678.12<0.0001
Treatment × Year70.550.793670.470.8586
Section 2Treatment11.850.180510.490.4886
Year74.93<0.000173.690.0008
Treatment × Year70.300.952271.480.1746
Section 1Treatment13.710.061212.650.1112
Year72.550.014970.890.5161
Treatment × Year70.740.634870.560.7888

