Article

Transcriptome Analysis of a Multiple-Branches Mutant Terminal Buds in Betula platyphylla × B. pendula

1
State Key Laboratory of Tree Genetics and Breeding, Northeast Forestry University, 26 Hexing Road, Harbin 150040, China
2
North Minzu University, 204 Wenchang North Street, Ningxia Hui Autonomous Region 750021, China
*
Author to whom correspondence should be addressed.
Forests 2019, 10(5), 374; https://doi.org/10.3390/f10050374
Submission received: 31 March 2019 / Revised: 12 April 2019 / Accepted: 25 April 2019 / Published: 28 April 2019
(This article belongs to the Section Forest Ecophysiology and Biology)

Abstract

:
To investigate the molecular mechanism of the mutation of a multiple-branches birch mutant (br), we explored genes that were genome-wide differentially expressed in the main and lateral branches’ apical buds of br. The plant architecture not only has effects on the process of plant growth and development, but also affects the agronomic characters. In woody plants, branches determine the application value of timber. Therefore, analyzing genes that were differentially expressed in br apical buds will bring new insights to understand the molecular basis of plant architecture alteration. Wild type (WT) birch, Cinnamoyl-CoA reductase 1 (CCR1)-overexpressed transgenic birch (OE2) and the mutant br were used as materials to observe phenotype differences between br and the control lines (WT and OE2). The transcriptome sequencing of the main and lateral branches’ apical buds of br and controls were further performed to explore genes that were genome-wide differentially expressed in br. Compared to the control lines, br exhibited a multiple-branches and dwarf phenotype. In addition, biomass, rooting number, leaf area, internal diameter, and external diameter of stomata, and the size of terminal buds of br were less than that of WT and OE2. Transcriptome analysis results indicated that gene expression profiles of br were different from the control lines. The genes that were differentially expressed in br apical buds were involved in multiple pathways, including organogenesis, fertility regulation, cell division and differentiation, plant hormone biosynthesis, and signal transduction. The multiple-branches, dwarf, and small leaves and buds of br might be due to the differentially expressed genes (DEGs) involved in organogenesis, cell division and differentiation, plant hormone biosynthesis and signal transduction.

Graphical Abstract

1. Introduction

Plant tissues are derived from a group of cells called meristems that reside at the shoot tips and the root tips. The shoot apical meristem (SAM) is essential for the development of higher plants, and is responsible for the development of leaves, stems, and flowers. The SAM differentiates into leaf primordia at the vegetative growth stage, while it differentiates into inflorescence meristem, during the stage of transition from vegetative to reproductive growth. The axillary meristem (AM) can differentiate into the lateral bud primordia, which develops into the lateral buds and forms lateral branches of plants [1,2].
The growth and development of plants are determined by the structure and activity of SAM. Plant architecture and organ morphogenesis are influenced by both internal or environmental factors, including plant hormones, light, temperature, and other factors. The activity of SAM is inhibited by low temperature, short sunshine (SD) or dark treatment, and it can be recovered under appropriate photoperiod and temperature [3,4,5]. Plant hormones play key roles in plant growth and development, in regulating SAM differentiation and activity, through a complex signaling network. The polar transport and gradient distribution of auxin can affect the cell division and differentiation of SAM [6,7,8]. Cytokinin activates the cell division and differentiation of SAM, and it also influences the leaf morphology, inflorescence number, and plant architecture, during the subsequent growth process of plants [9,10]. In addition, gibberellin can initiate the activity of SAM and relieve the dormancy of buds [11,12].
The formation of SAM is a crucial biological process for plant development, which is determined by multiple genes, including genes involved in cell division and differentiation, hormone biosynthesis, and transduction. According to the cytoplasmic density and cell division rate, SAM is divided into three zones, including the peripheral zone (PZ), the central zone (CZ), and the rib zone (RZ) [13,14]. WUSCHEL (WUS) is critical for stem cell fate determination that specify the identity of SAM. Mutations in WUS exhibit the phenotype of misspecification of the stem cells [15]. CLAVATA (CLV1, CLV2, CLV3) genes promote the progression of meristem cells toward organ initiation. There is a negative feedback regulatory loop between WUS and CLV, to maintain the identity of SAM [16,17,18,19]. The class I KNOX family genes influence the differentiation of SAM via activation of Isopentenyltransferase 7 (IPT7) and Arabidopsis Response Regulator 5 (ARR5) and by repressing the GA 20-oxidases (GA20 ox) [20,21]. AIL genes Aintegumenta (ANT), Aintegumenta-like6 (AIL6), and Aintegumenta-like7 (AIL7) are involved in regulating the activity of SAM. In Arabidopsis thaliana, ant, ail6, and ail7, mutations show a reduced cell division in the meristem region, resulting in plants that initiate only a few leaves, prior to the termination of shoot apical meristem activity [22]. In addition, microRNAs could also regulate the activity of SAM by regulating its target genes. Squamosa Promoter Binding protein-like (SPL, target gene of miR156) and APETALA2 (AP2, target gene of miR172) could activate the transition from SAM into flowers. Cup-Shaped Cotyledon (CUC, target gene of miR164) genes are required for the formation of SAM [23,24,25,26].
RNA-sequencing (RNA-seq) can not only be used to characterize the overall pattern of gene transcription, but also can reveal the underlying molecular mechanism of plant development [27,28]. Betula platyphylla × B. pendula is a pioneer tree that can quickly establish forests after disturbance of wildfires or landslides, and it is also an important source of pulp and biofuels [29,30,31]. In our previous study, we identified a dwarf and multiple-branches mutant br from 19 BpCCR1 overexpression lines. To investigate the molecular mechanism of the mutation of br, we performed transcriptome sequencing of br and the control lines (OE2 and WT), and explored genes that were genome-wide differentially expressed in br. Our results will help bring new insights to understand the molecular basis of plant architecture. The achievements obtained in studying the plant architecture of birch will allow us to pave a way for improving wood productivity and application.

2. Materials and Methods

2.1. Plant Materials

A birch (Betula platyphylla × B. pendula) multiple-branches mutant br, BpCCR1 overexpression line OE2, and wild type birch (WT) were used as plant materials. All the plants were grown in pots with dimensions of 35 cm × 35 cm, under natural conditions, at the breeding base of the Northeast Forestry University, Harbin, China. br was a transgenic line of BpCCR1 overexpression birch, which exhibited quite different phenotypes with other BpCCR1 transgenic lines, and OE2 was used for excluding the function of BpCCR1 [32].

2.2. Methods

2.2.1. Observation of Biomass and Growth Traits

WT, OE2, and br were cultured in a woody plant medium containing 0.2 mg/L NAA, for 30 days. Fifteen plants from each line were selected to examine the biomass and the growth traits. The stems and roots length were measured by using the scanner Image Scanner III GE-081 (GE Healthcare, Beijing, China). The 15 plants from each line were equally divided into three groups. The aboveground and underground parts of each group were separated to test the fresh weight and the dry weight, under a constant weight. The rooting index, water content (P), and dry to wet ratio (Pw) were calculated as follows:
Rooting index = Roots number × Roots length × Rooting rate,
P = (Fresh weight − Dry weight)/Fresh weight × 100%,
Pw = Dry weight/Fresh weight × 100%,
Three-year-old WT, OE2, and br were used to measure the plant height, lateral branches number, and the leaf morphology. The bud morphology was observed using stereomicroscope SZX7 (Olympus, Tokyo, Japan). Each line was expanded to 15 plants. The lower epidermis of the fourth leaves of each line were torn off and used to observe the cells and stomas using an Olympus DP26 (Olympus, Tokyo, Japan). The stomatal inner diameter, outer diameter, and stomatal density were examined and each value of stomata characteristics was the average value of the three measurements from three individual plants.

2.2.2. Observation of Apical Buds Microstructure

The main and lateral branches’ apical buds of three-year-old birch from WT, OE2, and br were fixed in FAA (formaldehyde, glacial acetic acid and 50% ethyl alcohol, V:V:V = 1:1:18) for 24 h, dehydrated in an ascending series of ethanol (70%, 80%, 85%, 95%, and 100%), cleared in xylene and embedded in paraffin. Sections of 10 μm thickness were made on an HM 340E microtome (Thermo, Waltham, MA, USA), and stained by safranine and fast green (Sigma, MO, USA). Apical bud microstructures of the samples were examined and photographed using Olympus DP26 (Olympus, Tokyo, Japan). The size of SAM was measured by using the CellSens Entry (Olympus, Tokyo, Japan). Each value of SAM size was the average of five measurements from three individual plants.

2.2.3. RNA Extraction, Library Construction, and Sequencing

The main and lateral branches’ apical buds of three-year-old WT, OE2, and br were harvested and frozen in liquid nitrogen. Total RNA was extracted from each sample, using the CTAB method [33]. RNA concentration was detected using NanoDrop 2000 (Thermo, Waltham, MA, USA). RNA integrity was assessed using Nano 6000 Assay Kit of the Agilent Bioanalyzer 2100 system (Agilent Technologies, Santa Clara, CA, USA).
mRNA was purified from total RNA using poly-T oligo-attached magnetic beads. Fragmentation was carried out using divalent cations under elevated temperatures in the NEBNext First Strand Synthesis Reaction Buffer (5×). First strand cDNA was synthesized using random hexamer primer and M-MuLV Reverse Transcriptase. Second strand cDNA synthesis was subsequently performed using DNA Polymerase I and RNase H. Fragments were purified with the AMPure XP system (Beckman Coulter, Beverly, CA, USA). Phusion high-fidelity DNA polymerase, universal PCR primers, and index (X) Primer were used to amplify the PCR products, after connecting the sequencing connector. Library quality was assessed on the Agilent Bioanalyzer 2100 system. After cluster generation, the library preparations were sequenced on the Illumina platform, with an average reading length of PE150. RNA-seq was performed by the Anoroad Technology Company (Beijing, China) with two independent replicates.

2.2.4. Data Filtering, Assembly, Gene Annotation, and DEG Analysis

The clean reads were obtained by removing the junction sequences and low-quality sequences. Clean reads were mapped to the birch reference genome, using TopHat2 [34]. Genes were aligned with the NCBI (National Center for Biotechnology Information) non-redundant (Nr), Swiss-Prot, Pfam, Kyoto Encyclopedia of Genes and Genomes (KEGG), and the Clusters of Orthologous Groups (COG) protein databases, using Blastx with an E value ≤10−5. Blast2GO was used to obtain gene ontology (GO) annotation of the genes, based on the Nr annotation. Putative metabolic pathways were assigned by performing Blastx searches against the KEGG pathway database, with an E value ≤10−5 [35,36,37]. New genes were obtained using KOBAS 2.0 and were annotated after being compared with HMMER and Pfam [38,39].
To quantify the expression level of each gene, the specific formulae was as follows:
FPKM = cDNA Fragments/Mapped Fragments (Millions) × Transcript Length (kb),
Differentially expressed genes (DEGs) between each two-sample comparison were defined with fold change ≥2 and FDR (false discovery rate) <0.01 as a threshold, according to the statistical analysis performed by DESeq R package (1.10.1) [40]. Data analysis and functional annotation were carried out by the Biomarker Technology Company (Beijing, China).

2.2.5. Verification of qRT-PCR

Main and lateral branches’ apical buds of three-year-old WT, OE2, and br were used to extract the total RNA using the RNA pure total RNA fast isolation kit (Bioteke, Beijing, China). cDNA was synthesized from 1 µg RNA of tested lines, using a ReverTra Ace® qPCR RT Kit (Toyobo, Osaka, Japan), according to the manufacturers’ instructions, respectively. Quantitative RT-PCR (qRT-PCR) was performed on a 7500 real-time PCR system (Applied Biosystems, Darmstadt, Germany), using SYBR® Green PCR master mix (Toyobo, Osaka, Japan). Amplification system and procedure were carried out according to Huang [41]. The relative expression level of the genes was calculated using the 2−△△Ct method [42]. Primer sequences are listed in Table S1. Bp18S rRNA was selected as an internal reference gene.

2.2.6. Statistical Analysis

Data analysis were performed using SPSS statistics software, version 16.0 (International Business Machines, Armonk, NY, USA). Differences between the means of each line on all traits were determined using one-way analysis of variance and the Duncan multiple comparison procedure. p value <0.05 was considered to be statistically significant and was labeled with different letters. The same letter indicates that the results were not significantly different.

3. Results

3.1. Identification of br Mutation Characteristics

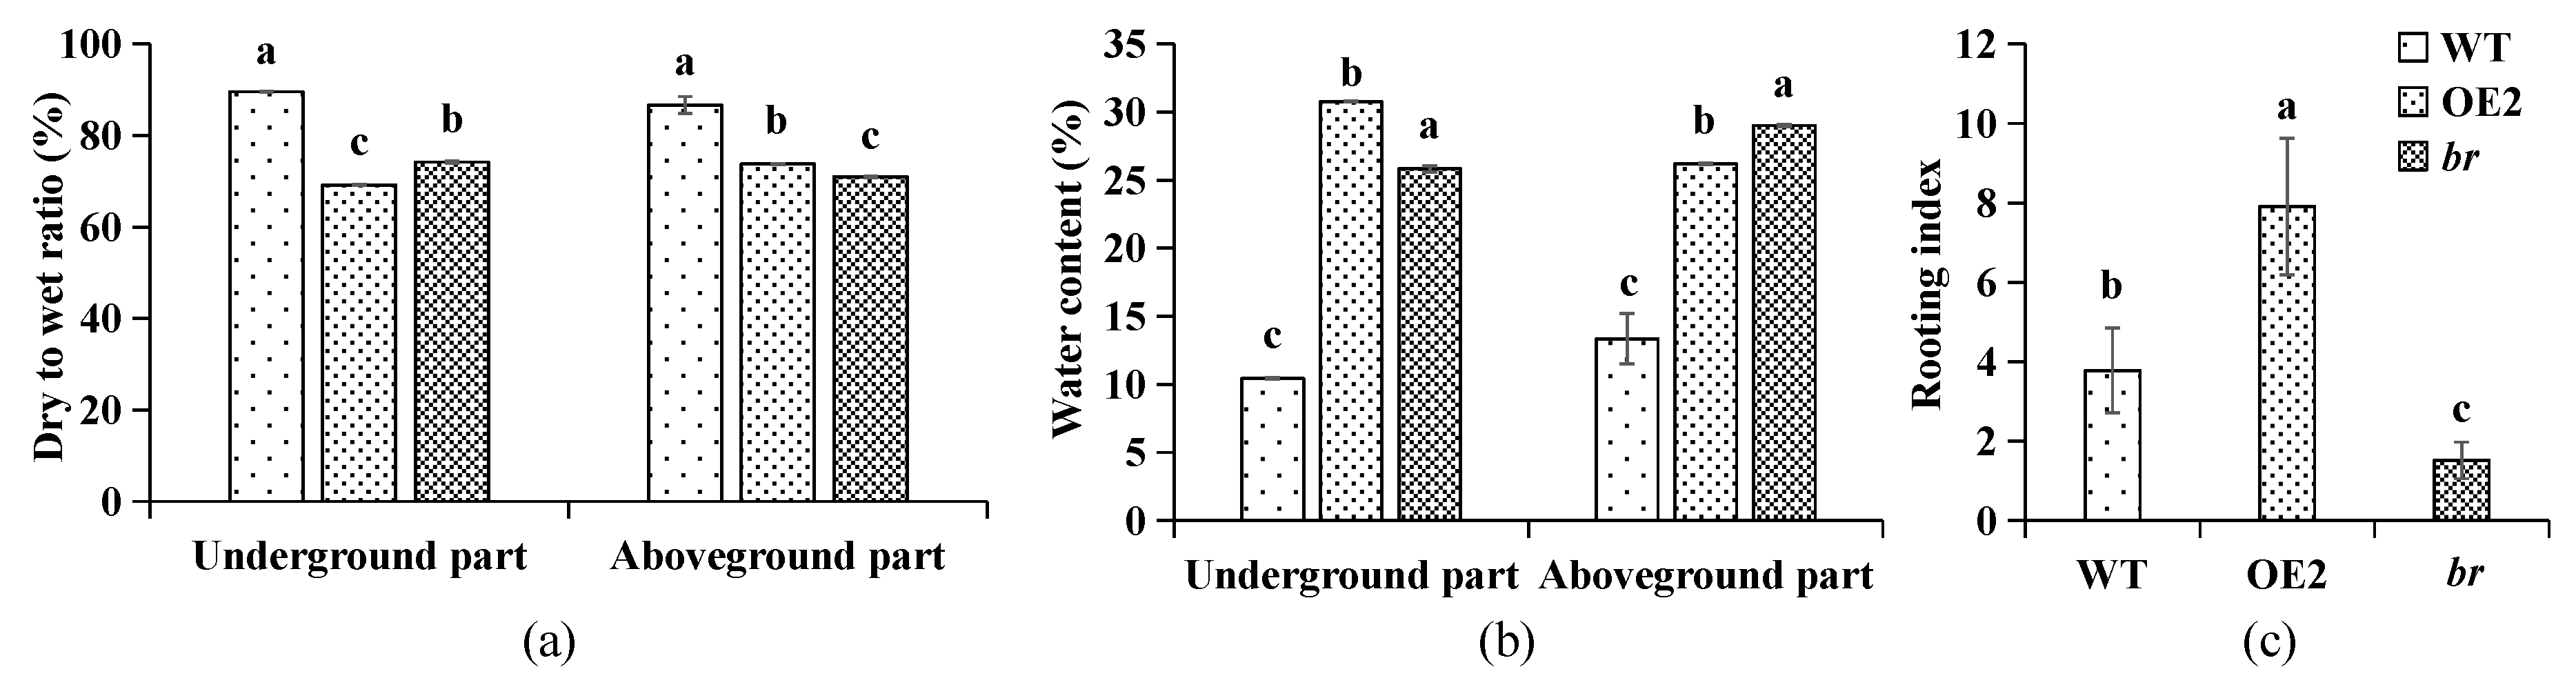
3.1.1. Variations in Biomass

Thirty-day rooting seedlings of WT, OE2, and br were used to measure biomass. The results showed that the stem length, average root length, and root number of br were significantly lower. Dry weight and fresh weight of the aboveground and underground parts of br were significantly lower than the two control lines, except the dry weight of the aboveground parts (p < 0.05) (Table 1). The rooting index and dry to wet ratio of br were obviously decreased but the water content was significantly increased, compared with WT and OE2 (Figure 1a–c). These results confirmed that the growth of br was delayed and was weaker, and the roots were underdeveloped at the seedling stage.

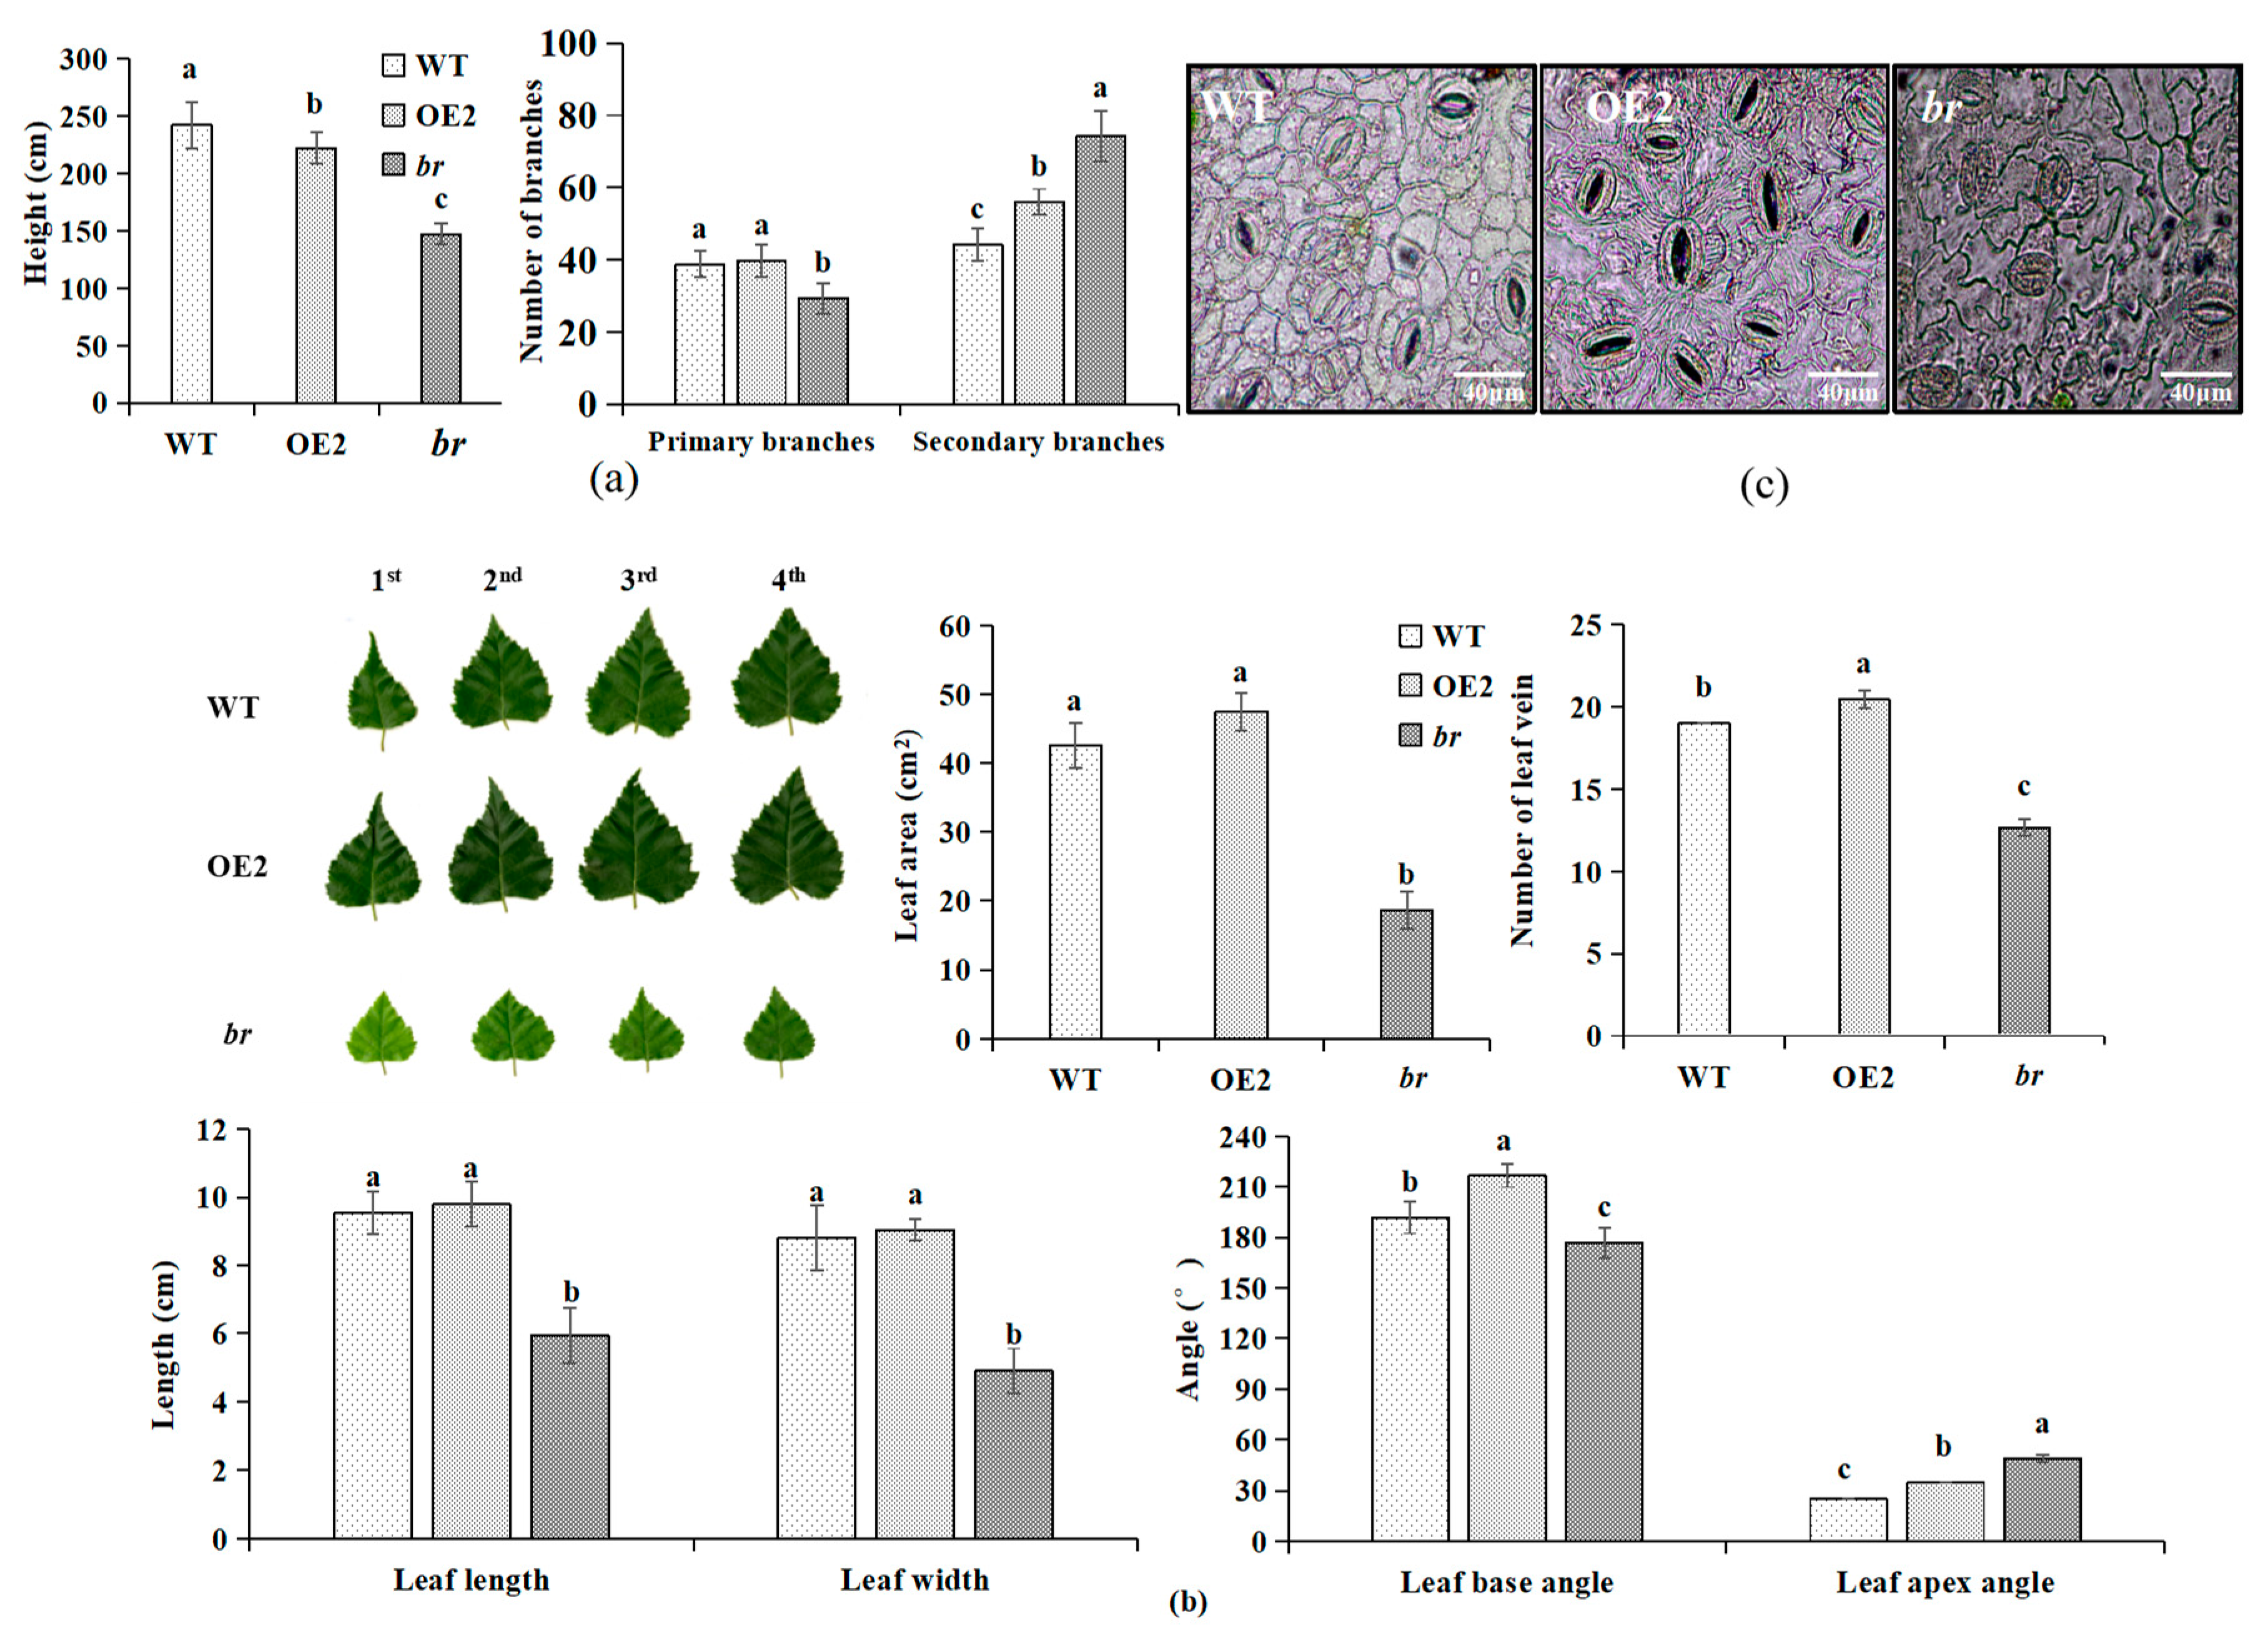
3.1.2. Variations in Growth

To further investigate whether the phenotypes of br would recover over time, the plant growth traits of three-year-old WT, OE2, and br were measured. There was a significant reduction of br height, which was 60.73% of WT and 66.25% of OE2, respectively. The number of primary branches of br was lower, while the number of secondary branches was significantly increased, compared with WT and OE2, which was 1.76 times of WT and 1.61 times of OE2 (Figure 2a, Figure S1). The leaf size and morphology of br also showed obvious changes. The leaf area was decreased by 56.12% and 60.62% of WT and OE2, respectively. The leaf length, leaf width, and the number of veins were also reduced. The leaf base angle of br was about 180 degrees, which was smaller than the other two lines. By contrast, the leaf apex angle of br was larger than the control lines (Figure 2b). We then observed the lower epidermis cells and stomas, it was found that both br and OE2 had irregular shape lower epidermis cells, while the stomatal inner diameter, outer diameter, and stomatal density were significantly decreased in br (Figure 2c, Table S2). These results indicated that br was dwarf, had multiple-branches, and small leaves. These variations in growth of br were not caused by environmental factors as it could not recover over time.

3.1.3. Observation of Morphology and the Microstructures of Apical Buds

The morphology and microstructures of the main and lateral branches’ apical buds in three-year-old WT, OE2, and br were observed, as changes of growth traits in br might be related to the development of SAM. Either the main branches or the lateral branches’ apical buds of br were found to be smaller, compared to the two control lines. The length and width of the br apical buds of the main branches were 62.08% and 74.43% of WT, and 67.93% and 68.04% of OE2, respectively. These indices of the br lateral branches’ apical buds were 40.91% and 66.08% of WT, and 48.79 % and 67.66% of OE2, respectively (Figure 3a,b). The ratio of main branches SAM width/lateral branches SAM width of WT and OE2 were 1.51 and 1.29, respectively. However, that ratio of br was 0.95 (Figure 3c,d). As a result, the apical buds were smaller and the SAM size of the main branches and the lateral branches were similar in br.

3.2. Transcriptomic Analyses

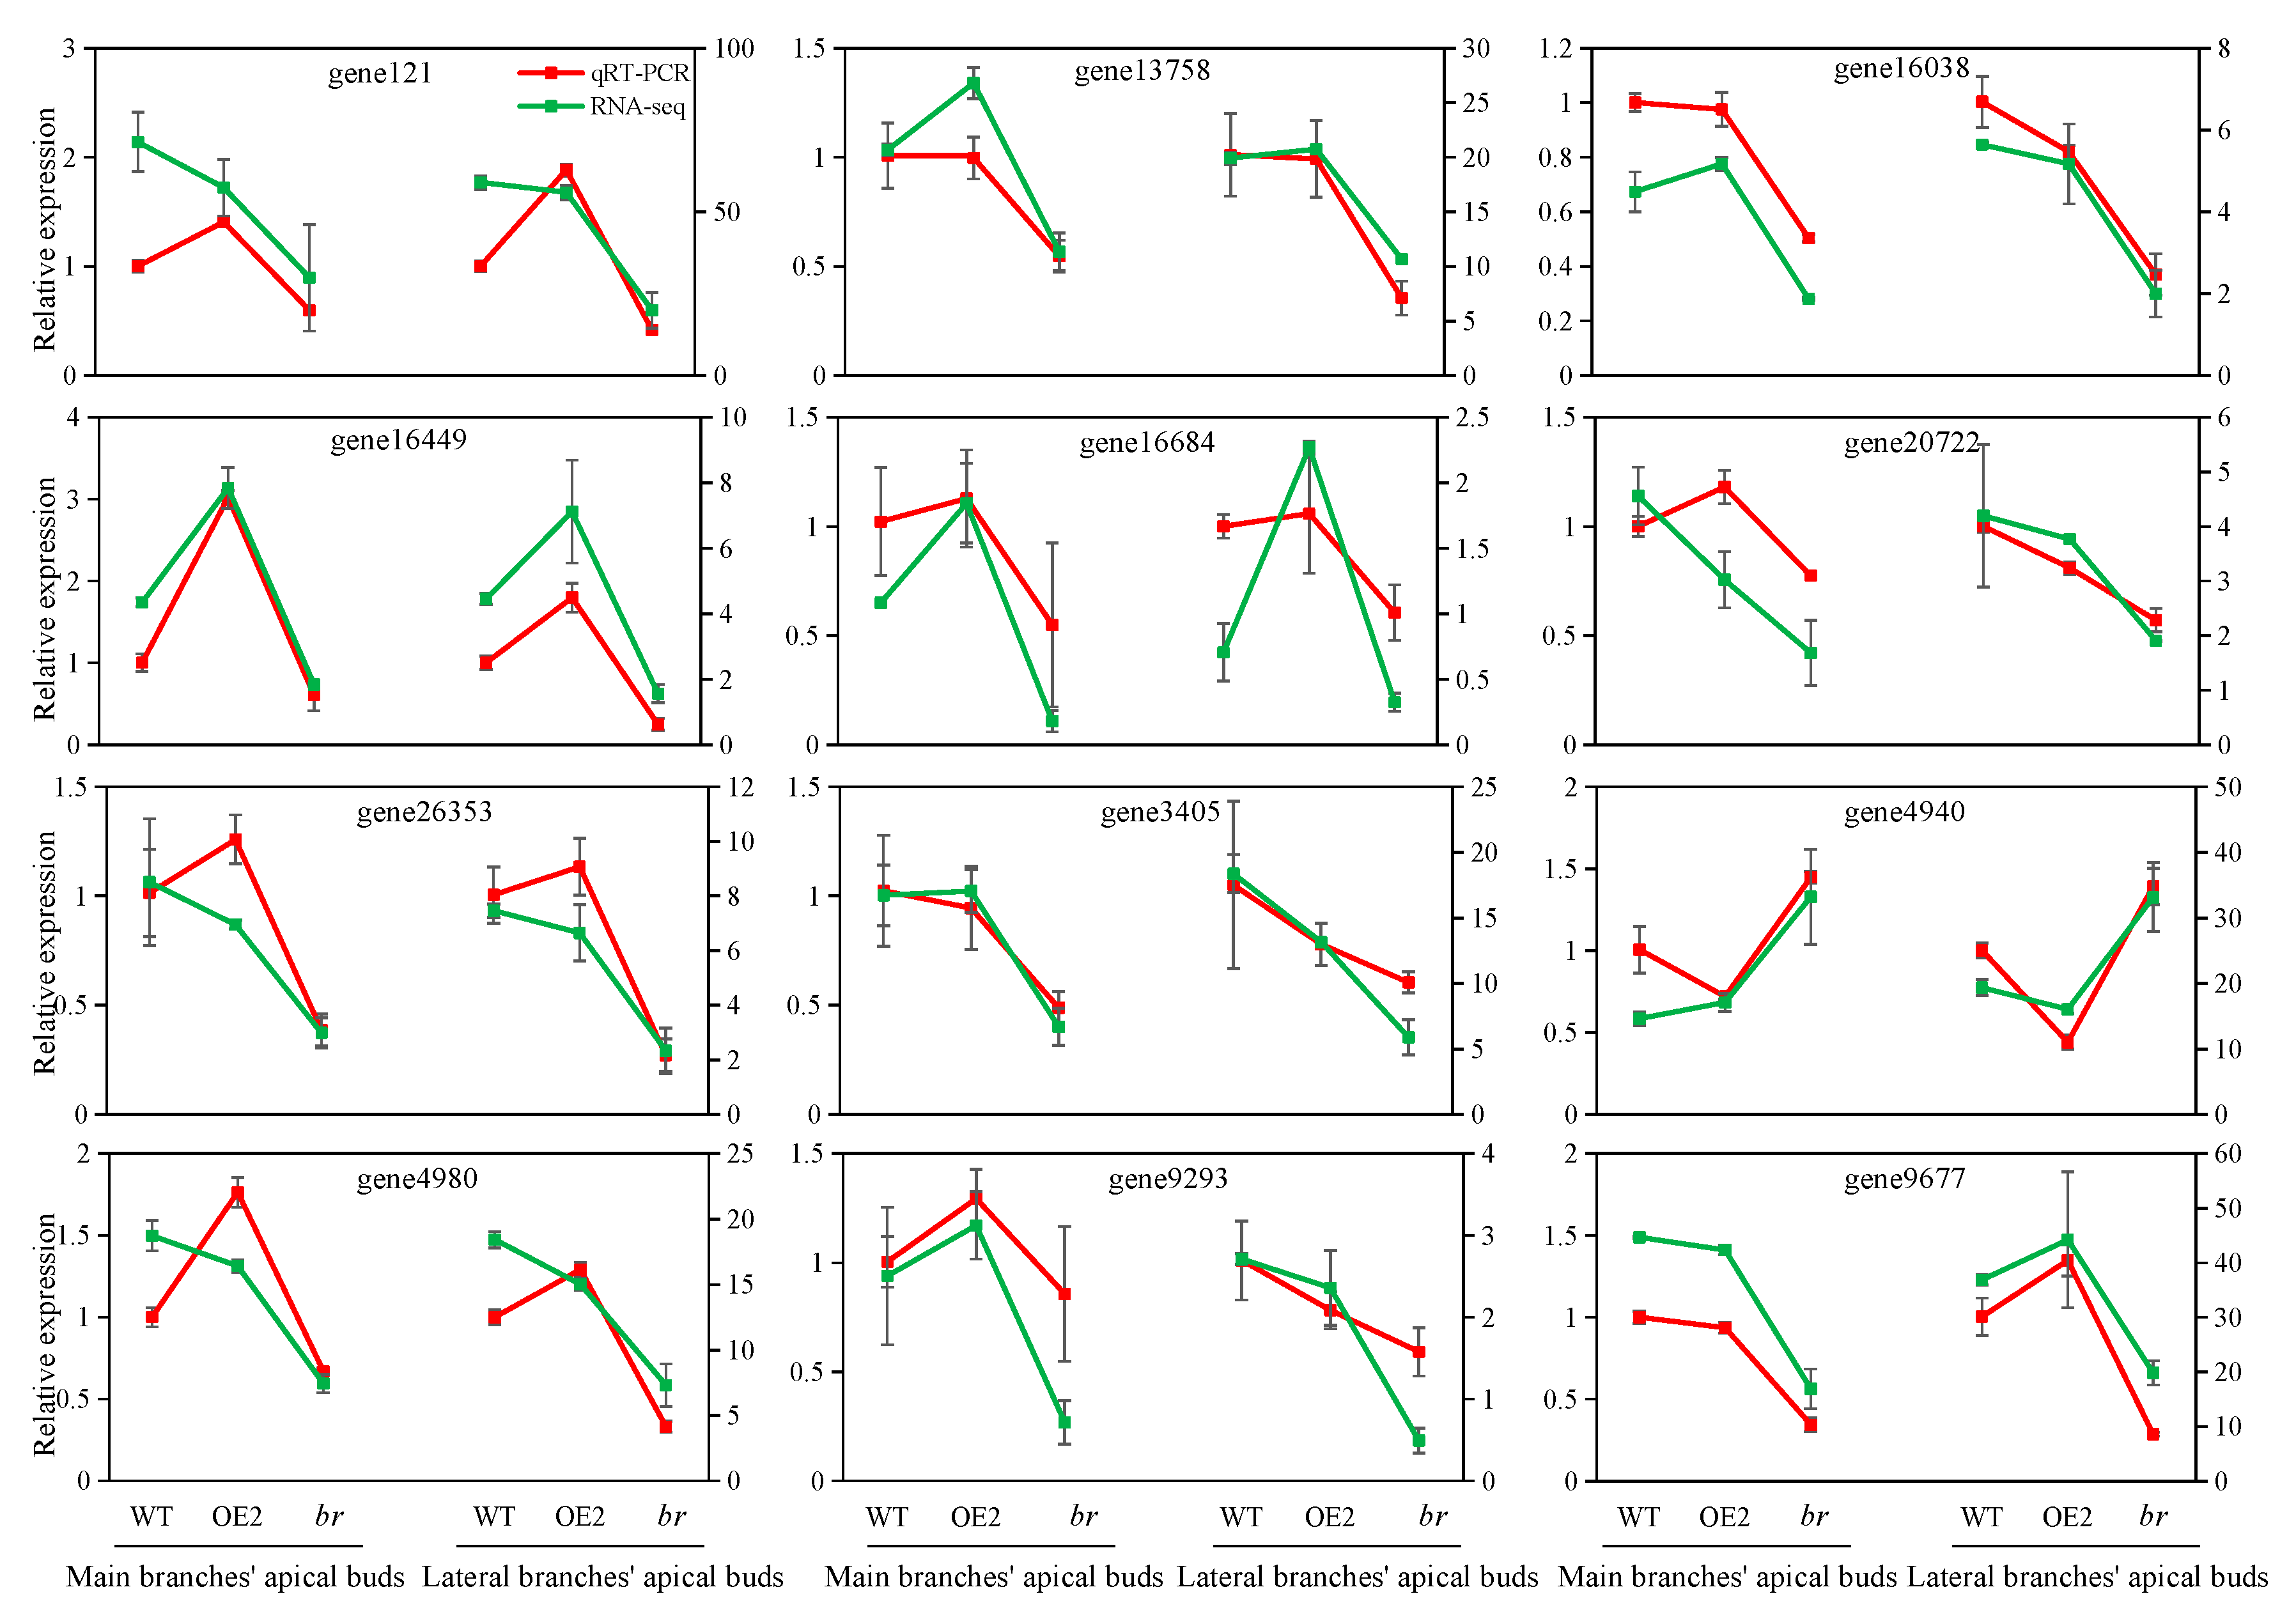
3.2.1. Sequencing Quality Evaluation and qRT-PCR Verification

To analyze the changes of gene expression patterns, RNA-seq was performed using main and lateral branches’ apical buds of three-year-old WT, OE2, and br. As a result, a total of 55.17 Gb clean data was obtained from 12 samples, and each sample reached 4.37 Gb. The Q30 percentages were all over 93.71%. The alignment of clean reads in the 12 samples, against the birch reference genome was from 93.59% to 94.62% (Table 2). Meanwhile, 1550 new genes were identified and annotated (Table 3).
To test the reliability of RNA-Seq, 12 genes were selected for verification, using qRT-PCR. The gene expression detected by qRT-PCR showed a similar pattern to that detected by the RNA-seq, which proved the accuracy of the transcriptome (Figure 4).

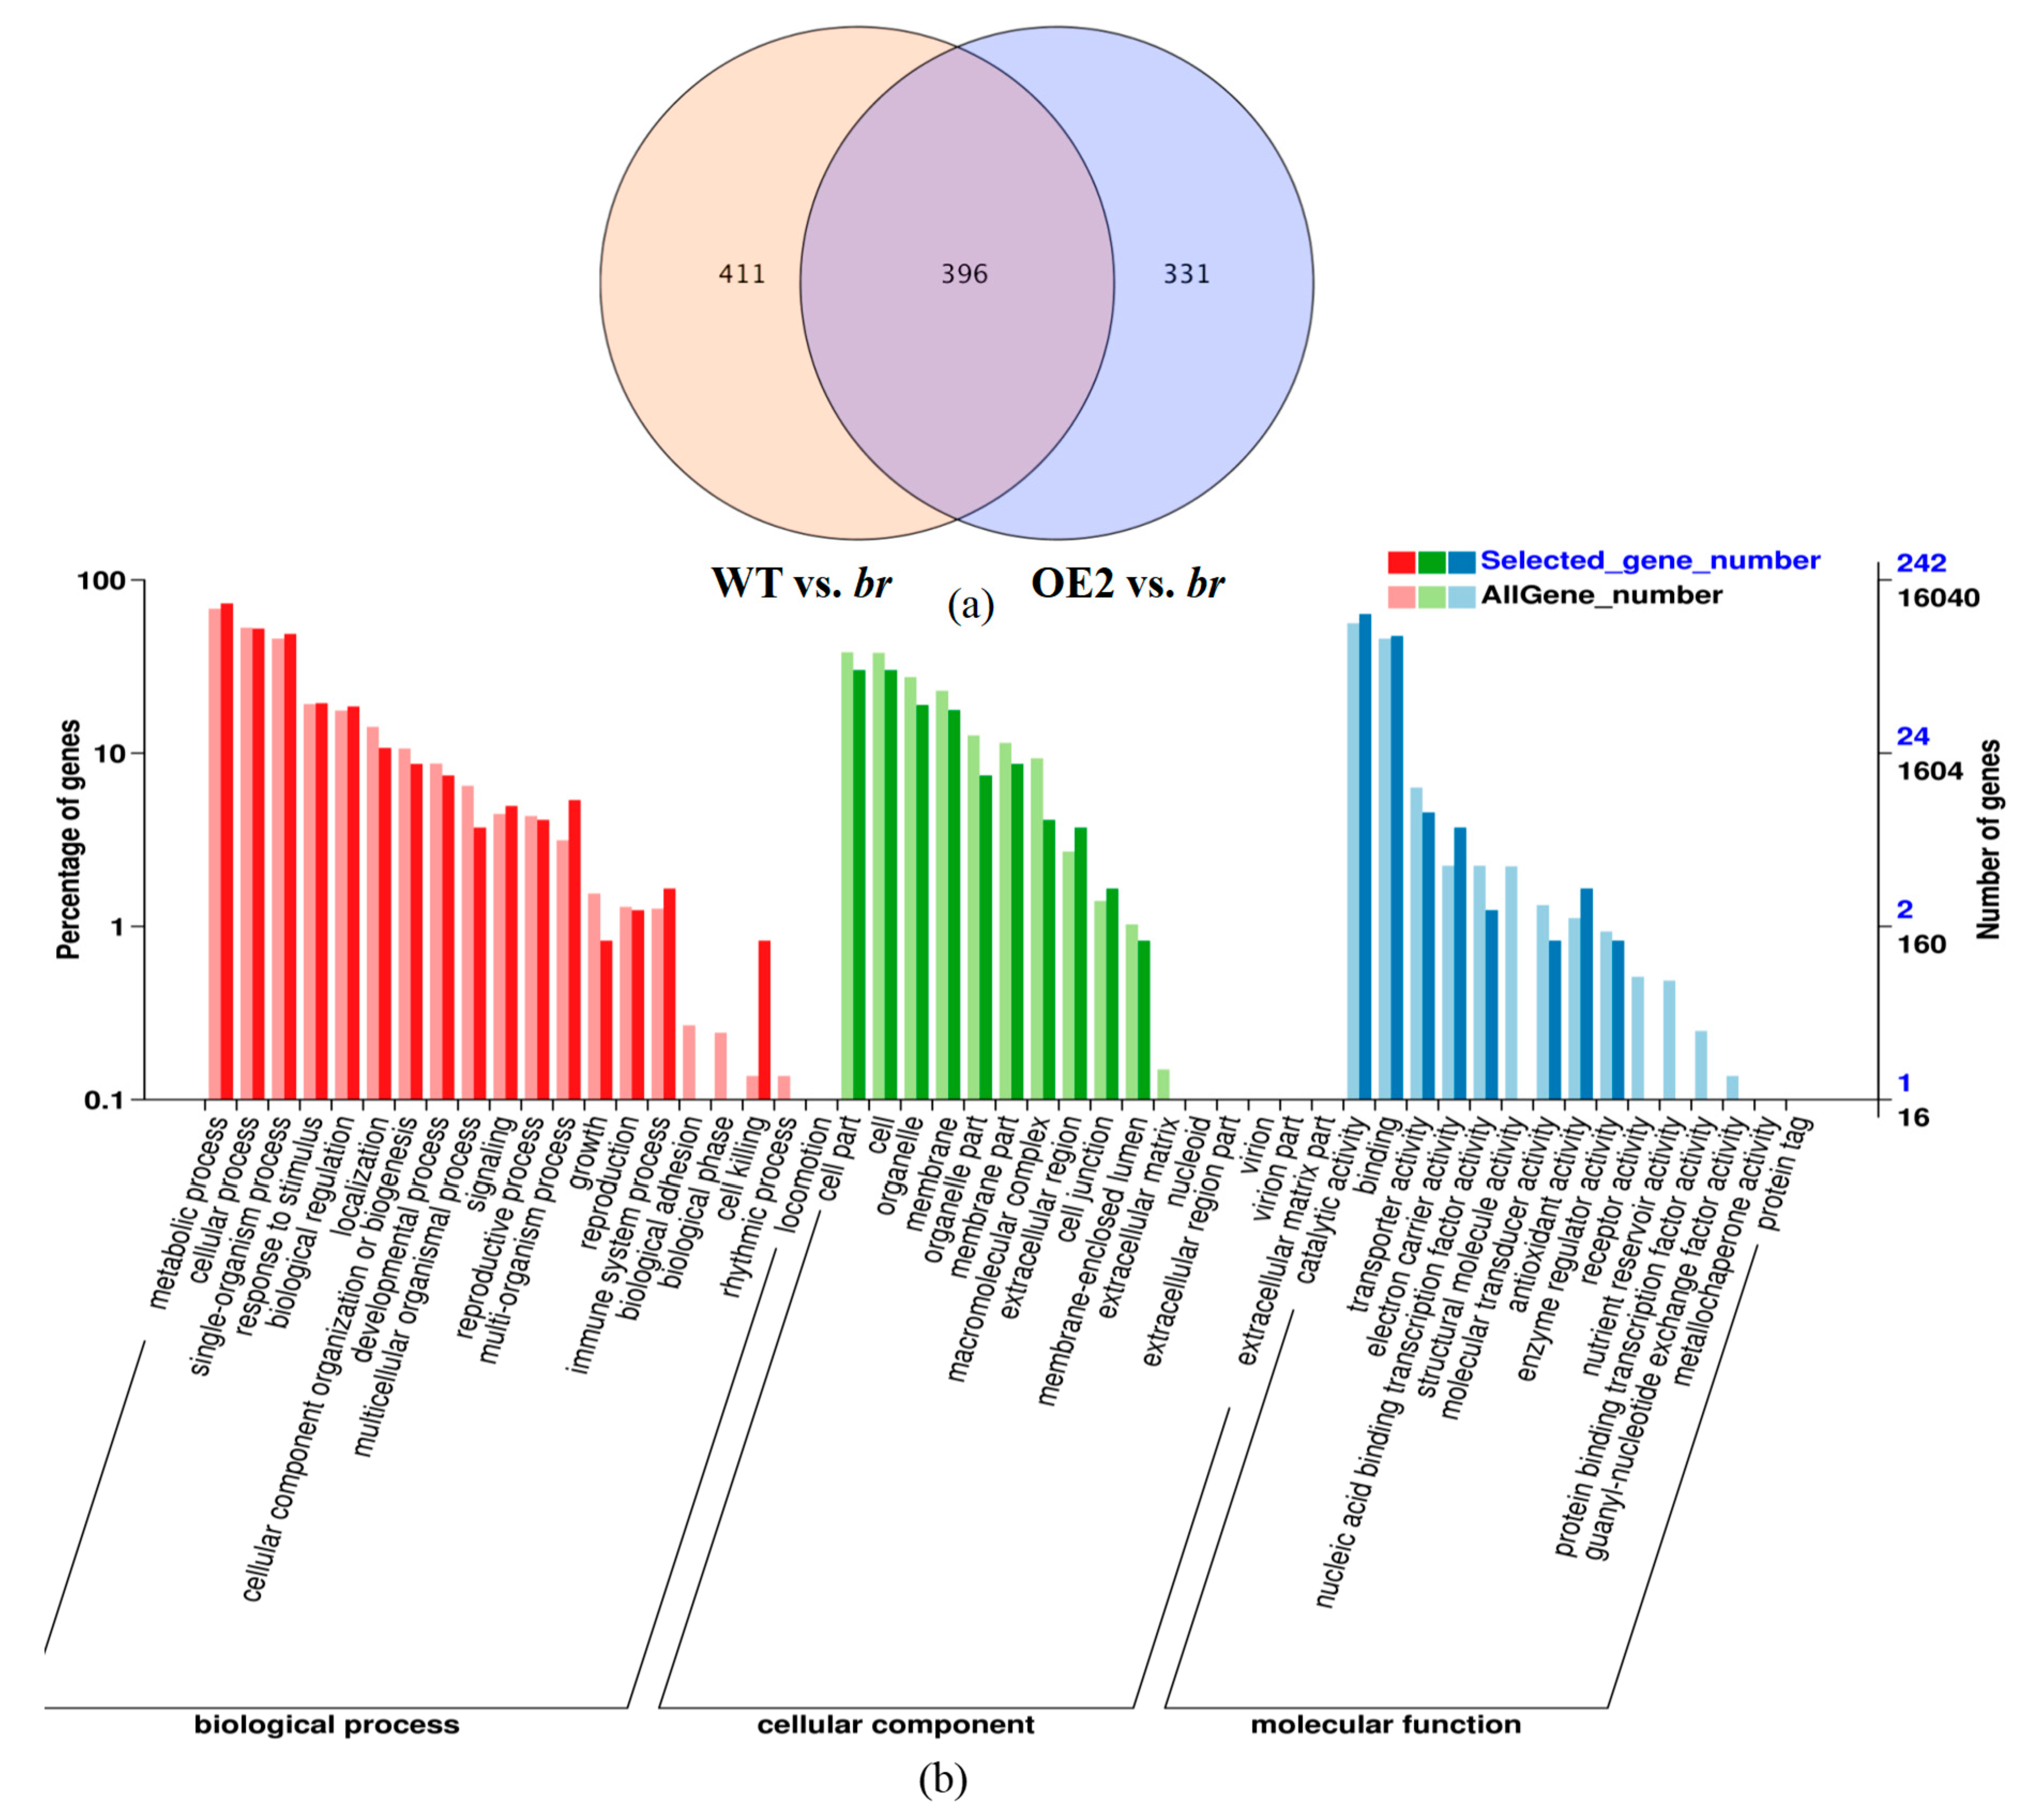
3.2.2. Transcriptomic Analyses of the Apical Buds of the Main Branches

Two transcriptome comparisons were performed, using the apical buds of the main branches, including WT vs. br and OE2 vs. br. The results showed that 859 genes (301 up-regulated and 558 down-regulated) were found to be differentially expressed in br, compared with WT. A total of 659 genes (262 up-regulated and 397 down-regulated) were differentially expressed in br, compared with OE2. Meanwhile, 406 genes were gathered in the overlap of DEGs between two transcriptome comparisons, including 149 up-regulated and 257 down-regulated genes (Figure 5a).
DEGs which were expressed in the overlap of the two transcriptome comparisons, were assigned to the GO categories, according to the biological process, cellular component, and molecular function. In the biological process, DEGs were mainly concentrated in the cell process, the metabolic process, and single-organism process. For the cellular component, DEGs were mainly within the cell and cellular part. For molecular function, DEGs were mainly within the binding and catalytic activities (Figure 5b). There were 46 DEGs in biological regulation, 25 DEGs in development, 19 DEGs in signal transduction, and 4 DEGs in growth (Table S3).
Then, the DEGs were subjected to the KEGG pathway analysis and five pathways, including cellular process, environmental information processing, genetic information process, metabolism and organismal systems, were considered enriched (Figure 5c). Among them, one gene was involved in zeatin biosynthesis (ko00908, KEGG Orthology was K13495) (Figure S2). Three genes were involved in diterpenoid biosynthesis (ko00904, KEGG Orthology were K04123, K04121, and K04123, respectively), which participated in the gibberellin biosynthesis (Figure S3). Three genes were involved in the tryptophan metabolism (ko00380, KEGG Orthology were K11820, K11816, and K00128, respectively) and participated in the auxin biosynthesis (Figure S4). Three genes were involved in the plant hormone signal transduction (ko04075, KEGG_Orthology were K14484, K14490, and K14505, respectively) including auxin response, cytokinin transduction, and cell division induced by brassinosteroids (Figure S5). These results suggested that the specific changes of genes involved in the development, growth, plant hormones biosynthesis, and signal transduction in the apical buds of the main branches were important to the unique phenotype of br.

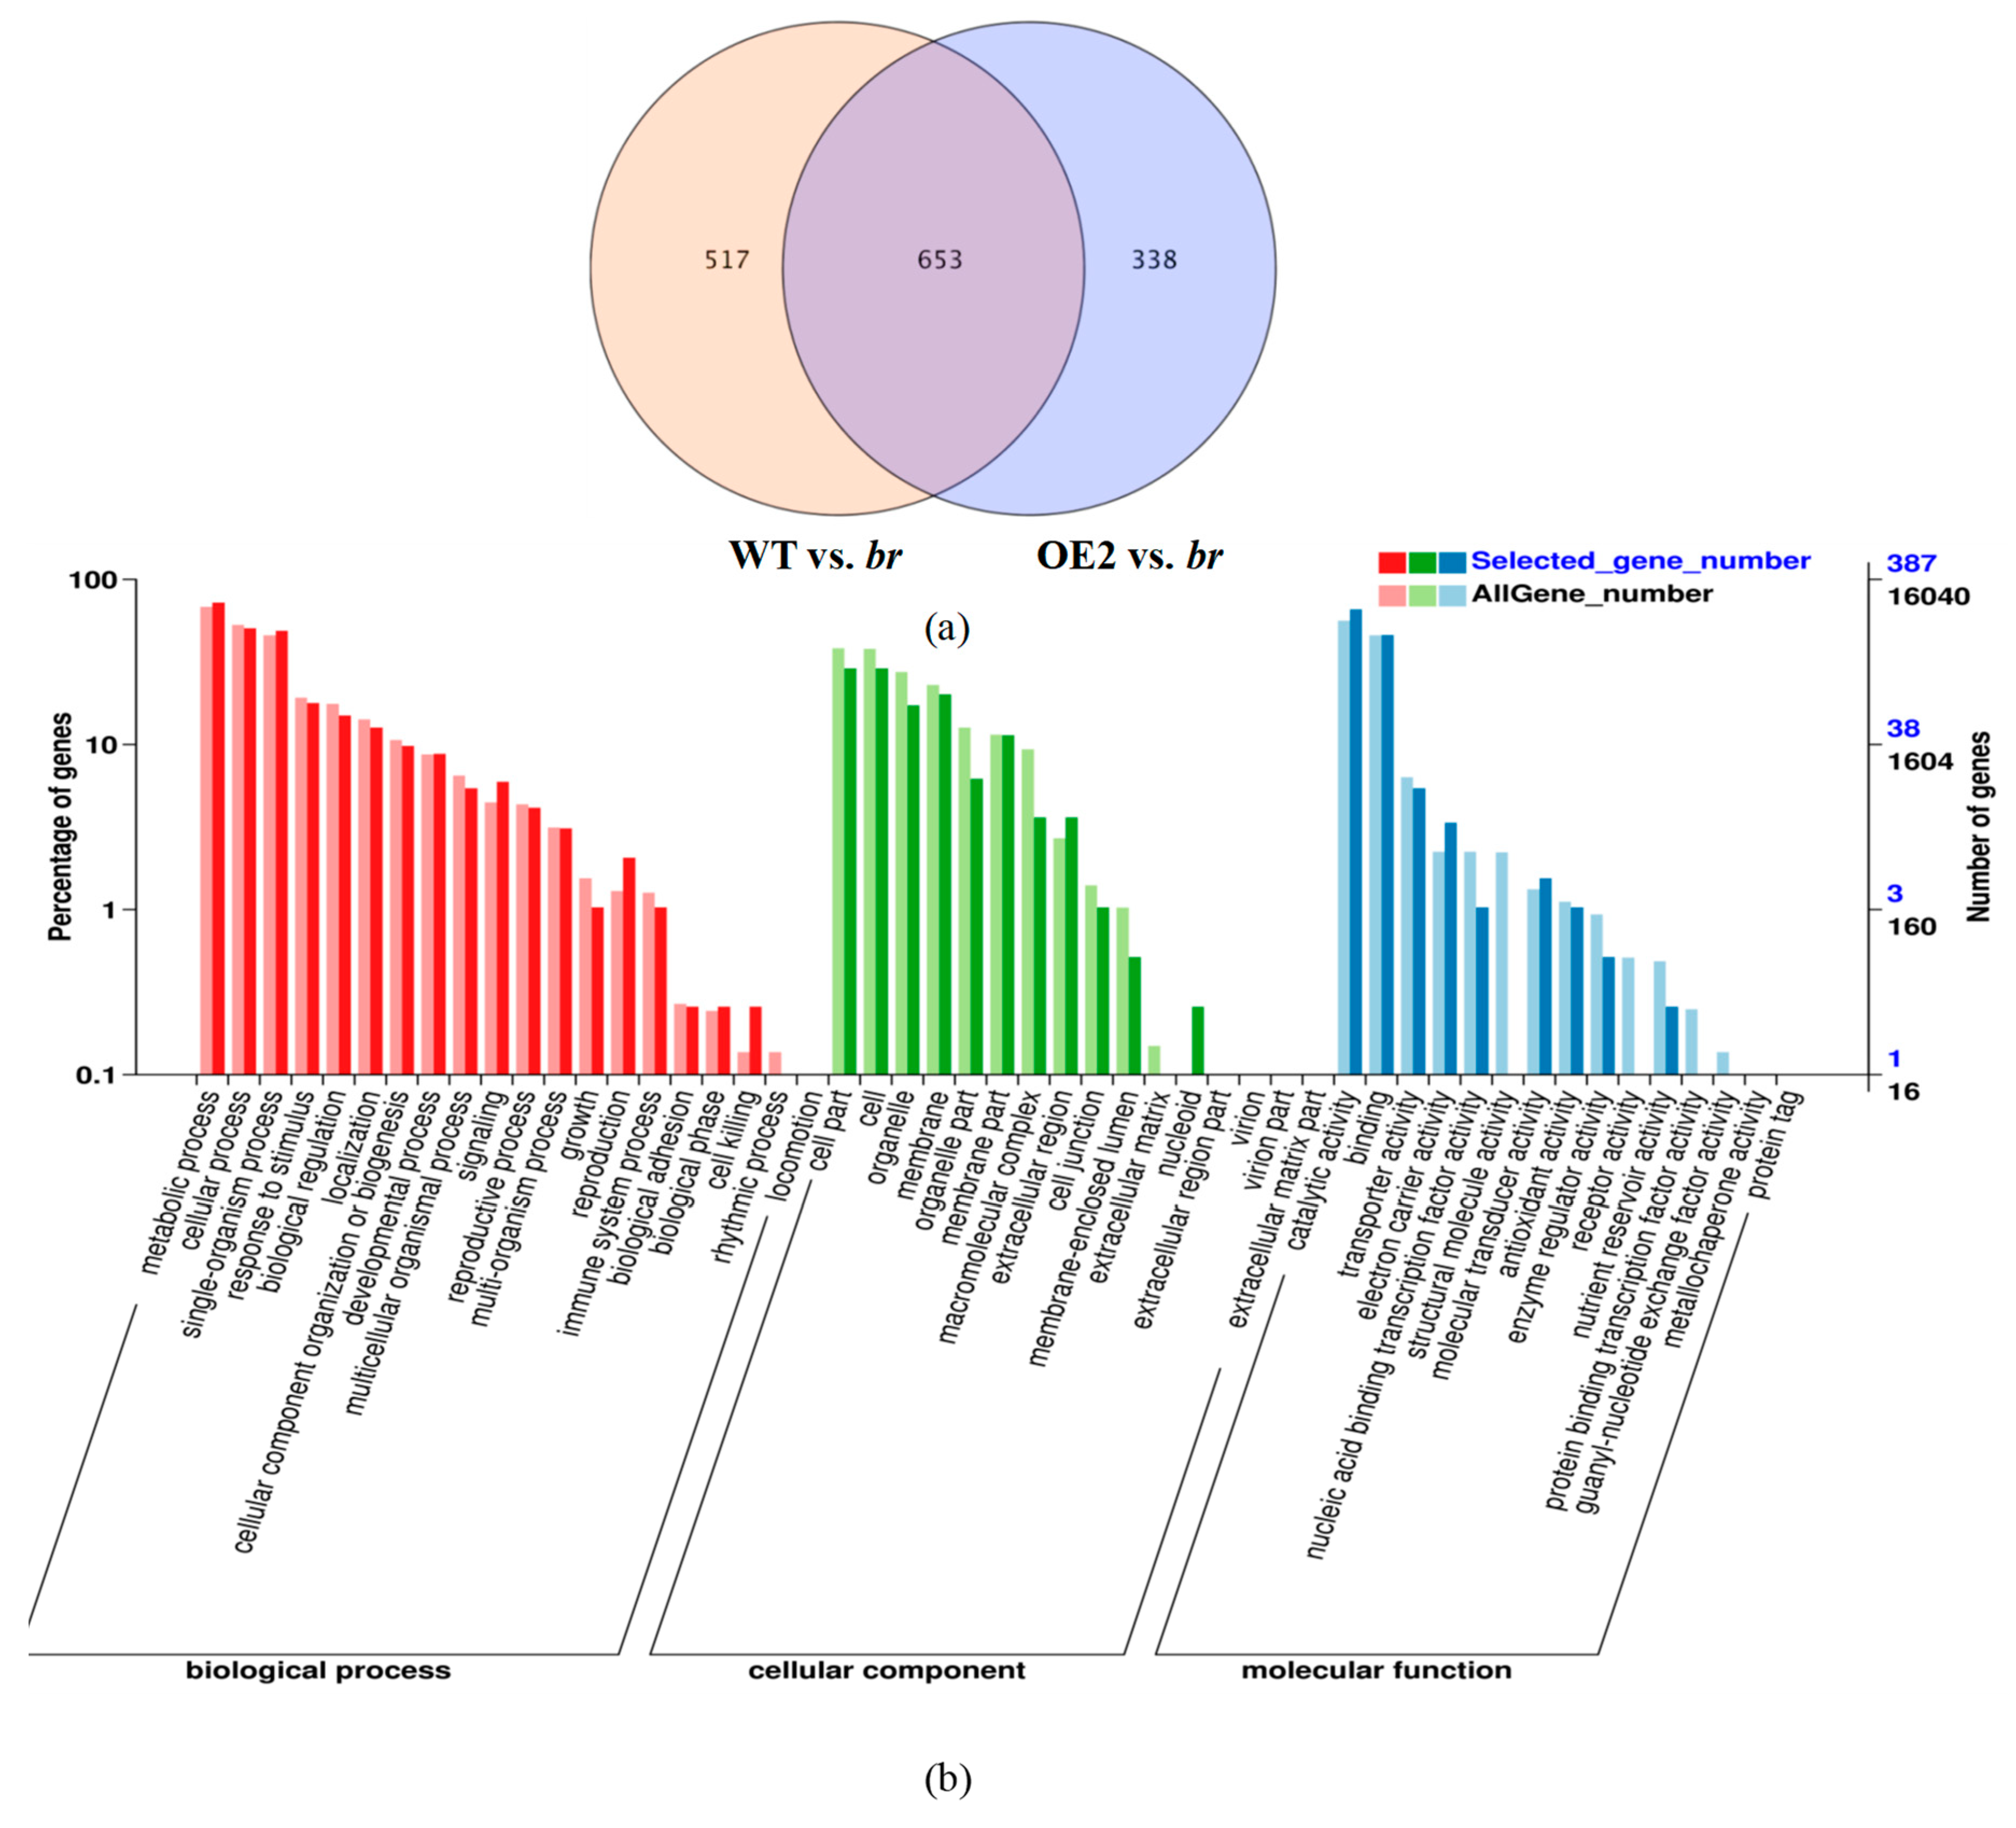
3.2.3. Transcriptomic Analyses of the Lateral Branches’ Apical Buds

Two transcriptome comparisons were carried-out using the lateral branches’ apical buds, including WT vs. br and OE2 vs. br. The results showed that 807 genes (241 up-regulated and 566 down-regulated) were found to be differentially expressed in the br lateral branches’ apical buds, compared with the WT and 727 genes (284 up-regulated and 443 down-regulated) were differentially expressed, compared with the OE2. Furthermore, 396 DEGs (125 up-regulated and 271 down-regulated) were gathered between the two sets (Figure 6a).
Based on gene ontology, DEGs were classified into cell process, metabolic process, and single-organism process in the biological process. For the cellular component, there were many DEGs involved in the cell and cell parts. For the molecular functions, DEGs were involved in binding and in the catalytic activity (Figure 6b). Compared with WT and OE2, 45 DEGs participated in the biological regulation, 18 DEGs participated in the development, 2 DEGs participated in the growth and 12 DEGs participated in the signal transduction in br (Table S4).
The KEGG pathway analysis revealed that three genes were enriched in diterpenoid biosynthesis, and three genes were enriched in the tryptophan metabolism, which were consistent with those found in the apical buds of the main branches (Figures S3 and S4). Four genes were enriched in the plant hormone signal transduction pathway (KEGG_Orthology were K13449, K14484, K13463, and K14505, respectively.). These genes were involved in the auxin response, salicylic acid response, jasmonic acid response, and brassinolide-induced cell division (Figure 6c, Figure S5). These results suggested that the specific changes of genes related to development, growth, plant hormones biosynthesis, and signal transduction in the lateral branches’ apical buds, also had effects on the unique phenotype of br.

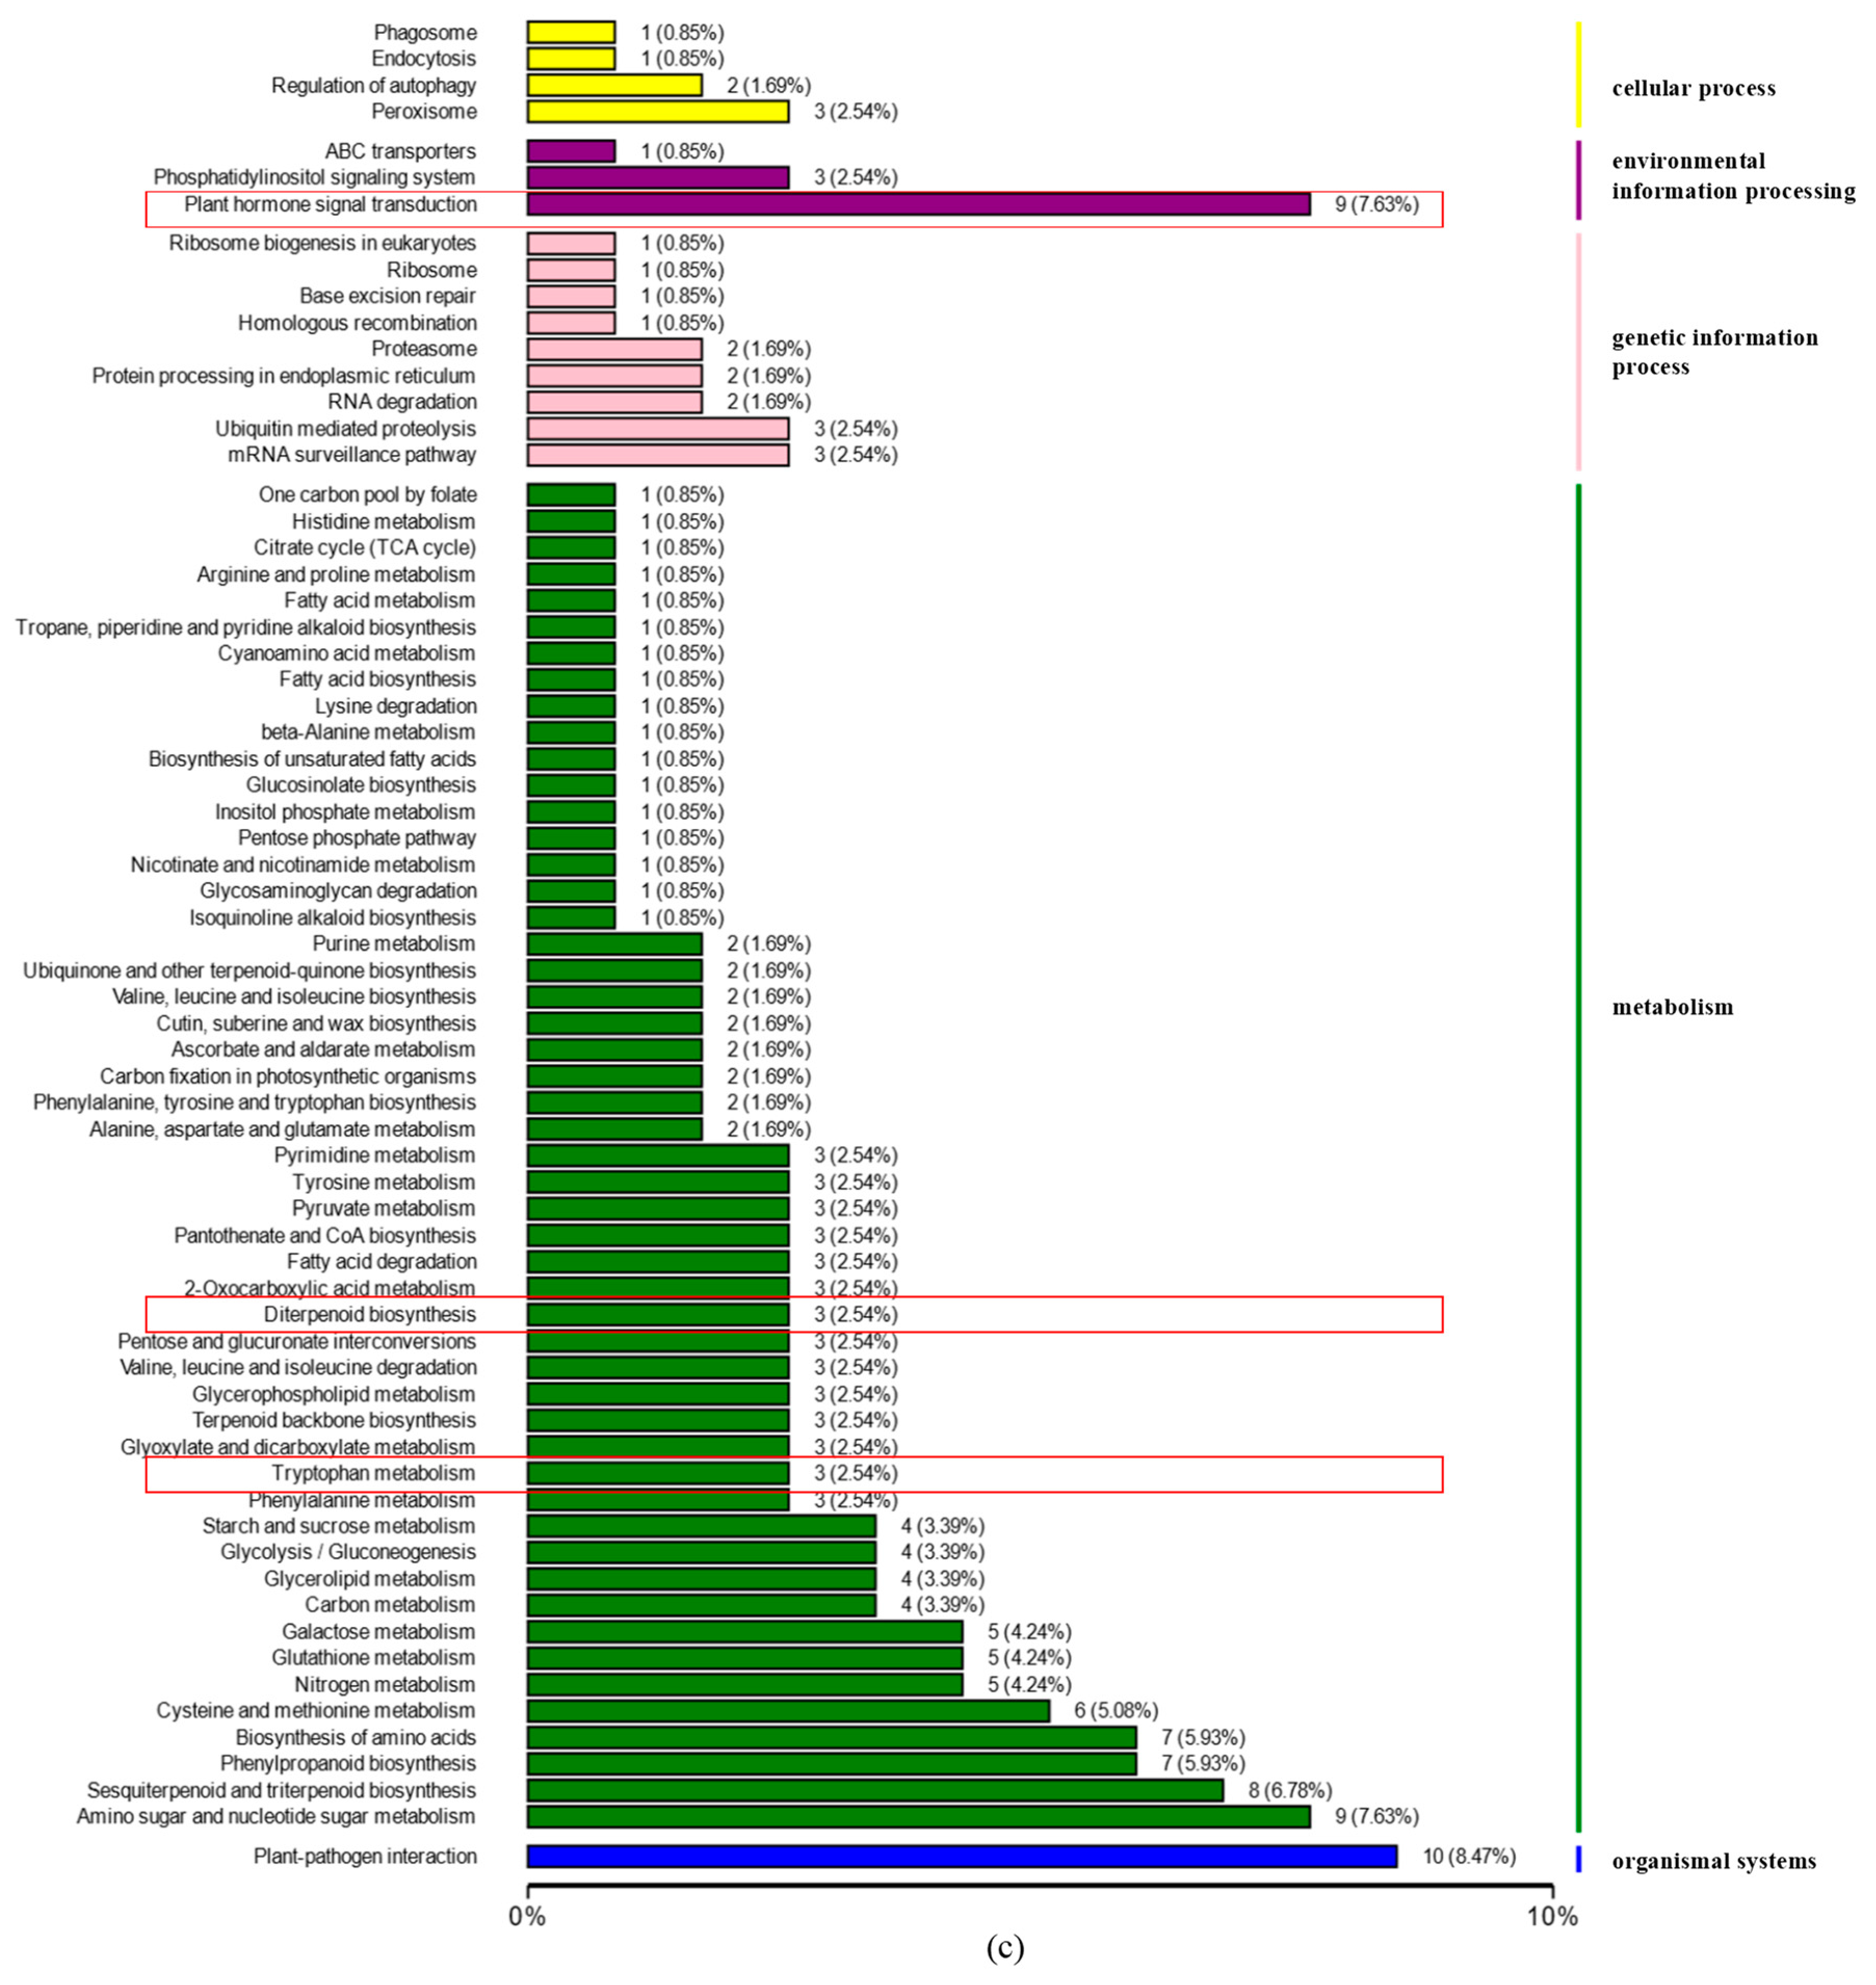
3.2.4. Transcriptomic Analyses of the Apical Buds
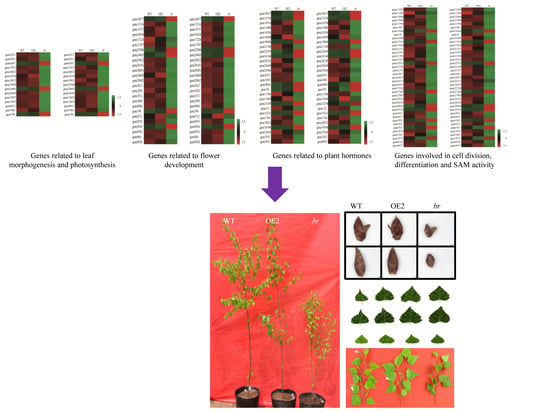
Apical buds of the main branches transcriptome data and lateral branches’ apical buds transcriptome data were combined for further analysis. The results showed that 1170 DEGs (403 up-regulated and 767 down-regulated) and 991 DEGs (417 up-regulated and 574 down-regulated) were found in br, compared to the WT and the OE2, respectively. Additionally, 653 DEGs (253 up-regulated and 400 down-regulated) were common to two sets (Figure 7a).
Most of the DEGs identified were included in the cellular process, the metabolic process, and the single-organism process for biological processes based on gene ontology. There were many DEGs involved in the cell and cell components, while others were involved in the binding and catalytic activity for molecular function. Moreover, 58 DEGs related to biological regulation, 34 DEGs related to development, 4 DEGs related to growth and 23 DEGs related to signal transduction, expressed specifically in br, compared to WT and OE2 (Figure 7b, Table S5).
The DEGs were further subjected to the KEGG pathway analysis. The results showed that three genes were enriched in the diterpenoid biosynthesis (Figure S3) and three genes were enriched in the tryptophan metabolism (Figure S4). There were nine genes that participated in plant hormone signal transduction pathway (KEGG_Orthology were K14484, K14490, K13449, K14488, K13946, and K14505, respectively), which were involved in the auxin biosynthesis and response, salicylic acid response, cytokinin transduction, and brassinolide-induced cell division (Figure 7c, Figure S5). These results suggested that there were many changes of genes involved in the development, growth plant hormones biosynthesis, and signal transduction, in both the apical buds of the main branches and the lateral branches’ apical buds, and these changes were crucial to the variations of br.

3.3. DEGs Analyses

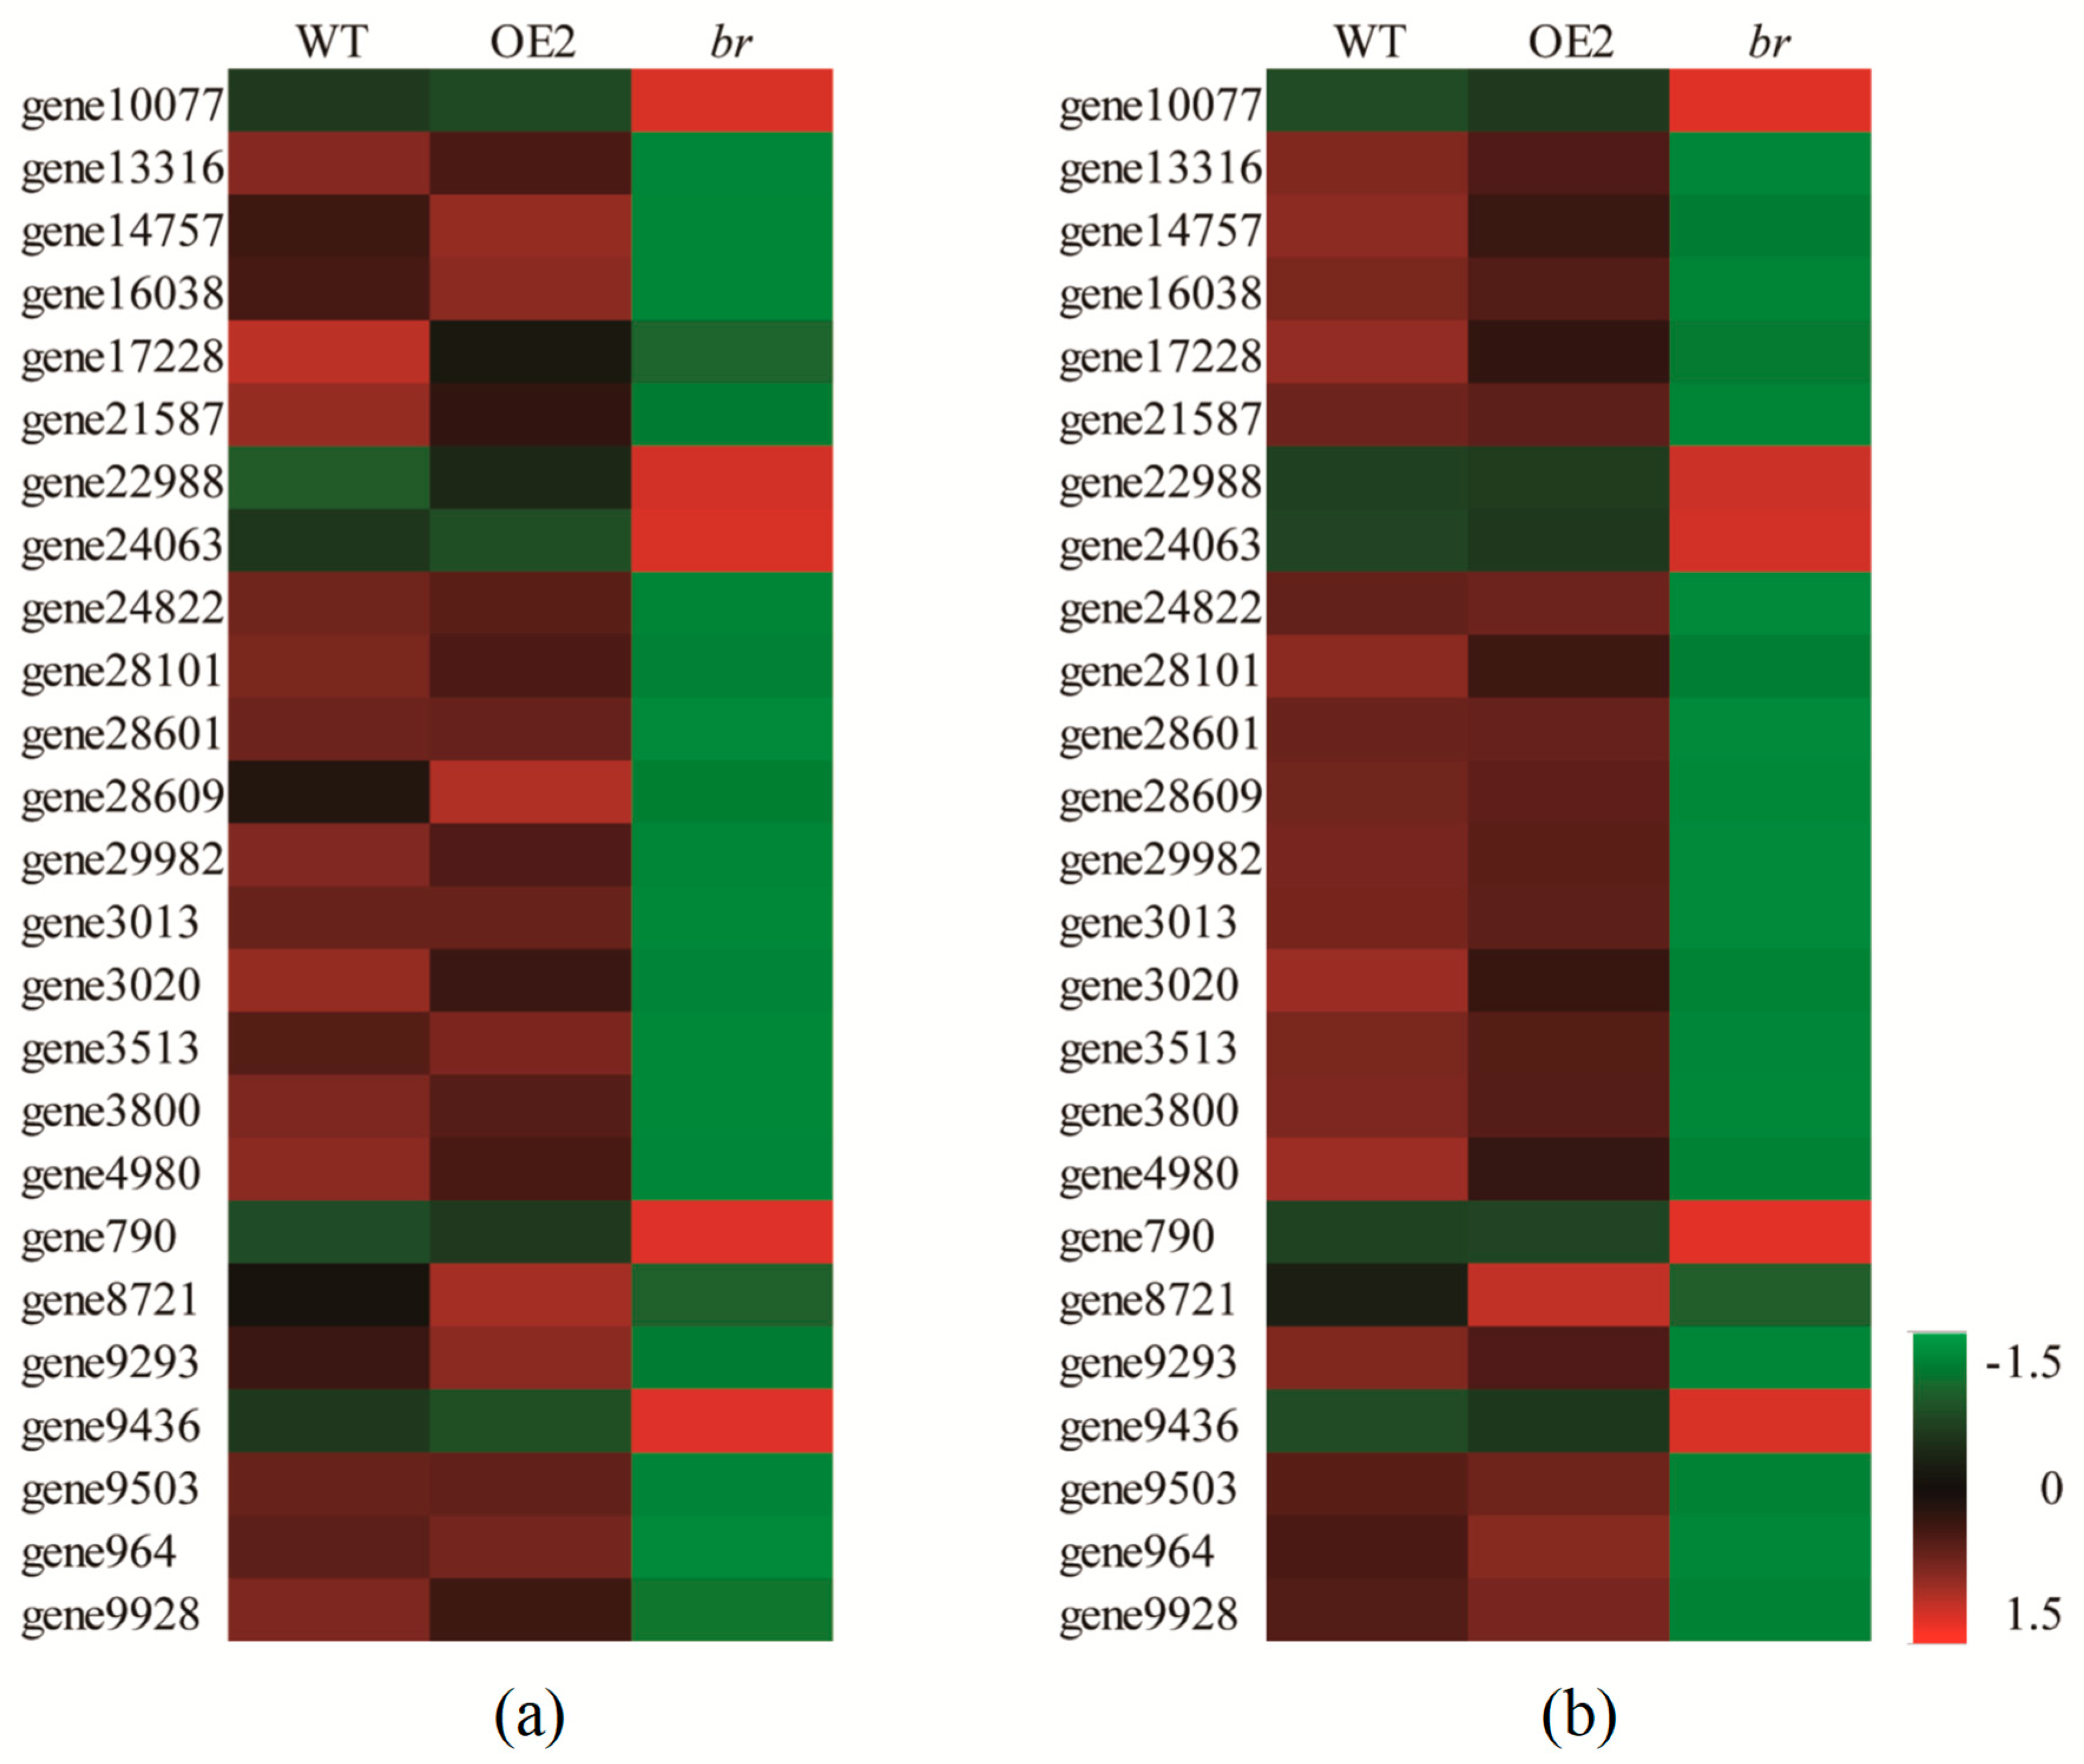
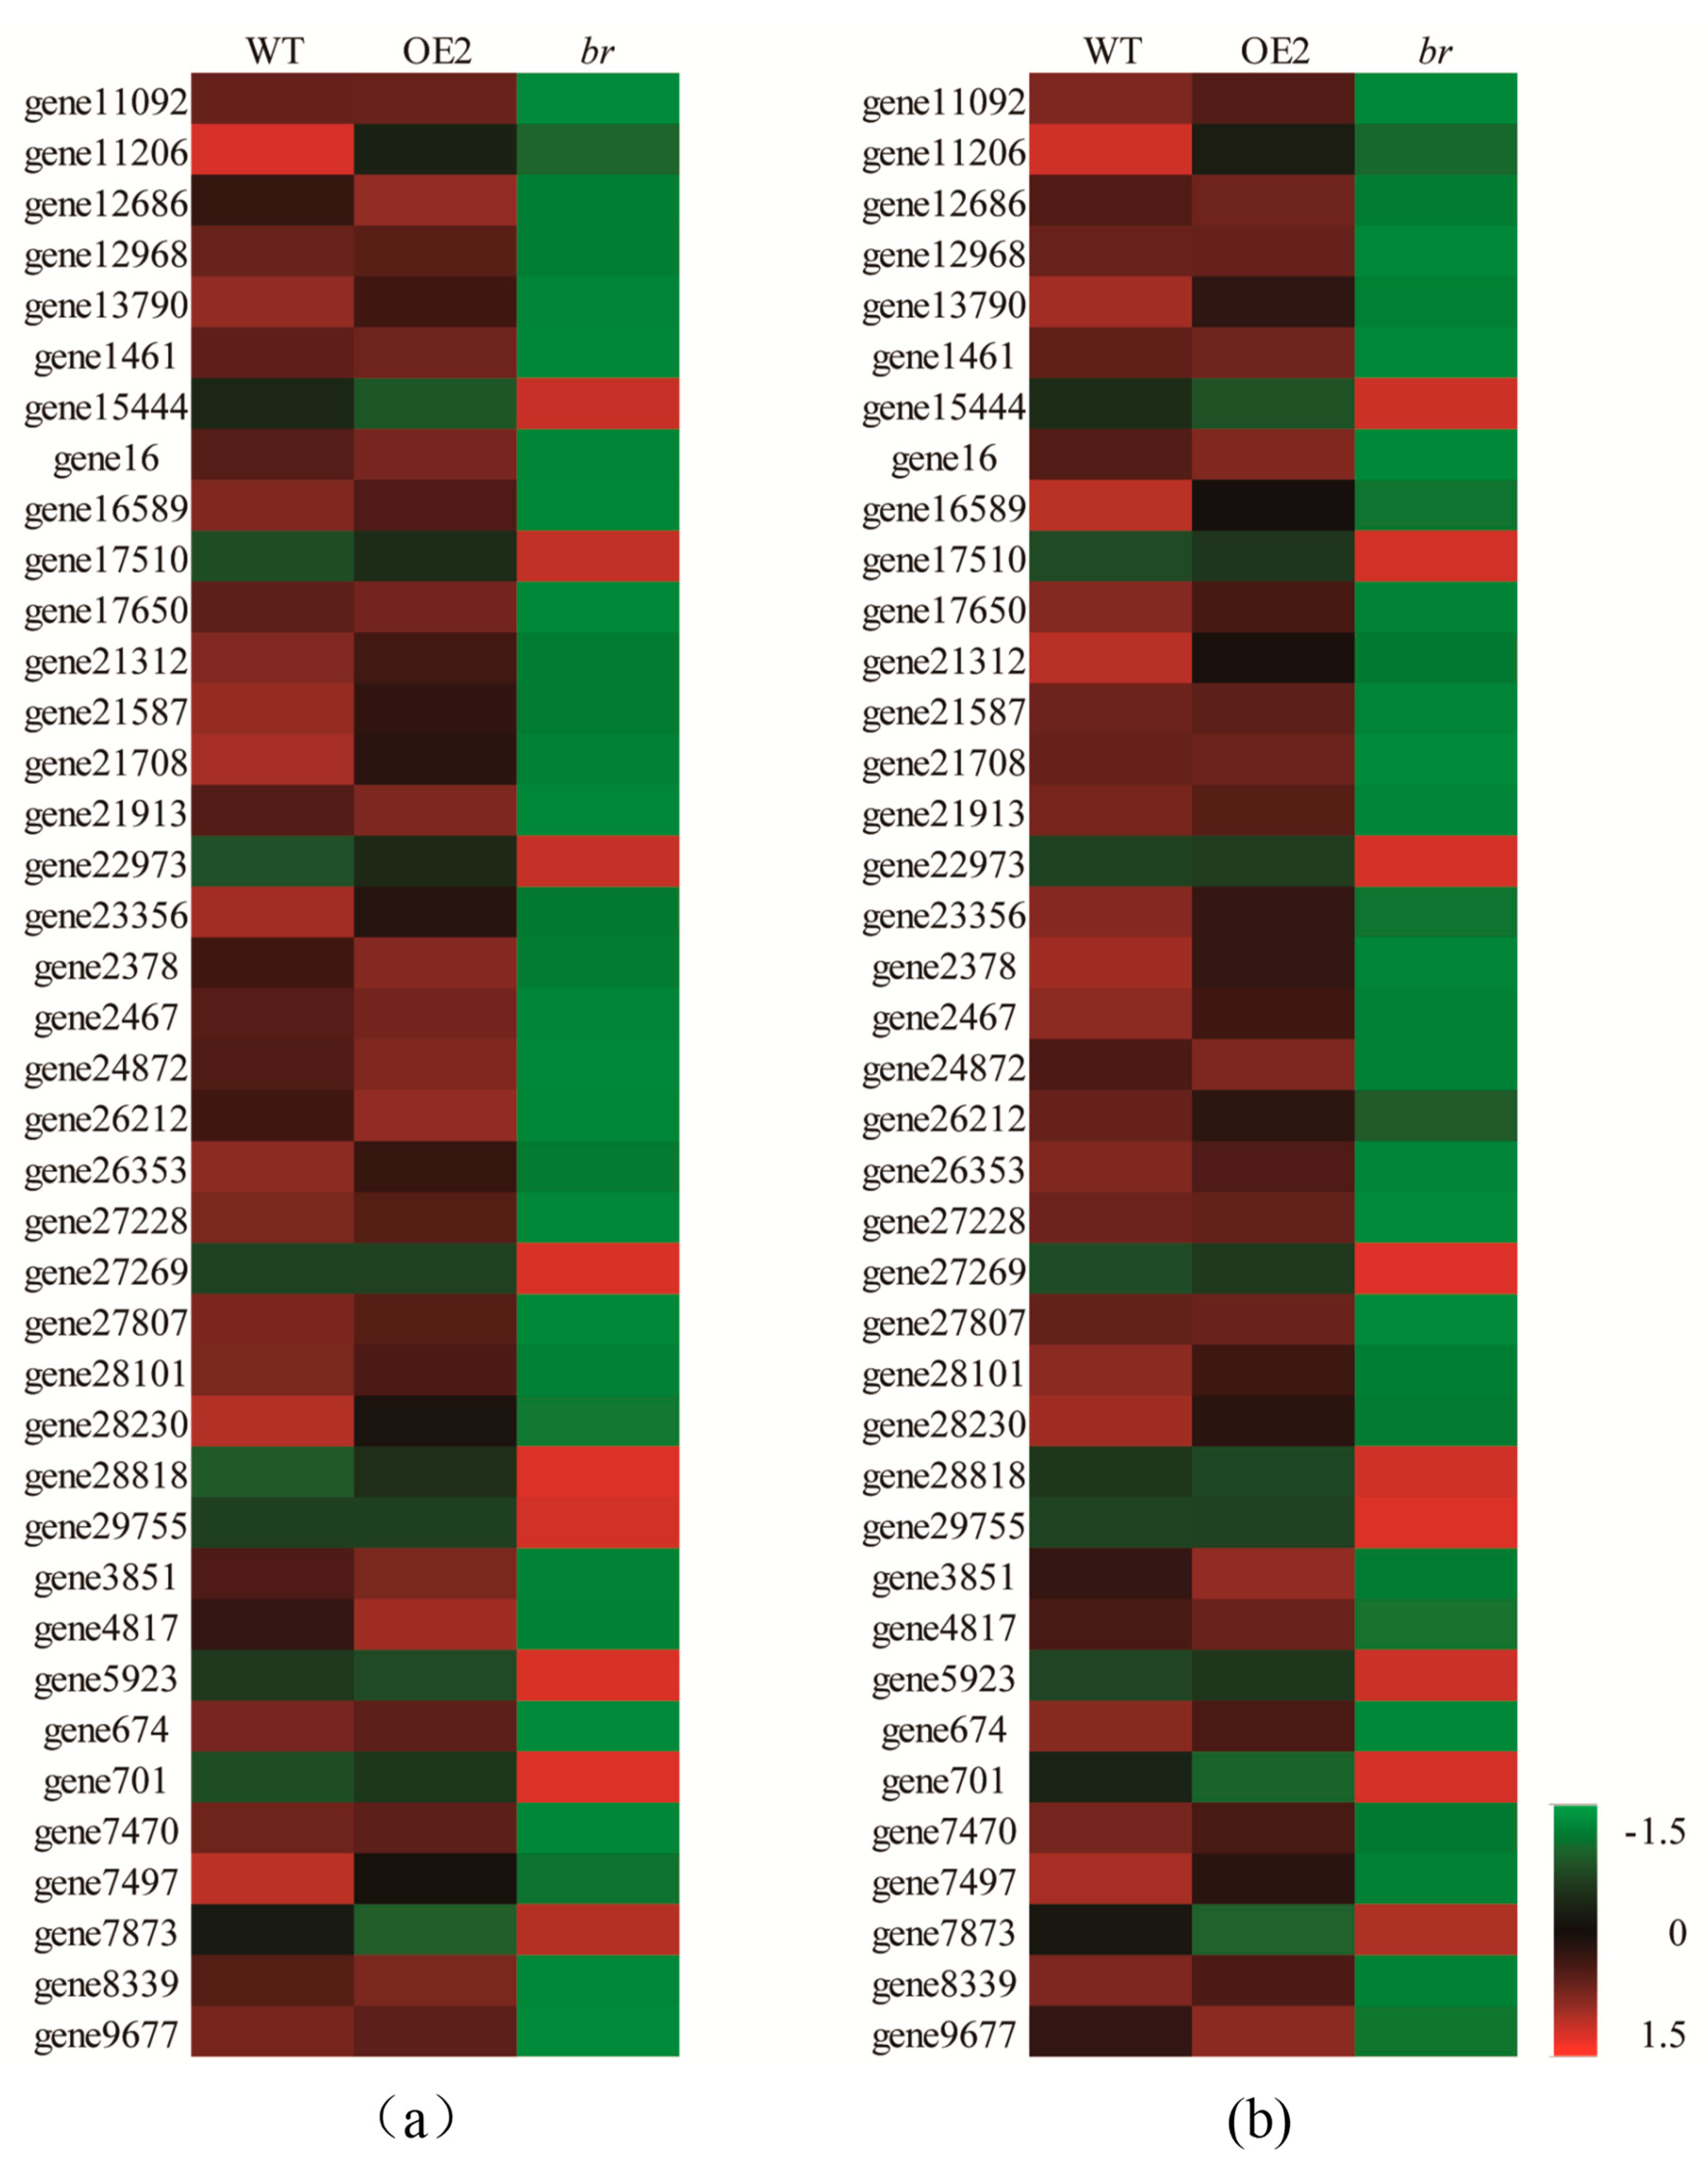
3.3.1. DEGs Related to Flower Development

As seven-year-old br was different from the WT and OE2, it did not form infructescence (Figure S6). We hypothesized that br might have had flower development defects which caused fertility deficiency and delayed the formation of infructescence. Therefore, 25 DEGs related to flower development were selected to analyze the expression changes in the main and lateral branches’ apical buds. It was found that gene 10077 (AP2-like), gene 22988 (TOE3), gene 24063 (MDIS1-interacting receptor like kinase 2-like), gene 790 (SAMS3), and gene 9436 (AP2/ERF) were up-regulated in br. However, 18 other DEGs were down-regulated, when compared to the two control lines, including gene13316 (HVA22-like), gene 14757 (Endoribonuclease Dicer homolog 2-like), gene 16038 (Apyrase 7), gene 17228 (Argonaute 5-like), gene 21587 (QUIRKY), gene 24822 (Coronatine-insensitive protein 1-like), gene 28101 (recQ-mediated genome protein 1), gene 28601 (LEO1), 28609 (Nuclefusion defeve 4-like), gene29982 (SPL8), gene3013 (Auxin response factor 2-like), gene3020 (SPL1), gene3513 (FEI2), gene3800 (Activating signal cointegrator 1-like), gene4980 (MADS10), gene8721 (AGL65), gene9293 (Argonaute 5), gene9503 (Nuclear fusion defective 4-like), gene964 (SPL13), and gene9928 (MDIS1-interacting receptor like kinase 2-like) (Figure 8a,b, Table S6). These results showed that changes of genes involved in floral development, flowering time, and plant fertility might have caused the fertility deficiency of br.

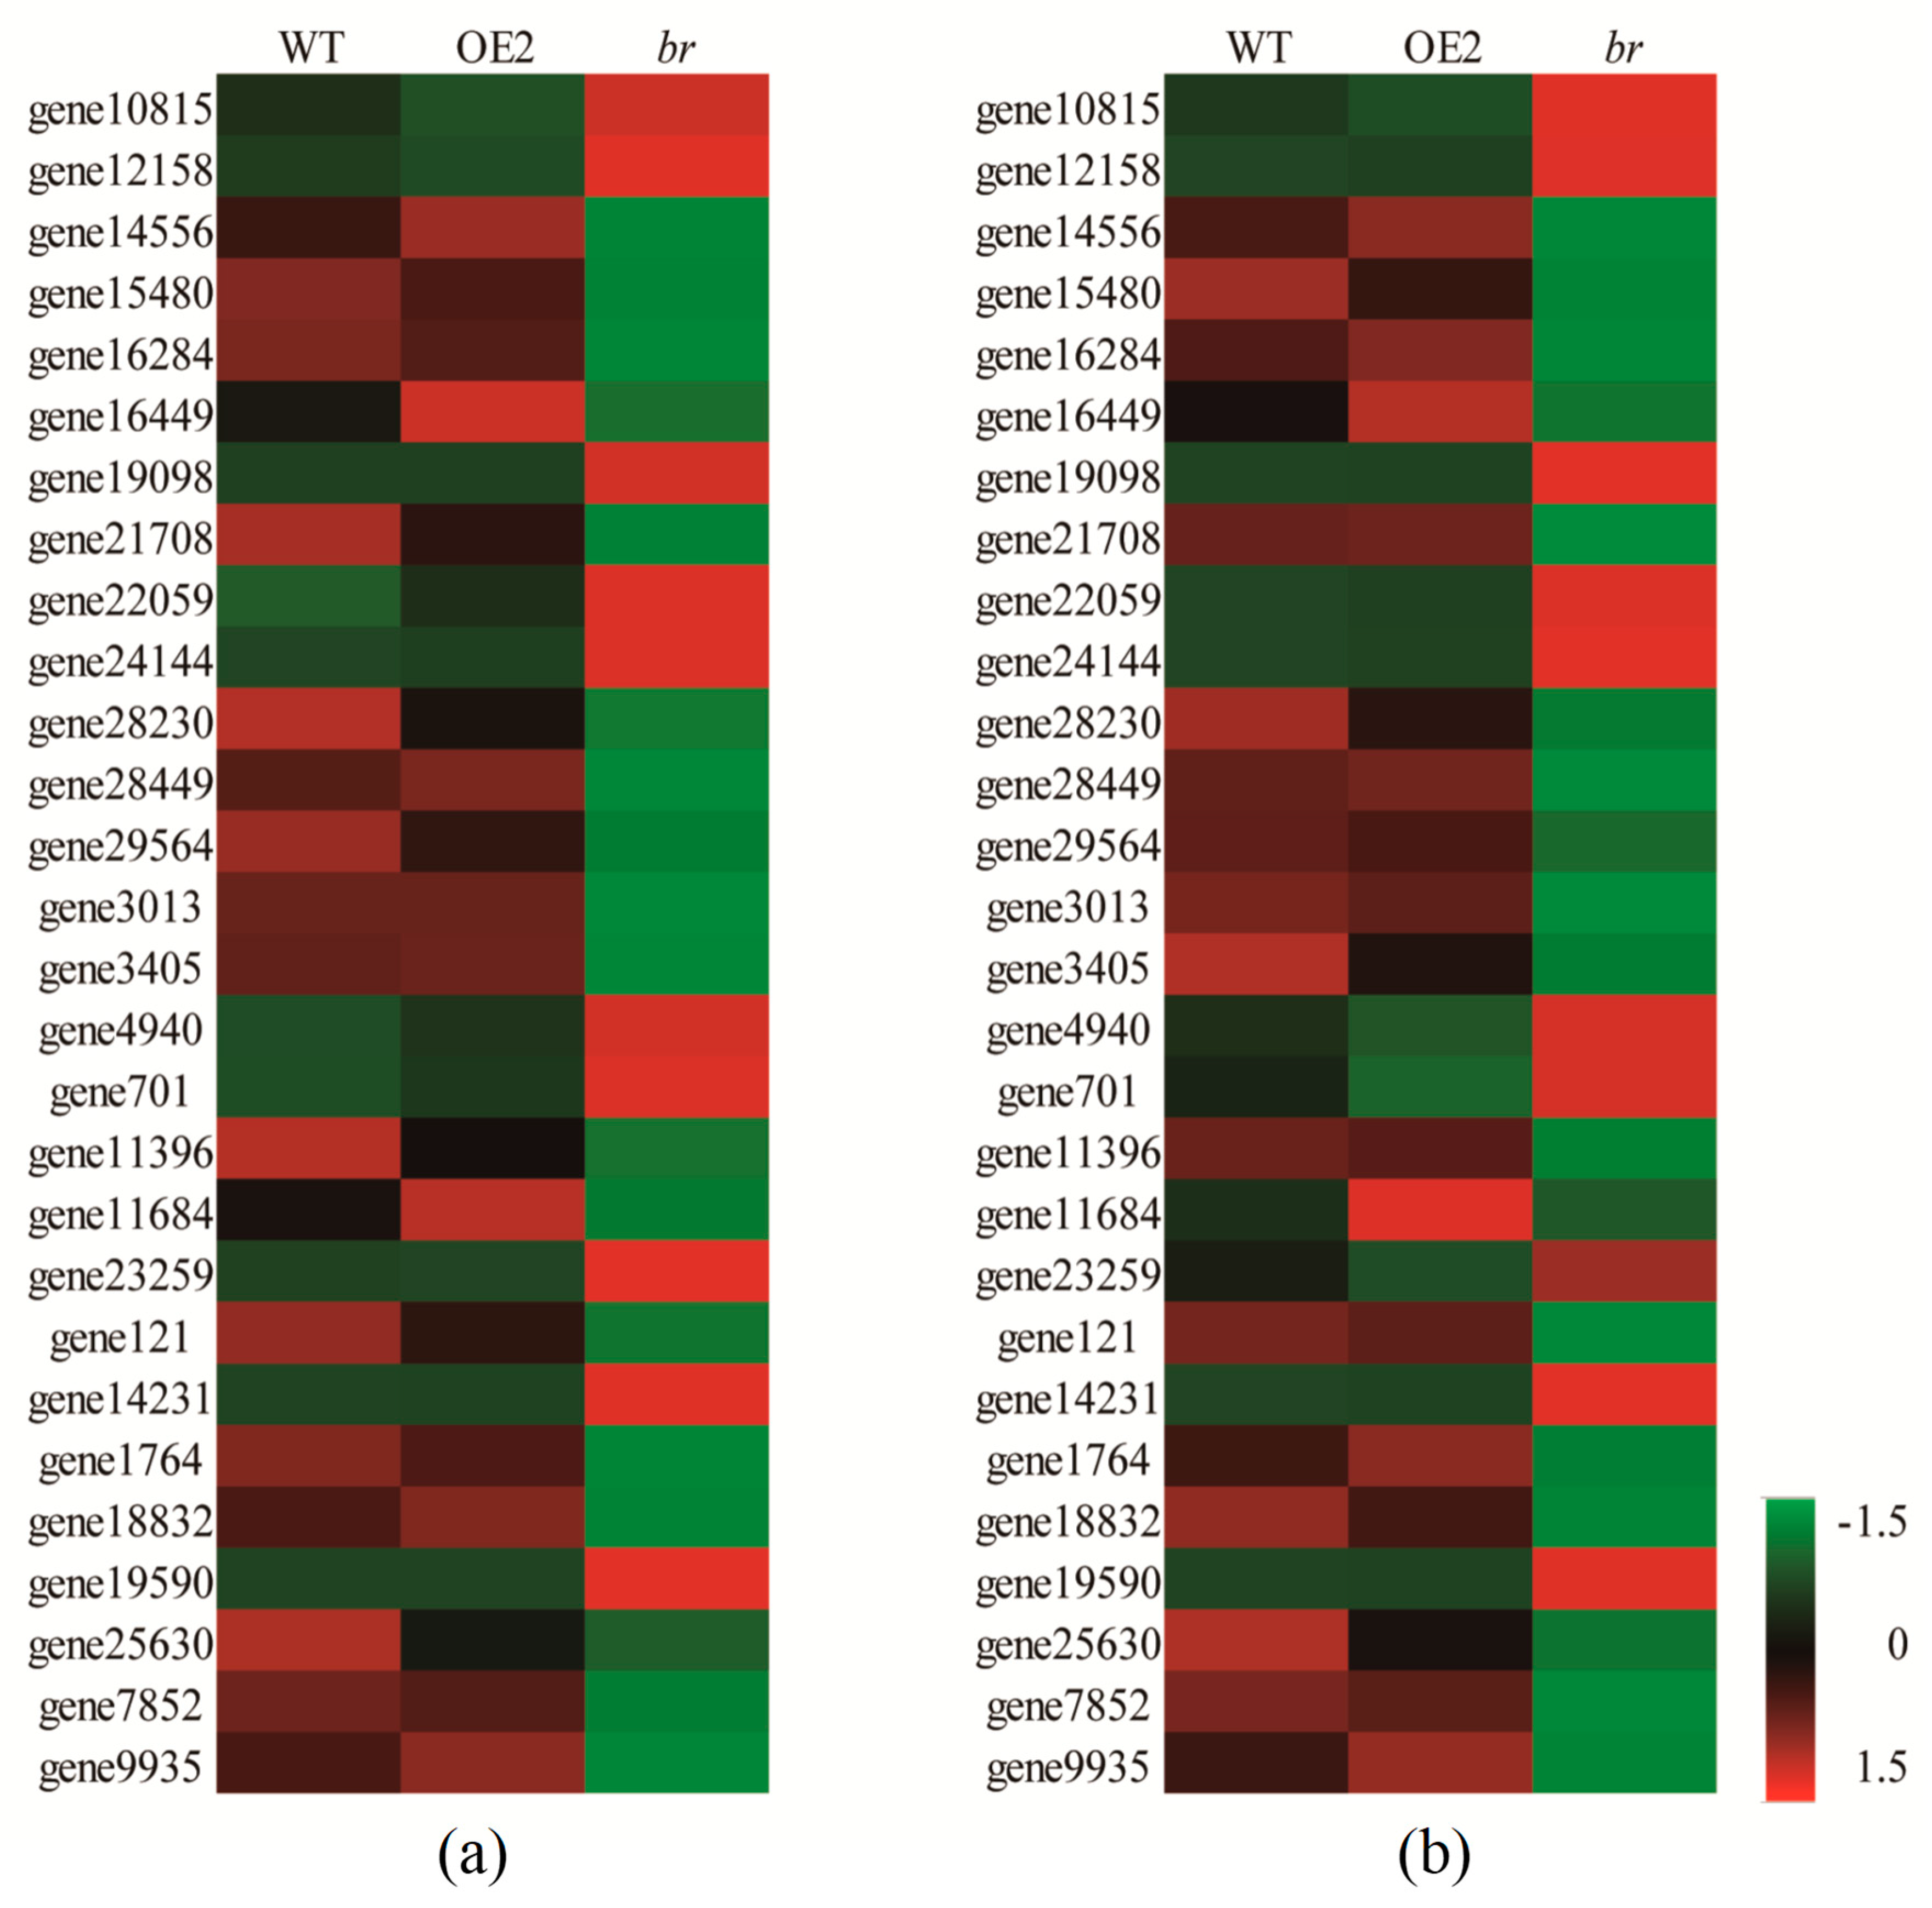
3.3.2. DEGs Related to Cell Division, Differentiation, and SAM Activity

As br was dwarf, weak, slow-growing, multiple-branches, and its apical buds were smaller than the control lines, 39 genes related to cell division and differentiation, SAM activity, and organ formation were selected and analyzed. It was found that gene 15444, gene 17510, gene 22973, gene 27269, gene 28818, gene 29755, gene 5923, gene 701, and gene 7873 were up-regulated in br, all these genes were involved in the meristem initiation, vegetative to reproductive phase transition of meristem and negatively regulated growth, based on Go annotation. In addition, there were 30 genes which were involved in regulating the cell cycle, cell division and differentiation, meristem activity, and organ formation, which were significantly down-regulated. (Figure 9a,b, Table S7). These results showed that the changes of these genes were related to the dwarf, multiple-branches, and small buds of br.

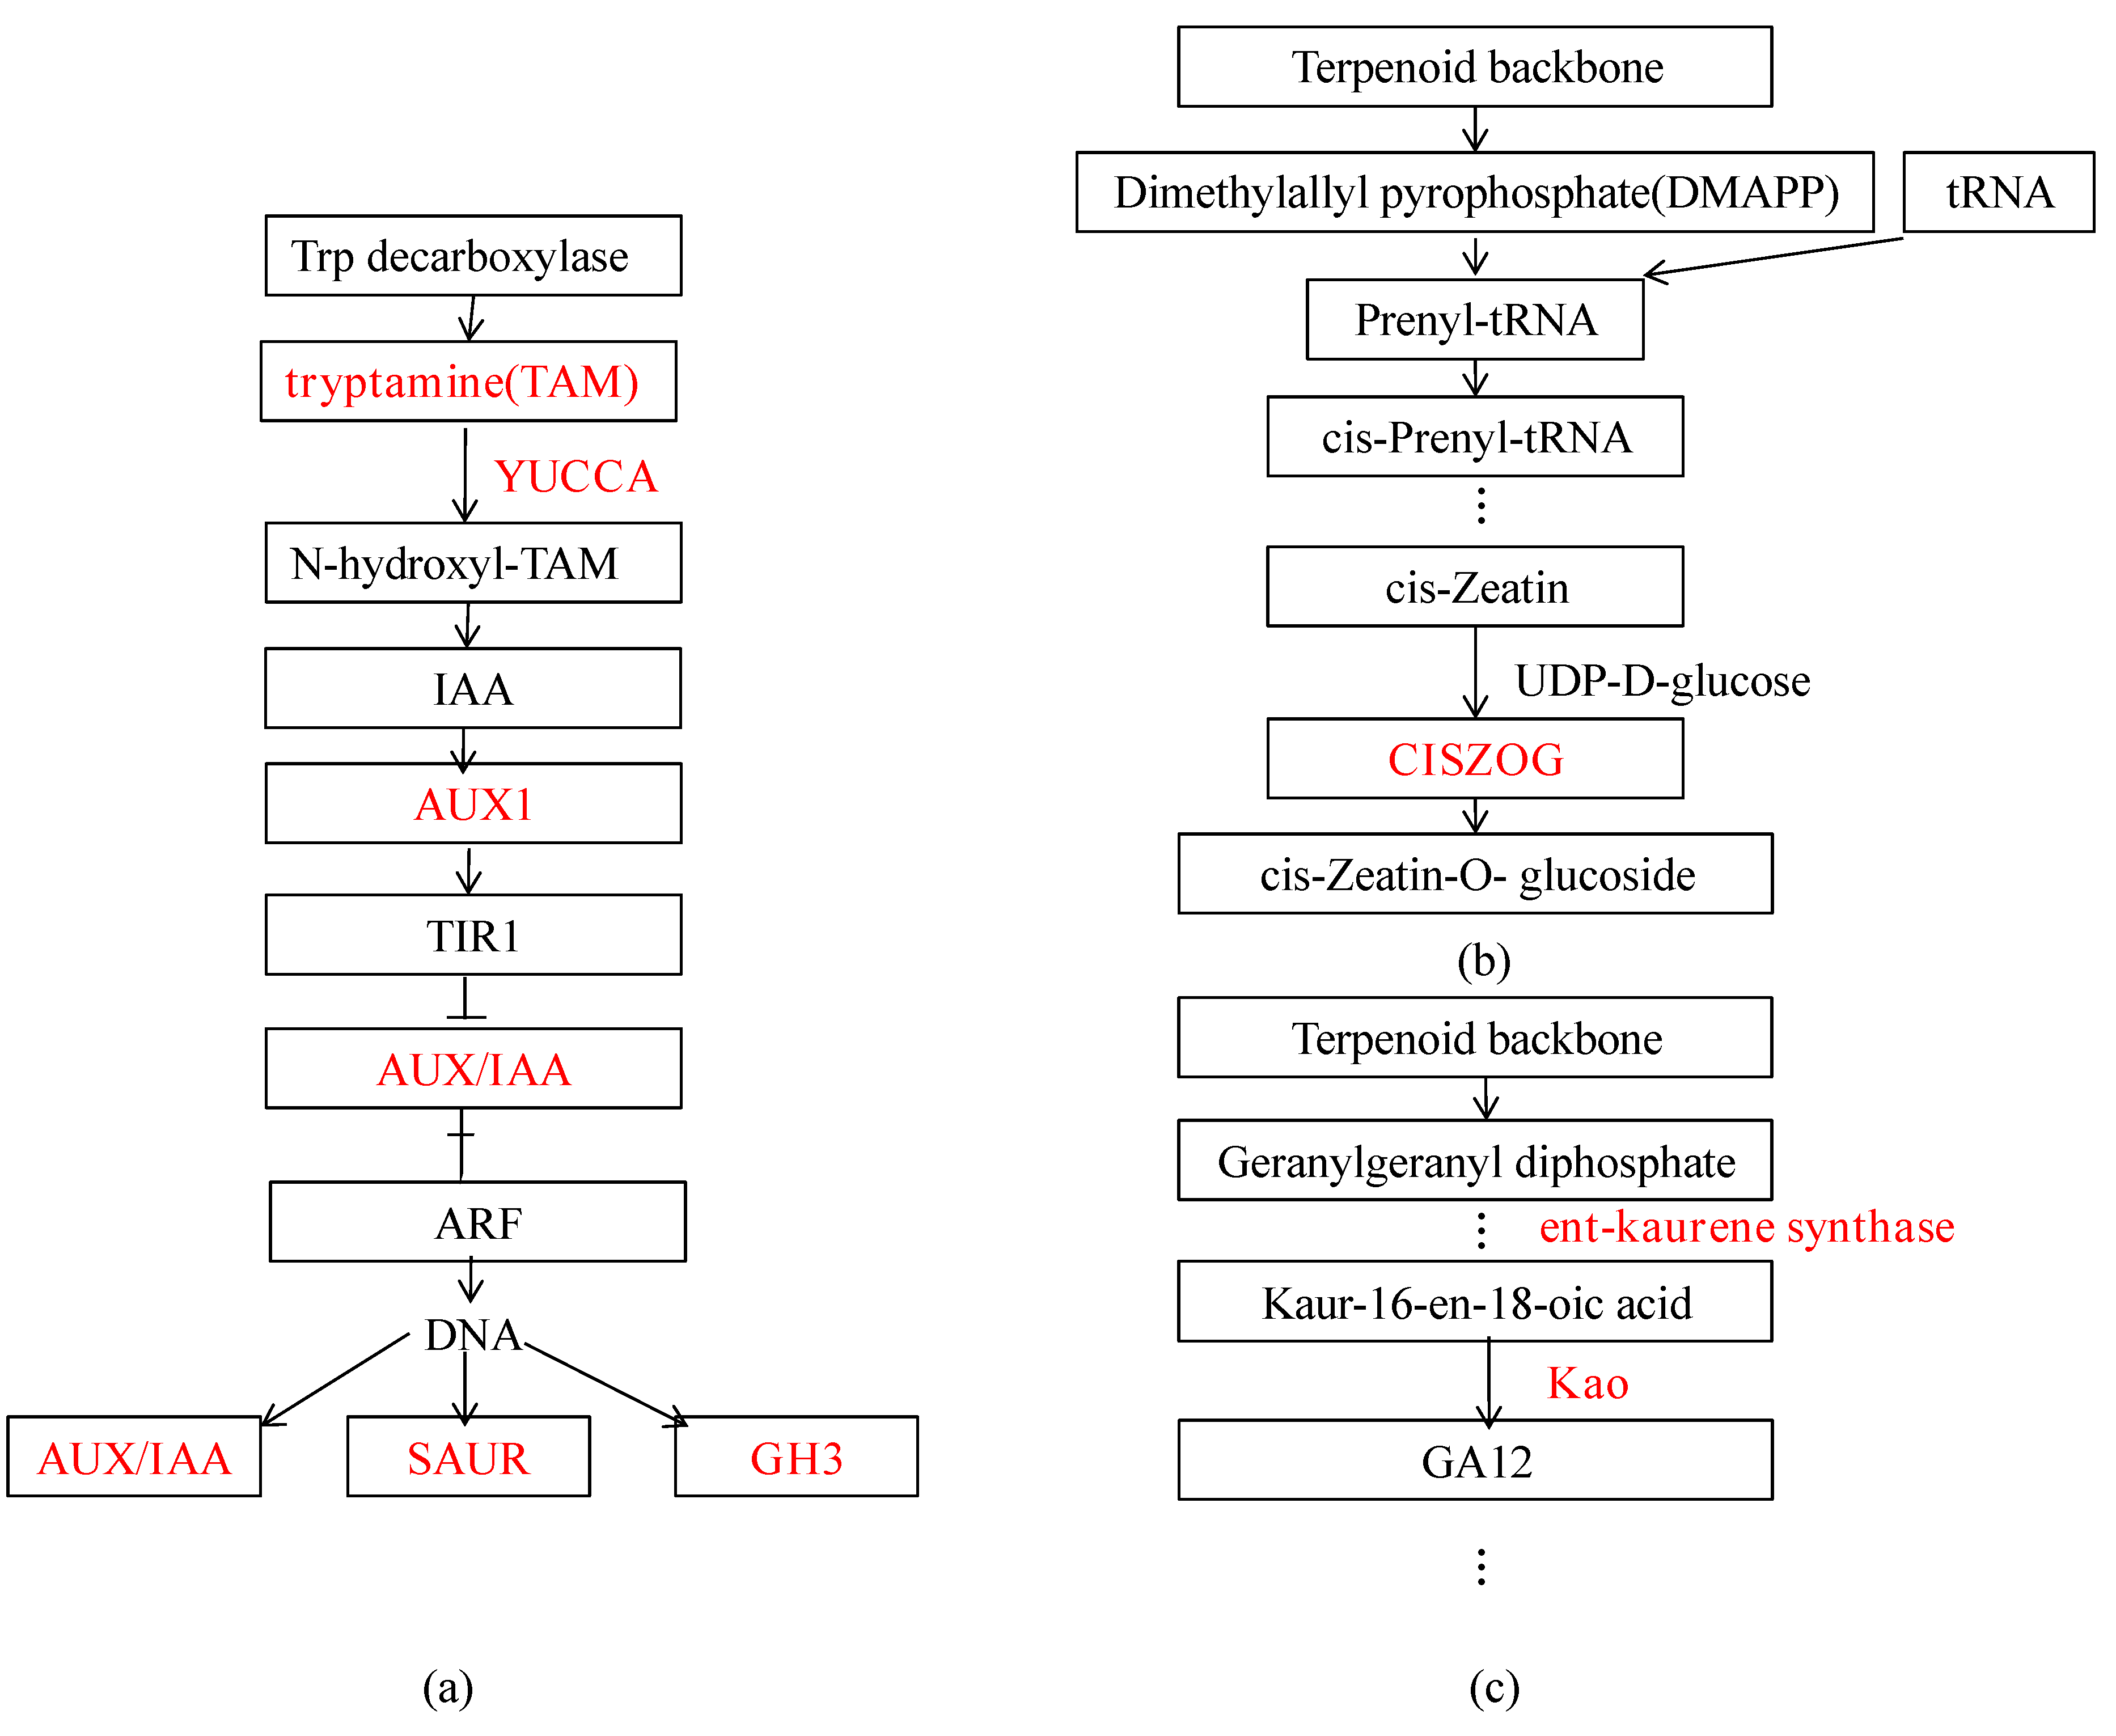
3.3.3. DEGs Related to Plant Hormones

Based on the KEGG and GO analysis, 28 genes involved in auxin biosynthesis and transduction, cytokinin biosynthesis, gibberellin biosynthesis, and response, were selected for analyses in br. The genes related to auxin biosynthesis, including gene15480, gene16284, and gene21708, were down-regulated. Similarly, the expression of seven auxin-responsive genes was down-regulated. While, the expression of gene4940 and gene701, which participated in auxin transduction and gene10815, gene19098, gene22059, and gene24144, which participated in auxin-responses, were up-regulated. The expression of gene11684, related to cytokinin biosynthesis, decreased in br. There were four genes involved in the gibberellin biosynthesis, in which gene18832 and gene9935 were down-regulated and gene14231 and gene19590 were up-regulated. The expression of genes participating in the gibberellin transduction reduced in br. (Figure 10a,b, Table S8). These results suggested that the changes of genes related to phytohormone of br led to abnormality in biosynthesis, distribution, and transduction of plant hormones.

4. Discussion

RNA-seq is an important method that has been widely used to analyze gene expression profiles and functions in different plants. Mu et al. and Lin et al. performed transcriptome analysis of B. pendula ‘Dalecarlica’ and B. pendula ‘Purple Rain’, to explore the mechanism of the leaf shape and leaf color, respectively. Their results laid a molecular foundation for the functional analysis of genes involved in plant growth and development [43,44]. In this study, we identified a multiple-branches mutant br from the BpCCR1 overexpression lines. Compared with WT and OE2, br exhibited phenotypes of dwarfing, multiple-branches, and small buds (Figure 2a, Figure 3). To investigate the molecular mechanism of the unique phenotype of br in birch, transcriptome sequencing of WT, OE2, and br were further performed. Genes involved in the SAM activity, cell division and differentiation, organ morphogenesis, plant hormone biosynthesis, and signal transduction were differentially expressed in br.
Compared with WT and OE2, we obtained 25 flowering-related genes, in total, in which SPL8 (gene29982), SPL1 (gene3020), SPL13 (gene964), MADS10 (gene4980), and AGL65 (gene8721) were decreased in br (Figure 8). Squamosa-binding factor like (SPL) transcription factors, directly or indirectly participate in different flowering pathways, to affect the flower formation, fertility development, and floral transition [45,46,47,48]. In Arabidopsis, SPL directly regulates the Minichromosome maintenance/Agamous/Deficiens/Serum response factor-box (MADS-box) that participates in many biological processes, including vegetative growth, floral transition, and floral organ development. Agamous-like (AGL) is specially expressed in flowers, and agl65agl66agl104-1 mutation exhibits abnormal pollen tube [49,50]. Therefore, we concluded that these flowering-related genes abnormally expressed in br led to fertility defects (Figure S6).
Most of the 39 genes involved in cell division and differentiation, SAM morphology, and activity were down-regulated in br (Figure 9). For example, E2F (gene13790) encoded a cell proliferation protein controlled by ubiquitin-mediated degradation, which affected the cell division in SAM. Lateral organ boundaries (LOB, gene 2378) was specifically expressed at organ boundaries, and played an important role in maintaining SAM integrity and organ differentiation. Teosinte branched1/Cycloidea/proliferating cell nuclear antigen factor1 (TCP13, gene9677) promotes the mitosis of petal cells and affects the leaf morphological development [51,52,53,54]. In addition, genes of the cyclin B family (gene16589 and gene21913) and genes which affect the maintenance and initiation of meristem (gene11092 and gene8839) were also down-regulated in br. Our results indicated that the reduction of these genes might have resulted in defects of the SAM structure, the distinct plant architecture, and in the growth traits in br.
Genes involved in biosynthesis, transduction, and response of the plant hormones were also analyzed. Auxin is one of the important hormones which regulates many biological processes throughout the life cycle of plants, such as stem and root development, leaf morphological development, vascular bundle formation, and differentiation [55,56]. There are four major tryptophan-dependent auxin biosynthesis pathways, including indole-3-acetamide (IAM), indole-3-pyruvic acid (IPA), tryptamine (TAM), and indole-3-acetaldoxime (IAOX) pathways [57,58,59]. YUCCA proteins are crucial enzymes for auxin biosynthesis, and mutants of YUCCA can lead to the reduction of auxin content [60]. Auxin signal transduction begins with the specific binding between auxin and the auxin receptor, which then activates the AUX/IAA and promotes the expression of the response genes. In the br main and lateral branches’ apical buds, YUCCA7 (gene16284) was down-regulated while auxin-response genes, such as IAA4 (gene19098), IAA12 (gene22059), IAA18 (gene10815), and SUR1-like (gene12158) were up-regulated. Our results indicated that the decrease of YUCCA7 might affect the auxin biosynthesis and reduce the IAA content in the apical buds of br. However, overexpression of the auxin-responsive genes suggests that there were no defects in signal transduction (Figure 11a).
Cytokinin controls plant cell division and regulates leaf senescence, chloroplast formation, and seed dormancy. In addition, cytokinin can also cooperate with other hormones to affect the lateral bud development, thereby, changing the plant architecture [61,62,63]. Cytokinin exists mainly in the form of isoprenoids in plants and there are two pathways (breakdown of tRNA and de novo synthesis) for zeatin biosynthesis [64,65]. Zeatin is classified into ubiquitous trans-zeatin and less active cis-zeatin. Cis-zeatin might work at a specific developmental stage of the plant, and it might be related to male sterility [66,67]. cisZOG1 encodes a cis-zeatin-specific O-glucosyltransferase which regulates the biosynthesis of cis-zeatin [68]. Our results indicated that the reduction of cisZOG1 (gene11684) in br has effects on cell division and differentiation in SAM, plant architecture, and fertility (Figure 11b).
Gibberellin is a diterpenoid plant hormone involved in the control of many important developmental processes, including plant growth, seed growth, anther growth, and flowering time [69,70,71]. It can also interact with auxin, cytokinin, abscisic acid, ethylene, and jasmonic acid to affect plant growth, development, and resistance [72,73,74,75,76,77,78]. The biosynthesis of gibberellin is divided into three steps. The first step is to form ent-kaurene by cyclization of the GGDP precursors twice. In the second step, ent-kaurene is oxidized into GA12. In the third step, GA12 forms different intermediates and Gas [70]. In br, gene18832 participating in ent-kaurene biosynthesis was down-regulated, while gene14231 and gene19590 encoding Kao were up-regulated. We inferred that the changes of these gene expression might have decreased the GA content and have had effects on the plant growth, floral development, and fertility in br (Figure 11c).
In summary, we found that there were many changes of gene expression patterns in the br main and lateral apical buds, compared with WT and OE2. These genes were involved in the process of cell division and differentiation, establishment of flowers and leaves, biosynthesis and signal transduction of plant hormones. However, we still do not know if the phenotypic mutation of br is caused by the changes of one gene or multiple genes, which need to be verified by subsequent experiments.

5. Conclusions

In this study, we identified br which exhibited dwarf, multiple-branches, small leaves, and apical buds. About 406 DEGs, 396 DEGs, and 653 DEGs were obtained in the br apical buds of the main branches, lateral branches’ apical buds, and apical buds from the overlap of DEGs between WT vs. br and OE2 vs. br, respectively. These genes involved in the SAM activity, organogenesis, cell division and differentiation, plant hormone biosynthesis, and signal transduction, based on annotation, were important to the unique phenotype of br.

Supplementary Materials

The following are available online at https://www.mdpi.com/1999-4907/10/5/374/s1, Figure S1: Growth performance of three-year-old WT, OE2, and br, Figure S2: Ko00908 pathway, in which the red marker gene (gene 11684) was contained in DEGs and significantly down-regulated, Figure S3: Ko00904 pathway, in which the red marker genes (gene14231, gene18832, and gene19590) were contained in DEGs, Figure S4: Ko00308 pathway, in which the red marker genes (gene15480, gene16284, and gene21708) were contained in DEGs and down-regulated, Figure S5: Plant hormone signal transduction, three red marker genes (gene 22059, gene 23259 and gene 7394) were contained in DEGs of main branches apical buds and up-regulated, four green line genes (gene12948, gene7394, gene22059, and gene24822) were found in DEGs of lateral branches’ apical buds, nine genes (gene12948, gene7394, gene10815, gene19098, gene22059, gene4940, gene24119, gene11396, and gene3405) marked using blue lines were found in apical buds (including main and lateral branches apical buds), Figure S6: The infructescence of seven-year-old WT, OE2, and br, white arrows represent the infructescence of birch. Table S1: The primer sequences used in qRT-PCR, Table S2: Multiple comparison of the stomatal morphological index in the tested lines, Table S3: DEGs of apical buds of the main branches involved in biological regulation, development, growth, and signal transduction based on gene ontology, Table S4: DEGs of lateral branches’ apical buds involved in biological regulation, development, growth, and signal transduction based on gene ontology, Table S5: DEGs of main and lateral branches’ apical buds involved in biological regulation, development, growth, and signal transduction based on gene ontology, Table S6: The gene ID, sequences, and annotations of the 25 flowering-related genes, Table S7: The gene ID, sequences, and annotations of the 39 genes involved in cell division, differentiation and the SAM activity, Table S8: The gene ID, sequences, and annotations of the 28 genes involved in biosynthesis, transduction, and response of plant hormones.

Author Contributions

J.J. and G.L. designed the experiments; R.H., C.L., and W.X. performed the experiments; R.H., S.W., and X.B. analyzed the data; R.H. wrote the manuscript; J.J. revised the manuscript.

Funding

This research was funded by the National Key R&D Program of China (2017YFD0600603) and the 111 Project (B16010).

Acknowledgments

We are grateful for the mutant br and control lines generated by Rui Wei and Wenbo Zhang.

Conflicts of Interest

The authors declare no conflict of interest.

References

  1. Tanaka, W.; Pautler, M.; Jackson, D.; Hirano, H.-Y. Grass Meristems II: Inflorescence Architecture, Flower Development and Meristem Fate. Plant Cell Physiol. 2013, 54, 313–324. [Google Scholar] [CrossRef] [PubMed] [Green Version]
  2. Bleecker, A.B.; Grbić, V. Axillary meristem development in Arabidopsis thaliana. Plant J. 2000, 21, 215–223. [Google Scholar] [Green Version]
  3. Welling, A.; Rinne, P.; Viherä-Aarnio, A.; Kontunen-Soppela, S.; Heino, P.; Palva, E.T. Photoperiod and temperature differentially regulate the expression of two dehydrin genes during overwintering of birch (Betula pubescens Ehrh.). J. Exp. Bot. 2004, 55, 507–516. [Google Scholar] [CrossRef] [PubMed] [Green Version]
  4. Girault, T.; Bergougnoux, V.; Combes, D.; Viemont, J.D.; Leduc, N. Light controls shoot meristem organogenic activity and leaf primordia growth during bud burst in Rosa sp. Plant Cell Environ. 2008, 31, 1534–1544. [Google Scholar] [CrossRef]
  5. Evers, J.B.; Vos, J.; Andrieu, B.; Struik, P.C. Cessation of tillering in spring wheat in relation to light interception and red: Far-red ratio. Annu. Bot. 2006, 97, 649–658. [Google Scholar] [CrossRef]
  6. Vernoux, T.; Besnard, F.; Traas, J. Auxin at the shoot apical meristem. Cold Spring Harb. Perspect. Biol. 2010, 2, a001487. [Google Scholar] [CrossRef]
  7. Reinhardt, D.; Mandel, T.; Kuhlemeier, C. Auxin regulates the initiation and radial position of plant lateral organs. Plant Cell 2000, 12, 507–518. [Google Scholar] [CrossRef] [PubMed]
  8. Carraro, N.; Peaucelle, A.; Laufs, P.; Traas, J. Cell differentiation and organ initiation at the shoot apical meristem. Plant Mol. Biol. 2006, 60, 811–826. [Google Scholar] [CrossRef]
  9. Werner, T.; Motyka, V.; Strnad, M.; Schmülling, T. Regulation of plant growth by cytokinin. Proc. Nat. Acad. Sci. USA 2001, 98, 10487–10492. [Google Scholar] [CrossRef] [PubMed] [Green Version]
  10. Werner, T.; Motyka, V.; Laucou, V.; Smets, R.; Onckelen, H.V. Cytokinin-deficient transgenic Arabidopsis plants show multiple developmental alterations indicating opposite functions of cytokinins in the regulation of shoot and root meristem activity. Plant Cell 2003, 15, 2532–2550. [Google Scholar] [CrossRef]
  11. Zhuang, W.B.; Gao, Z.H.; Wang, L.J.; Zhong, W.J.; Ni, Z.J.; Zhang, Z. Comparative proteomic and transcriptomic approaches to address the active role of GA4 in Japanese apricot flower bud dormancy release. J. Exp. Bot. 2013, 64, 4953–4966. [Google Scholar] [CrossRef] [PubMed] [Green Version]
  12. Zhuang, W.B.; Gao, Z.H.; Wen, L.H.; Huo, X.M.; Cai, B.H.; Zhang, Z. Metabolic changes upon flower bud break in Japanese apricot are enhanced by exogenous GA4. Hortic Res. 2015, 2, 15046. [Google Scholar] [CrossRef] [PubMed] [Green Version]
  13. Perales, M.; Reddy, G.V. Stem cell maintenance in shoot apical meristems. Curr. Opin. Plant Biol. 2012, 15, 10–16. [Google Scholar] [CrossRef] [PubMed]
  14. Xie, M.; Tataw, M.; Reddy, G.V. Towards a functional understanding of cell growth dynamics in shoot meristem stem cell niche. Semin. Cell Dev. Biol. 2009, 20, 1126–1133. [Google Scholar] [CrossRef]
  15. Laufs, P.; Grandjean, O.; Jonak, C.; Kieu, K.; Traas, J. Cellular parameters of the shoot apical meristem in Arabidopsis. Plant. Cell. 1998, 10, 1375–1390. [Google Scholar] [CrossRef] [PubMed]
  16. Yadav, R.K.; Perales, M.; Gruel, J.; Girke, T.; Jönsson, H.; Reddy, G.V. WUSCHEL protein movement mediates stem cell homeostasis in the Arabidopsis shoot apex. Genes Dev. 2011, 25, 2025–2030. [Google Scholar] [CrossRef]
  17. Brand, U.; Grünewald, M.; Hobe, M.; Simon, R. Regulation of CLV3 expression by two homeobox genes in Arabidopsis. Plant Physiol. 2002, 129, 565–575. [Google Scholar] [CrossRef]
  18. Schoof, H.; Lenhard, M.; Haecker, A.; Mayer, K.F.; Jürgens, G.; Laux, T. The stem cell population of Arabidopsis shoot meristems is maintained by a regulatory loop betweenthe CLAVATA and WUSCHEL genes. Cell 2000, 100, 635–644. [Google Scholar] [CrossRef]
  19. Gordon, S.P.; Chickarmane, V.S.; Ohno, C.; Meyerowitz, E.M. Multiple feedback loops through cytokinin signaling control stem cell number within the Arabidopsis shoot meristem. Proc. Nat. Acad. Sci. 2009, 106, 16529–16534. [Google Scholar] [CrossRef]
  20. Jasinski, S.; Piazza, P.; Craft, J.; Hay, A.; Woolley, L.; Rieu, I.; Phillips, A.; Hedden, P.; Tsiantis, M. KNOX action in Arabidopsis is mediated by coordinate regulation of cytokinin and gibberellin activities. Curr. Biol. 2005, 15, 1560–1565. [Google Scholar] [CrossRef]
  21. Hay, A.; Tsiantis, M. KNOX genes: Versatile regulators of plant development and diversity. Development 2010, 137, 3153–3165. [Google Scholar] [CrossRef]
  22. Mudunkothge, J.S.; Krizek, B.A. Three Arabidopsis AIL/PLT genes act in combination to regulate shoot apical meristem function. Plant J. 2012, 71, 108–121. [Google Scholar] [CrossRef]
  23. Wu, G.; Park, M.Y.; Conway, S.R.; Wang, J.W.; Weigel, D.; Poethig, R.S. The sequential action of miR156 and miR172 regulates developmental timing in Arabidopsis. Cell 2009, 138, 750–759. [Google Scholar] [CrossRef]
  24. Jung, J.H.; Seo, Y.H.; Seo, P.J.; Reyes, J.L.; Yun, J.; Chua, N.H.; Park, C.M. The GIGANTEA-regulated microRNA172 mediates photoperiodic flowering independent of CONSTANS in Arabidopsis. Plant Cell 2007, 19, 2736–2748. [Google Scholar] [CrossRef]
  25. Raman, S.; Greb, T.; Peaucelle, A.; Blein, T.; Laufs, P.; Theres, K. Interplay of miR164, CUP-SHAPED COTYLEDON genes and LATERAL SUPPRESSOR controls axillary meristem formation in Arabidopsis. Plant J. 2008, 55, 65–76. [Google Scholar] [CrossRef]
  26. Laufs, P.; Peaucelle, A.; Morin, H.; Traas, J. microRNA regulation of the CUC genes is required for boundary size control in Arabidopsis meristems. Development 2004, 131, 4311–4322. [Google Scholar] [CrossRef]
  27. Marioni, J.C.; Mason, C.E.; Mane, S.M.; Stephens, M.; Gilad, Y. RNA-seq: An assessment of technical reproducibility and comparison with gene expression arrays. Genome Res. 2008, 18, 1509–1517. [Google Scholar] [CrossRef] [Green Version]
  28. Zhang, J.Z.; Ai, X.Y.; Sun, L.M.; Zhang, D.L.; Guo, W.W.; Deng, X.X.; Hu, G.G. Transcriptome profile analysis of flowering molecular processes of early flowering trifoliate orange mutant and the wild-type [Poncirus trifoliata (L.) Raf.] by massively parallel signature sequencing. BMC Genom. 2011, 12, 63. [Google Scholar] [CrossRef]
  29. Hoshika, Y.; Watanabe, M.; Carrari, E.; Paoletti, E.; Koike, T. Ozone-induced stomatal sluggishness changes stomatal parameters of Jarvis-type model in white birch and deciduous oak. Plant Biol. 2018, 20, 20–28. [Google Scholar] [CrossRef]
  30. Gang, H.X.; Liu, G.F.; Chen, S.; Jiang, J. Physiological and transcriptome analysisof a yellow-green leaf mutant in birch (Betula platyphylla × B. Pendula). Forests 2019, 10, 120. [Google Scholar] [CrossRef]
  31. Guo, H.Y.; Wang, Y.C.; Hu, P.; Wang, Y.M.; Jiang, Y.; Yang, C.P.; Wang, C. Gene expression profiles in different stem internodes reveal the genetic regulation of primary and secondary stem development in Betula platyphylla. Tree Genet. Genomes 2016, 12, 113. [Google Scholar] [CrossRef]
  32. Zhang, W.B.; Wei, R.; Chen, S.; Jiang, J.; Li, H.Y.; Wang, S.; Wei, H.R.; Liu, G.F. Functional Characterization of Cinnamoyl-CoA Reductase (CCR) in birch (B. platyphylla × B. pendula) through overexpression and suppression analysis. Physiol. Plant. 2015, 154, 283–296. [Google Scholar] [CrossRef] [PubMed]
  33. Chang, S.J.; Puryear, J.; Cairney, J. A simple and efficient method for isolating RNA from pine trees. Plant Mol. Biol. Rep. 1993, 11, 113–116. [Google Scholar] [CrossRef]
  34. Dobin, A.; Gingeras, T.R. Comment on “TopHat2: Accurate alignment of transcriptomes in the presence of insertions, deletions and gene fusions” by Kim et al. Bioinformatics 2013, 14, 000851. [Google Scholar]
  35. Young, M.D.; Wakefield, M.J.; Smyth, G.K.; Oshlack, A. Gene ontology analysis for RNA-seq: Accounting for selection bias. Genome Biol. 2010, 11, R14. [Google Scholar] [CrossRef] [PubMed]
  36. Kanehisa, M.; Araki, M.; Goto, S.; Hattori, M.; Hirakawa, M.; Itoh, M.; Katayama, T.; Kawashima, S.; Okuda, S.; Tokimatsu, T.; et al. KEGG for linking genomes to life and the environment. Nucleic Acids Res. 2008, 36, 480–484. [Google Scholar] [CrossRef] [PubMed]
  37. Mao, X.Z.; Cai, T.; Olyarchuk, J.G.; Wei, L.P. Automated genome annotation and pathway identification using the KEGG Orthology (KO) as a controlled vocabulary. Bioinformatics 2005, 21, 3787–3793. [Google Scholar] [CrossRef] [PubMed] [Green Version]
  38. Xie, C.; Mao, X.Z.; Huang, J.J.; Ding, Y.; Wu, J.M.; Dong, S.; Kong, L.; Gao, G.; Li, C.Y.; Wei, L.P. KOBAS 2.0: A web server for annotation and identification of enriched pathways and diseases. Nucleic Acids Res. 2011, 39, 316–322. [Google Scholar] [CrossRef]
  39. Madera, M. Profile Comparer: A program for scoring and aligning profile hidden Markov models. Bioinformatics 2008, 24, 2630–2631. [Google Scholar] [CrossRef]
  40. Wang, L.K.; Feng, Z.X.; Wang, X.; Wang, X.W.; Zhang, X.G. DEGseq: An R package for identifying differentially expressed genes from RNA-seq data. Bioinformatics 2010, 26, 136–138. [Google Scholar] [CrossRef]
  41. Huang, H.J.; Wang, S.; Jiang, J.; Liu, G.F.; Li, H.Y.; Chen, S.; Xu, H.W. Overexpression of BpAP1 induces early flowering and produces dwarfism in Betula platyphylla × Betula pendula. Physiol. Plant. 2013, 151, 495–506. [Google Scholar] [CrossRef] [PubMed]
  42. Livak, K.J.; Schmittgen, T.D. Analysis of relative gene expression data using real-time quantitative PCR and the 2−∆∆CT Method. Methods 2001, 25, 402–408. [Google Scholar] [CrossRef]
  43. Mu, H.Z.; Lin, L.; Liu, G.F.; Jiang, J. Transcriptomic analysis of incised leaf-shape determination in birch. Gene 2013, 531, 263–269. [Google Scholar] [CrossRef]
  44. Lin, L.; Mu, H.Z.; Jiang, J.; Liu, G.F. Transcriptomic analysis of purple leaf determination in birch. Gene 2013, 526, 251–258. [Google Scholar] [CrossRef] [PubMed]
  45. Schmid, M.; Uhlenhaut, N.H.; Godard, F.; Demar, M.; Bressan, R.; Weigel, D.; Lohmann, J.U. Dissection of floral induction pathways using global expression analysis. Development 2003, 130, 6001–6012. [Google Scholar] [CrossRef] [Green Version]
  46. Silva, G.F.F.E.; Silva, E.M.; da Silva Azevedo, M.; Guivin, M.A.; Ramiro, D.A.; Fiqueiredo, C.R.; Carrer, H.; Peres, L.E.; Nogueira, F.T. microRNA156-targeted SPL/SBP box transcription factors regulate tomato ovary and fruit development. Plant J. 2014, 78, 604–618. [Google Scholar] [CrossRef] [PubMed] [Green Version]
  47. Xing, S.; Salinas, M.; Garcia-Molina, A.; Höhmann, S.; Berndtgen, R.; Huijser, P. SPL8 and miR156-targeted SPL genes redundantly regulate Arabidopsis gynoecium differential patterning. Plant J. 2013, 75, 566–577. [Google Scholar] [CrossRef] [PubMed]
  48. Jung, J.H.; Ju, Y.; Seo, P.J.; Lee, J.H.; Park, C.M. The SOC1-SPL module integrates photoperiod and gibberellic acid signals to control flowering time in Arabidopsis. Plant J. 2012, 69, 577–588. [Google Scholar] [CrossRef]
  49. Smaczniak, C.; Immink, R.G.; Angenent, G.C.; Kaufmann, K. Developmental and evolutionary diversity of plant MADS-domain factors: Insights from recent studies. Development 2012, 139, 3081–3098. [Google Scholar] [CrossRef]
  50. Adamczyk, B.J.; Fernandez, D.E. MIKC*MADS domain heterodimers are required for pollen maturation and tube growth in Arabidopsis. Plant Physiol. 2009, 149, 1713–1723. [Google Scholar] [CrossRef]
  51. Del Pozo, J.C.; Boniotti, M.B.; Gutierrez, C. Arabidopsis E2Fc functions in cell division and is degraded by the ubiquitin-SCF(AtSKP2) pathway in response to light. Plant Cell 2002, 14, 3057–3071. [Google Scholar] [CrossRef] [PubMed]
  52. Bell, E.M.; Lin, W.C.; Husbangds, A.Y.; Jaganatha, V.; Mangeon, A.; Neff, M.M.; Girke, T.; Springer, P.S. Arabidopsis lateral organ boundaries negatively regulates brassinosteroid accumulation to limit growth in organ boundaries. Proc. Natl. Acad. Sci. USA 2012, 109, 21146–21151. [Google Scholar] [CrossRef] [PubMed]
  53. Efroni, I.; Blum, E.; Golshmid, A.; Eshd, Y. A protracted and dynamic maturation schedule underlies Arabidopsis leaf development. Plant Cell 2008, 20, 2293–2306. [Google Scholar] [CrossRef] [PubMed]
  54. Huang, T.; Irish, V.F. Temporal control of plant organ growth by TCP transcription factors. Curr. Biol. Rep. 2015, 25, 1765–1770. [Google Scholar] [CrossRef] [PubMed]
  55. Davies, P.J. The plant hormones: Their nature, occurrence, and functions. Plant Horm. 2010, 1–15. [Google Scholar] [CrossRef]
  56. Qin, G.J.; Gu, H.Y.; Zhao, Y.D.; Ma, Z.Q.; Shi, G.L.; Yang, Y.; Pichersky, E.; Chen, H.D.; Liu, M.H.; Chen, Z.L.; Qu, L.J. An indole-3-acetic acid carboxyl methyltransferase regulates Arabidopsis leaf development. Plant Cell 2005, 17, 2693–2704. [Google Scholar] [CrossRef] [PubMed]
  57. Korasick, D.A.; Enders, T.A.; Strader, L.C. Auxin biosynthesis and storage forms. J. Exp. Bot. 2013, 64, 2541–2555. [Google Scholar] [CrossRef] [Green Version]
  58. Mano, Y.; Nemoto, K. The pathway of auxin biosynthesis in plants. J. Exp. Bot. 2012, 63, 2853–2872. [Google Scholar] [CrossRef] [Green Version]
  59. Mashiguchi, K.; Tanaka, K.; Sakai, T.; Sugawara, S.; Kawaide, H.; Natsume, M.; Hanada, A.; Yaeno, T.; Shiasu, K.; Yao, H.; et al. The main auxin biosynthesis pathway in Arabidopsis. Proc. Natl. Acad. Sci. USA 2011, 108, 18512–18517. [Google Scholar] [CrossRef]
  60. Zhao, Y.; Christensen, S.K.; Fankhauser, C.; Cashman, J.R.; Cohen, J.D.; Weigel, D.; Chory, J. A role for flavin monooxygenase-like enzymes in auxin biosynthesis. Science 2001, 291, 306–309. [Google Scholar] [CrossRef]
  61. Sakakibara, H. Cytokinins: Activity, biosynthesis, and translocation. Annu. Rev. Plant Biol. 2006, 57, 431–449. [Google Scholar] [CrossRef]
  62. Tanaka, M.; Takei, K.; Kijima, M.; Sakakibara, H.; Mori, H. Auxin controls local cytokinin biosynthesis in the nodal stem in apical dominance. Plant J. 2006, 45, 1028–1036. [Google Scholar] [CrossRef] [Green Version]
  63. Müller, D.; Waldie, T.; Miyawaki, K.; To, J.P.; Melnyk, C.W.; Kieber, J.J.; Kakimoto, T.; Leyser, O. Cytokinin is required for escape but not release from auxin mediated apical dominance. Plant J. 2015, 82, 874–886. [Google Scholar] [CrossRef]
  64. Haberer, G.; Kieber, J.J. Cytokinins. New insights into a classic phytohormone. Plant Physiol. 2002, 128, 354–362. [Google Scholar] [CrossRef]
  65. Schmitz, R.Y.; Skoog, F. Cytokinins: Synthesis and biological activity of geometric and position isomers of zeatin. Plant Physiol. 1972, 50, 702–705. [Google Scholar] [CrossRef]
  66. Emery, R.J.; Leport, L.; Barton, J.E.; Turner, N.C.; Atkins, C.A. cis-isomers of cytokinins predominate in chickpea seeds throughout their development. Plant Physiol. 1998, 117, 1515–1523. [Google Scholar] [CrossRef]
  67. Louis, J.P.; Augur, C.; Teller, G. Cytokinins and differentiation processes in mercurialis annua. Plant Physiol. 1990, 94, 1535–1541. [Google Scholar] [CrossRef]
  68. Martin, R.C.; Mok, M.C.; Habben, J.E.; Mok, D.W. A maize cytokinin gene encoding an O-glucosyltransferase specific to cis-zeatin. Proc. Natl. Acad. Sci. USA 2001, 98, 5922–5926. [Google Scholar] [CrossRef] [Green Version]
  69. Hedden, P. The genes of the green revolution. Trends Genet. 2003, 19, 5–9. [Google Scholar] [CrossRef]
  70. Yamaguchi, S. Gibberellin metabolism and its regulation. Annu. Rev. Plant Biol. 2008, 59, 225–251. [Google Scholar] [CrossRef]
  71. García-Martínez, J.L.; López-Diaz, I.; Sánchez-Beltrán, M.J.; Phillips, A.L.; Ward, D.A.; Gaskin, P.; Hedden, P. Isolation and transcript analysis of gibberellin 20-oxidase genes in pea and bean in relation to fruit development. Plant Mol. Biol. 1997, 33, 1073–1084. [Google Scholar] [CrossRef]
  72. Willige, B.C.; Isono, E.; Richter, R.; Zourelidou, M.; Schwechheimer, C. Gibberellin regulates PIN-FORMED abundance and is required for auxin transport-dependent growth and development in Arabidopsis thaliana. Plant Cell 2011, 23, 2184–2195. [Google Scholar] [CrossRef] [PubMed]
  73. Fleishon, S.; Shani, E.; Ori, N.; Weiss, D. Negative reciprocal interactions between gibberellin and cytokinin in tomato. New Phytol. 2011, 190, 609–617. [Google Scholar] [CrossRef] [Green Version]
  74. Yaish, M.W.; El-Kereamy, A.; Zhu, T.; Beatty, P.H.; Good, A.G.; Bi, Y.M.; Rothstein, S.J. The APETALA-2-like transcription factor OsAP2-39 controls key interactions between abscisic acid and gibberellin in rice. PLoS Genet. 2011, 6, e1001098. [Google Scholar] [CrossRef] [PubMed]
  75. Gómez-Cadenas, A.; Zentella, R.; Walker-Simmons, M.K.; Ho, T.-H.D. Gibberellin/Abscisic acid antagonism in barley aleurone cells: Site of action of the protein kinase PKABA1 in relation to gibberellin signaling molecules. Plant Cell 2001, 13, 667–679. [Google Scholar] [CrossRef]
  76. Dubois, V.; Moritz, T.; García-Martínez, J.L. Examination of two lowland rice cultivars reveals that gibberellin-dependent early response to submergence is not necessarily mediated by ethylene. Plant Signal Behav. 2011, 6, 134–136. [Google Scholar] [CrossRef] [Green Version]
  77. Ferguson, B.J.; Foo, E.; Ross, J.J.; Reid, J.B. Relationship between gibberellin, ethylene and nodulation in Pisum sativum. New Phytol. 2011, 189, 829–842. [Google Scholar] [CrossRef]
  78. Navarro, L.; Bari, R.; Achard, P.; Lisón, P.; Nemri, A.; Harberd, N.P.; Jones, J.D. DELLAs control plant immune responses by modulating the balance of jasmonic acid and salicylic acid signaling. Curr. Biol. 2008, 18, 650–655. [Google Scholar] [CrossRef]
Figure 1. Variations in thirty-day rooting seedlings of wild type (WT), overexpressed transgenic birch (OE2), and mutant birch (br). (a) Dry to wet ratio of the aboveground part (stem and leaf) and the underground part (root) of the tested lines; (b) water content of the aboveground and underground parts of the tested lines; and (c) rooting index of the tested lines.
Forests 10 00374 g001
Figure 2. Growth traits of three-year-old WT, OE2, and br. (a) Height, primary, and secondary branch numbers of the tested lines; (b) leaf morphology, leaf area, veins number, leaf length, leaf width, leaf base angle, and leaf apex angle of the tested lines; and (c) lower epidermis cells and stomas morphology, bars: 40 μm.
Forests 10 00374 g002
Figure 3. The morphology and microstructures of the apical buds in three-year-old WT, OE2, and br. (a) The morphology of the main and lateral branches’ apical buds in the tested lines, bars: 2 mm; and (b) the length and width of the main and the lateral branches’ apical buds in the tested lines; (c) the microstructures of the main and lateral branches’ apical buds in the tested lines, bars: 4 mm; and (d) the width of the main and lateral branches shoot apical meristem (SAM) in the tested lines.
Forests 10 00374 g003
Figure 4. Quantitative real-time PCR verification of RNA-seq. The red line represented the result of qRT-PCR, and the green line represented the result of RNA-seq. The materials were WT, OE2, and br main and lateral branches’ apical buds, from left to right.
Forests 10 00374 g004
Figure 5. Transcriptomic analyses of three-year-old WT, OE2, and br apical buds of the main branches. (a) Venn diagram of the differentially expressed genes (DEGs) in WT vs. br and OE2 vs. br; (b) Gene ontology of the DEGs in the overlap of WT vs. br and OE2 vs. br, the dark bars represents all genes while the light bars represents the DEGs; and (c) Kyoto Encyclopedia of Genes and Genomes (KEGG) classification of DEGs in the overlap of WT vs. br and OE2 vs. br, red boxes were mentioned.
Forests 10 00374 g005aForests 10 00374 g005b
Figure 6. Transcriptomic analyses of three-year-old WT, OE2, and br lateral branches’ apical buds. (a) Venn diagram of DEGs in WT vs. br and OE2 vs. br; (b) gene ontology of DEGs in the overlap of WT vs. br and OE2 vs. br, the dark bars represent all genes while the light bars represent the DEGs; and (c) KEGG classification of DEGs in the overlap of WT vs. br and OE2 vs. br, red boxes were mentioned.
Forests 10 00374 g006aForests 10 00374 g006b
Figure 7. Transcriptomic analyses of three-year-old WT, OE2, and br apical buds. (a) Venn diagram of DEGs in WT vs. br and OE2 vs. br; (b) gene ontology of DEGs in the overlap of WT vs. br and OE2 vs. br, the dark bars represents all genes while the light bars represents DEGs; and (c) KEGG classification of DEGs in the overlap of WT vs. br and OE2 vs. br, red boxes were mentioned.
Forests 10 00374 g007aForests 10 00374 g007b
Figure 8. Expression pattern of the flowering-related genes in three-year-old WT, OE2, and br. (a) Thermal map of the flowering-related genes in the apical buds of the main branches; (b) thermal map of the flowering-related genes in the lateral branches’ apical buds. Analysis was performed using normalization for 25 genes identified by RNA-seq.
Forests 10 00374 g008
Figure 9. Expression pattern of genes involved in cell division, differentiation and SAM activity in three-year-old WT, OE2, and br. (a) Thermal map of the genes involved in cell division, differentiation, and SAM activity, in apical buds of the main branches; and (b) thermal map of the mentioned genes in the lateral branches’ apical buds. Analysis was performed using the normalization for 39 genes identified by the RNA-seq.
Forests 10 00374 g009
Figure 10. Expression pattern of genes related to plant hormones in three-year-old WT, OE2, and br. (a) Thermal map of genes involved in biosynthesis, transduction, and response of plant hormones in the apical buds of the main branches; and (b) thermal map of the mentioned genes in the lateral branches’ apical buds. Analysis was performed using normalization for the 28 genes identified by RNA-seq. Genes involved in auxin biosynthesis, transduction, and response, were from gene10815 to gene701; genes involved in cytokinin biosynthesis and response, were from gene11396 to gene23259; gibberellin-related genes were from gene121 to gene9935.
Forests 10 00374 g010
Figure 11. Biosynthesis and signal transduction pathways of plant hormones. (a) Auxin biosynthesis and signal transduction pathway; (b) cytokinin biosynthesis pathway; and (c) gibberellin biosynthesis pathway. The red markers were involved in our DEGs.
Forests 10 00374 g011
Table 1. Multiple comparison of biomass in the tested lines.
LineStem Length (cm)The Average Root Length (cm)Root NumberAboveground PartUnderground Part
Fresh Weight (g)Dry Weight (g)Fresh Weight (g)Dry Weight (g)
WT1.47 ± 0.35b1.49 ± 0.61a2.67 ± 0.90a0.0894 ± 0.0035a0.0119 ± 0.0012b0.0294 ± 0.0041a0.0031 ± 0.0004b
OE21.80 ± 0.36a1.38 ± 0.45a6.15 ± 1.28b0.0772 ± 0.0013b0.0202 ± 0.0004a0.0186 ± 0.0031b0.0057 ± 0.0010a
br1.22 ± 0.30b0.87 ± 0.23b1.73 ± 0.70c0.0361 ± 0.0005c0.0105 ± 0.0001b0.0049 ± 0.0012c0.0013 ± 0.0003c
Table 2. Sequencing quality evaluation.
SamplesClean ReadsClean BasesGC Content% ≥Q30Total ReadsMapped Reads
T115,781,4884,734,446,40046.66%94.51%31,562,97629,638,044 (93.90%)
T214,560,7164,368,214,80046.73%93.71%29,121,43227,269,226 (93.64%)
T315,447,7054,634,311,50046.78%94.23%30,895,41029,080,761 (94.13%)
T415,587,0544,676,116,20046.72%94.11%31,174,10829,278,066 (93.92%)
T515,785,9474,735,784,10046.54%94.24%31,571,89429,547,843 (93.59%)
T615,605,4164,681,624,80046.83%94.25%31,210,83229,297,703 (93.87%)
T715,346,0684,603,820,40046.82%94.15%30,692,13628,791,530 (93.81%)
T815,205,6284,561,688,40047.25%94.24%30,411,25628,635,215 (94.16%)
T915,521,4524,656,435,60047.01%94.52%31,042,90429,292,901 (94.36%)
T1015,223,6134,567,083,90047.64%94.46%30,447,22628,809,352 (94.62%)
T1115,137,9894,541,396,70046.93%94.64%30,275,97828,600,140 (94.46%)
T1214,686,3134,405,893,90047.19%94.22%29,372,62627,687,905 (94.26%)
Samples—sequencing samples; clean reads—total pair-end reads in clean data; clean bases—total base number in clean data; GC content—percentage of G and C bases in clean bases; % ≥Q30—percentage of bases with clean data quality values greater than or equal to 30; total reads—number of clean reads, in single-end terms; mapped reads—the number of reads mapped to the reference genome and the percentage of clean reads. T1 and T2 represented the apical buds of the main branches of WT; T3 and T4 represented the lateral branches’ apical buds of WT; T5 and T6 represented the apical buds of the main branches of OE2; T7 and T8 represented the lateral branches’ apical buds of OE2; T9 and T10 represented the apical buds of the main branches of br; T11 and T12 represented the lateral branches’ apical buds of br.
Table 3. Functional annotations of new genes.
Annotated DatabasesNew Gene Number
COG329
GO853
KEGG492
KOG799
Pfam890
Swiss-Prot986
eggNOG1365
Nr1532
All1550
Annotated databases—databases for functional annotations; new gene number—the number of new genes annotated for the corresponding database. COG/KOG—clusters of orthologous groups protein databases; GO—gene ontology; KEGG—Kyoto encyclopedia of genes and genomes; Pfam—protein family; Swiss-Prot—a manually annotated and reviewed protein sequence database; eggNOG—eggnog database; Nr—national center for biotechnology information non-redundant protein sequences.

