Article

Experimental and Numerical Determination of the Mechanical Properties of Spruce Wood

1
Department of Wood Science and Technology, Biotechnical Faculty, University of Ljubljana, Rožna dolina Cesta VIII/34, 1000 Ljubljana, Slovenia
2
Faculty of Mechanical Engineering, University of Maribor, Smetanova ulica 17, 2000 Maribor, Slovenia
3
Faculty of Civil Engineering, Transportation Engineering and Architecture, University of Maribor, Smetanova ulica 17, 2000 Maribor, Slovenia
*
Author to whom correspondence should be addressed.
Forests 2019, 10(12), 1140; https://doi.org/10.3390/f10121140
Submission received: 6 November 2019 / Revised: 9 December 2019 / Accepted: 10 December 2019 / Published: 13 December 2019
(This article belongs to the Section Forest Ecology and Management)

Abstract

:
The objective of this paper is the computational and experimental study of the fracture behavior of spruce wood under quasi-static loading conditions during a three-point bending test. The experimental tests were performed on the electronic testing machine Zwick Z100 (Zwick-Roell GmbH & Co. KG, Ulm, Germany) with displacement control, according to the standard International Standard Organisation (ISO) 13061-4: 2014. The specimens were made of Norway spruce (Picea abies) wood, with dimensions of 25 mm × 25 mm in cross-section and 549 mm in length. Six tests were performed for each orientation (radial and tangential) of the wood fibres. Based on the experimental results, the computational model was created and validated by considering the mechanical responses in two different directions due to the orientation of the wood fibres. An orthotropic material model with damage evolution was selected as the computational model. The computational model was validated using the inverse procedure for the determination of the constitutive material parameters, including the damage parameters of three-point bending test specimens. A finite element method (FEM) in the framework of program package ABAQUS was used for the computational simulation, while the open code Optimax was used for the optimization procedure. Comparison between the experimental and computational force vs. the displacement response showed a very good correlation in the results for the spruce wood specimens under three-point bending tests, with Pearson′s correlation coefficient of r = 0.994 for the tangential and r = 0.988 for the radial orientation. Therefore, validation of the proposed computational model was confirmed, and can be used further in numerical simulations of the fatigue behavior of wood specimens.

1. Introduction

Wood is a material with mechanical properties that vary markedly, both within a tree and among trees. Products made from biological materials such as wood often have complex mechanical behavior. Although such materials have been utilized for thousands of years, full knowledge of their mechanical behavior has yet to be achieved. They often vary in their properties from sample to sample, and exhibit a nonlinear mechanical behavior at higher loading. Moisture changes lead to shrinkage or swelling and modify mechanical properties. Wood also shows loading-rate dependencies, such as creep and viscoelasticity [1]. Although wood is a typical heterogeneous material, it has recently been increasingly used as a construction material, which in practice is most often subjected to cyclic loading.
Through consideration of its many benefits as a natural resource, wood is becoming progressively popular as a building material, not only for carpentry but also for constructing supporting structures [2]. This increased usage places wood, alone or as part of a composite [3], in many novel applications where it has never been used before [4].
Many authors deal with the topic of the experimental and numerical determination of material properties. Consider, for instance, the detailed analysis of wood structure. There are many factors influencing the mechanical performance of timber elements, such as wood species, tree growth rate, density, and local singularities (knots, cracks, and the slope of grain). Two of the main factors influencing the mechanical performance of timber elements are knots and fibre deviations. In the past, several researchers have developed finite element (FE) models to investigate the influence of knot and fibre deviations on wooden boards. The model of Goodman and Bodig [5] describes how the two-dimensional fibre deviations in the vicinity of knots mathematically often serve as a basis for FE models presented by the authors of [6,7,8]. Guindos and Guaita [9] developed an FE model that allows for the consideration of a three-dimensional fibre course in the vicinity of knots. They validated their model by conducting four-point bending tests. In a study by Olson et al. [10], the influence of local wood fibre orientation on the prediction of timber bending strength was evaluated.
In recent years, many researchers have published works regarding the experimental and numerical investigations of wood and wooden hybrid structures, e.g., experimentally [11,12], analytically [13,14,15], and numerically [16,17,18], as discussed by the authors of [19], who focused particularly on the application of the study of modern architecture, where windows of long widths and large heights are used. For this purpose, the bending stiffness, load-bearing capacity, and flexural rigidity of hybrid beams, reinforced with aluminium, were compared through experimental analysis, using a four-point bending test method, with those of reference wooden beams where the Norway spruce was used as the basic wood species.
Detailed research results focused on the size effect in the elastic mechanical properties of Beech wood structures. Their application using the finite element method (FEM) was proposed and discussed by the authors of [20]. The authors of [21] dealt with thermally-treated Beech wood, where experimental and numerical procedures were used to investigate the impact of the thermal treatment process on the behavior of defect-free wood under compression loads.
A promising attempt on fracture analysis of a wooden structure was presented by the authors of [22], who presented a simplified damage mechanics model for the simulation of fractures in wood using experimental and numerical procedures. A very interesting approach to determining the stress-strain curves of various thicknesses of soft and hard woods when bent during three-point loading, using the FEM, was taken by the authors of [23], with the main benefit that it is possible to determine the stress-strain curves without having to perform experiments under real conditions.
To verify the proper use of wood, one must specify the detailed mechanical properties for every kind of proposed wood and for a certain type of its loading. Wood as a naturally grown material is an orthotropic material, and orientation affects its mechanical properties. By obtaining experimental data from flexural tests, we intend to use them to construct numerical models for further use, which will take into account wood’s anisotropicity. Therefore, the objective of this work is to focus only on the three-point bending behavior of clear wooden specimens made of Norway spruce. The experimental ground was set using the standard procedures prescribed by the authors of [24,25,26]. Further, numerical models were developed using the FEM. The proposed numerical models can be extended and improved with consideration of the scientific results related to further investigations on the fatigue behavior of wood [1,27,28,29,30,31,32,33].

2. Materials and Methods

2.1. Materials and Equipment

A company specialising in manufacturing windows and doors made of wood kindly provided the samples used for testing purposes. Initial samples were made of Norway spruce (Picea abies) wood and had the dimensions after mechanical processing of 25 mm × 25 mm × 549 mm (b × h × L) (Figure 1). Detailed measurements for each sample were determined right before testing.
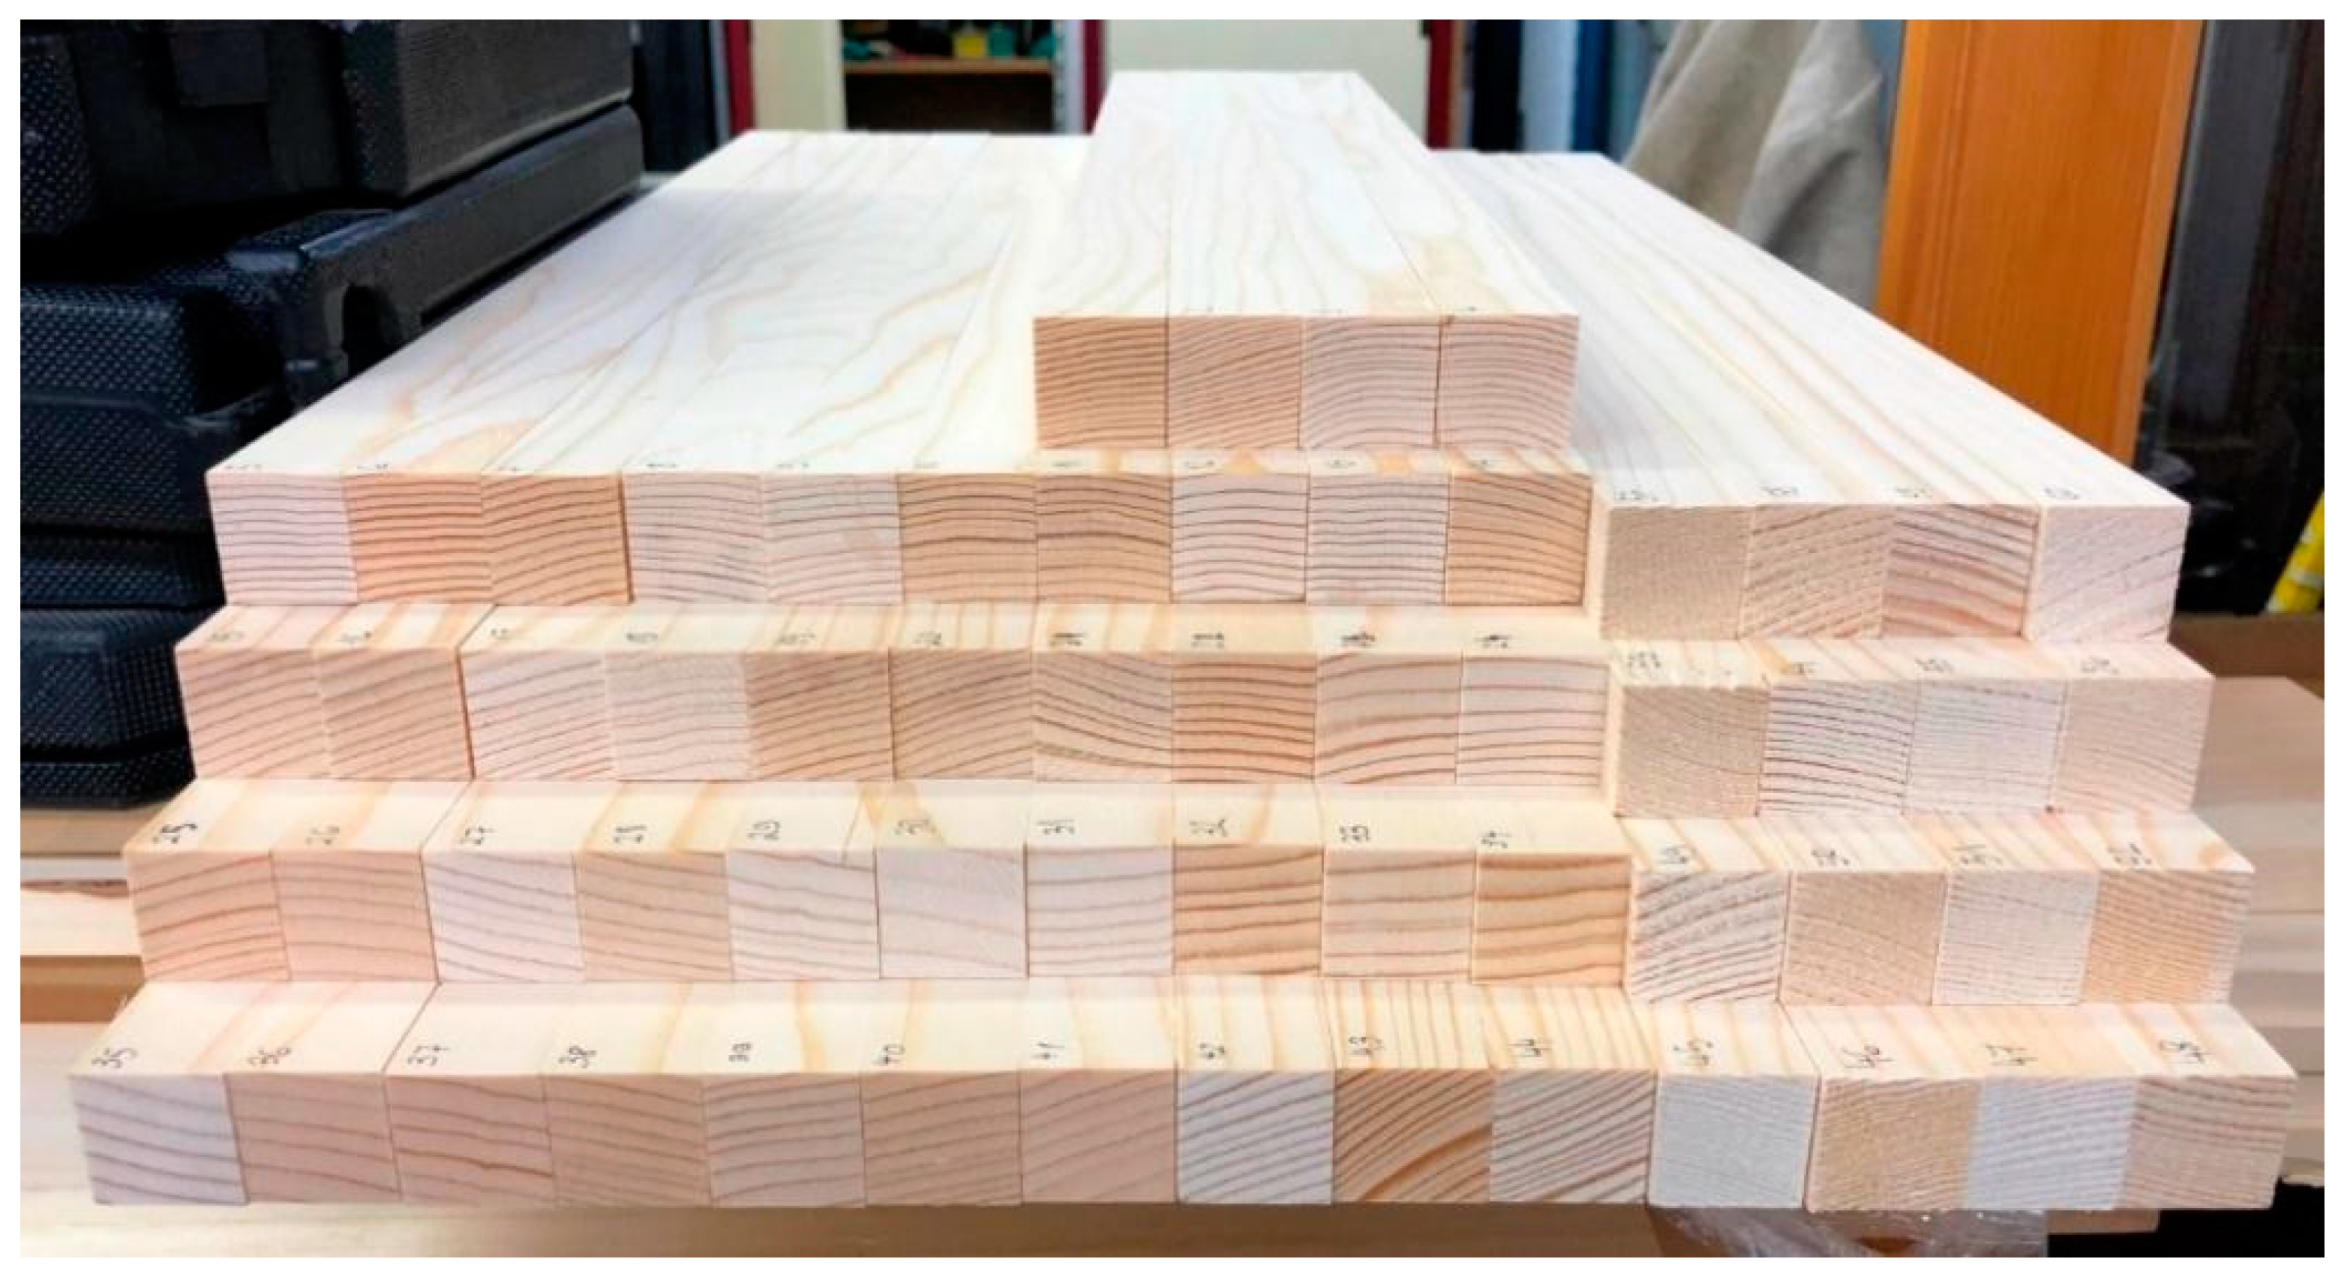
During the preparation of samples, special attention was paid to achieve the best parallel orientation of wood fibres, as well as growth rings, along the whole sample length. However, since the samples were made from wood intended for commercial production of window frames and were acquired from the same warehouse, no detailed information about tree sizes or ages could be tracked down. Before testing, the samples were stored in normal conditions at 20 °C and 65% relative humidity. The samples were also inspected visually and sorted by their suitability of growth ring orientation and their frequency of occurrence in the wood (Figure 2). To determine the density ρ of each individual sample, all samples were weigh ed and measured accurately. By accounting for their similar density and visual appearances, the samples were selected from the set of all 60 patterns (marked with 1 to 60).
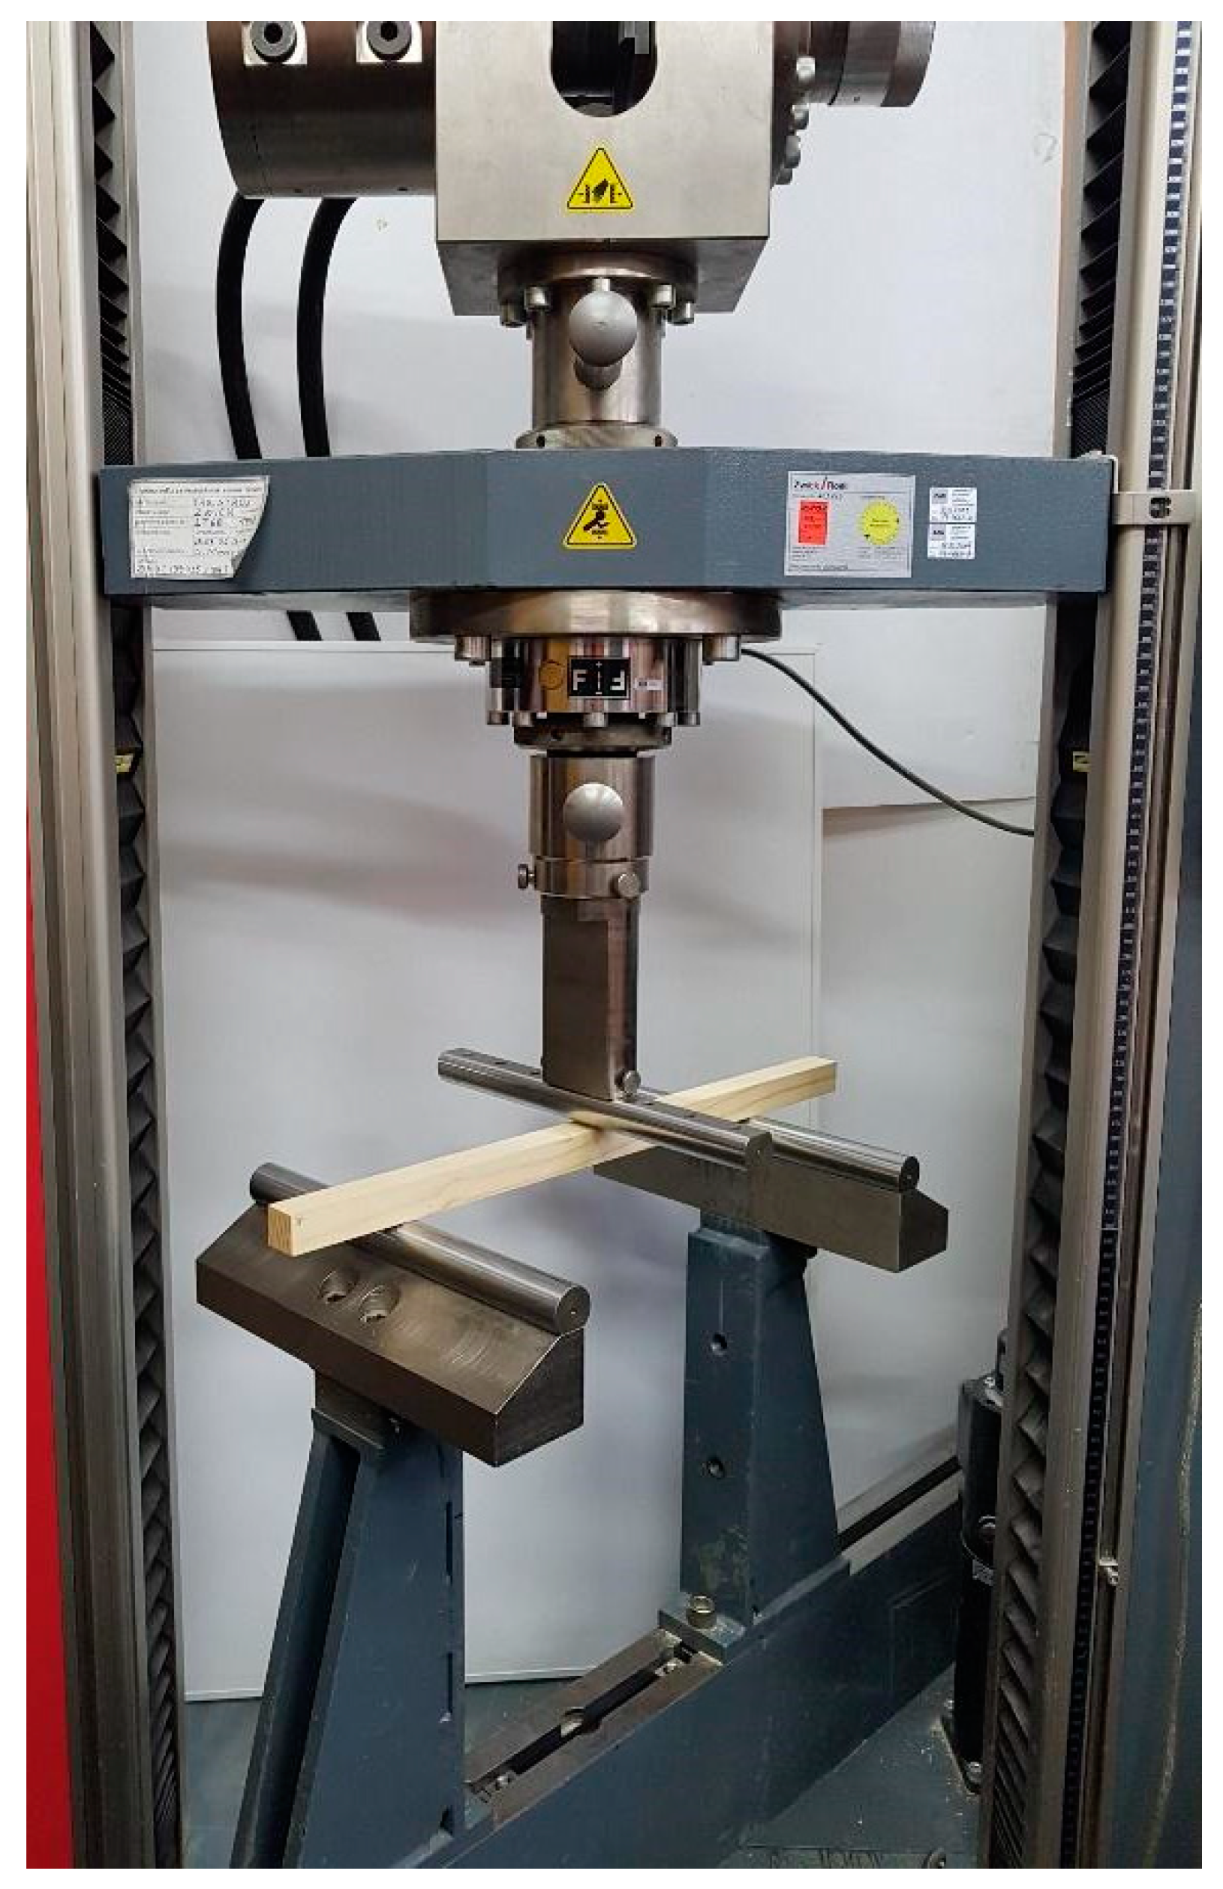
Determination of the mechanical properties was conducted on an electronic testing machine Zwick Z100 (Figure 3).
Although the machine has the capability to perform many kinds of tests, we focused on a three-point bending test until rupture for our wood specimens. The cylindrical supports had a diameter of 30 mm and were separated by 350 mm, which corresponded to 14 times the height of the tested samples and was in accordance with International Standard Organisation (ISO) 13061-4: 2014, to determine the modulus of elasticity in a static bending test [25]. The load was exerted by a similar-sized cylindrical block at the midpoint of a sample, with a constant speed of 10 mm/min.
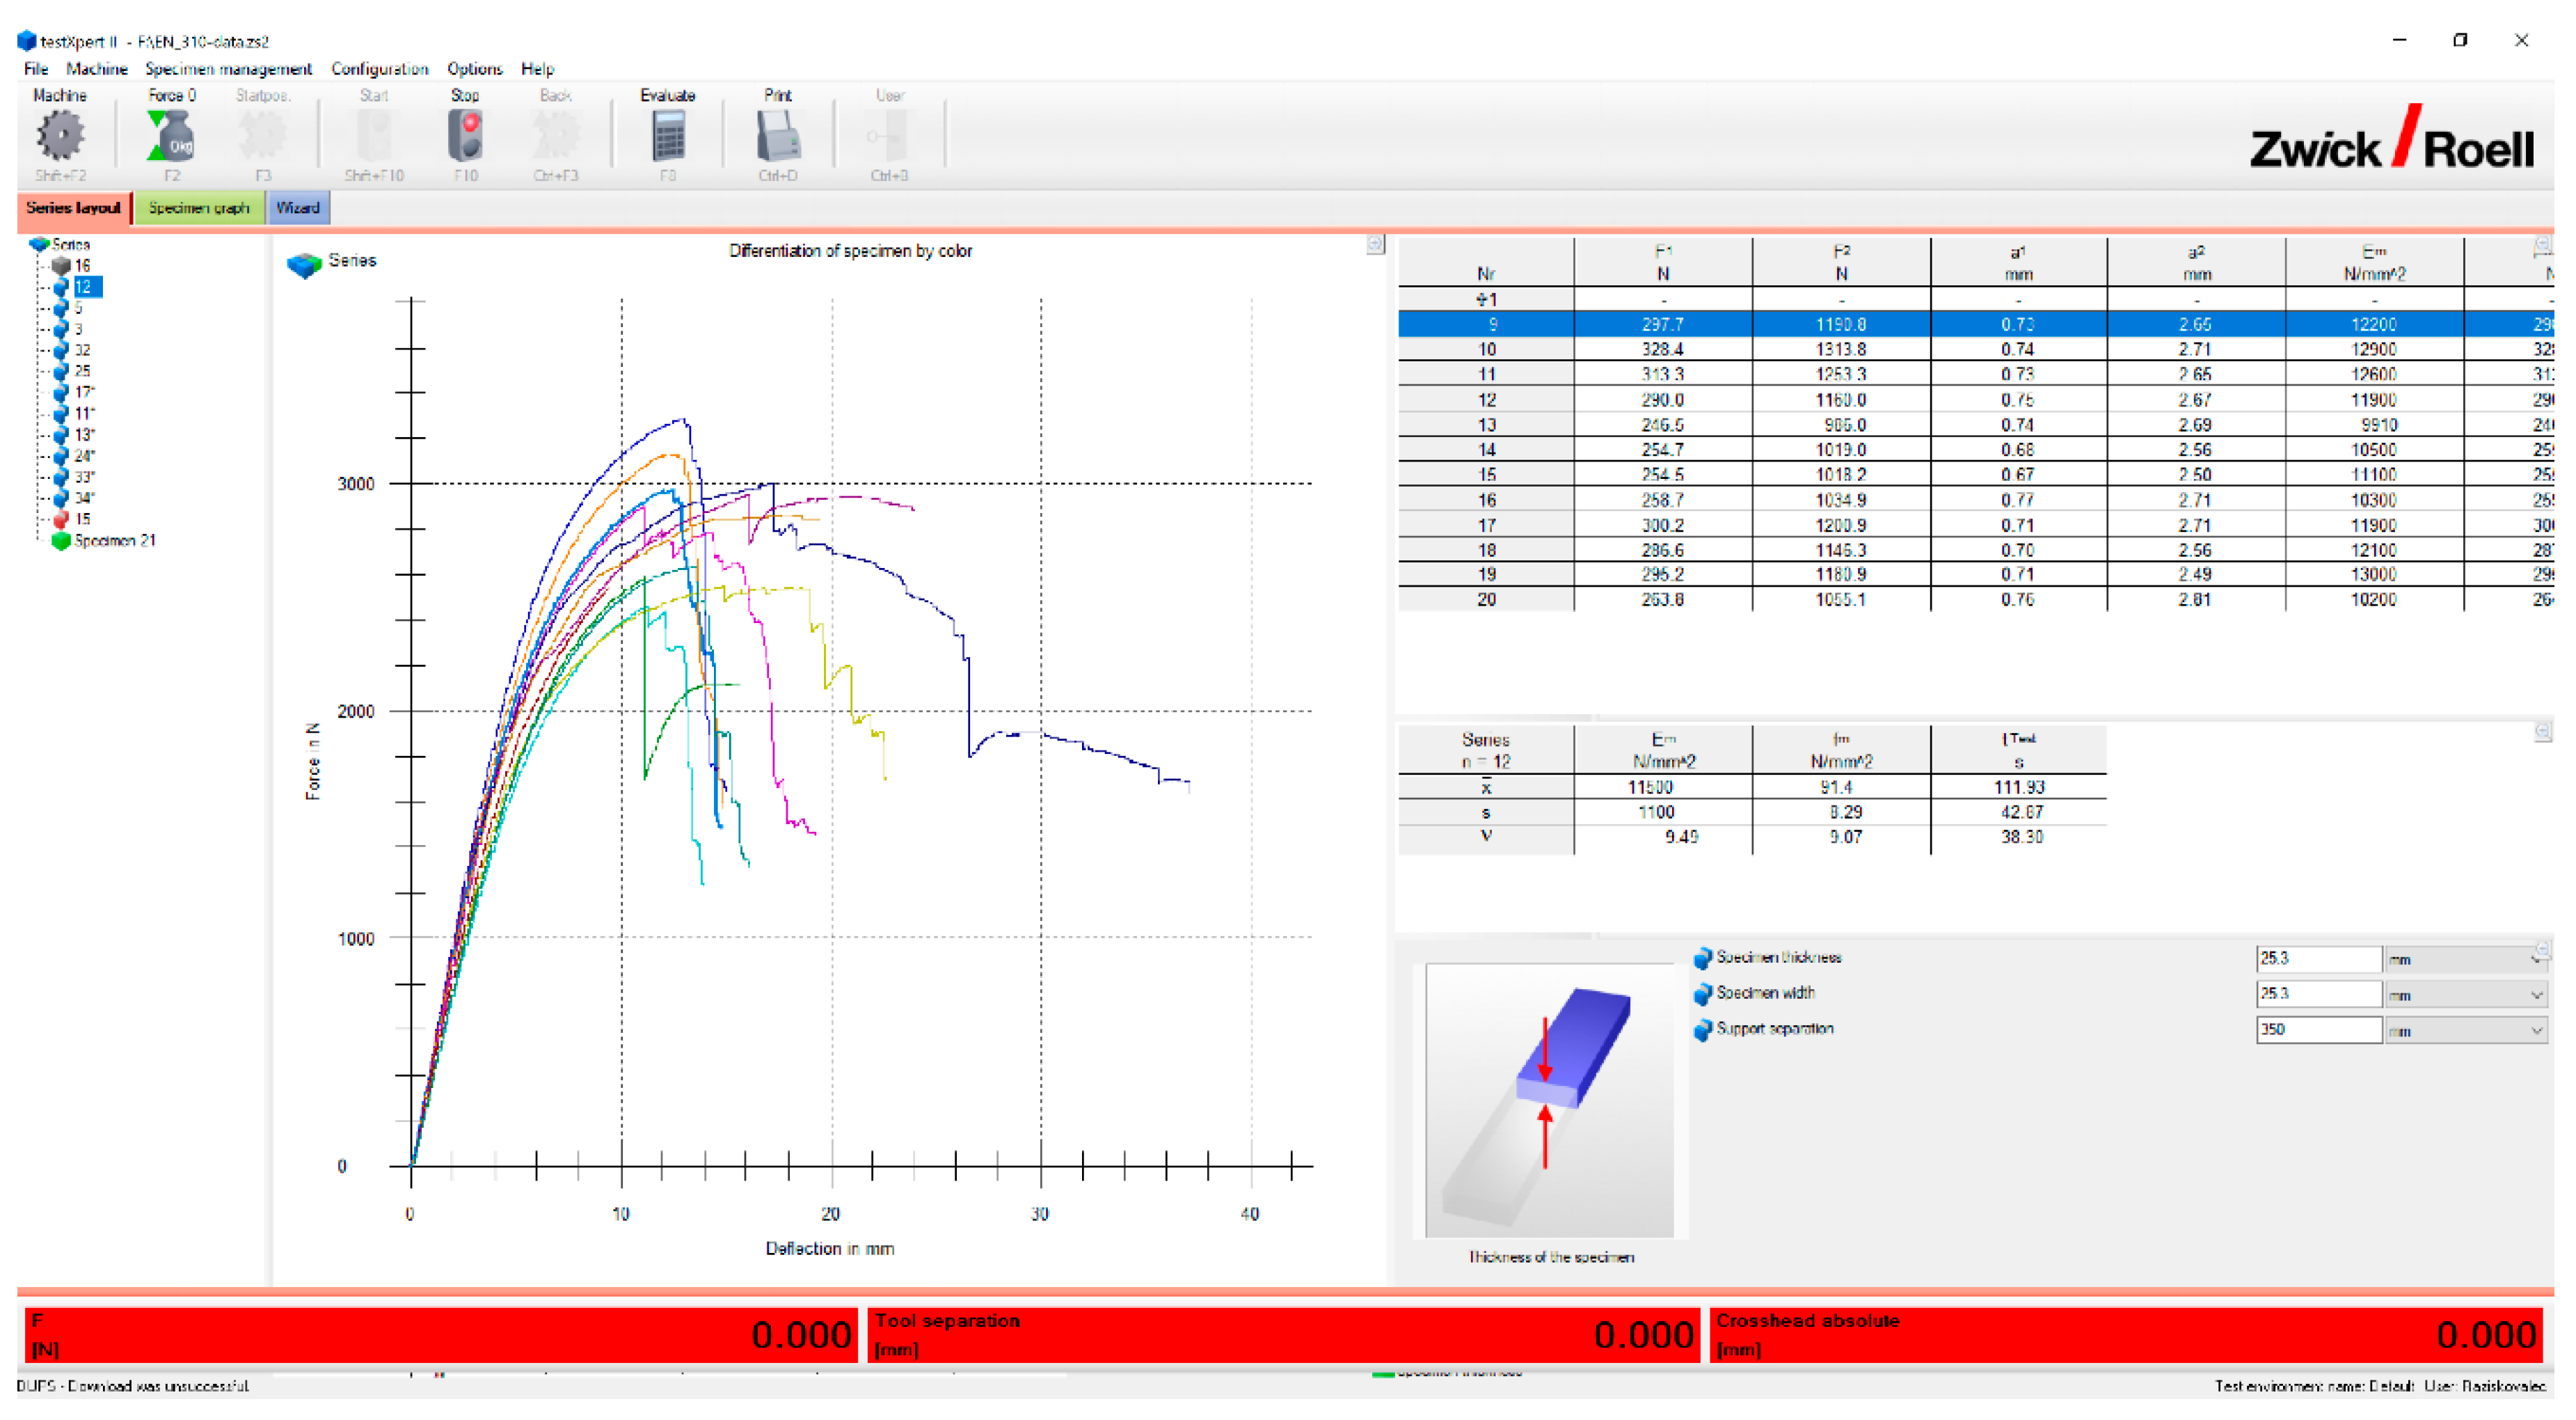
Control and monitoring of the experiment were done through the interface and are displayed on the screen shown in Figure 4.
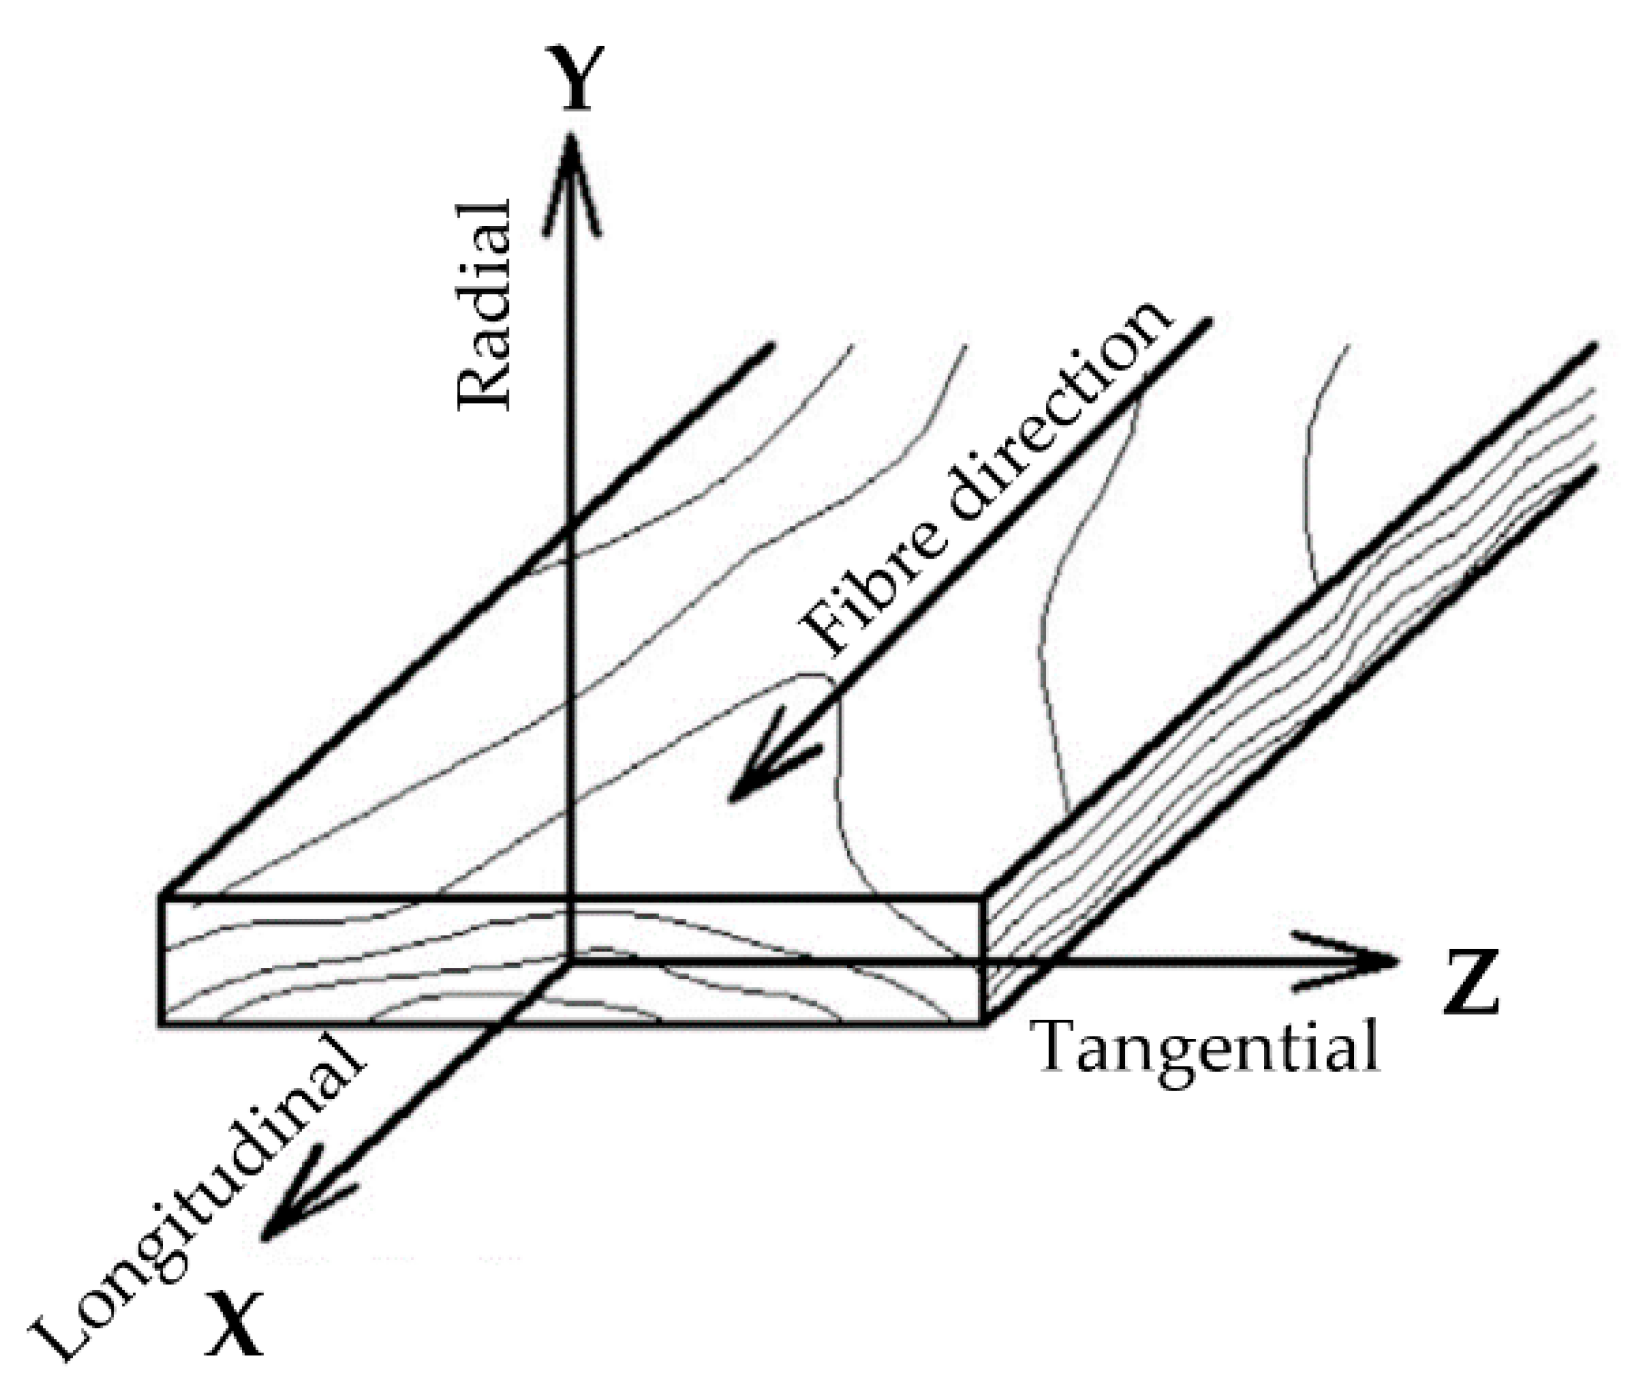
The bending tests were performed for two orientations of the wood: the tangential (Z) and radial (Y) directions. For the tangential orientation, the applied load was perpendicular to the XY-plane, while, for the radial, it was exerted perpendicular to the XZ-plane (Figure 5).
Two hours after the tests were completed, small pieces of samples were cut to determine the content of moisture in the tested samples by drying them in a laboratory dryer Kambič SP-210 (Kambič d.o.o., Semič, Slovenia). The procedure followed the instructions described in the standard ISO 13061-1: 2014 [24]. Measured samples had a mean moisture content value of 11.0%, with a standard deviation of 0.2%. The values for the ultimate strength σ and the modulus of elasticity E were corrected for 12% moisture content by considering the standard ISO 13061-3: 2014 [26] and the standard ISO 13061-4: 2014 [25].

2.2. Computational Model

In this section, a computational model is presented for determination of the mechanical properties of a spruce wood specimen under quasi-static loading conditions during a three-point bending test. The computational model was obtained using the finite element method (FEM) within the Simulia ABAQUS code, based on an implicit solver [34]. The computational model was created and validated considering the mechanical responses in two different directions, due to the orientation of wood fibres. Furthermore, the computational model was validated using the inverse procedure for determination of the constitutive material parameters, including the damage parameters obtained during three-point bending tests.

2.2.1. Geometry

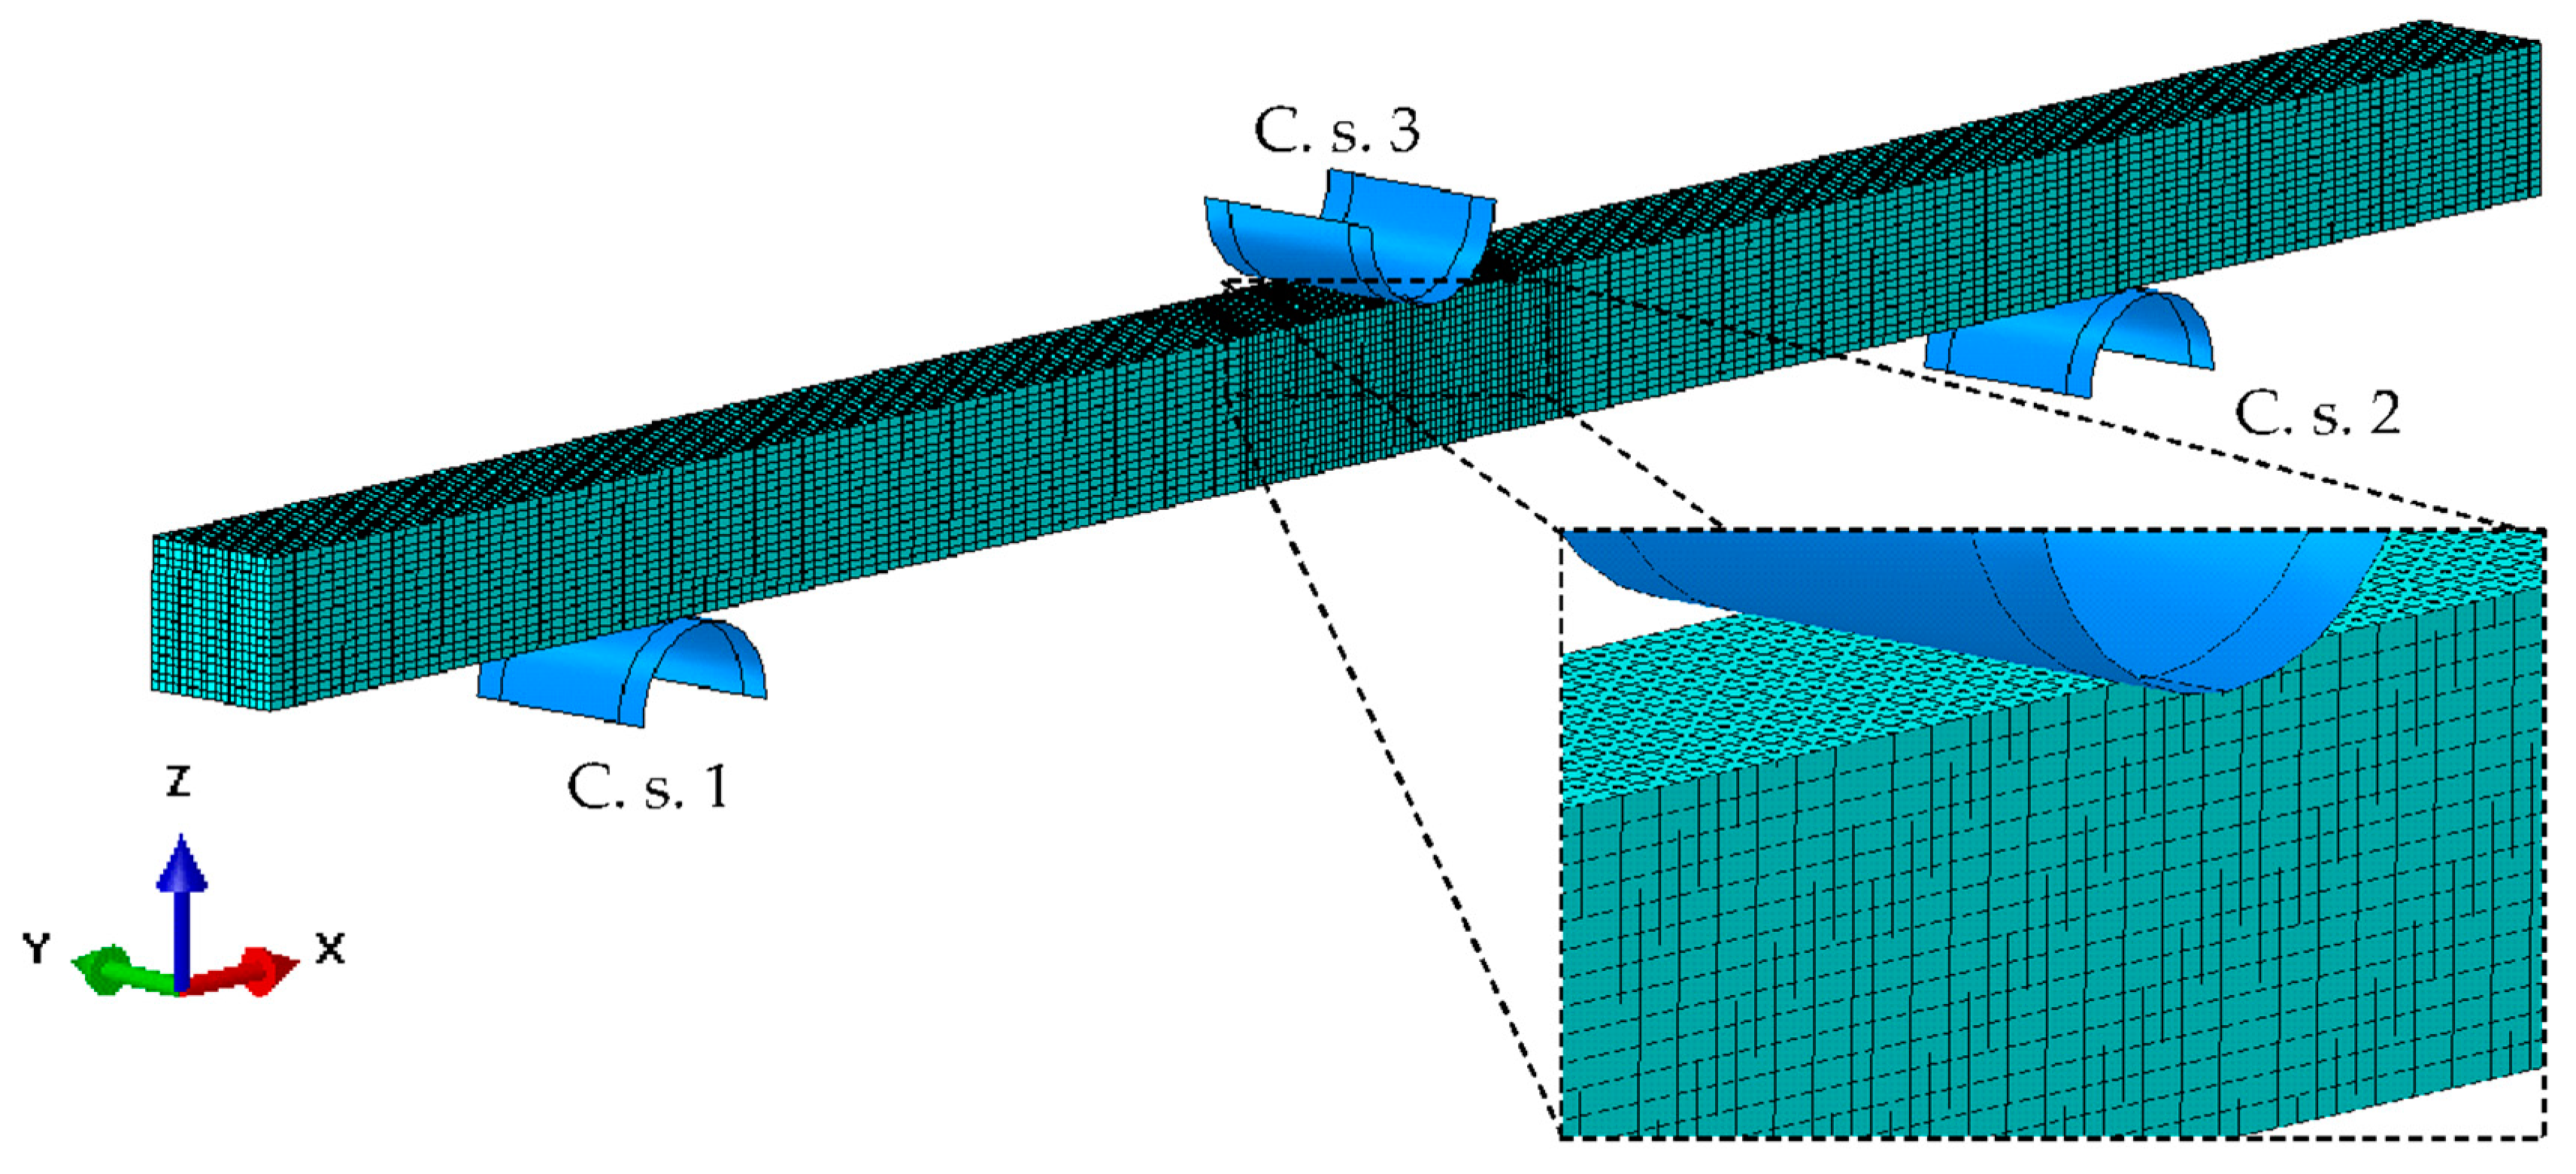
The loading conditions of a three-point bending test are modelled implementing a three-dimensional computational model in the framework of the ABAQUS code [34]. The computational model consists of three-dimensional spruce wood specimens and three cylindrical supports (CS), which are modelled as analytical rigid surfaces (Figure 6) where L is the distance between supports and D is the diameter of the cylindrical supports. In the proposed computational model, the spruce wood specimens have the same dimensions as those used in the experimental tests, i.e., 25 mm × 25 mm in cross-section (b × h) and 549 mm in length (L).

2.2.2. Material Model

Wood is a highly anisotropic material that shows ductile behavior during compression and brittle behavior during tension and shear, where both failure modes can occur simultaneously. Therefore, the directions of the wood fibres have a significant impact on the mechanical behavior of wood specimens. In the proposed model, the material fibres directions are defined according to the authors of [35]. Three material directions can be distinguished (Figure 5) in order to reduce the complexity of the material model: longitudinal (X), radial (Y), and tangential (Z) [35]. In the computational analysis, the orthotropic material model is used to describe the linear elastic material behavior of wood specimens. The linear elastic orthotropic material model is defined by specifying the engineering constants. The material parameters that are used in the orthotropic material model are as follows: the modulus of elasticity MOE (E1, E2, and E3); Poisson’s ratios (ν12, ν13, and ν23); and the shear modulus (G12, G13, and G23). A ductile damage material model is implemented in the computational model for predicting the initiation of damage in the treated wood specimens. The ductile damage material model is based on phenomenological criterion for predicting the onset of damage due to nucleation, growth, and coalescence of voids in a material. The ductile damage material model is based on the assumption that the equivalent plastic strain at the onset of damage, ε ¯ D p l , is a function of stress triaxiality η and strain rate, explained by Kramberger et al. [36]
ε ¯ D p l ( η ,   ε ¯ ˙ p l )
where η = −p/q is the stress triaxiality, p represents the pressure stress, q is the von Mises equivalent stress, and ε ¯ ˙ p l is the equivalent plastic strain rate [36]. The criterion for damage initiation occurs when the following condition is fulfilled:
ω D = d ε ¯ p l ε ¯ D p l ( η , ε ¯ ˙ p l ) = 1
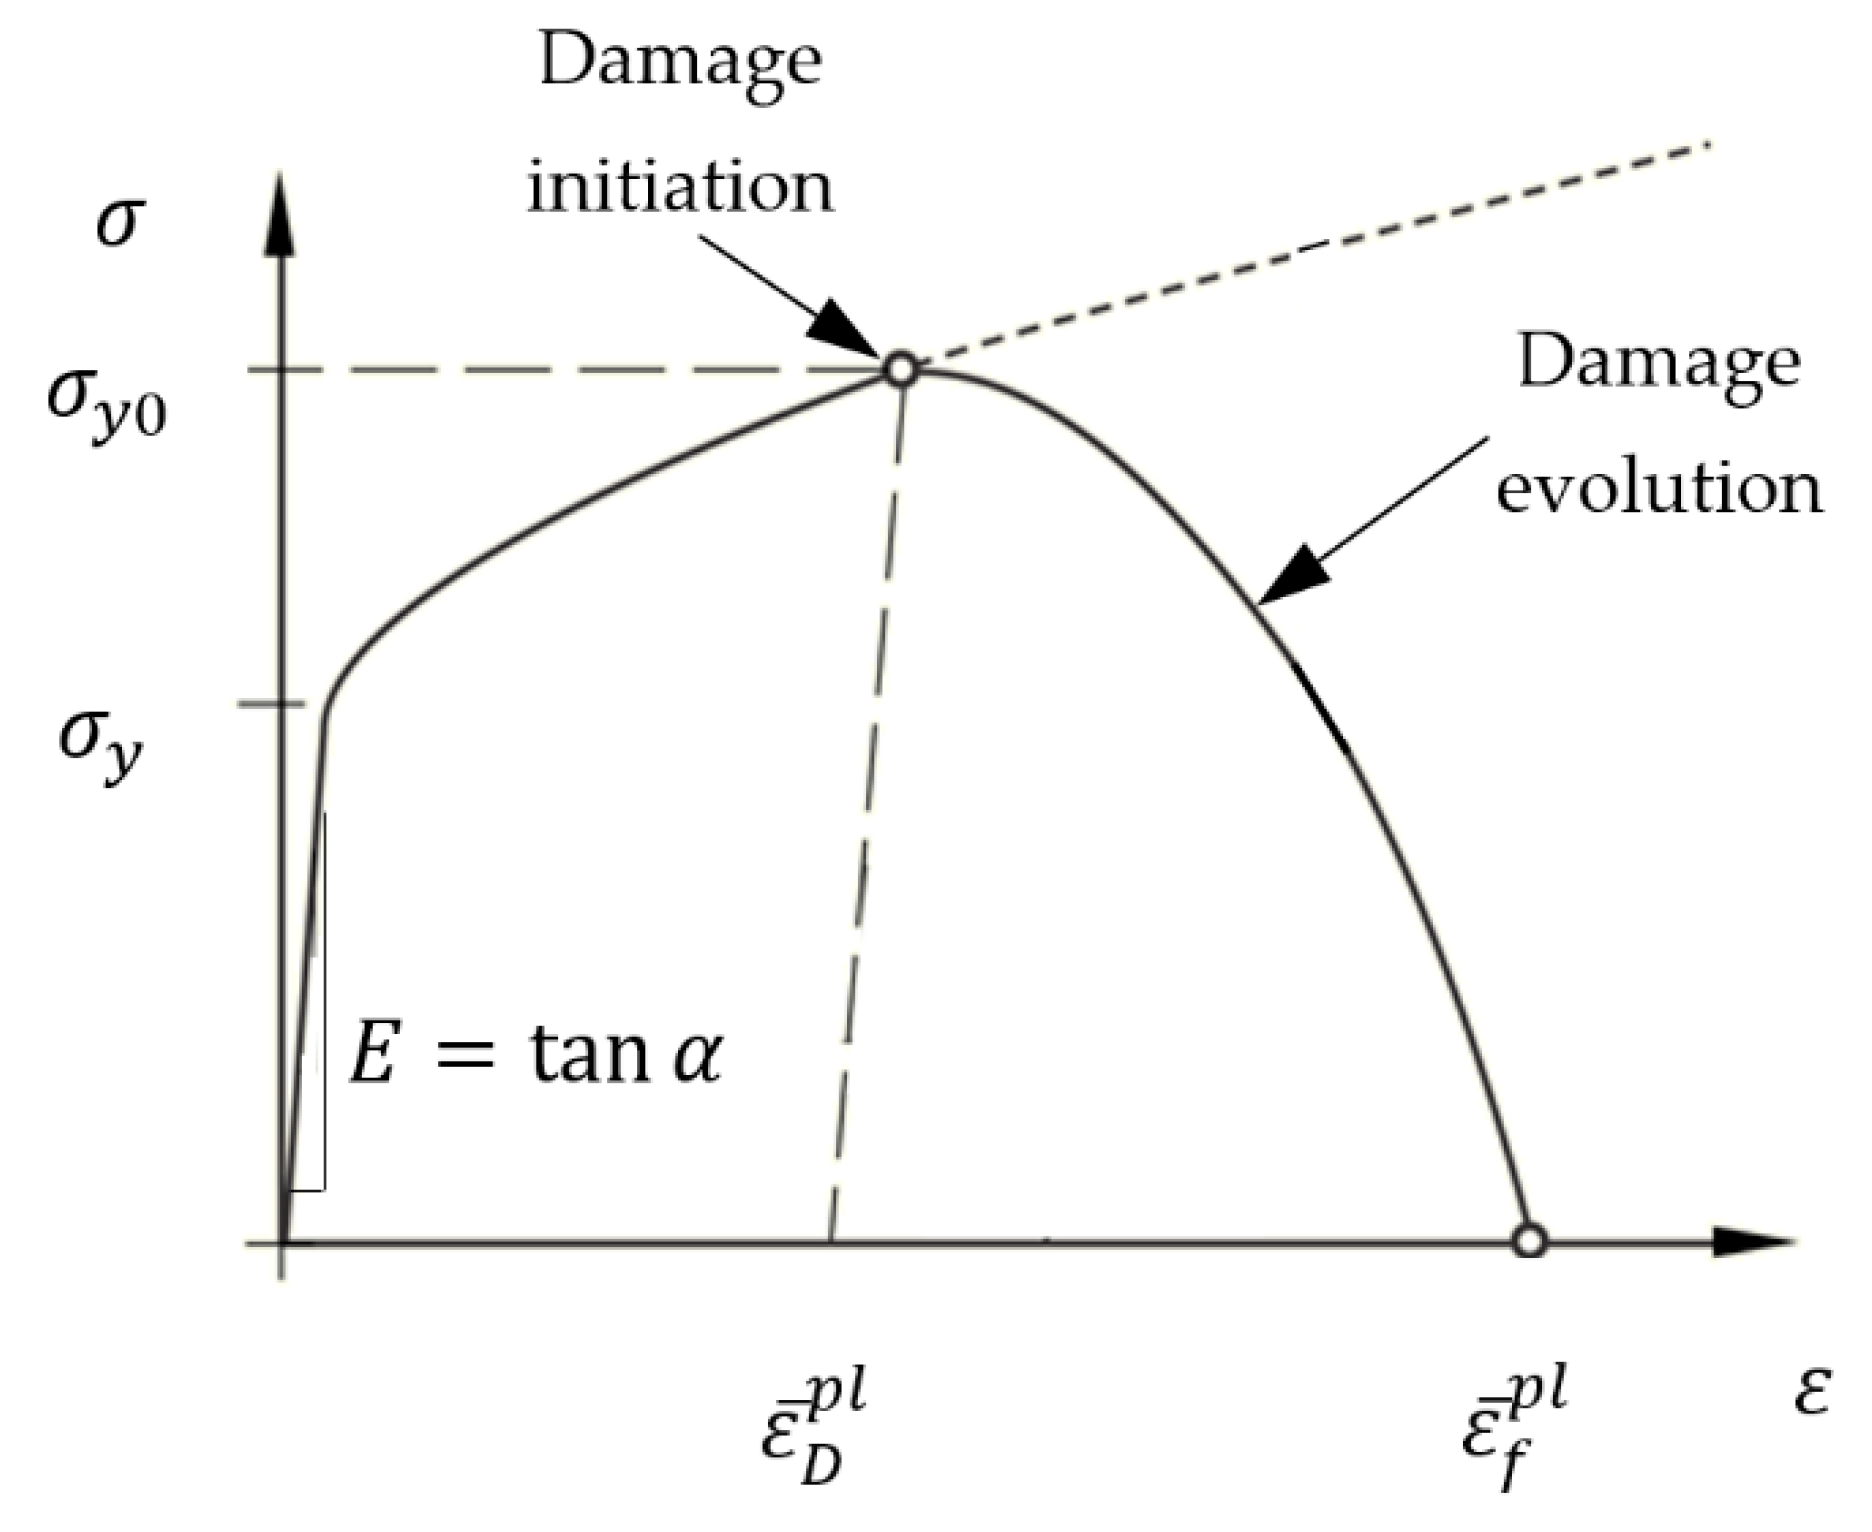
where ωD is a state variable that increases monotonically with the plastic deformation. If the parameter ωD equals zero, it means that the material is undamaged, and in the case where parameter ωD equals one, the material is completely damaged. Figure 6 illustrates the characteristic stress-strain behavior of a material undergoing damage. The solid curve in Figure 7 represents the damaged stress-strain response, while the dashed curve refers to the response in the absence of damage. In Figure 7, the material parameters σy0 and ε ¯ D p l are the ultimate strength and equivalent plastic strain at the onset of damage, while ε ¯ f p l is the equivalent plastic strain at failure [34]. In the proposed material model, the damage evolution is prescribed in the exponential form.

2.2.3. Boundary Conditions

The boundary conditions as presented in Figure 6 were prescribed using the cylindrical supports. The constant displacement was prescribed in the vertical direction at the cylindrical supports 3 (CS-3) to perform the bending loading, while the other two cylindrical supports were constrained in all degrees of freedom (see Figure 6). The contact between wood specimen and supports was defined in both normal and transverse directions with consideration of the static coefficient of friction. In the performed computational analysis, the value of static coefficient of friction μfr,stat equaled 0.4. The geometry of the wood specimen was meshed using linear hexahedral elements of the C3D8R type. Mesh sensitivity was considered carefully with a convergence study, to ensure that the model was capable of calculating associated deformations precisely. The average size of finite element 2 mm has been found to give converged results. The total number of solid finite elements representing the wood specimen was approximately 7600 (Figure 8).

3. Results and Discussion

3.1. Experimental Results

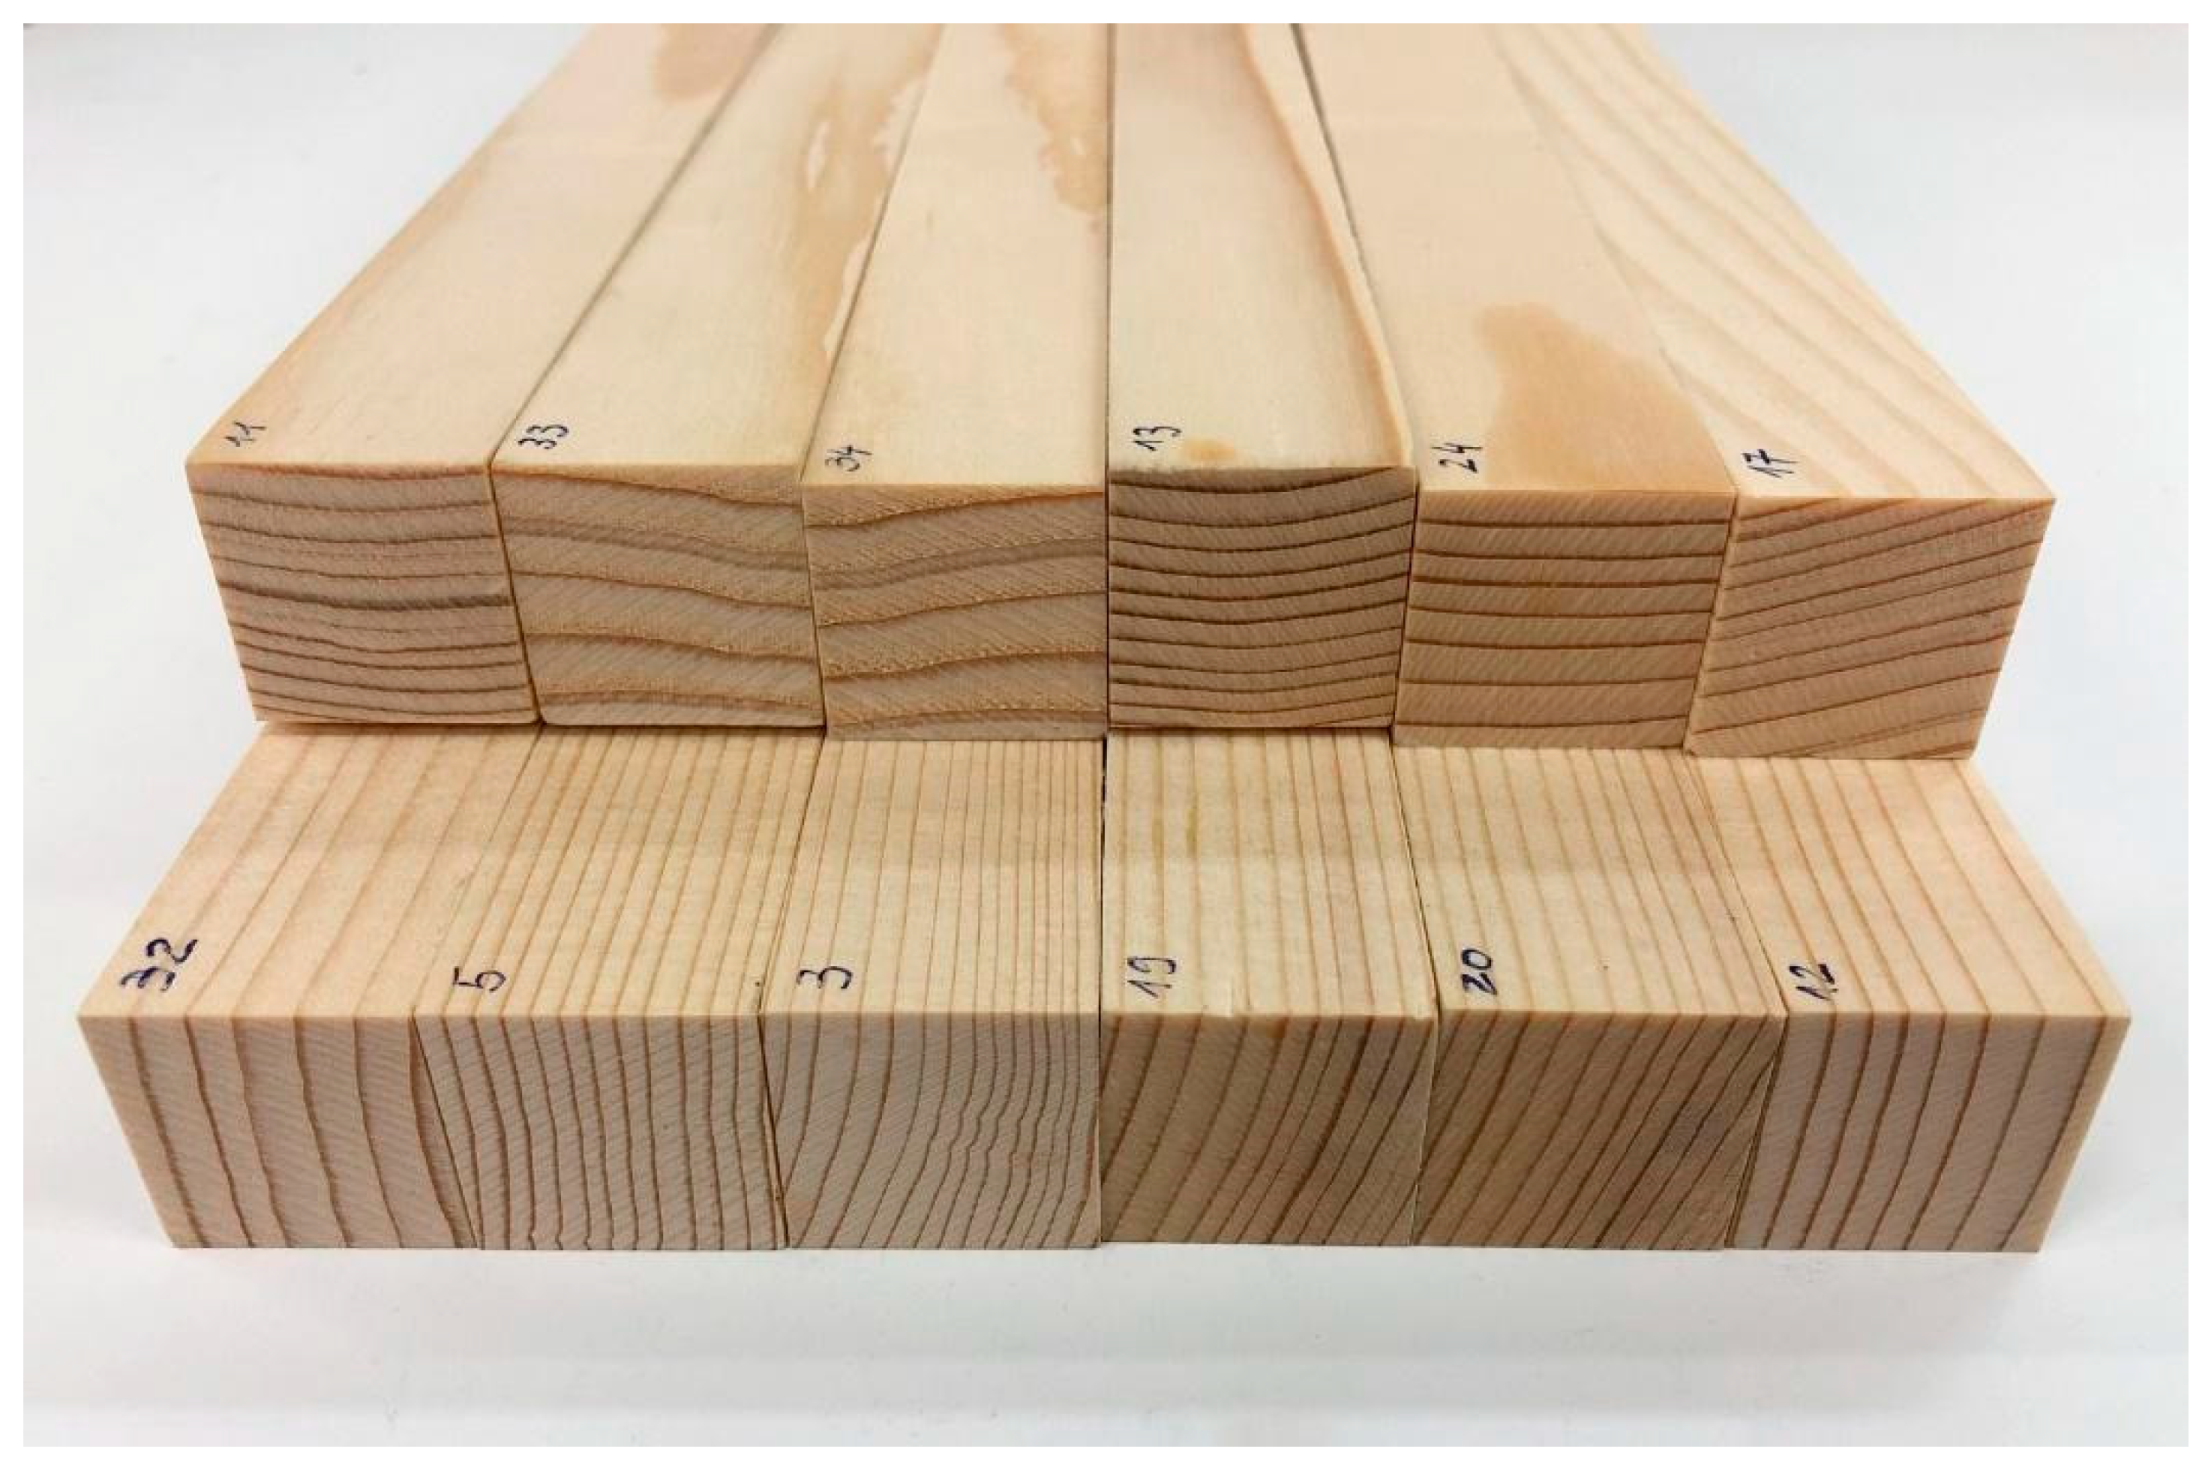
We started with an assortment of 60 samples (labelled from 1 to 60) that were already preselected by the carpentry company by their suitability for our needs (wood clarity and growth ring orientation). Based on similar density, we further eliminated the samples until we had a series of 12 samples (Figure 9), for which the wood density between extremes did not deviate by more than approx. 10%.
Out of the remaining 12, for each orientation (radial and tangential), a total of six samples were tested flexurally until rupture. The results are presented in Table 1 and Table 2.
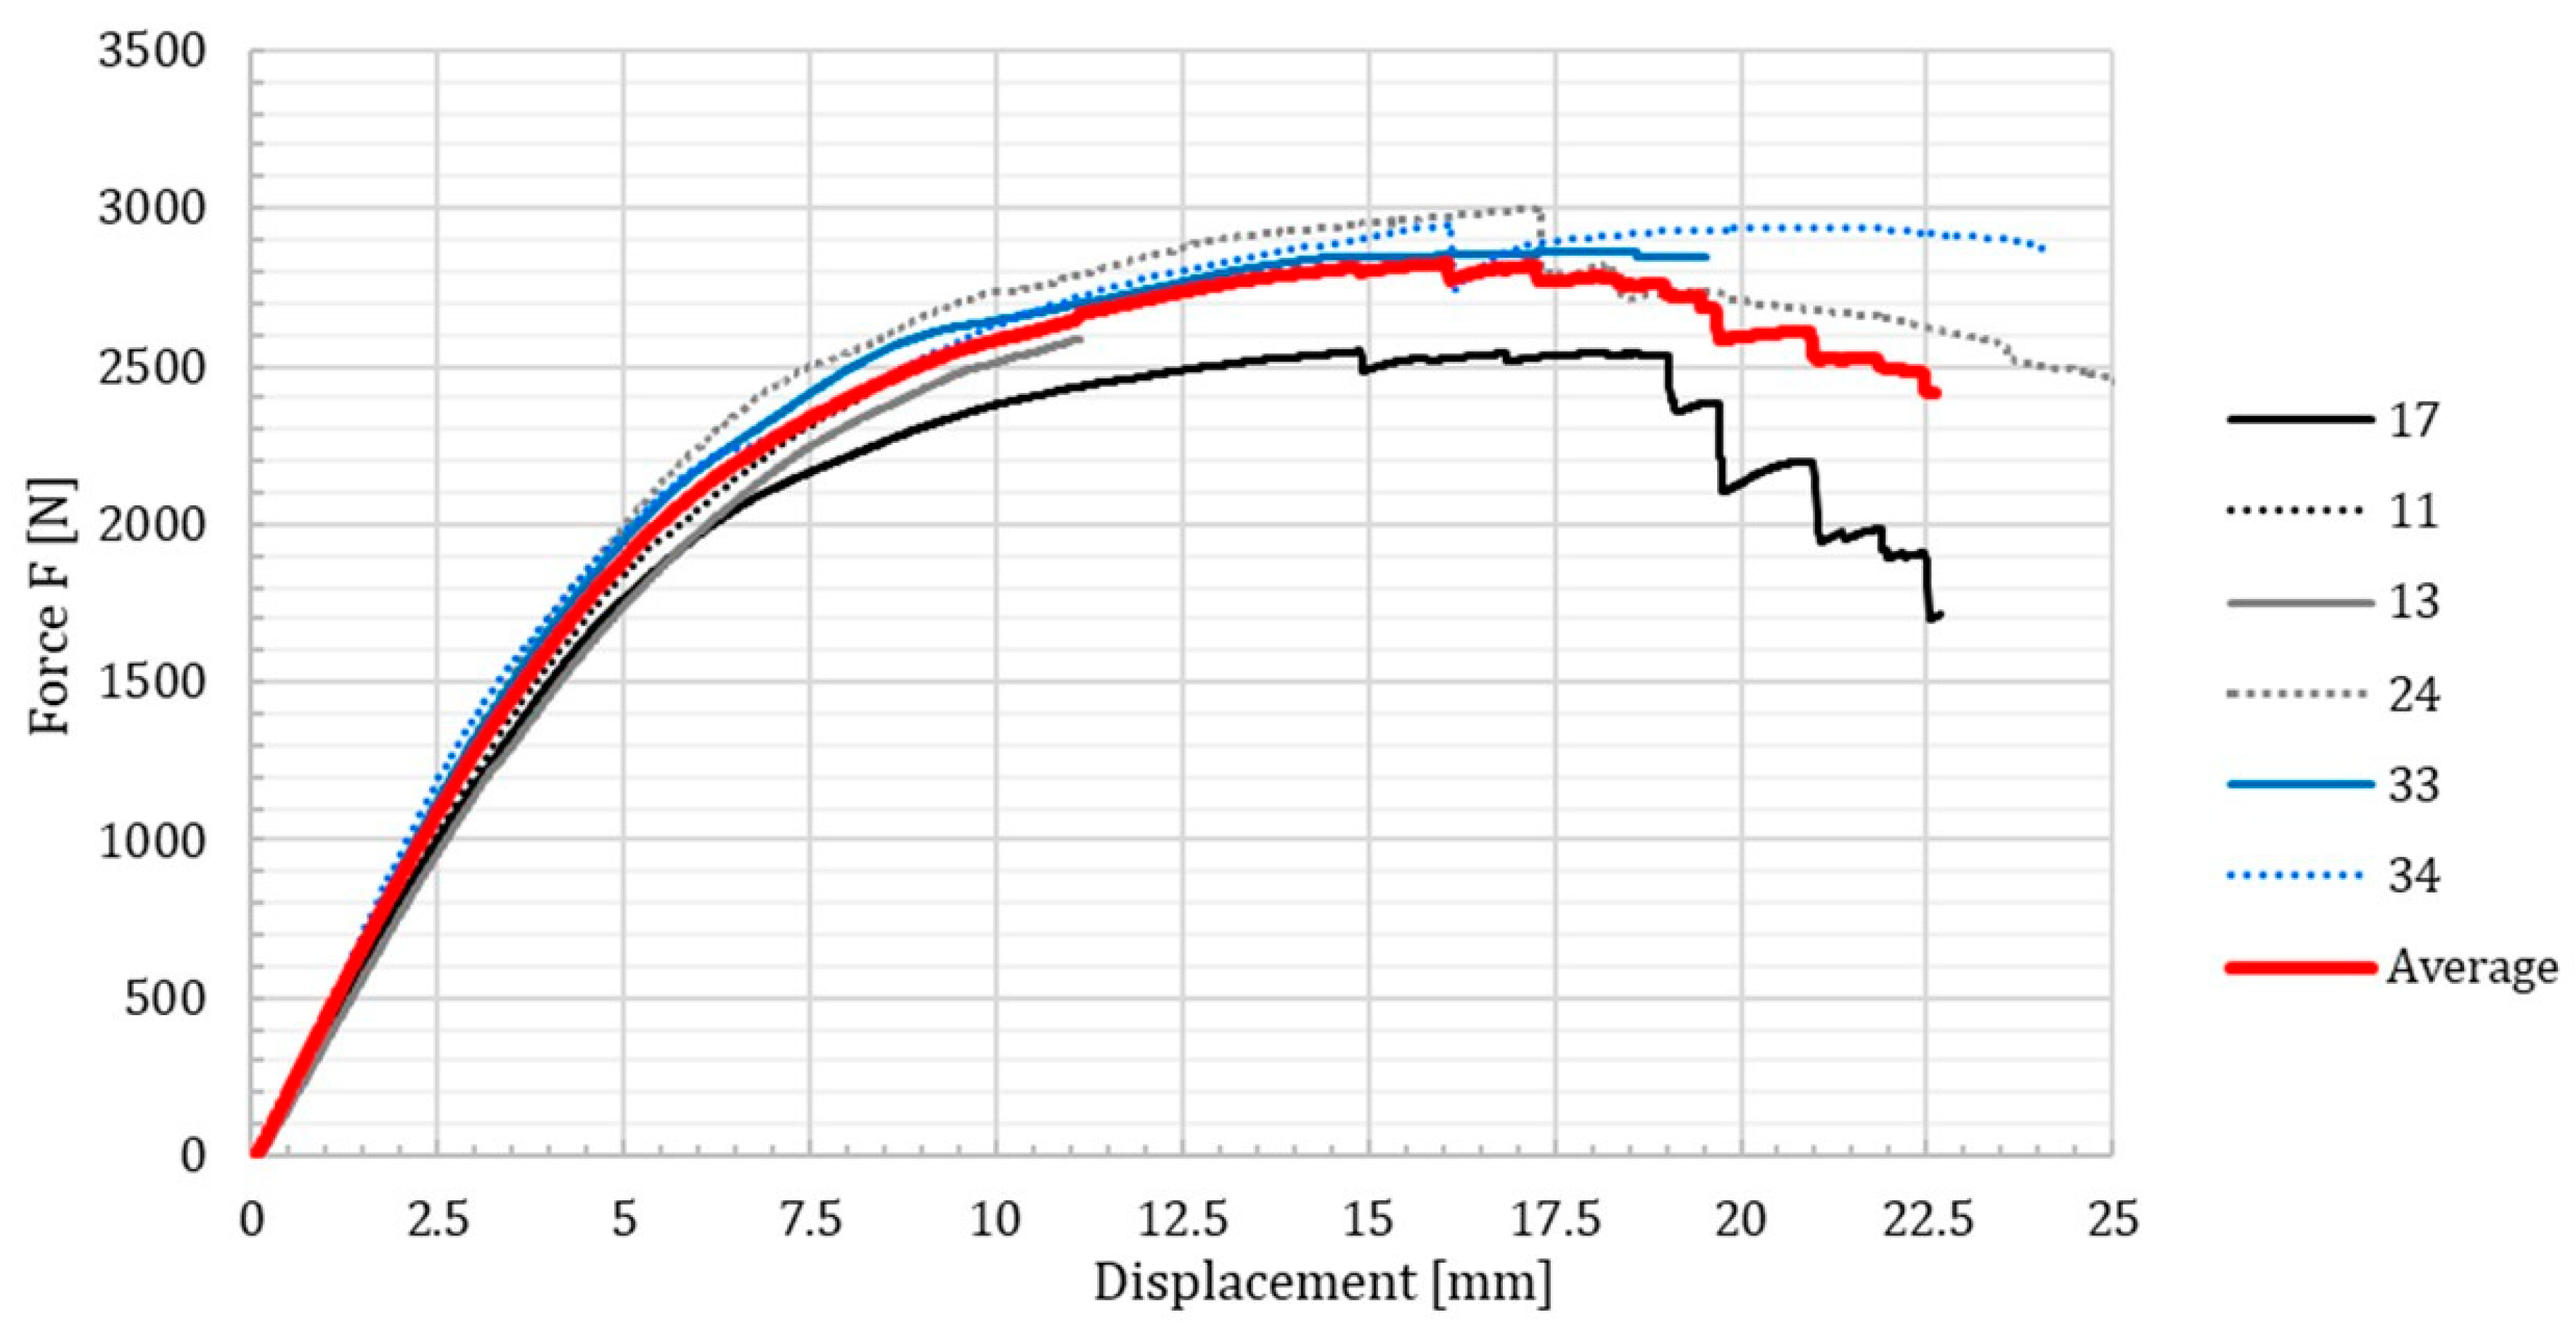
To calculate a mean response force-displacement curve for each specimen’s orientation, data from all six individual experimental tests were used for averaging (see Figure 10 and Figure 11).
The difference between the mean responses shown in Figure 10 and Figure 11 is noticeable and expected, because of the anisotropic nature of wood. As wood is a naturally grown material resource and many factors affect its mechanical characteristics, a major variation between individual samples was also expected and confirmed by our observations.

3.2. Comparison between Computational and Experimental Results

The computational model was validated using an inverse procedure for determination of the constitutive material parameters, including the damage parameters, which resulted from the three-point bending tests. FEM, in the framework of the ABAQUS code, was used for the computational simulation, while the open code Optimax [37] was used for the optimization procedure to determine the material parameters. They were then used in the numerical calculations. The optimization process was performed with comparison of the numerical and experimental results in the force-displacement diagram (Figure 12).
The difference between both curves was applied as the optimization objective function in the genetic algorithm (GA) to determine the material parameters of the computational model. In the optimization procedure, when calibrating the appropriate material parameters, the experimental responses were used for each orientation (Z and Y) of the wood fibres. Six three-point bending tests (in accordance to each orientation of the wood fibres) were carried out in order to achieve a representative sample of experimental tests. The mean force-displacement response was calculated from the experimental results, which was used further for the inverse determination of the material parameters. The inverse determination of the constitutive parameters was carried out within 2000 computational simulations. The validation of the computational model was done comparing the reaction force on the support plate, measured during the experimental test and the computational simulation, respectively.

4. Conclusions

The main goal of the present paper was the experimental and computational study of the fracture behavior of spruce wood under quasi-static loading conditions in a three-point bending test. First, the experimental study of the force-displacement relationship between tangentially and radially loaded specimens was performed using the Zwick Z100 testing machine, and the values were determined for the ultimate strength σ and modulus of elasticity E. The moisture content was measured for each specimen, since these data affect the mechanical properties of wood specimens directly. All measured samples had a moisture content of 11.0%, with a standard deviation of 0.2%; the values for the ultimate strength σ and the modulus of elasticity E were corrected for 12% moisture content. For each orientation (radial and tangential), a total of six samples were tested flexurally until rupture. Second, based on the experimental results, the computational model using FEM was created and validated by comparing mechanical responses in two different directions (radial and tangential), due to the orientation of the wood fibres. The computational model was validated using the inverse procedure for the determination of the constitutive material parameters, including the damage parameters. Six three-point bending tests were carried out for each orientation of the wood fibres, in order to achieve a representative sample of experimental tests. Numerical simulations have shown the possibility to analyse the evolution of damage in the considered wooden structures. The numerical model has been validated with the comparison of computational and experimental results, where the force-displacement diagrams were compared. The comparison showed a very good correlation of the results, with Pearson’s correlation coefficient of r = 0.994 for the tangential and r = 0.988 for the radial orientation. Although clean specimens and a homogeneous material model were considered, a first attempt to create a numerical model for later fracture and fatigue life analysis was achieved. However, further investigations are needed to consider more realistic fatigue-loading conditions and more complex models with wooden materials and structures.

Author Contributions

G.F. and D.R. conceived and designed experiments; D.R. performed the experiments; G.F. and D.R. analysed the data; B.N., S.G. and M.Š. performed numerical simulations; D.R., G.F., M.Š., and B.N. did the writing—original draft preparation; G.F., S.G., and M.S. did the writing—review and editing.

Funding

This work was supported by the Slovenian Research Agency “ARRS” in the framework of the Research Programme: “Development Evaluation P2-0182” and “Design of Porous Structures P2-0063”.

Conflicts of Interest

The authors declare no conflict of interest.

References

  1. Smith, I.; Landis, E.; Gong, M. Fracture and Fatigue in Wood; John Wiley & Sons Ltd.: Hoboken, NJ, USA, 2003. [Google Scholar]
  2. Bowyer, J.; Bratkovicg, S.; Fernholz, K.; Frank, M.; Hanessian, S.; Groot, H.; Pepke, E. Modern Tall Wood Buildings: Opportunities for Innovation; Dovetail Partners Inc.: Minneapolis, MN, USA, 2016. [Google Scholar]
  3. Clouston, P.; Bathon, L.; Schreyer, A. Shear and Bending Performance of a Novel Wood–Concrete Composite System. J. Struct. Eng. 2005, 131, 1404–1412. [Google Scholar] [CrossRef] [Green Version]
  4. Mahapatra, K.; Gustavsson, L. General Conditions for Construction of Multi-Storey Wooden Buildings in Western Europe; Vaxjo University, School of Technology and Design: Smorland, Sweden, 2009. [Google Scholar]
  5. Goodman, J.R.; Bodig, J. Mathematical model of the tension behavior of wood with knots and cross grain. In Proceedings of the first International Conference on Wood Fracture, Banff, Alberta, 14–16 August 1978. [Google Scholar]
  6. Zandbergs, J.G.; Smith, F.W. Finite-Element Fracture Prediction for Wood with Knots and Cross Grain. Wood Fiber Sci. 1988, 20, 97–106. [Google Scholar]
  7. Hackspiel, C.; de Borst, K.; Lukacevic, M. A numerical simulation tool for wood grading: Model validation and parameter studies. Wood Sci. Technol. 2014, 48, 651–669. [Google Scholar] [CrossRef]
  8. Lukacevic, M.; Fussl, J.; Griessner, M.; Eberhardsteiner, J. Performance Assessment of a Numerical Simulation Tool for Wooden Boards with Knots by Means of Full-Field Deformation Measurements. Strain 2014, 50, 301–317. [Google Scholar] [CrossRef]
  9. Guindos, P.; Guaita, M. A three-dimensional wood material model to simulate the behavior of wood with any type of knot at the macro-scale. Wood Sci. Technol. 2013, 47, 585–599. [Google Scholar] [CrossRef]
  10. Olsson, A.; Oscarsson, J.; Serrano, E.; Kallsner, B.; Johansson, M.; Enquist, B. Prediction of timber bending strength and in-member cross-sectional stiffness variation on the basis of local wood fibre orientation. Eur. J. Wood Wood Prod. 2013, 71, 319–333. [Google Scholar] [CrossRef] [Green Version]
  11. Andor, K.; Lengyel, A.; Polgár, R.; Fodor, T.; Karácsonyi, Z. Experimental and statistical analysis of spruce timber beams reinforced with CFRP fabric. Constr. Build. Mater. 2015, 99, 200–207. [Google Scholar] [CrossRef]
  12. Raftery, G.M.; Kelly, F. Basalt FRP rods for reinforcement and repair of timber. Compos. Part B Eng. 2015, 70, 9–19. [Google Scholar] [CrossRef]
  13. Winter, W.; Tavoussi, K.; Pixner, T.; Parada, F.R. Timber-Steel-Hybrid Beams for Multi-Storey Buildings. In Proceedings of the World Conference on Timber Engineering 2012 (WCTE 2012), Auckland, New Zealand, 15–19 July 2012. [Google Scholar]
  14. Thorhallsson, E.R.; Hinriksson, G.I.; Snæbjörnsson, J.T. Strength and stiffness of glulam beams reinforced with glass and basalt fibres. Compos. Part B Eng. 2017, 115, 300–307. [Google Scholar] [CrossRef]
  15. Nadir, Y.; Nagarajan, P.; Ameen, M. Flexural stiffness and strength enhancement of horizontally glued laminated wood beams with GFRP and CFRP composite sheets. Constr. Build. Mater. 2016, 112, 547–555. [Google Scholar] [CrossRef]
  16. Valipour, H.R.; Crews, K. Efficient finite element modelling of timber beams strengthened with bonded fibre reinforced polymers. Constr. Build. Mater. 2011, 25, 3291–3300. [Google Scholar] [CrossRef]
  17. Raftery, G.M.; Harte, A.M. Nonlinear numerical modelling of FRP reinforced glued laminated timber. Compos. Part B Eng. 2013, 52, 40–50. [Google Scholar] [CrossRef]
  18. De Jesus, A.M.P.; Pinto, J.M.T.; Morais, J.J.L. Analysis of solid wood beams strengthened with CFRP laminates of distinct lengths. Constr. Build. Mater. 2012, 35, 817–828. [Google Scholar] [CrossRef]
  19. Šubic, B.; Fajdiga, G.; Lopatič, J. Bending stiffness, load-bearing capacity and flexural rigidity of slender hybrid wood-based beams. Forests 2018, 9, 703. [Google Scholar] [CrossRef] [Green Version]
  20. Hu, W.; Wan, H.; Guan, H. Size Effect on the Elastic Mechanical Properties of Beech and Its Application in Finite Element Analysis of Wood Structures. Forests 2019, 10, 783. [Google Scholar] [CrossRef] [Green Version]
  21. Fajdiga, G.; Zafošnik, B.; Gospodarič, B.; Straže, A. Compression Test of Thermally-Treated Beech Wood: Experimental and Numerical Analysis. BioResources 2015, 11, 223–234. [Google Scholar] [CrossRef] [Green Version]
  22. Daudeville, L. Fracture in spruce: Experiment and numerical analysis by linear and non linear fracture mechanics. Holz Als Roh Und Werkst. 1999, 57, 425–432. [Google Scholar] [CrossRef]
  23. Gaff, M.; Gašparík, M.; Borůvka, V.; Haviarová, E. Stress simulation in layered wood-based materials under mechanical loading. Mater. Des. 2015, 87, 1065–1071. [Google Scholar] [CrossRef]
  24. International Organization for Standardization. Physical and Mechanical Properties of Wood—Test Methods for Small Clear Wood Specimens—Part 1: Determination of Moisture Content for Physical and Mechanical Tests; ISO 13061-1:2014; ISO: Geneva, Switzerland, 2014; p. 4. [Google Scholar]
  25. International Organization for Standardization. Physical and Mechanical Properties of Wood—Test Methods for Small Clear Wood Specimens—Part 4: Determination of Modulus of Elasticity in Static Bending; ISO 13061-4:2014; ISO: Geneva, Switzerland, 2014; p. 6. [Google Scholar]
  26. International Organization for Standardization. Physical and Mechanical Properties of Wood—Test Methods for Small Clear Wood Specimens—Part 3: Determination of Ultimate Strength in Static Bending; ISO 13061-3:2014; ISO: Geneva, Switzerland, 2014; p. 5. [Google Scholar]
  27. Sraml, M.; Glodež, S.; Fajdiga, G. Fatigue life models of wood—A review. In Proceedings of the 20th International Conference on Materials MATRIB 2019, Vela Luka, Croatia, 27–29 June 2019; pp. 295–304. [Google Scholar]
  28. Kärenlampi, P.P.; Tynjälä, P.; Ström, P. Off-axis fatigue loading of steamed wood. Int. J. Fatigue 2002, 24, 1235–1242. [Google Scholar] [CrossRef]
  29. Dourado, N.; de Moura, M.F.S.F.; de Jesus, A. Fatigue-fracture characterization of wood under mode I loading. Int. J. Fatigue 2019, 121, 265–271. [Google Scholar] [CrossRef]
  30. Simon, I.; Banks-Sills, L.; Fourman, V. Mode I delamination propagation and R-ratio effects in woven composite DCB specimens for a multi-directional layup. Int. J. Fatigue 2017, 96, 237–251. [Google Scholar] [CrossRef]
  31. Yoshihara, H.; Ohta, M. Measurement of mode II fracture toughness of wood by the end-notched flexure test. J. Wood Sci. 2000, 46, 273–278. [Google Scholar] [CrossRef]
  32. Fuglsang Nielsen, L. Lifetime and residual strength of wood subjected to static and variable load. Part II: Applications and design. Holz Als Roh Und Werkst. 2000, 58, 141–152. [Google Scholar] [CrossRef]
  33. Nielsen, L.F. Lifetime and residual strength of wood subjected to static and variable loadPart I: Introduction and analysis. Holz Als Roh Und Werkst. 2000, 58, 81–90. [Google Scholar] [CrossRef]
  34. SIMULIA Abaqus Online Documentation. Dasault Systems. Available online: http://ivt-abaqusdoc.ivt.ntnu.no:2080/v6.14/index.html (accessed on 4 September 2019).
  35. Sandhaas, C.; Van de Kuilen, J.W.G. Material model for wood. Heron 2013, 58, 179–200. [Google Scholar]
  36. Kramberger, J.; Nečemer, B.; Glodež, S. Assessing the cracking behavior of auxetic cellular structures by using both a numerical and an experimental approach. Theor. Appl. Fract. Mech. 2019, 101, 17–24. [Google Scholar] [CrossRef]
  37. Borovinšek, M. OptiMax-Online Users Manual. Available online: http://lace.fs.uni-mb.si/wordpress/borovinsek/?page_id=104 (accessed on 11 September 2017).
Figure 1. Dimensions of the sample after mechanical processing.
Forests 10 01140 g001
Figure 2. Assortment of all 60 specimens made by visual examination.
Forests 10 01140 g002
Figure 3. Testing machine Zwick Z100.
Forests 10 01140 g003
Figure 4. Captured program screen right after sample fracture.
Forests 10 01140 g004
Figure 5. A representation of the longitudinal–radial–tangential coordinate system for wood overlaid on a Norway spruce sample.
Forests 10 01140 g005
Figure 6. Computational model of a three-point bending test.
Forests 10 01140 g006
Figure 7. Mechanical response of the ductile damage material model.
Forests 10 01140 g007
Figure 8. Finite element mesh of a three-point bending test.
Forests 10 01140 g008
Figure 9. Photograph of the 12 tested samples, ordered by their diminishing density from left to right. Top six samples were loaded radially, while the bottom six were tested tangentially.
Forests 10 01140 g009
Figure 10. Force-displacement curve for tangentially loaded specimens. The samples are listed in the order in which they were tested, while the mean response is marked with a thick, dark blue line.
Forests 10 01140 g010
Figure 11. Force-displacement curve for radially loaded samples. The mean response is coloured in bright red with a thicker line.
Forests 10 01140 g011
Figure 12. Comparison between experimental and numerical force-displacement responses. FEM = finite element method.
Forests 10 01140 g012
Table 1. Results for samples with tangentially applied force.
Sample Nr.Orient.Mass (m) (g)Length (L) (mm)Width (b) (mm)Height (h) (mm)Density ) (g/cm3)Force (F) (kN)MOE (E) (GPa)Strength (σ) (MPa)
32Tang.175.00549.025.225.30.5002.9011.6790.61
5Tang.173.99549.025.425.40.4913.2812.63101.01
3Tang.172.18549.025.325.40.4883.1312.3596.75
19Tang.163.79549.025.225.20.4703.0411.1995.43
20Tang.163.94549.025.325.30.4673.0010.9694.13
12Tang.161.78549.025.325.30.4602.9811.9292.65
Table 2. Results for samples with radially applied force.
Sample Nr.Orient.Mass (m) (g)Length (L) (mm)Width (b) (mm)Height (h) (mm)Density (ρ) (g/cm3)Force (F) (kN)MOE (E) (GPa)Strength (σ) (MPa)
11Radial174.22549.025.325.20.4982.5510.8379.85
33Radial171.99549.025.325.30.4892.8711.8889.19
34Radial171.09549.025.325.40.4852.9512.7391.52
13Radial164.45549.025.425.40.4642.5910.0779.57
24Radial163.65549.025.225.50.4643.0011.6393.44
17Radial160.29549.025.325.40.4542.5510.3278.66