Article

Thinning Effects on the Tree Height–Diameter Allometry of Masson Pine (Pinus massoniana Lamb.)

1
College of Forestry and Landscape Architecture, South China Agricultural University, Guangzhou 510642, China
2
Research Institute of Forestry, Chinese Academy of Forestry, Beijing 100091, China
3
Research Institute of Forest Resource Information Techniques, Chinese Academy of Forestry, Beijing 100091, China
4
College of Forest Resources and Environmental Science, Michigan Technological University, Houghton, MI 49931, USA
5
Experimental Center of Tropical Forestry, Chinese Academy of Forestry, Pingxiang 532600, China
6
Guangxi Youyiguan Forest Ecosystem Research Station, Pingxiang 532600, China
*
Author to whom correspondence should be addressed.
Forests 2019, 10(12), 1129; https://doi.org/10.3390/f10121129
Submission received: 2 November 2019 / Revised: 6 December 2019 / Accepted: 7 December 2019 / Published: 10 December 2019
(This article belongs to the Section Forest Ecology and Management)

Abstract

:
The stem height–diameter allometric relationship is fundamental in determining forest and ecosystem structures as well as in estimating tree volume, biomass, and carbon stocks. Understanding the effects of silvicultural practices on tree height–diameter allometry is necessary for sustainable forest management, though the impact of measures such as thinning on the allometric relationship remain understudied. In the present study, the effects of thinning on tree height–diameter allometry were evaluated using Masson pine height and diameter growth data from a plantation experiment that included unthinned and thinned treatments with different intensities. To determine whether thinning altered the height–diameter allometry rhythm, the optimal height–diameter model was identified and dummy variable methods were used to investigate the differences among model parameters for different thinning treatments. Periodic (annual) allometric coefficients were calculated based on height and diameter increment data and were modeled using the generalized additive mixed model (GAMM) to further illustrate the response of tree height–diameter allometry to different thinning treatments over time. Significant differences were detected among the parameters of the optimal height–diameter model (power function) for different thinning treatments, which indicated that the pattern of the height–diameter allometry relationship of Masson pine was indeed altered by thinning treatments. Results also indicated a nonlinear trend in the allometric relationship through time which was significantly affected by thinning. The height–diameter allometric coefficient exhibited a unimodal convex bell curve with time in unthinned plots, and thinning significantly interfered with the original trend of the height–diameter allometric coefficient. Thinning caused trees to increase diameter growth at the expense of height growth, resulting in a decrease of the ratio of tree height to diameter, and this trend was more obvious as the thinning intensity increased.

1. Introduction

Height and diameter are two basic dimensions of tree size that are fundamentally related to processes ranging from individual stem to whole-ecosystem scales [1]. The allocation pattern of tree growth to height and stem diameter is an important structural trait of a tree that reflects its capacity to adapt to different environmental conditions and evolutionary competition [2,3,4,5,6]. For example, pioneer species typically have a larger height–diameter ratio, allowing them to quickly attain or maintain a position in the canopy [7,8]. Species that frequently encounter strong winds might evolve stouter stems to withstand the extreme weather [9].
As a key factor of stem form, the allometric relationship between tree height and diameter is thought to reflect the balance between growth and survival due to allocation strategies related to biomechanical and hydraulic constraints [10,11,12,13]. Tree height growth determines carbon gain via light capture [14], while stem diameter growth plays an important role in ensuring mechanical support and capacity for water absorption and transport [15,16,17,18]. Trees that invest less in mechanical support can grow faster and reach the canopy more quickly [19] but less structural support reduces the ability to resist elastic deformation and avoid buckling [20,21].
Many natural and biological factors affecting the tree height–diameter allometric relationship have been identified through research. For example, precipitation, temperature, geographic location, and site conditions have been shown to have significant effects on height–diameter allometry, and forest structure, tree species, and genetic variability within a species have also been shown to play a role [1,4,18,21,22,23,24,25,26]. However, our understanding is limited with regard to how anthropogenous measures, such as thinning, affect the tree height–diameter allometry in residual stems.
Thinning of a forest stand is a fundamental silvicultural tool used to achieve a variety of management objectives and is an integral part of even- and uneven-aged management for efficient and profitable production of timber products [27,28,29]. Traditionally, thinning has been used to increase production and improve the quality of residual trees by removing damaged, slow-growing, or unhealthy trees to promote more growing space and resource availability for healthy trees [30,31,32,33]. Thinning can also be used to promote forest understories and vertical structural characteristics [34,35,36] as well as alter the microenvironment, including altering light availability, temperature, evaporative demand, and soil properties [37,38].
Many investigators have indicated that thinning immediately stimulates diameter growth of residual stems [39,40,41,42,43,44], and it is generally believed that individual tree height growth of residual stems is less influenced by thinning than it is by diameter growth. However, the dynamics and relationship between periodic annual height growth and stand density following thinning are complex [45,46]. Some studies have suggested that height growth and total height are relatively unaffected by thinning [29,47,48,49,50]. On the other hand, other studies have observed thinning to have an obvious effect on tree height growth, especially at very high thinning intensities [27,51,52,53,54,55]. Some evidence has shown short-term decreases [56] followed by long-term increases [45,46] in height growth following thinning.
The height–diameter allometric relationship is a key factor determining tree volume, biomass, carbon storage, and wood structure [4,57]. In general, no matter how thinning affects diameter and height growth, it may be reasonable to expect that the allometric relationship of tree height and diameter will be different in thinned and unthinned stands. However, most existing studies on the influence of thinning on tree growth have often focused on how thinning affects tree height and diameter increments and have analyzed these two parameters separately [27,29,43,49,52]. We can only approximately deduce the influence of thinning on the tree height–diameter ratio from increment measurements, and we cannot obtain a detailed and accurate dynamic process of tree height–diameter allometry.
Masson pine is an important tree species of Pinus (Pinaceae) with a height of up to 45 m and a diameter at breast height of up to 1.5 m. The Pinaceae is the most diverse and widespread family of conifers, comprising 11 genera and about 230 species [58]. It dominates large areas of the Northern Hemisphere [59] and is one of the most important tree species for timber supply in the world, accounting for 42% of the world’s industrial forest plantations [60]. As a native species, Masson pine has been widely planted for more than one thousand years due to its high-quality timber and occupies 13.2 percent of all forested land in China, covering 14.2 million ha. Masson pine and most other tree species of Pinaceae are light-demanding pioneer species, so thinning is one important silvicultural practice used to manage the species. Studying the thinning effects of Masson pine is of great reference value for other Pinaceae species.
This study focuses on thinning effects on stem height–diameter allometry in Masson pine plantations, which are planted across a vast geographic area in China. We tested the hypothesis that thinning would affect the height–diameter allometric relationship of Masson pine. After the hypothesis was confirmed, an analysis of thinning effects on tree height and diameter allometry was conducted over a long-term scale. We expect the results to provide insight into the application of thinning so that it can produce the optimal tree height–diameter allometric relationship.

2. Materials and Methods

2.1. Data Description

We used data from a thinning experiment in Masson pine plantations which was established in 1993 at the Experimental Center of Tropical Forestry, which is located in Pingxiang City of the Guangxi Zhuang Autonomous Region, southwestern China (coordinates 21°57′ N, 106°39′ E to 22°19′ N, 106°59′ E). The experiment was installed with uniform environment and site conditions (site index 16 m and base age 20) and implemented in a randomized block design with five blocks and four treatments per block, totaling 20 experimental units. The landform of the area is low hills with an elevation of 400–450 m above sea level. The soils are latosolic red loams developed from granite with a clay–loam texture, a stoniness of about 6%, and a mean depth of 90 cm. In each block four permanent plots were installed. Each unit had an area of 2500 m2 and was randomly assigned to one of four treatment categories: (1) T0, unthinned control plot, (2) T1, lightly thinned plot (approximately 30% of the planted Masson pine basal area removed), (3) T2, moderately thinned plot (approximately 50% of the basal area removed), and (4) T3, heavily thinned plot (approximately 70% of the basal area removed). In each plot, a fixed subplot of 400 m2 was set up for tree growth measurements. Thinning and plot establishment were performed during the dormant season of 2007 at the age of 15 years. All thinning was performed from below and the height (H) and diameter at breast height (DBH) of all trees ≥5.0 cm were measured using Blume-Leiss hypsometer and diameter tape, respectively, before thinning. During thinning, inferior trees were removed, i.e., the smallest trees in height and/or diameter or trees that were crooked, forked, and/or broken were removed. When choosing which trees to remove emphasis was also given to achieving the most uniform spacing between residual trees as possible. Subplots have been measured every two years since 2008. To date, five remeasurements have been completed, a summary of which is given in Table 1. The growth data of tree height and stem diameter before 2007 were obtained through stem analysis of fifteen mean trees from thinned plots. In all analyses, trees that died (mainly in unthinned plots; very few died in thinned plots) during the observation period were ignored.

2.2. Testing the Effects of Thinning on the Height–Diameter Allometry Rhythm

2.2.1. Mathematical Modeling of Height–Diameter Allometry

In this study, the five most frequently used function forms in published research (Table 2) were tested and compared for their reliability and predictive ability [61,62].
Model parameters were estimated using the “nls” function of the “nlme” package in the statistical environment R (version 3.1-137) [68]. The best model was selected using Akaike information criterion (AIC) [69,70], residual standard error (RSE), and coefficient of determination (R2). Overall, models with higher R2, lower AIC, and lower RSE were preferred [71,72].

2.2.2. Dummy Variable Models and Standard F-tests

To evaluate the effects of thinning on height–diameter allometry, the dummy variable method and nested model F-tests [73] were used to determine whether the thinning treatments altered height–diameter allometry. Dummy variables were created: (1) p1 = 1 denotes the thinning treatment T1 and 0 the rest of the cases, (2) p2 = 1 denotes the thinning treatment T2 and 0 the rest of the cases, and (3) p3 = 1 denotes the thinning treatment T3 and 0 the rest of the cases. The thinning treatment T0 is represented by p1 = p2 = p3 = p4 = 0. Thus, the thinning treatments were introduced into the basic model Equation (1) and the extended models Equations (2) and (3) were obtained, i.e.,
H = α 0 × D β 0
H = ( α 0 + α 1 p 1 + α 2 p 2 + α 3 p 3 ) × D β 0
H = ( α 0 + α 1 p 1 + α 2 p 2 + a 3 p 3 ) × D ( β 0 + β 1 p 1 + β 2 p 2 + β 3 p 3 )
where H and D are the total tree height and diameter at breast height, respectively, and αi and βi are the model parameters to be estimated. The F test statistic was used to determine whether thinning treatments had a significant effect on each parameter, i.e.,
F = ( R S S 1 R S S 0 R S S 1 ) × ( d f 1 d f 1 d f 0 )
where RSS1 and df1 are the residual sum of squares and degrees of freedom, respectively, of the extended model in which the thinning treatment was introduced, and RSS0 and df0 are the residual sum of squares and degrees of freedom, respectively, of the basic model in which the thinning treatment was not introduced.

2.3. Analysis of the Temporal Dynamics of Thinning Effects on Height–Diameter Allometry

2.3.1. Calculation of Relative Increments and Allometric Coefficient

To examine the temporal dynamics of the height–diameter allometry relationship more subtly, relative increments were used as a prerequisite for quantification of the allometric relationship [74] in this study. The periodic (annual) height–diameter allometric coefficient, which is widely used as distribution coefficient for growth resources between tree height and diameter, was calculated for the time series data of long-term observation plots [24,75], i.e.,
m h , d = ln ( h t ) ln ( h t Δ t ) ln ( d t ) ln ( d t Δ t )
where mh,d is the allometric coefficient, and ht, ht−Δt and dt, dt−Δt are the tree height and stem diameter at breast height, respectively, at two subsequent points in the time of measurement, t and tt.
Equation (5) reflects how the relative growth of one growth quantity, h, is correlated with the relative growth of another, d, by the periodic allometric coefficient mh,d. In the case of the allometric coefficient, mh,d = 1 indicates isometric growth and that relative increment values of both tree height and diameter at breast height are equal. If mh,d < 1, the relative height increment is lower than the relative diameter increment and a negative allometric relationship is observed. If mh,d > 1, the relative height increment is greater than the relative diameter increment, indicating a positive allometric relationship [76].

2.3.2. Generalized Additive Mixed Model Analysis

The allometric relationship of tree height versus diameter at breast height may vary during tree ontogeny [20,24], so the influence of time on allometric coefficient was considered when analyzing the effect of thinning on the height–diameter allometric relationship. To scrutinize the dynamic process of thinning effects on height–diameter allometry over time, the height–diameter allometric relationships of different thinning treatments were modeled using the generalized additive mixed model (GAMM) (version 0.2-5) from the “gamm4” package in R [68].
GAMM is a semiparametric model with a linear predictor involving a sum of smooth functions of covariates which allows flexible functional dependence of an outcome variable on covariates by using nonparametric regression while accounting for correlation between observations by using random effects [77]. GAMM has been increasingly applied in ecological and environmental research [78], as, i.e.,
m i j k = K 0 + T i + f i ( t i j k ) + R i j + ε i j k
where mijk is the dependent variable (periodic height–diameter allometric coefficient corresponding to the kth measurement of the jth tree of thinning treatment i), K0 is the model intercept, Ti is the fixed effect of thinning treatment i, fi(tijk) is a smooth function of tree age (t) corresponding to the kth measurement of the jth tree in thinning treatment i, Rij is the random effect of the jth tree which is assumed to be distributed as N (0, σ2) with a variance component σ2, and εijk is a vector of errors.
Time series data may be auto-correlated; using models which do not consider this autocorrelation can cause inaccurate parameter estimation or inadequate quantification of uncertainty [79]. Since several height–diameter allometric coefficients were calculated for an individual tree, the allometric coefficients of individuals tended to be more similar than those computed for other trees [24]. Among the variety of correlation patterns in this context, first order auto-regressive structure (AR1) is often utilized [80]. Hence, the existence of any auto-correlation at the tree level (between the calculated height–diameter allometric coefficients of the same tree) was considered by the (AR1) of the GAMM [24,68,81,82,83].

3. Results

3.1. Overall Trends of Thinning Effects on Height–Diameter Allometry

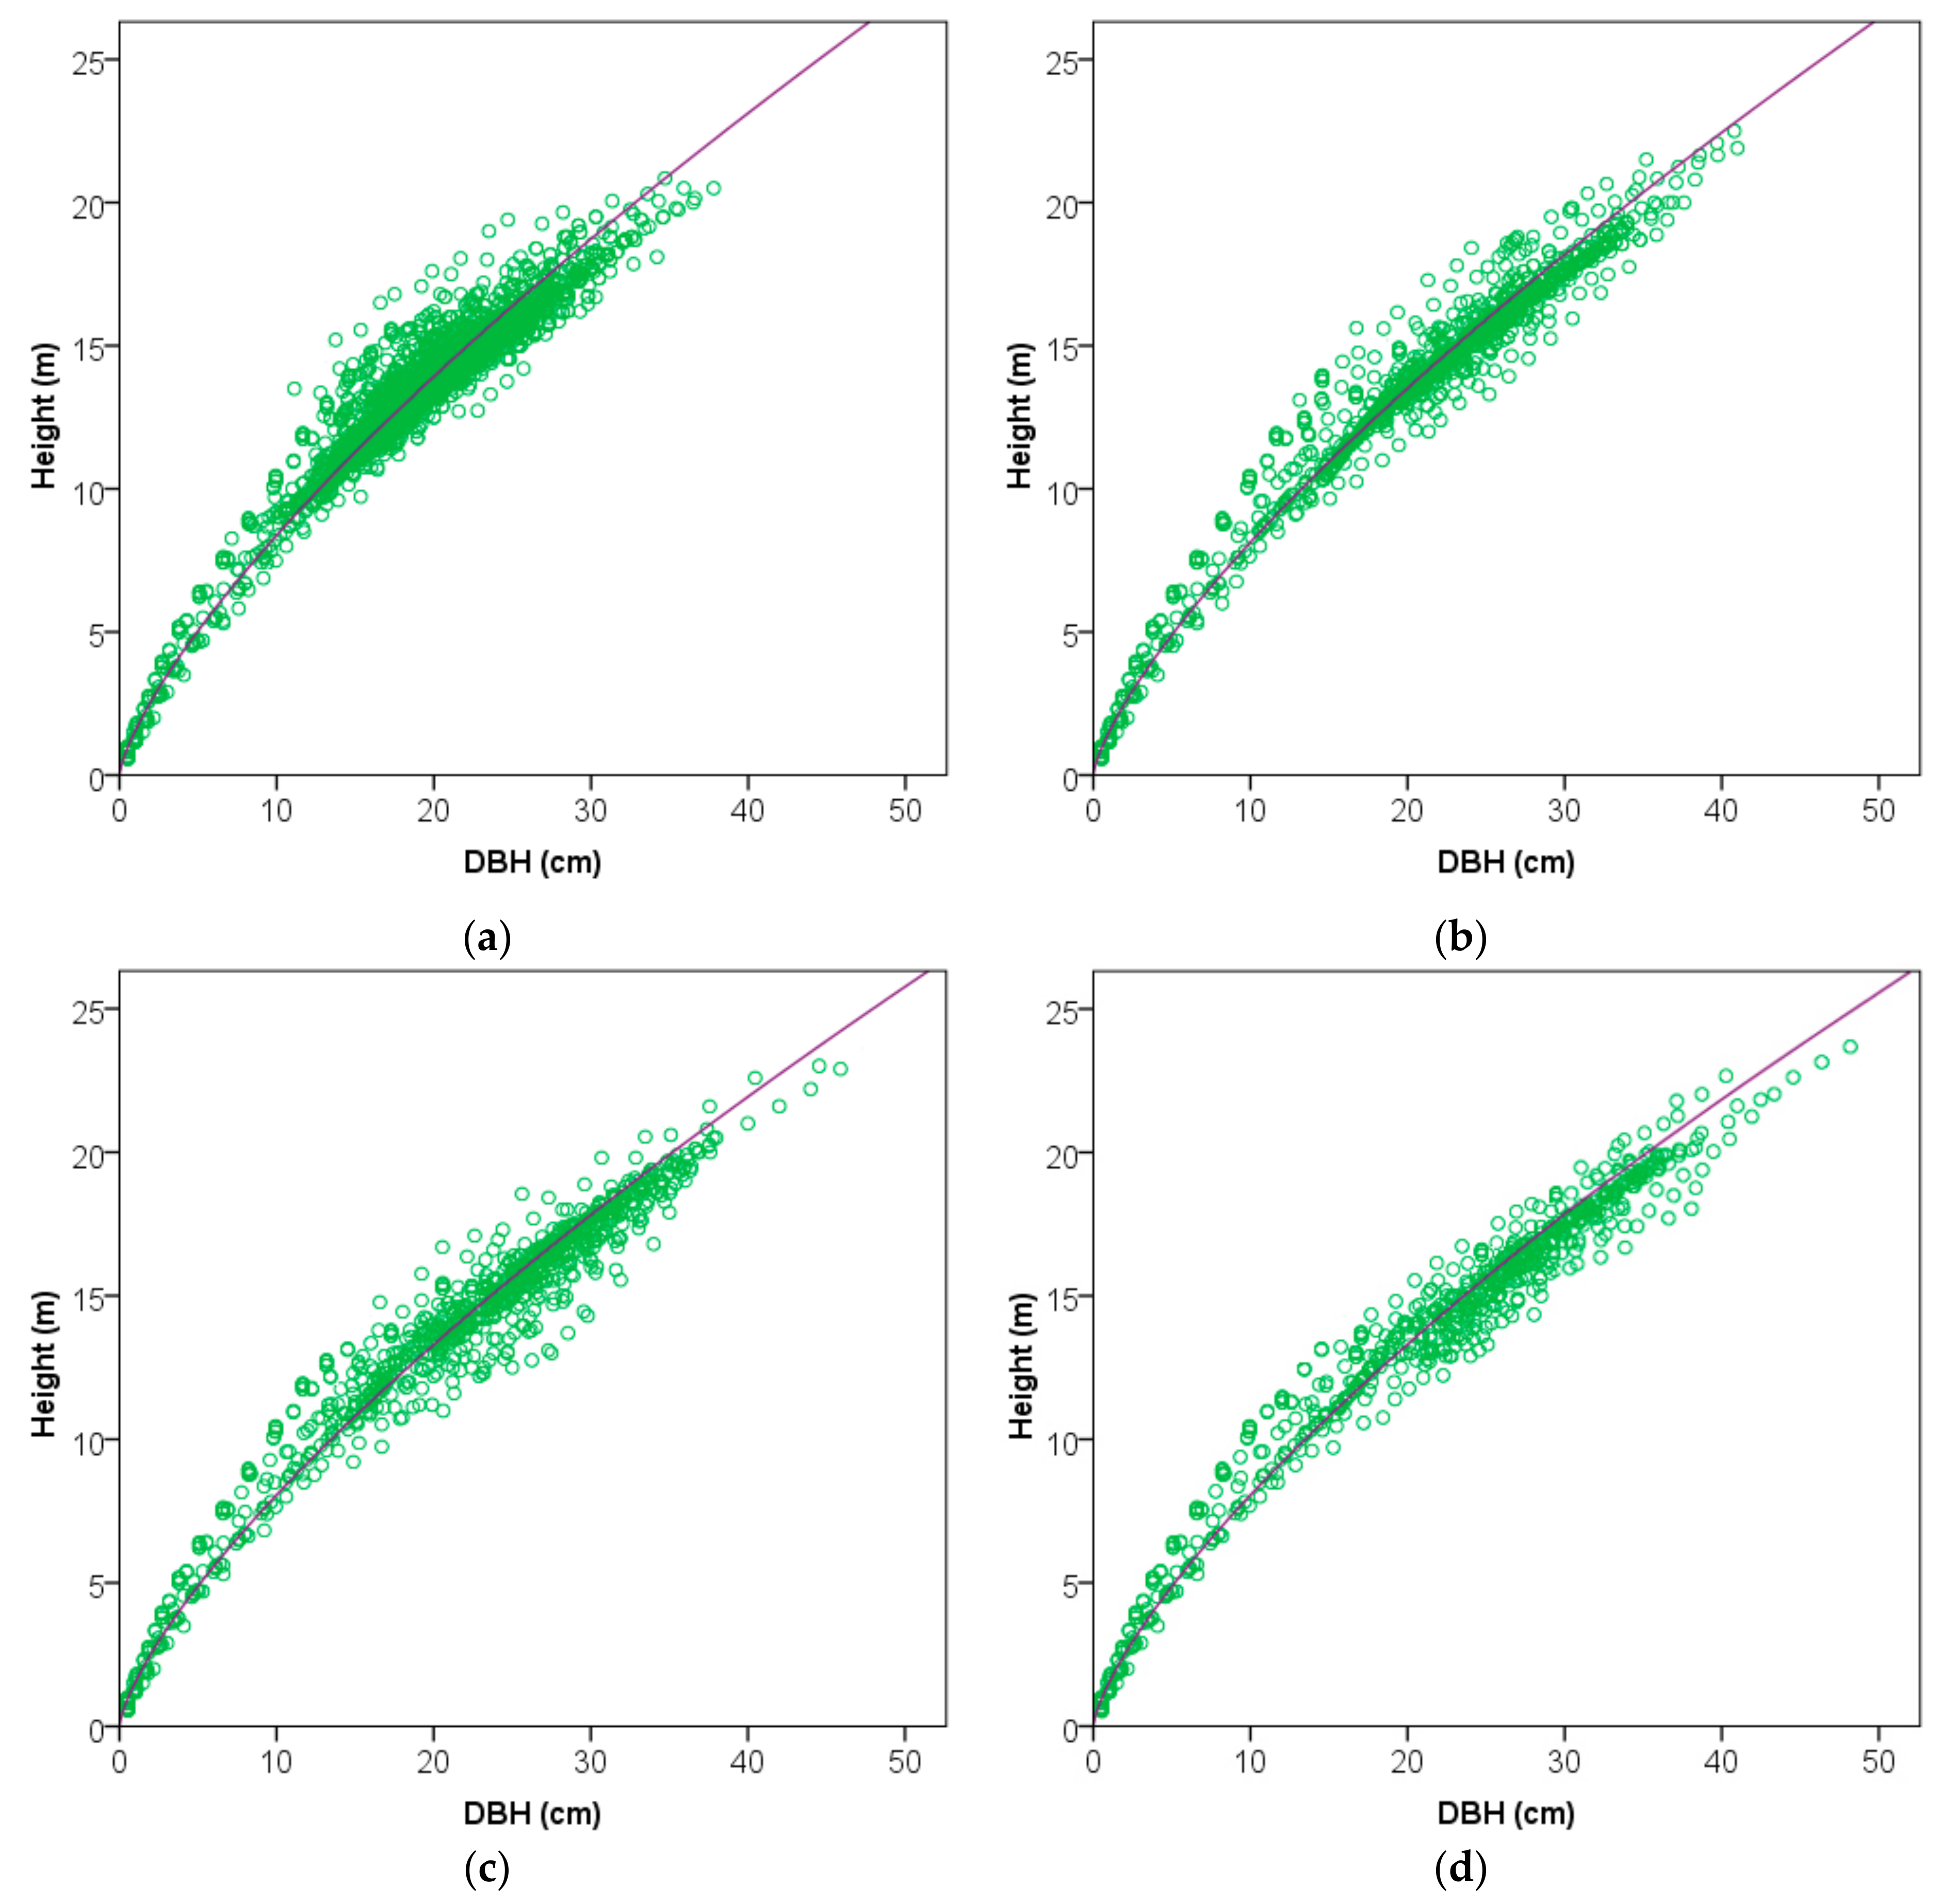
3.1.1. The Best Height–Diameter Allometric Model

By fitting all thinned and unthinned survey data and comparing the series of commonly used height–diameter equations given above according to AIC, RSE, and R2 values, we concluded that the power function optimizes the best fit of height–diameter allometric relationships for Masson pine (Table 3).

3.1.2. Overall Effects of Thinning on Height–Diameter Allometry

As shown in Table 4, the parameters of height–diameter allometry models under different thinning treatments were different. The F-test results (Table 5) of the dummy variable model detected a significant difference between the coefficients of the basic model Equation (1) and extended models Equations (2) and (3). This difference indicated that the pattern of the height–diameter allometry relationship was indeed altered by thinning treatments.
From the height–diameter allometry relationship fit to the power function (Figure 1) it can be seen that with the increase in thinning intensity, the number of trees with larger diameters significantly increased. Similarly, trees at the same diameter are shown to have lower heights under higher thinning intensities (for a given diameter of 20 cm, the tree heights of T1, T2, and T3 thinning treatments were found to be 0.64 m, 0.90 m, and 0.99 m smaller, respectively). This trend suggests that thinning results in trees allocating more growth resources to diameter growth.

3.2. The Temporal Dynamics of Thinning Effects on Height–Diameter Allometry

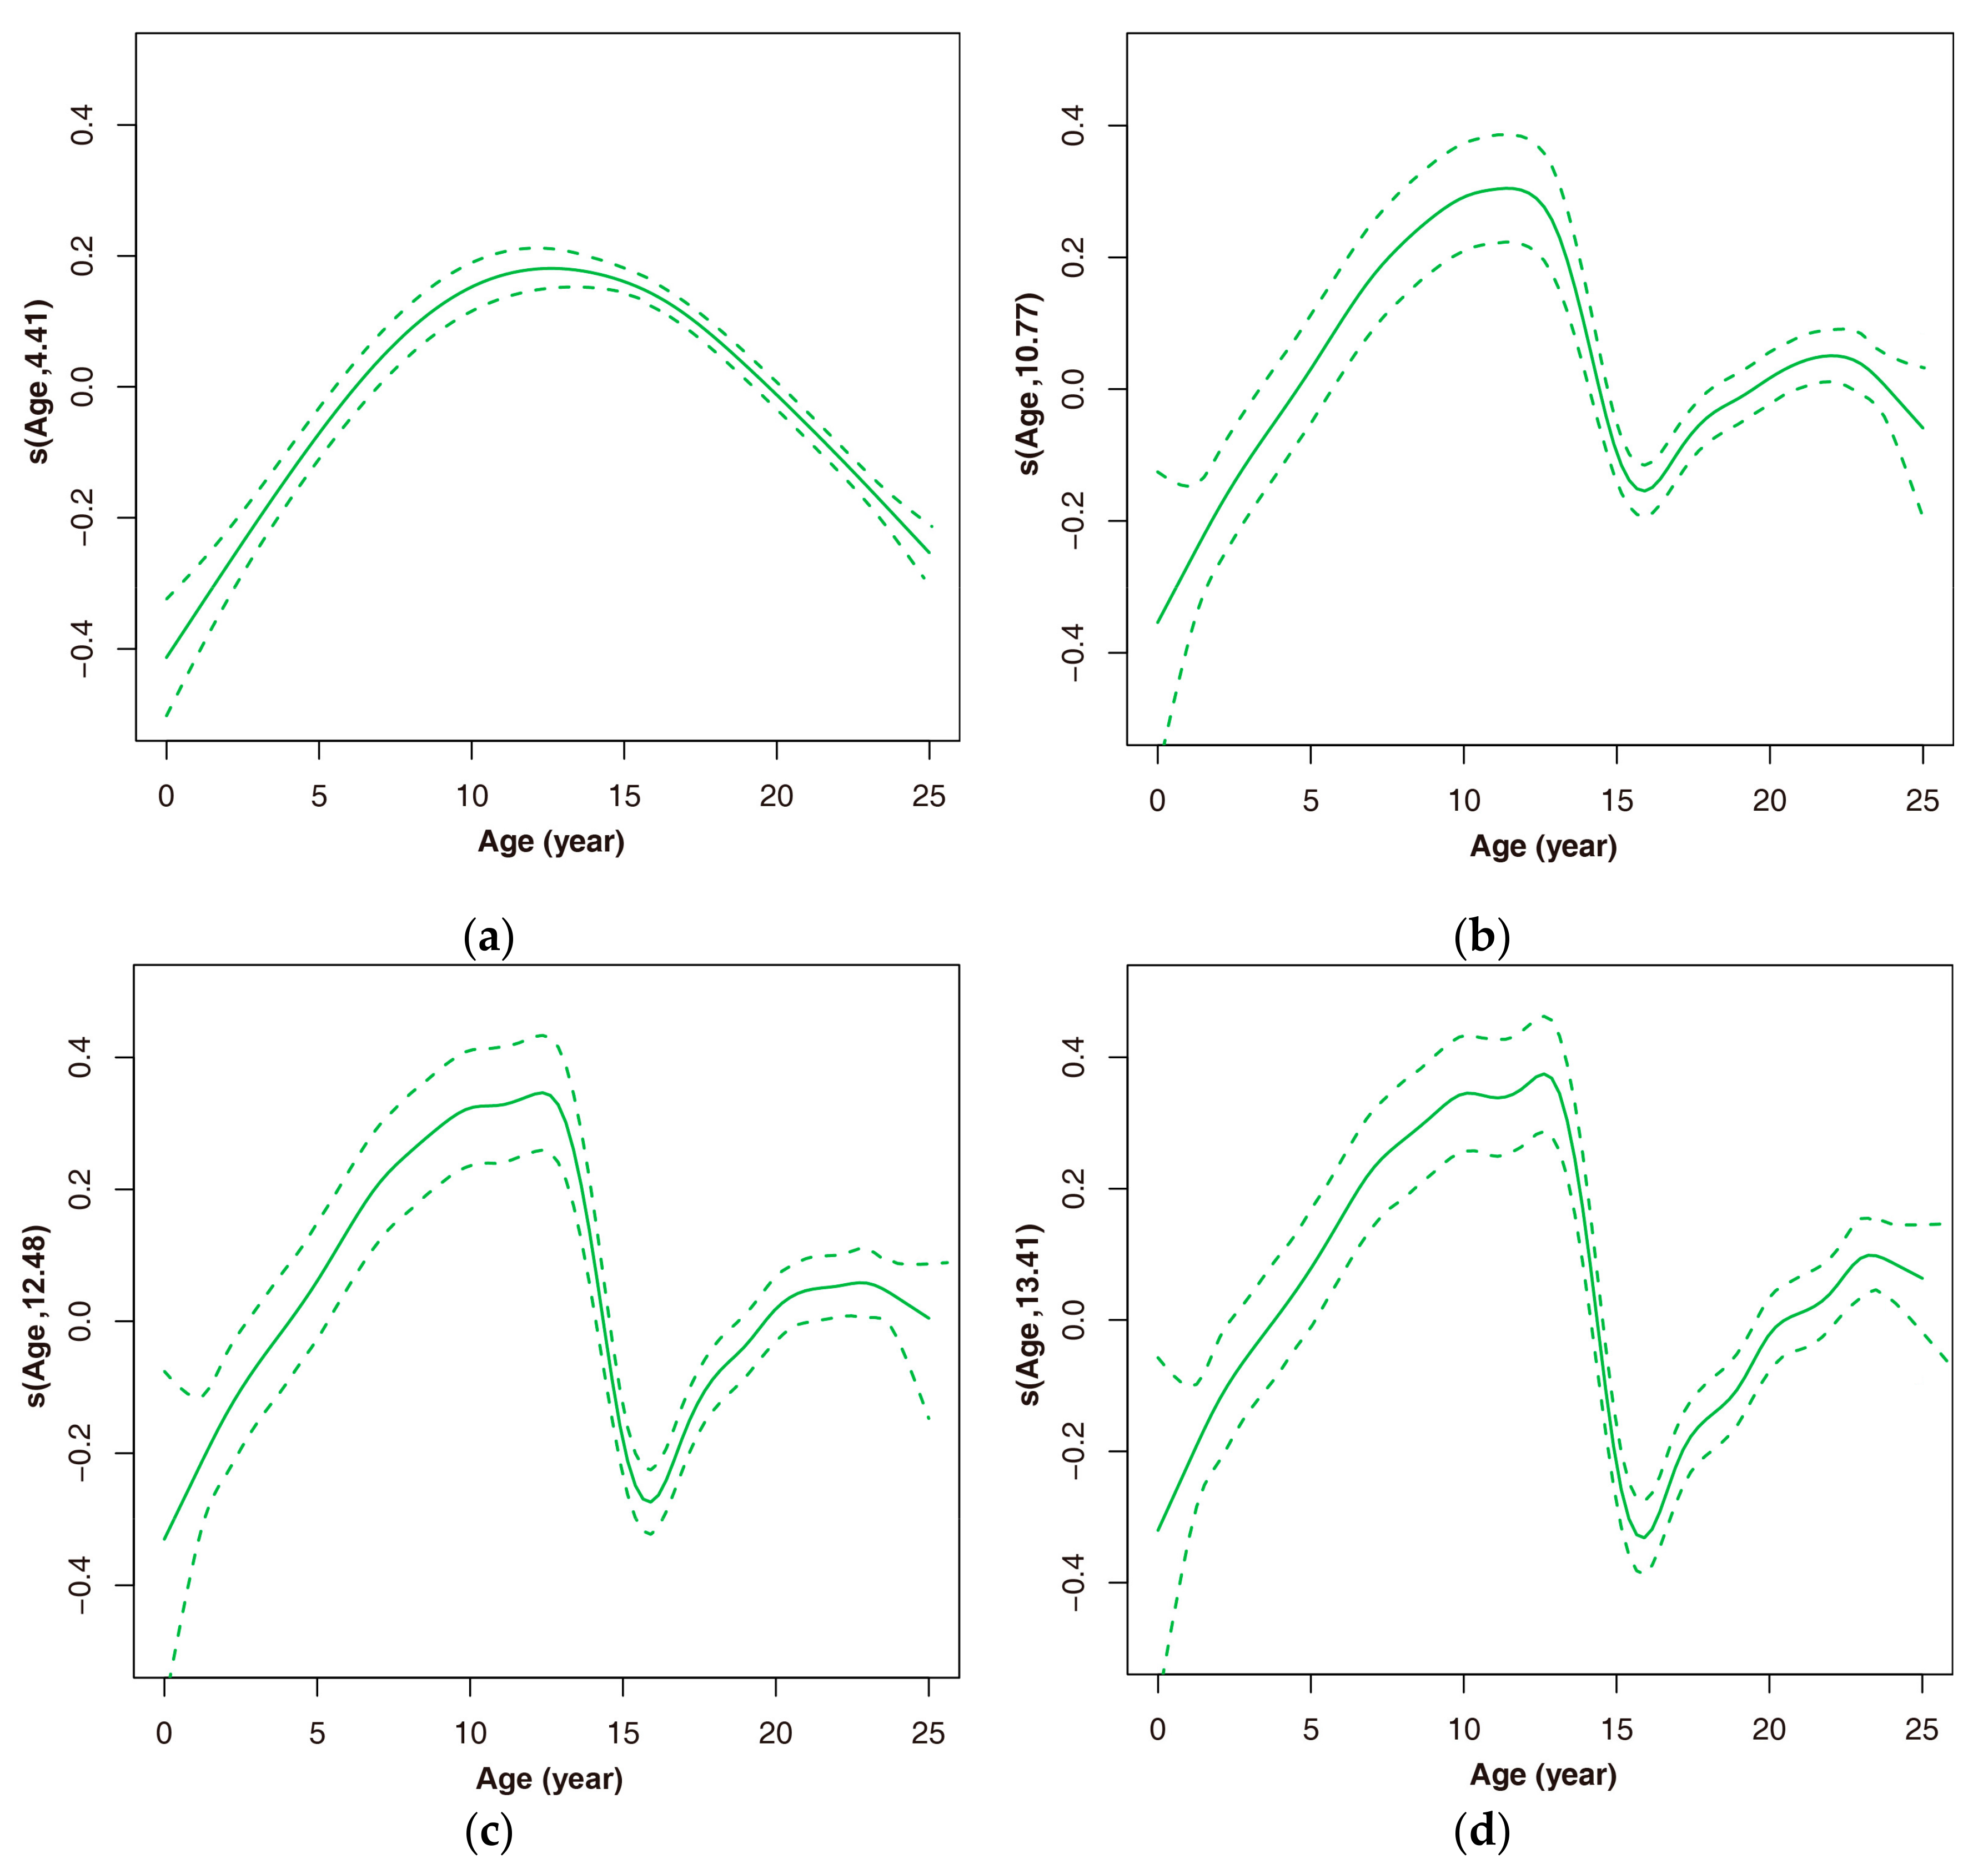
3.2.1. The Natural Allometric Trend of Height–Diameter

Fitting results of the generalized additive mixed models show that the height–diameter allometric relationship of Masson pine in unthinned control plots was not invariant over time. As shown in Figure 2a, the estimated degrees of freedom (4.41) was found to be greater than 1.0, suggesting that significant and strong nonlinearities exist among height–diameter allometric coefficient and tree age.
The height–diameter allometric coefficient exhibited a unimodal convex bell curve over time. A gradual increase was observed in the height–diameter allometric coefficient with increasing tree age in the early stage, indicating that growth resources were increasingly being used for height growth. The observed values reached a peak at approximately 10 years to 15 years and then continued to gradually decrease toward the later period of observation, indicating that growth resources were again used more for gradual diameter growth after the 15th year. Additionally, the height–diameter allometric coefficients were greater than 1.0 from approximately the 6th year to the 20th year, while the coefficients for the remaining years were less than 1.0, indicating that the relative height increment was greater than the relative diameter increment during years 6 to 20, and that this relationship was reversed in the remaining years.

3.2.2. Effects of Thinning on Height–Diameter Allometry

As shown in Figure 2b–d, the estimated degrees of freedom (10.77, 12.48, and 13.41 for T1, T2, and T3 treatment, respectively) were found to be all greater than 1.0 and the nonlinearity modeled by the smooth spline increased with the increase in thinning intensity. This result demonstrates that thinning significantly affected the original trend of the height–diameter allometric coefficient. After thinning, the coefficients had an immediate and sharp decrease from greater than 1.0 to less than 1.0. From the second year after thinning the coefficient increased gradually and from around the fifth year after thinning it decreased gradually again. This suggests that thinning caused trees to allocate more resources toward diameter growth and that the growth status of trees was reversed from the original case where the relative height increment was greater than the relative diameter increment. Later, about 5 years after thinning, the trend can be seen to have returned to the original pattern, in which more growth resources were allocated first toward height growth and then gradually towards diameter growth again.
Hence, the interaction of thinning and tree age ultimately determined the process of change in the height–diameter allometry (Figure 3). A higher intensity of thinning resulted in a greater magnitude in the reduction of the coefficients and a longer duration of time required for it to recover from less than 1.0 to greater than 1.0, which meant that trees in plots undergoing high intensity thinning were more likely to use growth resources for diameter growth than trees in plots undergoing low intensity thinning.

4. Discussions

Mathematical equations are widely used to quantify the allometric relationship between tree height and stem diameter [1,61,84]. Many studies have shown that different regions and tree species have different optimum height–diameter allometry models [4,25,62]. To more accurately analyze the effects of thinning on Masson pine plantations, we first compared the ability of five commonly used height–diameter allometric models to estimate heights from diameters. The results showed that the power function had the best goodness of fit for our data. This function has several desirable properties, such as its flexible integrated and logarithmic representation [74,76,85,86,87], and it has also been widely used to described allometric relationships for pine and other species in America, Europe, Asia, and South Africa [1,18,25,88].
When comparing the curves of the height–diameter allometry relationship (Figure 1) fitted by the power function for different thinning treatments, we found that thinning significantly changed the ratio of height to diameter. The dummy variable methods and nested F-tests showed that there were significant differences in the parameters between thinned and unthinned treatments, demonstrating that thinning had changed the height–diameter allometry. This, combined with the nature of the change, suggests that thinning promoted diameter growth and loss of height growth. Some studies have shown that thinning promotes tree diameter growth at the cost of height growth [27,39,41,52] and our result appears to be consistent with these studies.
The main objective of height–diameter allometric research, from its beginning, has been mainly to find a universal allometric coefficient [89,90]. A periodic height–diameter allometric coefficient based on relative increments [24,75] was used in this study because it can make simple and unbiased comparisons of plant performance among plants of different sizes growing under different environmental conditions [91,92,93]. The means of the observed height–diameter allometric coefficients of different thinning treatments showed that tree height–diameter allometry was significantly affected by thinning. Compared with the height–diameter allometric growth model, which can only illustrate a general trend of change in height–diameter allometry under different thinning treatments, the periodic height–diameter allometric coefficient can give a more precise description of how the tree height–diameter relationship changes over time and in response to thinning.
The exponent of the power function (β in this study) is itself a height–diameter allometric coefficient [74,76,85,87,88,94]. When describing tree height–diameter allometry with the power function, it is frequently assumed that the height–diameter allometric coefficient is constant throughout the growth period of the trees. However, the dynamic changes observed in this study in the height–diameter allometric relationship over time were diverse. Some studies have found that the allometric relationship of tree height versus diameter can change only slightly or even be invariant [95,96], while others have found that the relationship is not invariant over time [20,24,97]. Such ontogenetic strategies are often considered to be genetically determined [98], but for some species, allometric growth is not an invariant character of a genotype and environmental condition, and relieving competition by thinning can change how trees allocate their growth resources [99,100].
To scrutinize the temporal dynamics of the effects of thinning on height–diameter allometry, the GAMM was used in this study. The results showed that the allometric relationship of Masson pine varied over time and was also significantly affected by thinning. We believe that the effects of thinning on height–diameter allometry may be mainly achieved by affecting competition (growth space or stand canopy status). In living systems, biological traits can confer the ability to alter their phenotypes to better respond to environmental change [101]. Better height growth for a given diameter endows a tree with an advantage when competing for sunlight, while more rapid diameter growth for a given tree height can promote the maintenance of this competitive advantage [14]. After obtaining a spatial advantage, trees maintain this advantage through strengthening their mechanical support [15,16] and water transport capacity [17] in order to maximize fitness.
Masson pine is a typical light-demanding species, and during the early stage of stand growth, trees do not need to compete for above-ground growing space because the canopy has not yet closed. Thus, trees use more resources for diameter growth, causing the relative diameter increment to be greater than the relative height increment. As the canopy closes over time, trees begin to compete for space to capture sunlight, and, thus, they use more growth resources for height growth, causing the relative height increment to be greater than the relative diameter increment. This trend occurs until the initiation of self-thinning, during which growing space is released and the magnitudes of the relative increments are reversed.
Silvicultural thinning changes the canopy status of residual trees rapidly, which causes the remaining trees to suddenly have more growing space [102]. Consequently, these trees change their original growth pattern and use more growth resources for diameter growth to maintain their spatial advantage until the canopy again begins to close, after which the trees begin the next stage of space competition [103]. The sudden increase in diameter growth of retained trees after thinning supports this explanation. Further evidence is provided by the demonstrated nonlinearities among height–diameter allometric coefficients and tree age as well as the larger reduction in the magnitude of height–diameter allometric coefficients and the longer duration for the allometric coefficient to recover from less than 1.0 to greater than 1.0 with greater thinning intensity.

5. Conclusions

In this work, stem height–diameter allometry of Masson pine plantations was found to be not invariant over time and to vary nonlinearly with stand age. Thinning had a significant influence on the tree height–diameter allometry of Masson pine plantations, which altered the height–diameter allometry rhythm. Thinning caused trees to increase diameter growth at the expense of height growth, resulting in a decrease of the ratio of tree height to diameter, and this trend was more obvious as the thinning intensity increased. The change in stem height–diameter allometry of Masson pine was mainly related to competition (growth space) among the trees. When trees acquired a spatial advantage, they allocated more growth resources toward diameter growth, resulting in greater diameter growth relative to tree height growth; however, to consolidate the gained spatial advantage in order to facilitate competition at the next stage, they were required to allocate more growth resources toward increasing height growth. Thinning affected the competition of light and water by changing the growth space of trees, thereby affecting the height–diameter allometric relationship. As thinning intensity increased, a greater spatial advantage was acquired by the remaining trees, and these trees subsequently allocated more growth resources to diameter growth, resulting in a longer period of time in which the relative diameter increment was greater than the relative height increment.

Author Contributions

Conceptualization, S.Z. and Y.L.; Methodology, S.Z., Y.L., C.D., and R.E.F.; Software, C.D.; Validation, A.M.; Formal analysis, C.D.; Investigation, C.D. and A.M.; Resources, S.Z. and Y.L.; Data curation, Q.L.; Writing—original draft preparation, C.D.; Writing—review and editing, Q.L. and R.E.F.; Project administration, Q.L.; Funding acquisition, Y.L.

Funding

This research was funded by the Central Public-Interest Scientific Institution Basal Research Fund (grant number IFRIT201501).

Acknowledgments

We appreciate the staff of the Experimental Center of Tropical Forestry for their help during the field survey. We also appreciate the editors and anonymous reviewers for their constructive comments.

Conflicts of Interest

The authors declare no conflict of interest.

References

  1. Hulshof, C.M.; Swenson, N.G.; Weiser, M.D. Tree height-diameter allometry across the United States. Ecol. Evol. 2015, 5, 1193–1204. [Google Scholar] [CrossRef] [PubMed]
  2. Niklas, K.J.; Spatz, H.C. Growth and hydraulic (not mechanical) constraints govern the scaling of tree height and mass. Proc. Natl. Acad. Sci. USA 2004, 101, 15661–15663. [Google Scholar] [CrossRef] [PubMed] [Green Version]
  3. Price, C.A.; Enquist, B.J.; Savage, V.M. A general model for allometric covariation in botanical form and function. Proc. Natl. Acad. Sci. USA 2007, 104, 13204–13209. [Google Scholar] [CrossRef] [PubMed] [Green Version]
  4. Feldpausch, T.R.; Banin, L.; Phillips, O.L.; Baker, T.R.; Lewis, S.L.; Quesada, C.A.; Affum-Baffoe, K.; Arets, E.J.; Berry, N.J.; Bird, M.; et al. Height-diameter allometry of tropical forest trees. Biogeosciences 2011, 8, 1081–1106. [Google Scholar] [CrossRef] [Green Version]
  5. Poorter, L.; Lianes, E. Architecture of Iberian canopy tree species in relation to wood density, shade tolerance and climate. Plant Ecol. 2012, 213, 707–722. [Google Scholar] [CrossRef] [Green Version]
  6. Vizcaíno-Palomar, N.; Ibáñez, I.; Benito-Garzón, M.; González-Martínez, S.C.; Zavala, M.A.; Alía, R. Climate and population origin shape pine tree height-diameter allometry. New For. 2017, 48, 363–379. [Google Scholar] [CrossRef]
  7. King, D.A. Allometry of saplings and understorey trees of a Panamanian forest. Funct. Ecol. 1990, 4, 27–32. [Google Scholar] [CrossRef]
  8. Harrington, C.A.; DeBell, D.S. Above-and below-ground characteristics associated with wind toppling in a young Populus plantation. Trees 1996, 11, 109–118. [Google Scholar] [CrossRef]
  9. Thomas, S.C.; Martin, A.R.; Mycroft, E.E.; Bellingham, P. Tropical trees in a wind-exposed island ecosystem: height-diameter allometry and size at onset of maturity. J. Ecol. 2015, 103, 594–605. [Google Scholar] [CrossRef] [Green Version]
  10. Tilman, D. Plant strategies and the dynamics and structure of plant communities. Bull. Math. Biol. 1989, 4, 28–29. [Google Scholar]
  11. Chave, J.; Andalo, C.; Brown, S.; Cairns, M.A.; Chambers, J.Q.; Eamus, D.; Fölster, H.; Fromard, F.; Higuchi, N.; Kira, T.; et al. Tree allometry and improved estimation of carbon stocks and balance in tropical forests. Oecologia 2005, 145, 87–99. [Google Scholar] [CrossRef] [PubMed]
  12. Ryan, M.G.; Phillips, N.; Bond, B.J. The hydraulic limitation hypothesis revisited. Plant Cell Environ. 2006, 29, 367–381. [Google Scholar] [CrossRef] [PubMed]
  13. Henry, H.A.L.; Aarssen, L.W. The interpretation of stem diameter–height allometry in trees: biomechanical constraints, neighbour effects, or biased regressions? Ecol. Lett. 2010, 2, 89–97. [Google Scholar] [CrossRef]
  14. Moles, A.T.; Warton, D.I.; Warman, L.; Swenson, N.G.; Laffan, S.W.; Zanne, A.E.; Pitman, A.; Hemmings, F.A.; Leishman, M. Global patterns in plant height. J. Ecol. 2009, 97, 923–932. [Google Scholar] [CrossRef]
  15. McMahon, T. Size and shape in biology. Science 1973, 179, 1201–1204. [Google Scholar] [CrossRef]
  16. Niklas, K.J. The scaling of plant height: A comparison among major plant clades and anatomical grades. Annals of Botany (Lond.) 1993, 72, 165–172. [Google Scholar] [CrossRef]
  17. Bullock, S.H. Developmental patterns of tree dimensions in a neotropical deciduous forest. Biotropica 2000, 32, 42–52. [Google Scholar] [CrossRef]
  18. Vizcaíno-Palomar, N.; Ibáñez, I.; González-Martínez, S.C.; Zavala, M.A.; Alía, R. Adaptation and plasticity in aboveground allometry variation of four pine species along environmental gradients. Ecol. Evol. 2016, 6, 7561–7573. [Google Scholar] [CrossRef]
  19. Kobe, R.K. Light gradient partitioning among tropical tree species through differential seedling mortality and growth. Ecology 1999, 80, 187–201. [Google Scholar] [CrossRef]
  20. Niklas, K.J. Size-dependent allometry of tree height, diameter and trunk-taper. Ann. Bot. 1995, 75, 217–227. [Google Scholar] [CrossRef]
  21. Banin, L.; Feldpausch, T.R.; Phillips, O.L.; Baker, T.R.; Lloyd, J.; Affum-Baffoe, K.; Arets, E.J.; Berry, N.J.; Bradford, M.; Brienen, R.J.; et al. What controls tropical forest architecture? Testing environmental, structural and floristic drivers. Glob. Ecol. Biogeogr. 2012, 21, 1179–1190. [Google Scholar] [CrossRef]
  22. Fayolle, A.; Panzou, G.J.L.; Drouet, T.; Swaine, M.D.; Bauwens, S.; Vleminckx, J.; Biwole, A.; Lejeune, P.; Doucet, J.L. Taller trees, denser stands and greater biomass in semi-deciduous than in evergreen lowland central African forests. For. Ecol. Manag. 2016, 374, 42–50. [Google Scholar] [CrossRef]
  23. Imani, G.; Boyemba, F.; Lewis, S.; Nabahungu, N.L.; Calders, K.; Zapfack, L.; Riera, B.; Balegamire, C.; Cuni-Sanchez, A. Height-diameter allometry and above ground biomass in tropical montane forests: Insights from the Albertine Rift in Africa. PLoS ONE 2017, 12, e0179653. [Google Scholar] [CrossRef] [PubMed] [Green Version]
  24. Motallebi, A.; Kangur, A. Are allometric relationships between tree height and diameter dependent on environmental conditions and management? Trees 2016, 30, 1429–1443. [Google Scholar] [CrossRef]
  25. Mensah, S.; Pienaar, O.L.; Kunneke, A.; Du Toit, B.; Seydack, A.; Uhl, E.; Pretzsch, H.; Seifert, T. Height-Diameter allometry in South Africa’s indigenous high forests: Assessing generic models performance and function forms. For. Ecol. Manag. 2018, 410, 1–11. [Google Scholar] [CrossRef]
  26. Khamyong, N.; Wangpakapattanawong, P.; Chairuangsri, S.; Inta, A.; Tiansawat, P. Tree species composition and height-diameter allometry of three forest types in Northern Thailand. CMU J. Nat. Sci. 2018, 17, 289–306. [Google Scholar] [CrossRef]
  27. Allen, R.H.; Marquis, D.A. Effect of Thinning on Height and Diameter Growth of Oak and Yellow-Poplar Saplings; Northeastern Forest Experiment Station, Forest Service, USDA For. Serv.: Upper Darby, PA, USA, 1970; Res. Pap. NE-173; pp. 1–11. [Google Scholar]
  28. David, H.C.; Arce, J.E.; Netto, S.P.; Corte, A.P.D.; Marinheski Filho, A.; Araújo, E.J.G.D. Thinning and site quality effects on the height-diameter relationship of Pinus taeda. Floresta E Ambiente 2016, 23, 220–228. [Google Scholar] [CrossRef]
  29. Medeiros, R.A.; Paiva, H.N.D.; Soares, A.A.V.; Cruz, J.D.; Leite, H.G. Thinning from below: effects on height of dominant trees and diameter distribution in Eucalyptus stands. J. Trop. For. Sci. 2017, 29, 238–247. [Google Scholar]
  30. Drew, T.J.; Flewelling, J.W. Stand density management: An alternative approach and its application to Douglas-fir plantations. For. Sci. 1979, 25, 518–532. [Google Scholar]
  31. Smith, D.M.; Larson, B.C.; Kelty, M.J.; Ashton, P.M.S. The Practice of Silviculture: Applied Forest Ecology; John Wiley and Sons, Inc.: New York, NY, USA, 1997. [Google Scholar]
  32. Zeide, B. Thinning and growth: A full turnaround. J. For. 2001, 99, 20–25. [Google Scholar]
  33. Nishizono, T. Effects of thinning level and site productivity on age-related changes in stand volume growth can be explained by a single rescaled growth curve. For. Ecol. Manag. 2010, 259, 2276–2291. [Google Scholar] [CrossRef]
  34. Hayes, J.P.; Chan, S.S.; Emmingham, W.H.; Tappeiner, J.C.; Kellogg, L.D.; Bailey, J.D. Wildlife response to thinning young forests in the Pacific Northwest. J. For. 1997, 95, 28–33. [Google Scholar]
  35. Miller, M.; Emmingham, B. Can selection thinning convert even-age Douglas-fir stands to uneven-age structures? West. J. Appl. For. 2001, 16, 35–43. [Google Scholar] [CrossRef] [Green Version]
  36. Bradford, J.B.; Palik, B.J. A comparison of thinning methods in red pine: Consequences for stand-level growth and tree diameter. Can. J. For. Res. 2009, 39, 489–496. [Google Scholar] [CrossRef]
  37. Gavinet, J.; Vilagrosa, A.; Chirino, E.; Granados, M.E.; Vallejo, V.R.; Prévosto, B. Hardwood seedling establishment below Aleppo pine depends on thinning intensity in two Mediterranean sites. Ann. For. Sci. 2015, 72, 999–1008. [Google Scholar] [CrossRef] [Green Version]
  38. Navarro-Cerrillo, R.M.; Sánchez-Salguero, R.; Rodriguez, C.; Lazo, J.D.; Moreno-Rojas, J.M.; Palacios-Rodriguez, G.; Camarero, J.J. Is thinning an alternative when trees could die in response to drought? The case of planted Pinus nigra and P. Sylvestris stands in southern Spain. For. Ecol. Manag. 2019, 433, 313–324. [Google Scholar] [CrossRef]
  39. Kerr, G. The effect of heavy or ‘free growth’ thinning on oak (Quercus petraea and Q. robur). Forestry 1996, 69, 303–317. [Google Scholar] [CrossRef] [Green Version]
  40. Peltola, H.; Miina, J.; Rouvinen, I.; Kellomäki, S. Effect of early thinning on the diameter growth distribution along the stem of Scots pine. Silva Fenn. 2002, 36, 813–825. [Google Scholar] [CrossRef] [Green Version]
  41. Mäkinen, H.; Isomäki, A. Thinning intensity and growth of Norway spruce stands in Finland. Forestry 2004, 77, 349–364. [Google Scholar] [CrossRef] [Green Version]
  42. Juodvalkis, A.; Kairiukstis, L.; Vasiliauskas, R. Effects of thinning on growth of six tree species in north-temperate forests of Lithuania. Eur. J. For. Res. 2005, 124, 187–192. [Google Scholar] [CrossRef]
  43. Ulvcrona, K.A.; Karlsson, K.; Ulvcrona, T. Identifying the biological effects of pre-commercial thinning on diameter growth in young Scots pine stands. Scand. J. For. Res. 2014, 29, 427–435. [Google Scholar] [CrossRef]
  44. Ferraz, Filho, A.C.; Mola-Yudego, B.; Gonzalez-Olabarria, J.R.; Scolforo, J.R.S. Thinning regimes and initial spacing for Eucalyptus plantations in Brazil. An Acad Bras Cienc. 2018, 90, 255–265. [Google Scholar] [CrossRef] [PubMed] [Green Version]
  45. Oliver, W.W. Fifteen-Year Growth Patterns after Thinning a Ponderosa-Jeffrey Pine Plantation in Northeastern California. Res. Pap. PSW-RP-141; U.S. Department of Agriculture, Forest Service, Pacific Southwest Forest and Range Experiment Station: Berkeley, CA, USA, 1979; Volume 10, p. 141. [Google Scholar]
  46. Harrington, C.A.; Reukema, D.L. Initial shock and long-term stand development following thinning in a Douglas-fir plantation. For. Sci. 1983, 29, 33–46. [Google Scholar]
  47. Schubert, G.H. Growth response of even-aged ponderosa pine related to stand density levels in Arizona. J. For. 1971, 69, 857–860. [Google Scholar]
  48. Weber, V.P.; Finger, C.A.G.; Fleig, F.D.; Souza, C.A.M.D.; Munareto, F.F.; Silva, L.T.D.M.D. Guidelines for thinning of Pinus taeda L. because of dominant height. Ciência Florest. 2013, 23, 193–201. [Google Scholar]
  49. Fedorová, B.; Kadavý, J.; Adamec, Z.; Kneifl, M.; Knott, R. Response of diameter and height increment to thinning in oak-hornbeam coppice in the southeastern part of the Czech Republic. J. For. Sci. 2016, 62, 229–235. [Google Scholar] [CrossRef] [Green Version]
  50. Swift, D.E.; Knight, W.; Béland, M.; Boureima, I.; Bourque, C.P.A.; Meng, F.R. Stand dynamics and tree quality response to precommercial thinning in a northern hardwood forest of the Acadian forest region: 23 years of intermediate results. Scand. J. For. Res. 2016, 32, 45–59. [Google Scholar] [CrossRef]
  51. Larson, P.R. Stem form development of forest trees. For. Sci. 1963, 9, a0001–a0042. [Google Scholar] [CrossRef]
  52. Zhang, S.; Burkhart, H.E.; Amateis, R.L. The influence of thinning on tree height and diameter relationships in loblolly pine plantations. South. J. Appl. For. 1997, 21, 199–205. [Google Scholar] [CrossRef] [Green Version]
  53. Sharma, M.; Smith, M.; Burkhart, H.E.; Amateis, R.L. Modeling the impact of thinning on height development of dominant and codominant loblolly pine trees. Ann. For. Sci. 2006, 63, 349–354. [Google Scholar] [CrossRef]
  54. Russell, M.B.; Amateis, R.L.; Burkhart, H.E. Implementing regional locale and thinning response in the loblolly pine height-diameter relationship. South. J. Appl. For. 2010, 34, 21–27. [Google Scholar] [CrossRef] [Green Version]
  55. Missanjo, E.; Kamanga-Thole, G. Effect of first thinning and pruning on the individual growth of pinus patulatree species. J. For. Res. 2015, 26, 827–831. [Google Scholar] [CrossRef]
  56. Ginn, S.E.; Seiler, J.R.; Cazell, B.H.; Kreh, R.E. Physiological and growth responses of eight-year-old loblolly pine stands to thinning. For. Sci. 1991, 37, 1030–1040. [Google Scholar]
  57. Voelker, S.L.; Lachenbruch, B.; Meinzer, F.C.; Strauss, S.H. Reduced wood stiffness and strength, and altered stem form, in young antisense 4CL transgenic poplars with reduced lignin contents. New Phytol. 2011, 189, 1096–1109. [Google Scholar] [CrossRef] [PubMed]
  58. Eckenwalder, J.E. Conifers of the World; Timber Press, Inc.: Portland, OR, USA, 2009; p. 720. [Google Scholar]
  59. Farjon, A. A Handbook of the World’s Conifers; Brill Academic Publishers: Leiden, The Netherlands, 2010; p. 1112. [Google Scholar]
  60. Payn, T.; Carnus, J.M.; Freer-Smith, P.; Kimberley, M.; Kollert, W.; Liu, S.R.; Orazio, C.; Rodriguez, L.; Silva, L.N.; Wingfield, M.J. Changes in planted forests and future global implications. For. Ecol. Manag. 2015, 352, 57–67. [Google Scholar] [CrossRef] [Green Version]
  61. Huang, S.; Titus, S.J.; Wiens, D.P. Comparison of nonlinear height-diameter functions for major alberta tree species. Can. J. For. Res. 1992, 22, 1297–1304. [Google Scholar] [CrossRef]
  62. Ledo, A.; Cornulier, T.; Illian, J.B.; Iida, Y.; Kassim, A.R.; Burslem, D.F. Re-evaluation of individual diameter: Height allometric models to improve biomass estimation of tropical trees. Ecol. Appl. 2016, 26, 2376–2382. [Google Scholar] [CrossRef] [Green Version]
  63. Winsor, C.P. The Gompertz Curve as a Growth Curve. Proc. Natl. Acad. Sci. USA 1932, 18, 1–8. [Google Scholar] [CrossRef] [Green Version]
  64. Pearl, R.; Reed, L.J. On the rate of growth of the population of the United States since 1790 and its mathematical representation. Proc. Natl. Acad. Sci. USA 1920, 6, 275–288. [Google Scholar] [CrossRef] [Green Version]
  65. Huxley, A. Problems of Relative Growth; The Dial Press: New York, NY, USA, 1932. [Google Scholar]
  66. Richards, F.J. A flexible growth function for empirical use. J. Exp. Bot. 1959, 10, 290–301. [Google Scholar] [CrossRef]
  67. Wykoff, W.R.; Crookston, N.L.; Stage, A.R. User’s Guide to the Stand Prognosis Model. Gen. Tech. Rep. INT-133; US Department of Agriculture, Forest Service, Intermountain Forest and Range Experiment Station: Ogden, UT, USA, 1982; Volume 112, p. 133. [Google Scholar]
  68. Pinheiro, J.; Bates, D.; DebRoy, S.; Sarkar, D.; R Core Team. nlme: Linear and Nonlinear Mixed Effects Models. R Package Version 3.1-137. 2018. Available online: https://CRAN.R-project.org/package=nlme (accessed on 20 September 2019).
  69. Akaike, H. A new look at the statistical model identification. Autom. Control IEEE Trans. 1974, 19, 716–723. [Google Scholar] [CrossRef]
  70. Burnham, K.P.; Anderson, D.R. Model Selection and Inference: A Practical Information-Theoretic Approach, 2nd ed.; Springer: New York, NY, USA, 2002. [Google Scholar]
  71. Mugasha, W.A.; Bollandsås, O.M.; Eid, T. Relationships between diameter and height of trees in natural tropical forest in Tanzania. South. For. A J. For. Sci. 2013, 75, 221–237. [Google Scholar] [CrossRef]
  72. Kearsley, E.; Moonen, P.C.; Hufkens, K.; Doetterl, S.; Lisingo, J.; Bosela, F.B.; Boeckx, P.; Beeckman, H.; Verbeeck, H. Model performance of tree height-diameter relationships in the central Congo basin. Ann. For. Sci. 2017, 74, 7. [Google Scholar] [CrossRef] [Green Version]
  73. Buford, M.A.; Burkhart, H.E. Genetic improvement effects on growth and yield of loblolly pine plantations. For. Sci. 1987, 33, 707–724. [Google Scholar]
  74. Gayon, J. History of the concept of allometry. Am. Zool. 2000, 40, 748–758. [Google Scholar] [CrossRef] [Green Version]
  75. Murphy, S.T.; Pommerening, A. Modelling the growth of sitka spruce (Picea sitchensis (bong.) carr.) in wales using wenk’s model approach. Allg. Forst Und Jagdztg. 2010, 181, 35–43. [Google Scholar]
  76. Pommerening, A.; Muszta, A. Relative plant growth revisited: Towards a mathematical standardisation of separate approaches. Ecol. Model. 2016, 320, 383–392. [Google Scholar] [CrossRef]
  77. Lin, X.; Zhang, D.; Fryzlewicz, P.; Keilegom, I.V. Inference in generalized additive mixed modelsby using smoothing splines. J. R. Stat. Soc. 2010, 61, 381–400. [Google Scholar] [CrossRef] [Green Version]
  78. Groll, A.; Tutz, G. Regularization for generalized additive mixed models by likelihood-based boosting. Methods Inf. Med. 2012, 51, 168–177. [Google Scholar]
  79. Latimer, A.M.; Wu, S.; Gelfand, A.E.; Silander, J.A. Building statistical models to analyze species distributions. Ecol. Appl. 2006, 16, 33–50. [Google Scholar] [CrossRef] [Green Version]
  80. Simpson, S.L.; Edwards, L.J.; Muller, K.E.; Sen, P.K.; Styner, M.A. A linear exponent AR(1) family of correlation structures. Stat. Med. 2010, 29, 1825–1838. [Google Scholar] [CrossRef] [PubMed] [Green Version]
  81. Yang, L.; Qin, G.; Zhao, N.; Wang, C.; Song, G. Using a generalized additive model with autoregressive terms to study the effects of daily temperature on mortality. BMC Med. Res. Methodol. 2012, 12, 165. [Google Scholar] [CrossRef] [PubMed] [Green Version]
  82. Weng, C.F. First Order Autoregressive Mixed Effects Zero Inflated Poisson Model for Longitudinal Data—A Bayesian Approach. Ph.D. Thesis, University of Maryland, College Park, MD, USA, 2014; p. 12. [Google Scholar]
  83. Mellor, A.F.P.; Cey, E.E. Using generalized additive mixed models to assess spatial, temporal, and hydrologic controls on bacteria and nitrate in a vulnerable agricultural aquifer. J. Contam. Hydrol. 2015, 182, 104–116. [Google Scholar] [CrossRef] [PubMed]
  84. Temesgen, H.; Gadow, K.V. Generalized height-diameter models—An application for major tree species in complex stands of interior British Columbia. Eur. J. For. Res. 2004, 123, 45–51. [Google Scholar] [CrossRef]
  85. Pretzsch, H. Re-Evaluation of Allometry: State-of-the-Art and Perspective Regarding Individuals and Stands of Woody Plants. In Progress in Botany 71; Springer: Berlin/Heidelberg, Germany, 2010; pp. 339–369. [Google Scholar]
  86. Pretzsch, H.; Dieler, J. Evidence of variant intra-and interspecific scaling of tree crown structure and relevance for allometric theory. Oecologia 2012, 169, 637–649. [Google Scholar] [CrossRef] [Green Version]
  87. Franceschini, T.; Schneider, R. Influence of shade tolerance and development stage on the allometry of ten temperate tree species. Oecologia 2014, 176, 739–749. [Google Scholar] [CrossRef]
  88. Blanchard, E.; Birnbaum, P.; Ibanez, T.; Boutreux, T.; Antin, C.; Ploton, P.; Vincent, G.; Pouteau, R.; Vandrot, H.; Hequet, V.; et al. Contrasted allometries between stem diameter, crown area, and tree height in five tropical biogeographic areas. Trees 2016, 30, 1953–1968. [Google Scholar] [CrossRef]
  89. Russo, S.E.; Wiser, S.K.; Coomes, D.A. Growth–size scaling relationships of woody plant species differ from predictions of the Metabolic Ecology Model. Ecol. Lett. 2007, 10, 889–901. [Google Scholar] [CrossRef]
  90. Watt, M.S.; Kirschbaum, M.U. Moving beyond simple linear allometric relationships between tree height and diameter. Ecol. Model. 2011, 222, 3910–3916. [Google Scholar] [CrossRef]
  91. Bragg, D.C. Potential relative increment (PRI): A new method to empirically derive optimal tree diameter growth. Ecol. Model. 2001, 137, 77–92. [Google Scholar] [CrossRef]
  92. King, D.A. Linking tree form, allocation and growth with an allometrically explicit model. Ecol. Model. 2005, 185, 77–91. [Google Scholar] [CrossRef]
  93. Pommerening, A.; Muszta, A. Methods of modelling relative growth rate. For. Ecosyst. 2015, 2, 5. [Google Scholar] [CrossRef] [Green Version]
  94. Klingenberg, C.P. Multivariate Allometry. In Advances in Morphometrics; Marcus, L.F., Corti, M., Loy, A., Naylor, G.J.P., Slice, D.E., Eds.; Plenum: New York, NY, USA, 1996; pp. 23–49. [Google Scholar]
  95. Vospernik, S.; Monserud, R.A.; Sterba, H. Do individual-tree growth models correctly represent height: diameter ratios of Norway spruce and Scots pine? For. Ecol. Manag. 2010, 260, 1735–1753. [Google Scholar] [CrossRef] [PubMed] [Green Version]
  96. Pretzsch, H.; Dauber, E.; Biber, P. Species-specific and ontogeny-related stem allometry of European forest trees: evidence from extensive stem analyses. For. Sci. 2013, 59, 290–302. [Google Scholar] [CrossRef]
  97. Ryan, M.G.; Yoder, B.J. Hydraulic limits to tree height and tree growth. Bioscience 1997, 47, 235–242. [Google Scholar] [CrossRef] [Green Version]
  98. Weiner, J. Allocation, plasticity and allometry in plants. Perspectives in Plant Ecology. Evol. Syst. 2004, 6, 207–215. [Google Scholar]
  99. Bonser, S.P.; Aarssen, L.W. Plastic allometry in young sugar maple (Acer saccharum): adaptive responses to light availability. Am. J. Bot. 1994, 81, 400–406. [Google Scholar] [CrossRef]
  100. Martínez-Vilalta, J.; Vanderklein, D.; Mencuccini, M. Tree height and age-related decline in growth in Scots pine (Pinus sylvestris L.). Oecologia 2007, 150, 529–544. [Google Scholar] [CrossRef]
  101. Botero, C.A.; Weissing, F.J.; Wright, J.; Rubenstein, D.R. Evolutionary tipping points in the capacity to adapt to environmental change. Proc. Natl. Acad. Sci. USA 2015, 112, 184–189. [Google Scholar] [CrossRef] [Green Version]
  102. Cañellas, I.; Río, M.; Roig, S.; Montero, G. Growth response to thinning in Quercus pyrenaica Willd. coppice stands in Spanish central mountain. Ann. For. Sci. 2004, 61, 243–250. [Google Scholar] [CrossRef] [Green Version]
  103. Jiang, L.; Ye, M.; Zhu, S.; Zhai, Y.; Xu, M.; Huang, M.; Wu, R. Computational identification of genes modulating stem height-diameter allometry. Plant Biotechnol. J. 2016, 14, 2254–2264. [Google Scholar] [CrossRef] [PubMed]
Figure 1. Height–diameter relationship performance for different thinning treatments. (a) T0 treatment (unthinned control plot), (b) T1 treatment (lightly thinned), (c) T2 treatment (moderately thinned), and (d) T3 treatment (heavily thinned).
Forests 10 01129 g001
Figure 2. Estimated degrees of freedom with smooth spline functions on the observed height–diameter allometric coefficient (mh,d) for different thinning treatments. (a) T0 treatment (unthinned control plot), (b) T1 treatment (lightly thinned), (c) T2 treatment (moderately thinned), and (d) T3 treatment (heavily thinned).
Forests 10 01129 g002
Figure 3. Visualization of height–diameter allometric coefficient (mh,d) fit with time and thinning interactions.
Forests 10 01129 g003
Table 1. Average diameter and height data of sample trees from different thinning treatments.
TreatmentStand Density (Stems/ha)Number of Sample TreesDBHH
2007b2007a20162007b2007a2016
T0140022417.317.325.212.212.216.0
T1137511717.518.329.112.312.717.5
T214257117.218.531.412.212.918.1
T313254917.719.934.112.513.419.1
Legend: T0, unthinned; T1, lightly thinned; T2, moderately thinned; T3, heavily thinned; DBH, mean diameter at breast height (cm); H, average total tree height (m); b, before thinning; a, after thinning for the residual stand. Stand density represents the number of trees per hectare before thinning. The number of sample trees represents the number of trees in the fixed subplots after thinning.
Table 2. Models used to explore the relationship of height–diameter allometry.
ModelFunctionReferences
Gompertz H = α exp ( β exp ( γ D ) Winsor, 1932 [63]
Logistic H = α / ( 1 + β exp ( γ D ) Pearl and Reed, 1920 [64]
Power H = α D β Huxley, 1932 [65]
Richards H = 1.3 + α ( 1 exp ( β D ) ) γ Richards, 1959 [66]
Wykoff H = 1.3 + exp ( α + β / ( 1 + D ) ) Wykoff et al., 1982 [67]
Legend: H, total tree height (m); D, diameter at breast height (cm); α, β, and γ, parameters to be estimated; exp, the exponential function. 1.3 is a constant used to account for the fact that D is measured at 1.3 m above the ground.
Table 3. Fitting results of height–diameter allometry relationship models.
ModelαβγAICRSER2
Gompertz21.9491.9900.07311,764.9520.8630.896
Logistic21.4904.1860.10712,329.0210.9180.879
Power2.1860.612-10,960.6530.7910.906
Richards32.9660.0190.85111,055.0190.8010.903
Wykoff3.258−15.083-12,082.3960.8930.892
Legend: AIC, Akaike information criterion; RSE, residual standard error; R2, coefficient of determination. α, β, and γ are model parameters.
Table 4. Parameter estimates of dummy variable models for height–diameter allometry relationship.
ParametersEstimateStandard Error95% Confidence Interval
Lower LimitUpper Limit
α01.8300.0361.7601.899
β00.6650.0060.6530.677
α1−0.0110.057−0.1230.101
α20.1620.0620.0400.284
α30.0090.064−0.1170.135
β10.0060.010−0.0140.025
β2−0.0290.010−0.049−0.009
β3−0.0070.011−0.0280.014
Table 5. F-test results from dummy variable models of height–diameter allometry relationship.
EquationRSSDFCalculated F ValueCritical F Valuep
(1)3673.684625---
(2)3591.624622F2−1 = 35.292.61<0.05
(3)3582.384619F3−2 = 4.022.61<0.05
Legend: RSS, residual sum of squares; DF, degrees of freedom. F2−1 and F3−2 represent F values calculated based on Equation (2) and Equation (1), and Equation (3) and Equation (2), respectively. p values for the F-tests in which values were less than 0.05 were considered significant.

