Article

Screening and Evaluation of Stable Reference Genes for Quantitative Real-Time Polymerase Chain Reaction (qRT-PCR) Analysis in Chinese Fir Roots under Water, Phosphorus, and Nitrogen Stresses

1
Forestry College, Fujian Agriculture and Forestry University, Fuzhou 350002, China
2
Southern Swedish Forest Research Center, Faculty of Forest Science, Swedish University of Agricultural Sciences, P.O. Box 49, SE-230 53 Alnarp, Sweden
3
Fujian Provincial Colleges and University Engineering Research Center of Plantation Sustainable Management, Fuzhou 350002, China
*
Author to whom correspondence should be addressed.
Forests 2019, 10(12), 1087; https://doi.org/10.3390/f10121087
Submission received: 22 October 2019 / Revised: 20 November 2019 / Accepted: 27 November 2019 / Published: 1 December 2019
(This article belongs to the Section Forest Ecophysiology and Biology)

Abstract

:
Chinese fir (Cunninghamia lanceolata) is an economical important timber species widely planted in southeastern Asia. Decline in yield and productivity during successive rotation is believed to be linked with abiotic stress, such as drought stress and nitrogen (N) and phosphorus (P) starvation. Molecular breeding could be an option to develop tolerant genotypes. For gene expression studies using quantitative real-time reverse transcription-polymerase chain reaction (qRT-PCR), stable reference genes are needed for normalization of gene expression under different experimental conditions. However, there is no internal reference genes identified for Chinese fir under abiotic stresses. Thus, nine internal reference genes based on transcriptome data were selected and analyzed in the root of Chinese fir under drought stress and N and P starvation. Data were analyzed using geNorm, NormFinder, and BestKeeper, to screen and identify the best reference genes. The results showed that the UBQ and GAPDH genes were the two most stable genes under drought stress and the Actin1 and GAPDH were the two most stable genes under P starvation. Further, it was discovered that the Actin1 and UBC were the two most stable genes under N starvation among nine candidate reference genes. The gene expression of drought stress induced expression protein 14-3-3-4, the P transporter gene ClPht1;3, and the nitrate transporter gene NRT1.1 were used to verify the stability of the selected reference genes under drought stress and P and N starvation, respectively, and the results revealed that the screened reference genes were sufficient to normalize expression of the target genes. In conclusion, the results demonstrate that the stability of reference genes was closely related to the external conditions and reference genes applied to the roots of Chinese fir under different abiotic stress treatments were different. Our data will facilitate further studies on stress ecology and gene function analysis in Chinese fir.

1. Introduction

Chinese fir (Cunninghamia lanceolata (Lamb.) Hook.) is an evergreen conifer, which has been widely planted for timber in southeastern Asia for more than 1000 years [1]. It is the most commercially important afforestation tree species in southern China with fast growth [2], high yield, and good material quality and pest resistance [3,4]. Because of its fast-growing characteristics, Chinese fir has a high nutrient requirement for its optimal growth, especially nitrogen and phosphorus, which are scarce in forest soils in southern China [5,6]. Furthermore, successive rotation of Chinese fir plantations amplifies the lack of available N and P in forest soil due to clear-cutting and subsequent burning practice [7]. It had been found that the yield of Chinese fir plantation decreased by 5–15% with successive planting in recent years and the N and P deficiency was the most important factor limiting growth of the species. Thus, application of N and P fertilizers has been commonly used in Chinese fir plantations, which is costly for tree growers and causing serious issues of soil and water pollution. In addition, the extremely harsh weather conditions typical of southern China coupled with seasonal droughts due to global climate change seriously affect the survival of seedlings at the beginning of reforestation [8]. Most previous studies on Chinese fir focused on morphological and physiological adaptation mechanisms to nutrient stress including root morphological plasticity [9], root secretion of organic acids [10], formation of cortical aerenchyma [11], and physiological plasticity and biochemical changes [12]. However, studies on gene expression and molecular biology in Chinese fir are scarce. Thus, it is essential to understand the mechanisms underlying the response of Chinese fir to abiotic stresses using gene expression analysis in order to develop stress tolerant genotypes.
Transcriptome analysis is mainly used to detect the gene expression profiles and quantitative real-time reverse transcription-polymerase chain reaction (qRT-PCR) is a stable method with the advantages of high precision, accuracy, and specificity for detecting target gene expression [13]. It has become one of the most powerful tools used in molecular biology research [14]. However, the results of qRT-PCR are easily prone to interference with experimental errors such as RNA quality, sample loading, and reverse transcription efficiency. Therefore, it requires internal reference genes to correct these experimental errors between samples [15]. The ideal reference genes are thought to be equally expressed in different samples, developmental stages, and hence they can be used to measure the expressions of the target genes [16]. The accuracy and reliability of qRT-PCR results is greatly dependent on a suitable reference gene to normalize gene expression and avoid errors caused by different experimental procedure [17,18]. The more stable the expression of the internal reference gene is, the better the accuracy of expression level of the target gene will be [18]. Usually, housekeeping genes like Actin, EF1a (elongation factor 1-a), GAPDH (glyceraldehyde-3-phosphate dehydrogenase), 18S rRNA (18S ribosomal RNA) etc. are used as reference genes [19,20] but previous studies have reported that the stability of expression of these reference genes is relative, and the stability of expression of housekeeping genes varies considerably in different plant species, different tissues, and different experimental conditions [15,21]. Particularly in some non-model plant species, like Chinese fir, for which there is a lack of genome sequence and poor genetic background information, the reference genes are usually used by the orthologous sequence of common housekeeping genes reported in model plant species [22], which is the probable case of deviation of the accuracy in qRT-PCR experiment [23,24]. Therefore, it is important to screen and evaluate the stability of reference gene expression according to experimental conditions to improve the accuracy of qRT-PCR analyses [25,26,27].
Due to the importance of reference gene selection, there are an increasing number of attempts to identify reference genes in different experimental conditions. Nicot et al. [28] analyzed the expression stability of seven housekeeping genes of Actin, APRT (Adeninephosphorribosyltransferase), 18S rRNA, EF1a, TUB (Tubulin), CYP (cytochrome), and Ribosomal protein L2 under biological stress (late blight) and abiotic stress (salt, drought) in potato, and found variation in the expression level of target gene hsp20.2 according to the standard of reference genes with different stability. Hong et al. [29] analyzed the expression stability of nine reference genes in 21 tissues and organs at different developmental stages under abiotic stresses (drought, salt, cold, heat) and hormone conditions in Brachpodium distachyon, and reported that UBC18 (ubiquitin-conjugating enzyme) was the most stable expression in all samples, and the expression stability of UBQ4 (ubiquitin) and UBQ10 were the best in different tissues, organs and developmental stages, and SamDC was the most stable gene in environmental stress samples. Additionally, reference gene validation has been done in many plant species, such as Gossypium barbadense [30], Saccharum officinarum [31], Lycopersicon esculentum [32], Vitis viniferag [33], Glycine max [34], Musa acuminata [35], Oryza sativa [36], Linum usitatissimum [37], Kosteletzkya virginica [20], Sesamum indicum [38], and Populus euphratica [39]. However, few studies have been conducted on the selection and expression stability of reference genes in Chinese fir, such as selection of reference genes under cold, high temperature, abscisic acid (ABA), polyethylene glycol (PEG), and sodium chloride (NaCl), and the selected reference was different for different experimental conditions [40,41].
Gene expression studies on forest trees have become important to unravel the adaptation mechanisms to environmental conditions at molecular level. Drought stress and N and P starvation are key problems of forest tree growth in general and Chinese fir cultivation in particular, and the molecular research to address these problems depends on a prerequisite of screening and evaluation of the stability of reference gene for normalization of qRT-PCR gene expression analysis. Based on the transcriptome data of Chinese fir roots under drought stress and P and N starvation, we have chosen nine candidate reference genes including GAPDH, UBQ, 18S rRNA, 28S rRNA, EF1a, UBC, Actin1, elF-3, and CYP and examined the expression stability. Data were analyzed using geNorm, NormFinder, and BestKeeper for comprehensive and accurate determination of the most stability genes out of the nine reference genes under drought stress and N and P starvation in the root of Chinese fir seedlings [40]. To validate our results, the most stable and unstable genes were used to standardize the expression levels of 14-3-3-4, ClPht1;3 and NRT 1.1 genes that are related to drought stress and N and P starvation on different experimental conditions. Our results provide a basis for normalization of gene expression in other coniferous species, such as Douglas fir.

2. Materials and Methods

2.1. Plant Material and Experimental Setup

One year old seedlings of Chinese fir clone Yang 061 were bought from Yangkou State-owned forest farm in Fujian Province, China and cultivated in the greenhouse in Fujian Agriculture and Forestry University. The seedlings were cultivated in polyethylene pots with a volume of 1 L filled with cleaned sand and supplied with a modified (one-third content) Hoagland solution for two weeks. The solution contained 1 mmol/L KH2PO4, 5 mmol/L KNO3, 2 mmol/L MgSO4-7H2O, 5 mmol/L Ca(NO3)2-H2O, 1 mmol/L Na2-EDTA, 0.001 mmol/L FeSO4-7H2O, and micro nutrients including 0.463 mmol/L H3BO3, 0.003 mmol/L CuSO4-5H2O, 0.007 mmol/L ZnSO4-7H2O, 0.091 mmol/L MnCl2-4H2O, 0.005 mmol/L H8MoN2O4, and the pH of the nutrient solution was adjusted to 5.6. After two weeks of growth, the seedlings were transferred to another pot filled with thoroughly cleaned sand to make sure that traces of N and P were negligible. The concentration gradient of nutrient solution in P starvation treatment was as follows: 0, 0.5, and 1.0 mmol/L KH2PO4, representing P-starved, low P supply and normal P supply, respectively, and the roots were harvested after 0, 1, 3, 7, and 15 days post-treatment. The N treatment included different nitrogen sources and concentrations of nitrogen. As N sources, 1 mmol/L (NH4)2SO4, 2 mmol/L KNO3, and 1 mmol/L NH4NO3 were used to represent NH4+, NO3, and mixed nitrogen sources, respectively. The concentration gradient of nutrient solution in N starvation test was as follows: 0, 0.5, and 1.0 mmol/L NH4NO3, representing N-starved, low N supply and normal N supply, and the roots were harvested after 0, 1, 3, 7, 15, and 25 days post-treatment. The gradient of drought stress was established by adding 0%, 10%, and 15% PEG6000, representing non-stress, moderately stress and severely stress condition, to one-third content of modified Hoagland solution, and the roots were harvest after 12, 24, and 48 h post-treatment. The fine roots of all samples were harvested, washed and surface dried and then immediately frozen in liquid nitrogen and stored at −80 °C until analysis. All experimental treatments had three biological replicates.

2.2. RNA Isolation and cDNA Synthesis

Total RNAs were extracted from Chinese fir roots using the RNA purification reagent (TIANGEN, Beijing, China). The frozen specimens were ground in liquid nitrogen to a fine powder with a pestle and mortar, and the powder was completely dissolved in the plant lysate, following the manufacturer’s protocol. The integrity of obtained RNA samples was examined by 1% agarose gel electrophoresis. The concentration and purity of total RNA was examined using an ultramicro spectrophotometer (Eppendorf, Hamburg, Germany). The A260/A280 ratio of RNA between 1.8 and 2.0 was considered to be the required quality for further experiments. Complementary DNA (cDNA) was synthesized using the GoScriptTM Reverse Transcription System Kit (Promega, Madison, WI, USA), following the manufacturer’s protocol. The reverse transcription system was based on 2 µg of total RNA in a 20 µL reaction volume. The resulting cDNAs were diluted to 100 ng/μL with nuclease-free water and stored at −20 °C.

2.3. Selection of Candidate Reference Genes

Based on the transcriptome data of Chinese fir, the commonly used internal reference genes were selected as the candidate internal reference genes for this experiment. They were GAPDH, UBQ, 18S rRNA, 28S rRNA, EF1a, UBC, Actin1, elF-3, and CYP (Table 1). According to the sequence of each gene, fluorescent quantitative PCR primers were designed using MEGA6.0. The primer sequence was synthesized by Qingke Bioengineering (Fuzhou, China) Co., Ltd. A five-fold cDNA dilution series with three replicates per concentration was used to make standard curves for estimation of amplification efficiency (E) and the correlation coefficient (R2).
E = ( 10 1 s l o p e 1 ) × 100 %

2.4. Quantitative Real-Time PCR (qRT-PCR)

Real-time fluorescence quantitative PCR was performed on the Thermo Fisher’s StepOnePlus real-time fluorescence quantitative PCR instrument. Promega’sGoTagqPCR Master Mix kit was used for PCR. The reaction system was 20 µL, including: 10 µL 2 × qPCR Master Mix, 0.4 µL upstream primer (10 µM), 0.4 µL downstream primer (10 µM), 1 µL DNA, 0.2 µL ROX reference dye (containing SYBR), and 8 µL ddH2O. The procedure of PCR reaction was as follows: 95 °C for 5 min, 40 cycles of 95 °C for 15 s, and 60 °C for 1 min, 95 °C for 15 s, 60 °C for 15 s, temperature gradually increased to 95 °C. Each reaction had three biological replicates and three technical replicates (i.e., each biological replicate was analyzed three times).

2.5. Validation of the Candidate Reference Genes

In order to verify the results of our experiments, the most stable reference genes were selected to validate the expression of the 14-3-3-4, ClPht1;3, and NRT1.1 genes in drought stress, P, and N starvation, respectively. The time and degree of experimental treatment were consistent with the three stress treatments mentioned above. The gene 14-3-3-4 belongs to 14-3-3 family, which binds to signal molecules to regulate plant response to drought stress [42]. The gene ClPht1;3 belongs to PHT1 family, which is the key transporter for uptake and transport of inorganic phosphorus from soil solution to the cell membranes of root. Moreover, the gene NRT1.1 belongs to NPF family and functions as NO3 transporter, and also was the substrates of polypeptides, amino acids, sugar ligands, and plant hormones [43].

2.6. Data Analysis

Quantitative real-time PCR was performed and analyzed using GoTagqPCR Master Mix (Promega) and a StepOnePlus™ real-time PCR instrument (Corbett Research, Australia). The expression stability of the nine candidate reference genes under different conditions were analyzed by geNorm, NormFinder, and BestKeeper, the most commonly used statistical procedures for screening reference genes. Expression levels of each reference gene were shown by Ct values. Before applying the geNorm and NormFinder analyses, the raw Ct values, weighted by amplification efficiency (Table 1), were used to calculate relative quantities by the equation:
Q = E Δ C t
where E is the amplification efficiency and ΔCt is the difference between the sample with the lowest Ct (highest expression) from the data set and the Ct value of the sample in question.
The geNorm analysis compares the stability of the candidate gene by calculating the average stability index, M, of the candidate gene. The stability boundary is usually set at M value equal to 1.5 and if the M value is lower than 1.5, the stability of the candidate gene will be higher. According to this principle, the geNorm analysis will step-wisely exclude the least stable gene and be repeated until only two genes remain. The lower the M value is the more stable gene expression will be [44,45,46]. NormFinder was used to evaluate the expression stability of the candidate reference genes on the experimental samples. Raw Ct values were first index-transformed and used as input for the NormFinder. This algorithm takes into account the intra- and inter-group variations for normalization factors (NFs), which requires input data from a minimum of three candidate reference genes and a minimum of two tested samples per group. The calculated results of this analysis were not influenced by random co-regulated genes and the best candidate reference gene displayed lower stability values that were close to zero. The more stable reference gene will have lower stability value and inter- and intra-group variation. In our case, we calculated the intra group variations as there are no distinct groups. BestKeeper analysis was applied to rank the stability of candidate genes by calculating coefficient of variance (CV). The candidate reference genes are considered to be the most stably expressed genes when they present the lowest CV. The relative expression level of the target genes, ClPht1;3, NRT1.1, 14-3-3-4, in Chinese fir roots were calculated by 2−ΔΔCt method, which is applicable when the amplification efficiencies of the target and reference genes are approximately equal [47].

3. Results

3.1. Expression Levels of Candidate Reference Genes

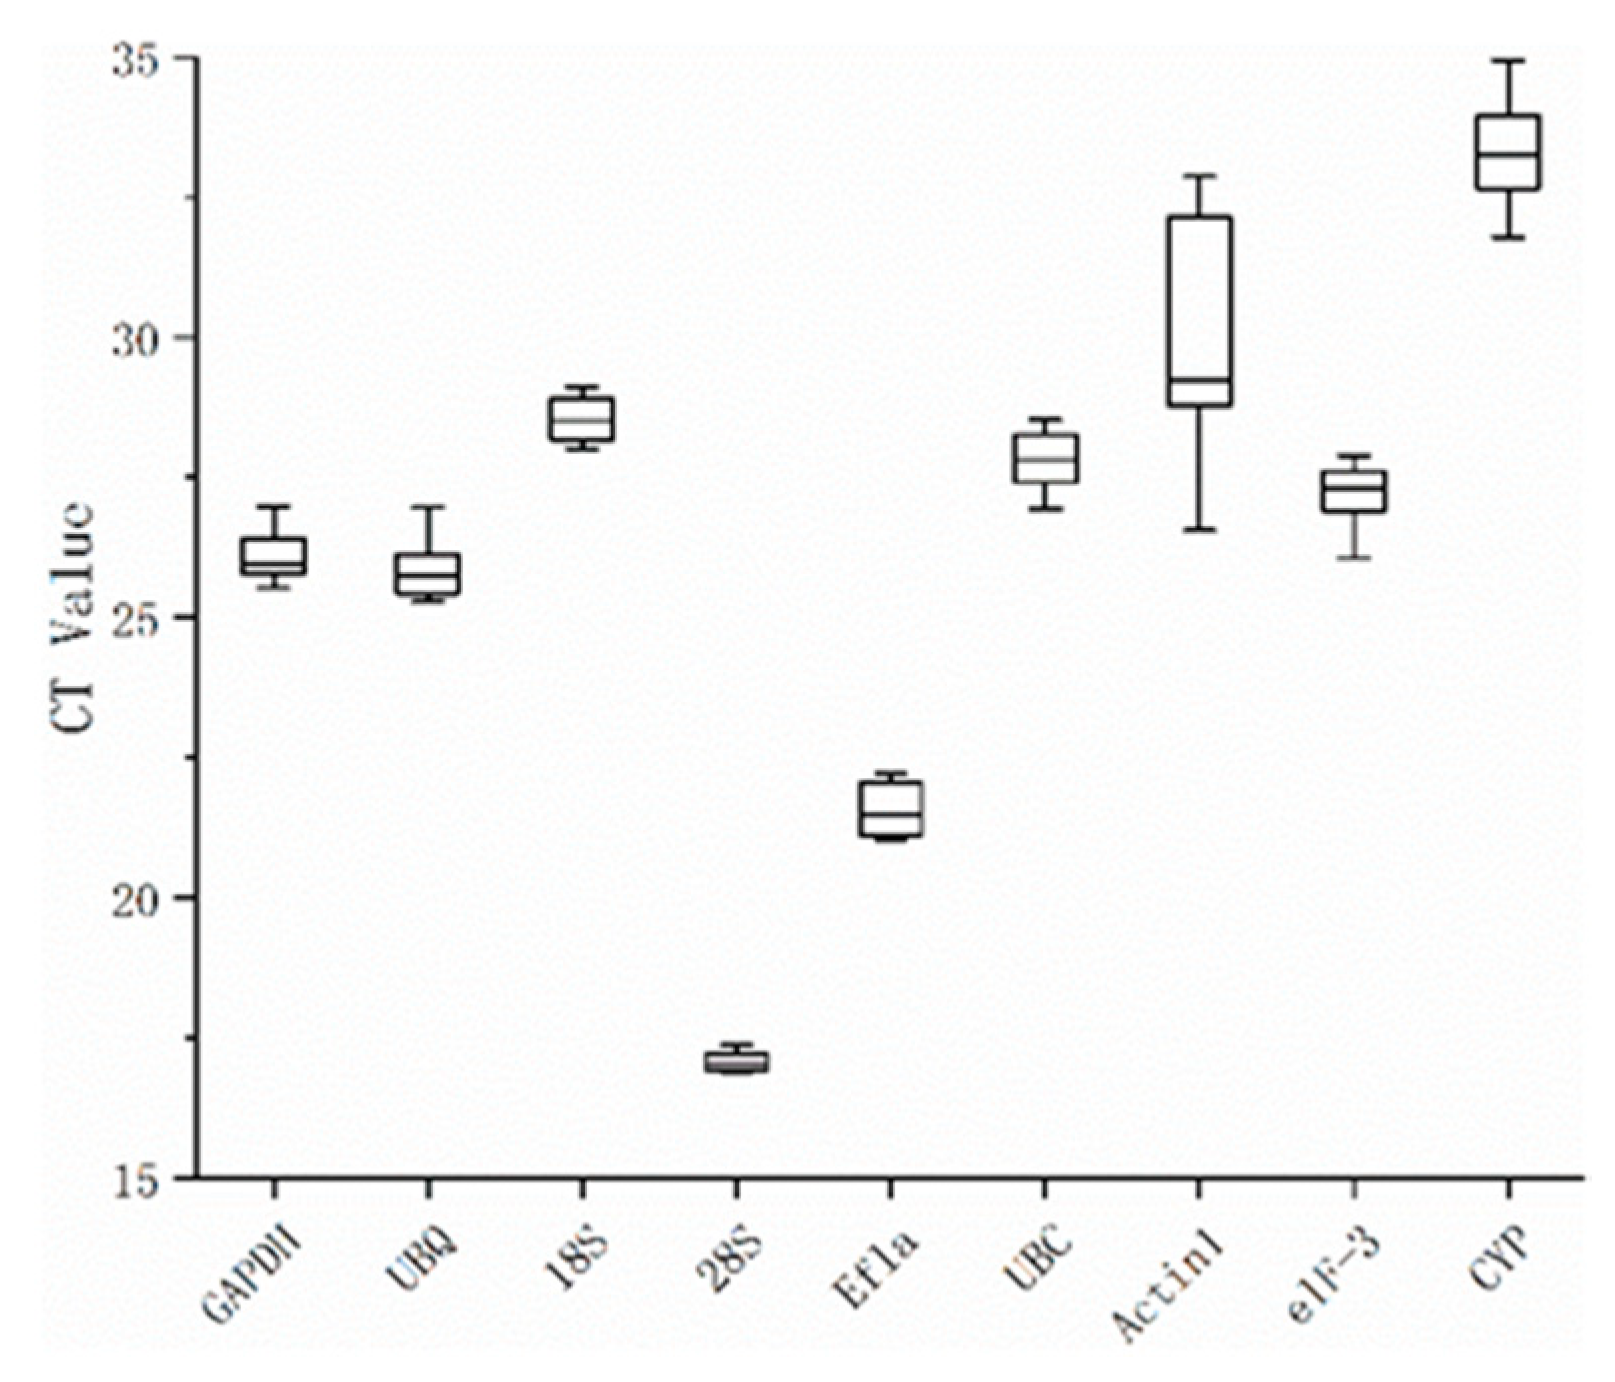
The expression levels (Ct values) of all nine reference genes are shown in Figure 1. The Ct values varied from 16.882 (28S rRNA) to 34.947 (CYP) across all samples, and mean Ct ranged from 25.757 (UBQ) to 29.517 (Actin1). Moreover, the expression levels of Actin1 were the most variable with 3.354 Ct, while 28S rRNA showed the least variable levels with 0.291 Ct. Considering the gene expression levels are negatively correlated with Ct values, the 28S rRNA had high expression level and CYP with low expression level.

3.2. Stability of Candidate Genes

3.2.1. Drought Stress Experiment

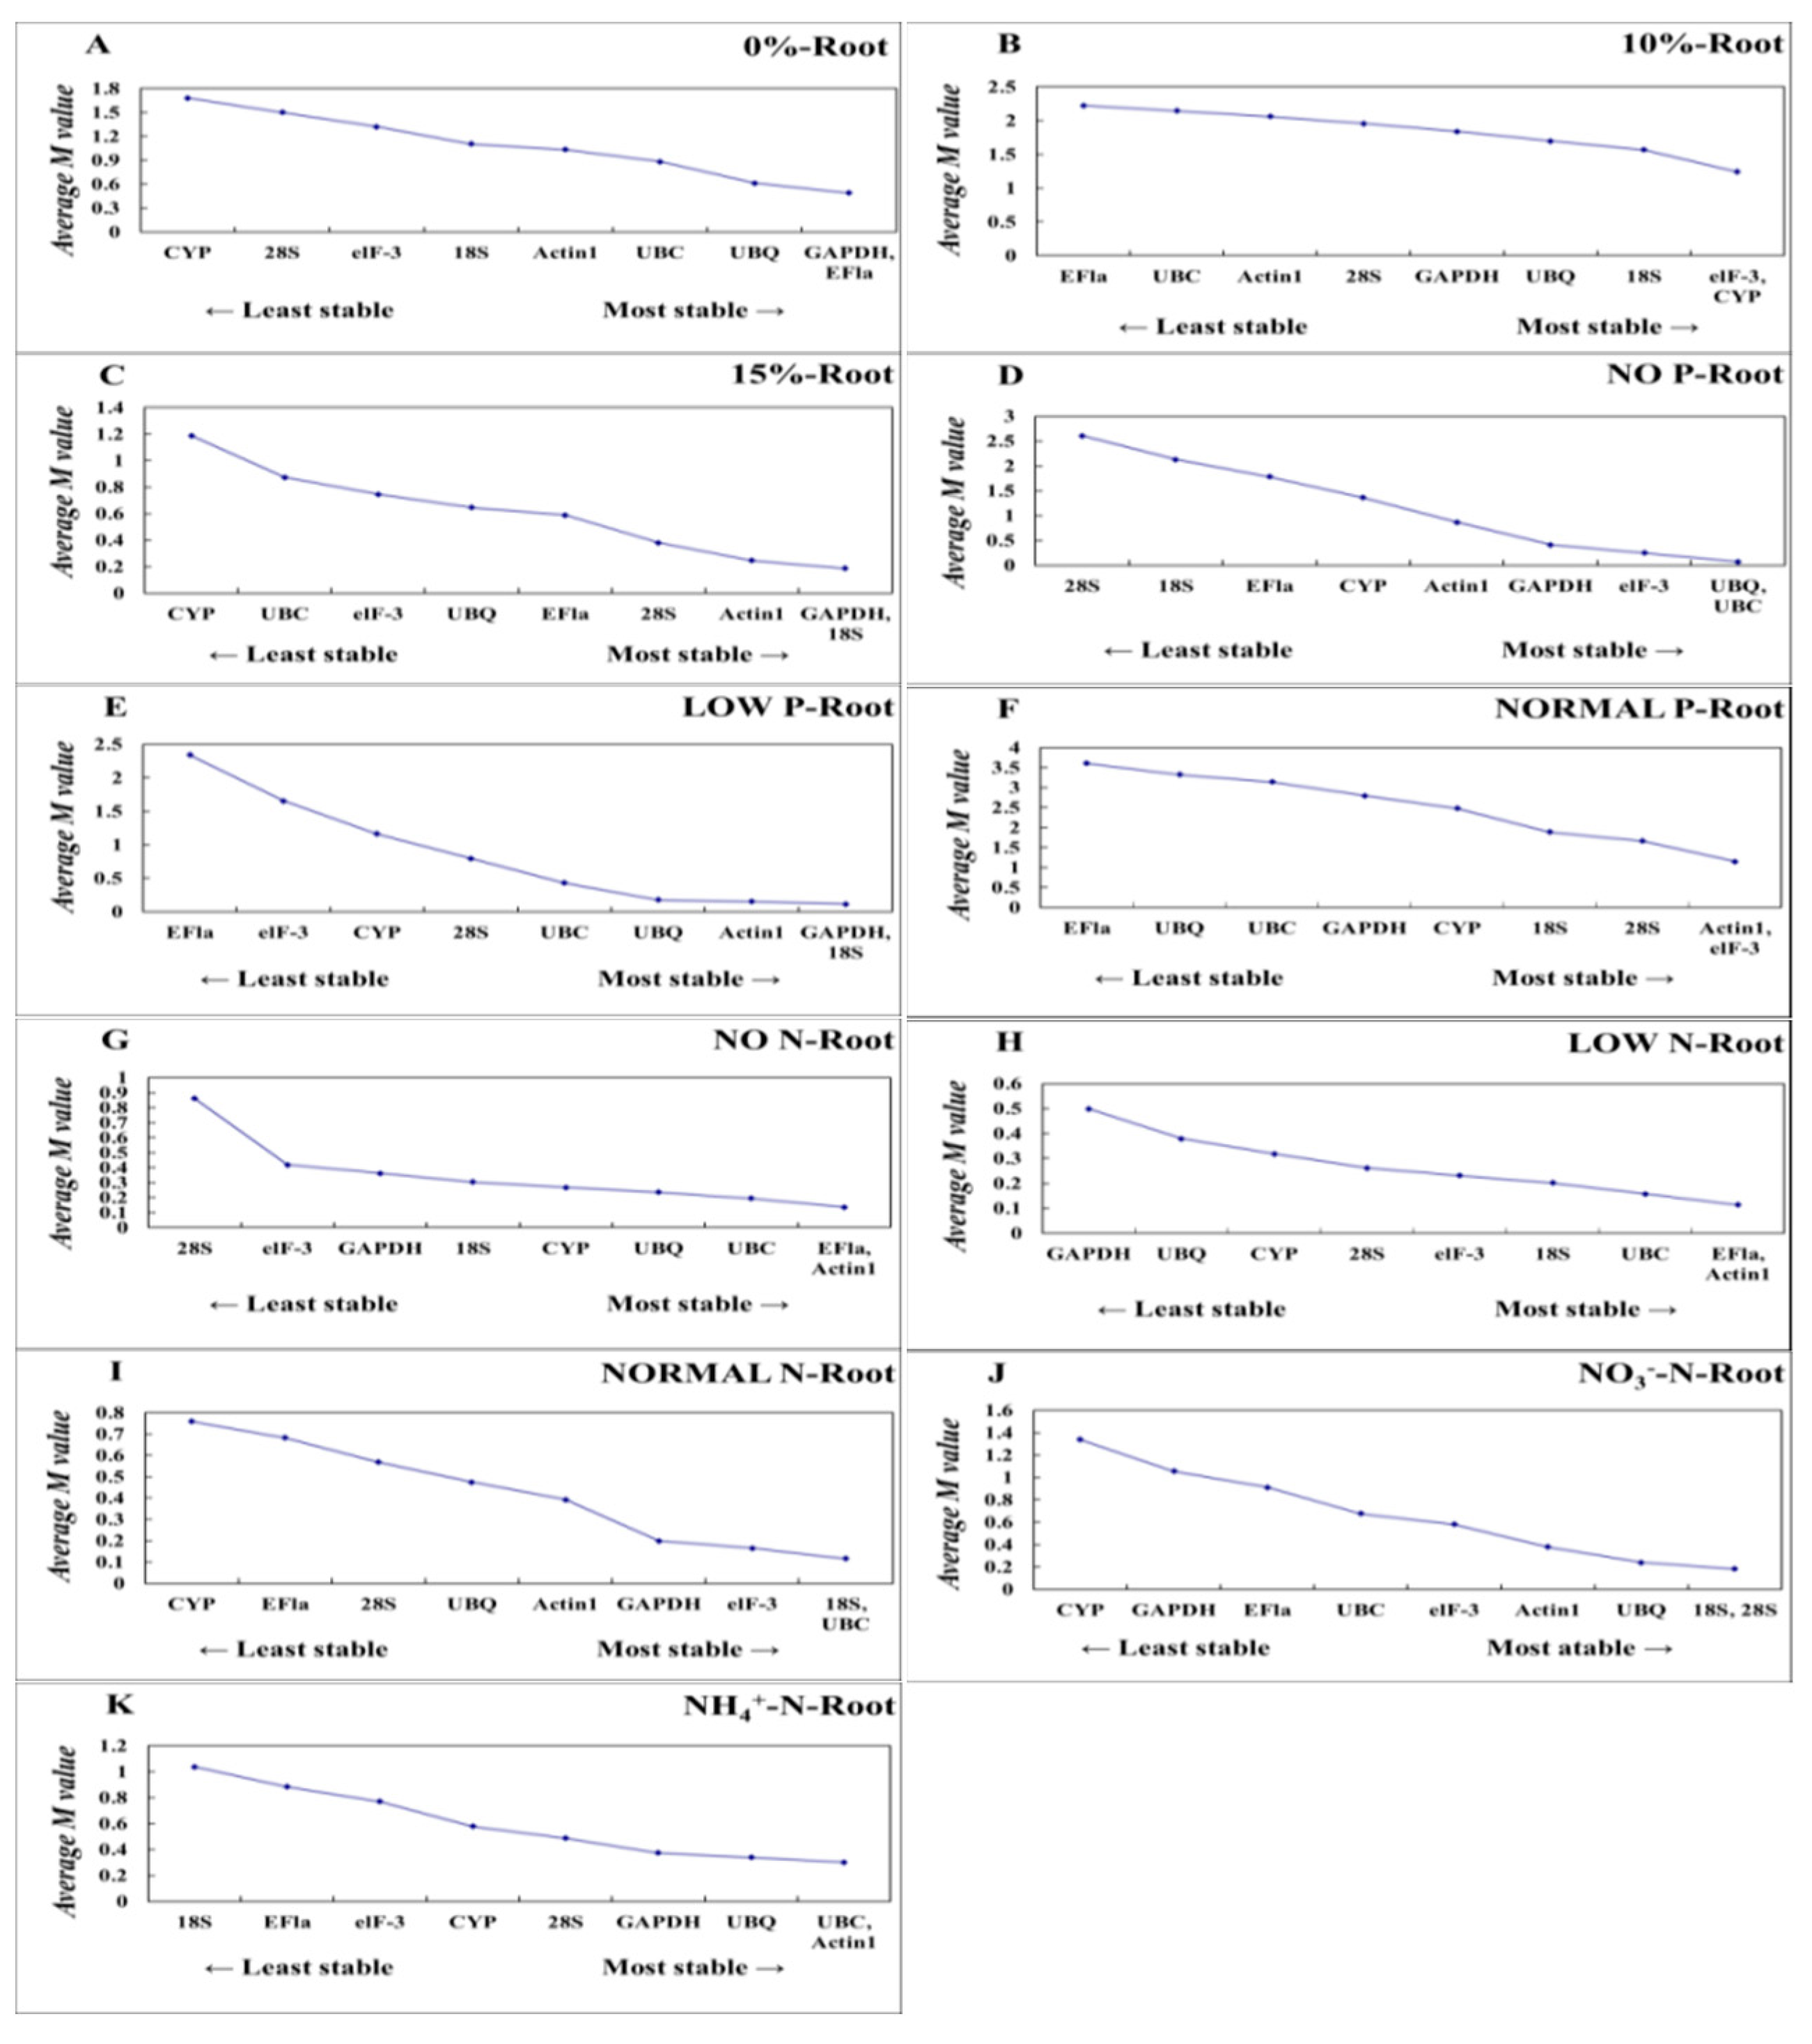
The geNorm analysis revealed that GAPDH and EF1a genes had lowest M values in non-stressed (0% PEG6000) root samples, whereas the CYP genes had highest M values in non-stressed roots (Figure 2A). In moderately stressed (10% PEG6000) root samples, elF-3 and CYP had the lowest M values, whereas the EF1a had the highest M value (Figure 2B). In severely stressed roots (15% PEG6000), GAPDH and 18S rRNA had the lowest M values, whereas the CYP gene had the highest M value (Figure 2C). Comprehensive analysis of M value of each gene under drought stress showed that GAPDH, 18S rRNA, and UBQ were the most stable reference genes, whereas the least stable gene was CYP.
The NormFinder also revealed differences in stability of expression of reference genes among drought stress treatments (Table 2). The best reference gene in non-stressed (0% PEG6000) and moderately stressed (10% PEG6000) condition was UBQ, whereas the least stable gene in both treatments was CYP. For severely water stressed roots (15% PEG6000), the best reference gene was 18S rRNA, whereas the least stable gene was CYP. Overall, UBQ and GAPDH were the most stable genes, and CYP and elF-3 were the least stable genes for the drought stress sample sets.
The BestKeeper analysis also identified differences in stability of reference gene expression among different drought treatments (Table 3). BestKeeper analysis based on CV values identified UBQ and GAPDH as the two most stable reference genes in non-water stressed (0% PEG6000) and severely stressed (15% PEG6000) roots, and UBQ and 18S rRNA as highly stable genes in moderately (10% PEG6000) water stressed roots, respectively (Table 3). The average expression level for drought stress sample sets revealed that UBQ and GAPDH were the best reference genes, and CYP and elF-3 were the least stable genes, which is similar to the results obtained using geNorm and NormFinder analysis.

3.2.2. P Starvation Experiment

In the P starvation experiment, UBQ and UBC genes had lowest M values in P-starved root samples while 28S rRNA, 18S rRNA, and EF1a had highest M value. GAPDH and 18S rRNA had the lowest M values in low P-stressed roots while EF1a and elF-3 had the highest M values. Actin1 and elF-3 had the lowest M value in P-replete root samples while EF1a and UBQ had the highest M values (Figure 2D–F). According to the M value of each gene in all samples under phosphorus stress, the most stable internal reference genes were Actin1, elF-3, and GAPDH. EF1a was the least stable gene.
According to the NormFinder analysis, the best reference gene was Actin1 in P-starved and low P supply roots, whereas 28S rRNA and EF1a genes were the least stable genes, respectively. In normal P supply root, the best reference gene was CYP, whereas the least stable gene was EF1a. Overall, Actin1 and GAPDH were the most stable genes, and EF1a and 28S rRNA were the least stable genes for the P starvation sample sets (Table 4). BestKeeper analysis also identified GAPDH as the best reference gene for P-starved and low P root, and Actin1 as highly stable genes in normal P supplied root (Table 5). As a whole, Actin1 and GAPDH were the most stable genes and EF1a and UBQ were the least stable genes for the P starvation sample sets.

3.2.3. N Starvation Experiment

In the N starvation experiment, the EF1a and Actin1 were the most stable genes in N-starved and low N supply root samples, whereas the 18S rRNA and UBC were the most stably expressed genes in roots supplied with normal N level based on their low M values (Figure 2G–I). The least stable genes were 28S rRNA, GAPDH, and CYP in N-starved roots, roots supplied with low and normal N levels, respectively. Comparison between N sources revealed that 18S rRNA and 28S rRNA genes were stable in NO3 stress samples (Figure 2J) and the UBC and Actin1 were the most stable genes in NH4+ stress samples (Figure 2K). The least stable genes were CYP and 18S rRNA in NO3 and NH4+ stress samples based on their high M values, respectively. According to the M value of each gene in all samples under nitrogen stress, the most stable internal reference genes were Actin1 and UBC, and CYP and EF1a were the most unstable genes.
NormFinder analysis revealed that Actin1 was the best reference gene in N-starved, normal N supplied, and NH4+ stressed roots, whereas the least stable gene in N-starved root was 28S rRNA and 18S rRNA in NH4+ stressed roots. The expression of CYP was the least stable in normal N and NO3 supplied root, whereas the best stable gene in NO3 supplied root was UBC. In low N supplied root, the best reference gene was UBC, whereas the least stable gene was GAPDH. Overall, UBC and Actin1 were the most stable genes and 28S rRNA and CYP were the least stable genes for the N starvation sample sets (Table 6). BestKeeper analysis also identified Actin1 as the most stable reference gene for low N-, normal N-, and NO3-N-treated root, and CYP as highly stable genes for N-starved and NH4+-N supplied roots (Table 7). As a whole, Actin1 and UBC were the most stable genes and 28S rRNA and EF1a were the least stable genes for N starvation sample sets. In most tested samples, geNorm analysis results were roughly the same as NormFinder and BestKeeper analyses, with slight variations in the ranking sequence of genes. In addition, regardless of the variations in ranking, these analyses identified the same most stably expressed gene in all experimental samples.

3.3. Validation of Stability of Reference Genes

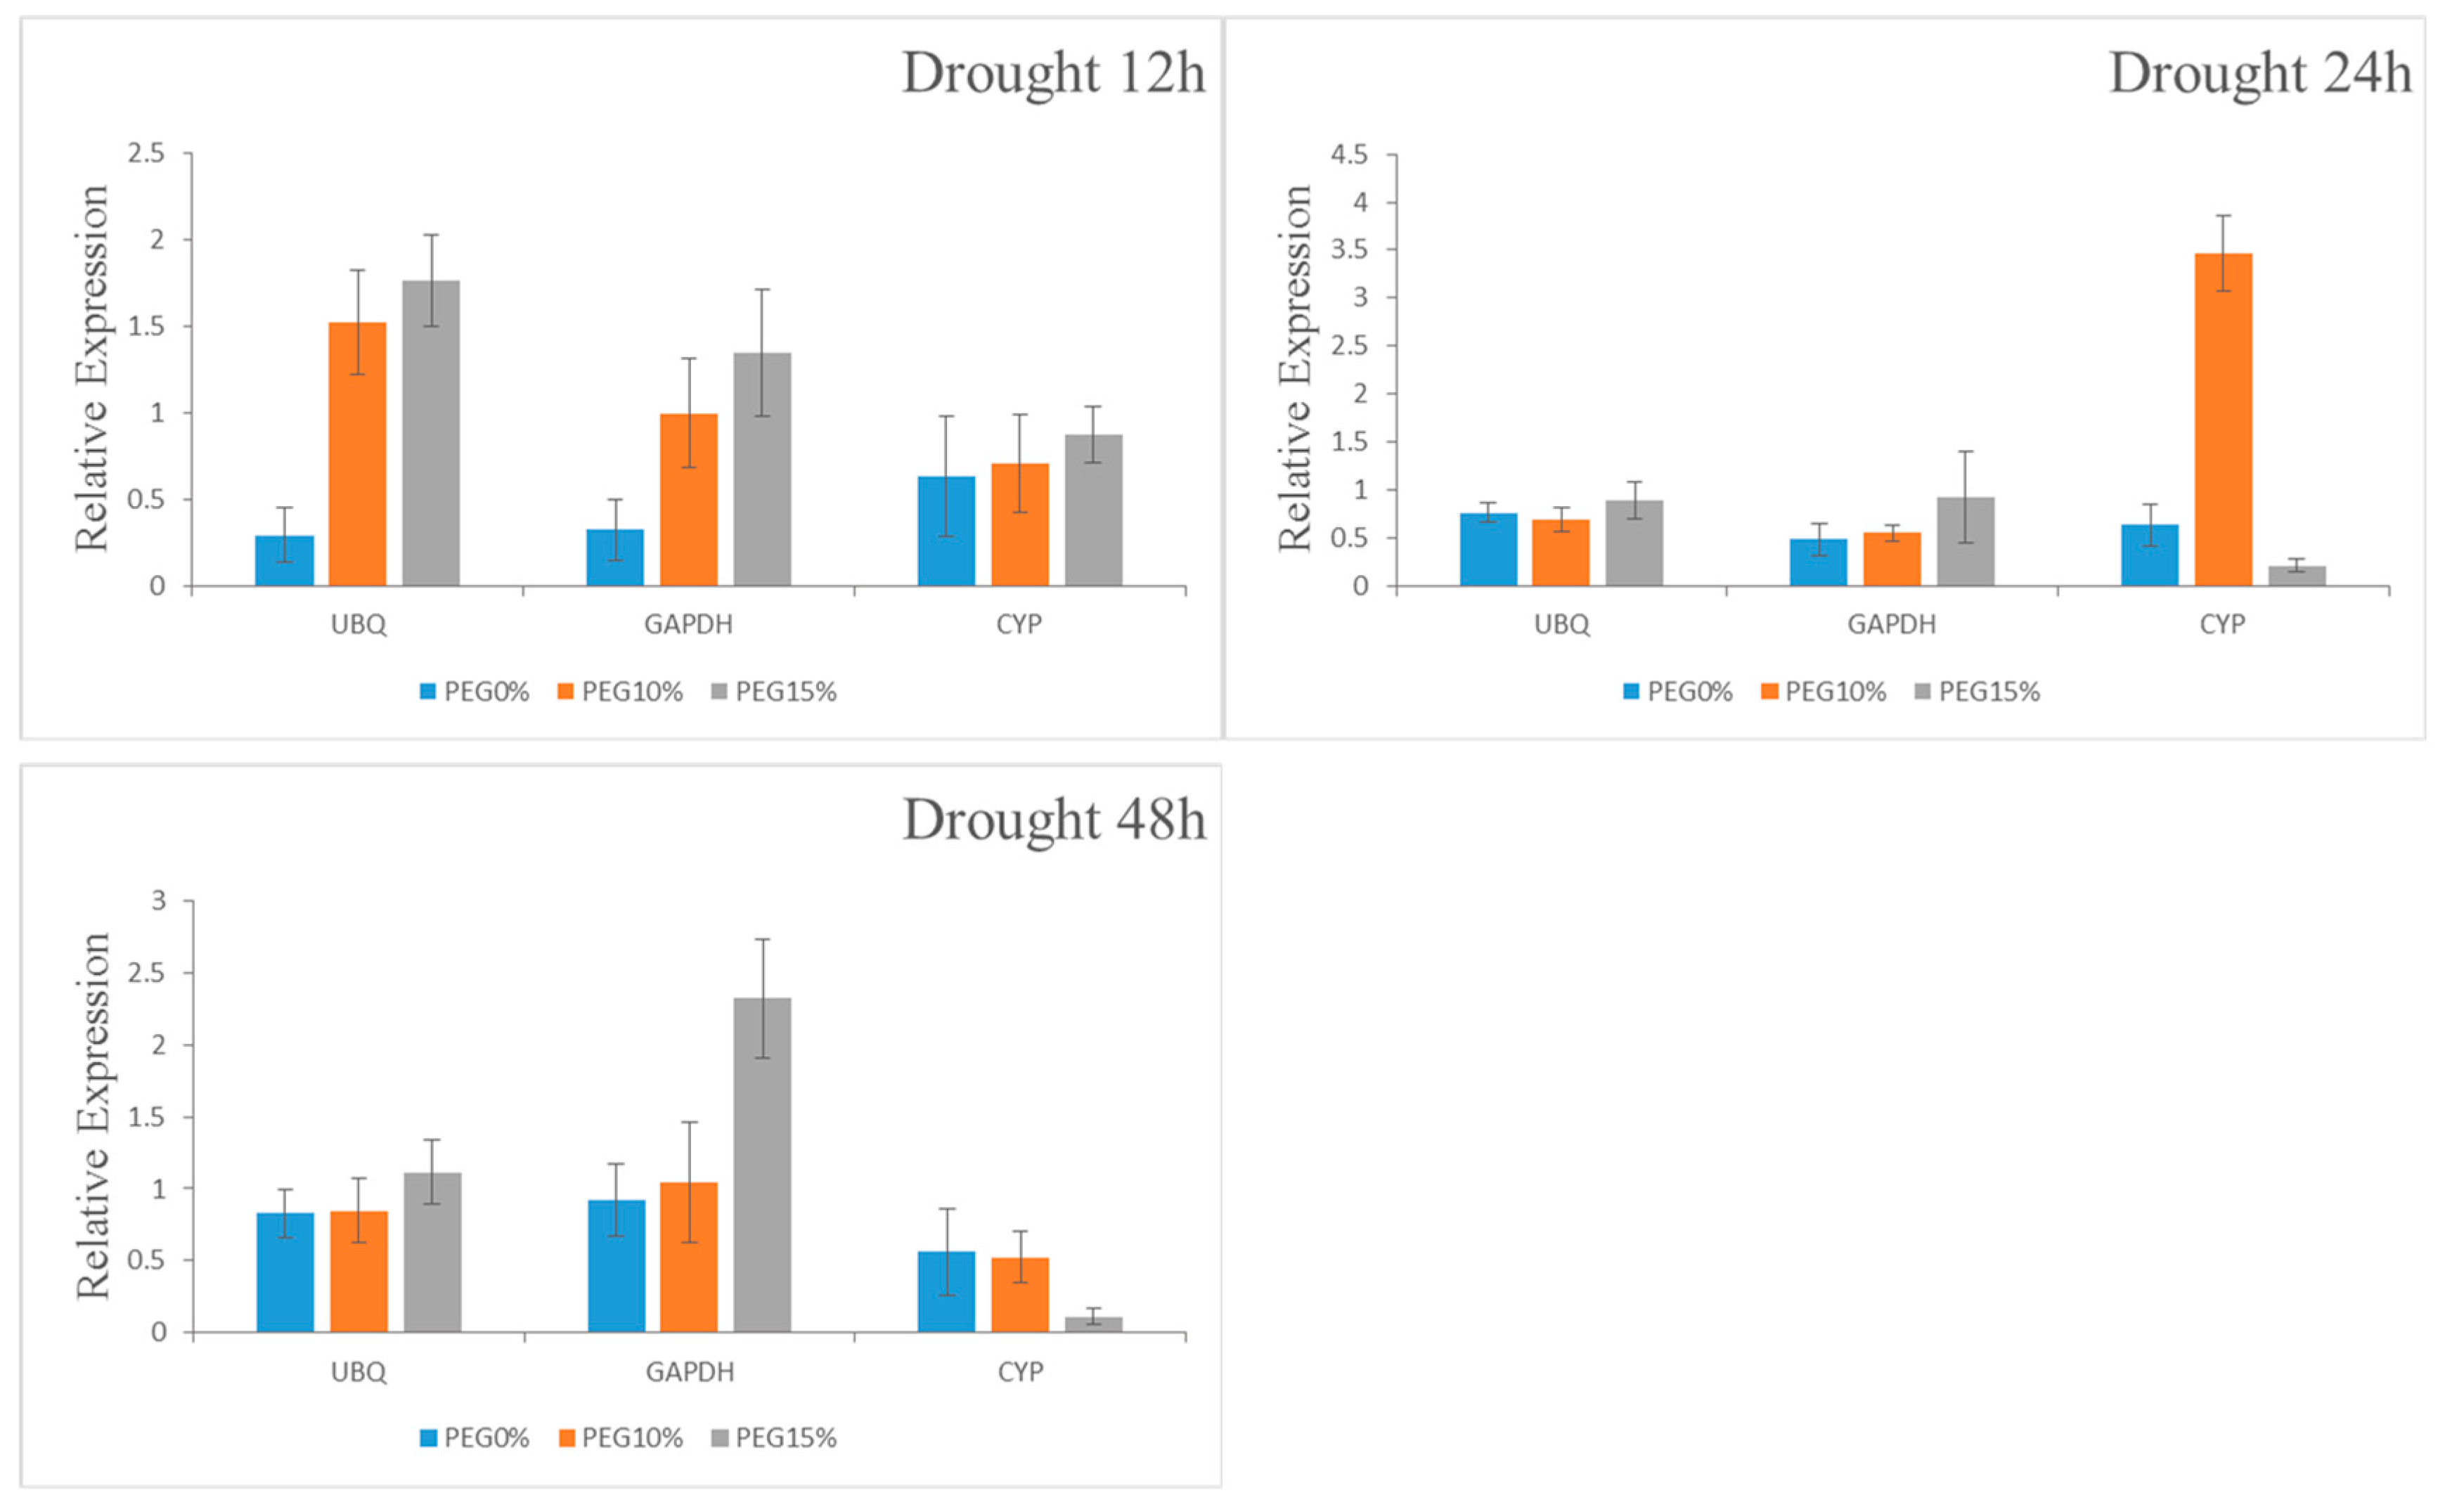
To verify the reliability of selected reference genes, expression profiles of 14-3-3-4, ClPht1;3, and NRT1.1 genes were determined in drought, P, and N stress experiments, respectively. Relative expression levels were normalized using two most stable reference genes (UBQ and GAPDH, Actin1 and GAPDH, Actin1 and UBC) and the least stable gene (CYP, EF1a, 28S rRNA) in each abiotic stress experiment. The expression of 14-3-3-4 gene showed similar level when a single reference gene was used to normalize the expression. When UBQ and GAPDH were used as reference genes, the expression of 14-3-3-4 gene was up regulated with increasing drought stress level without a marked difference among different drought stress times (Figure 3). However, when CYP (unstable gene) was used for normalization of the target gene, relative expression profile of 14-3-3-4 was different between stress periods compared to normalization of expression done using the two most stable reference genes identified in our study (UBQ and GAPDH). Because the expression of 14-3-3-4 gene was up regulated by drought stress [48], UBQ and GAPDH could be used as reference genes to obtain relatively stable results.
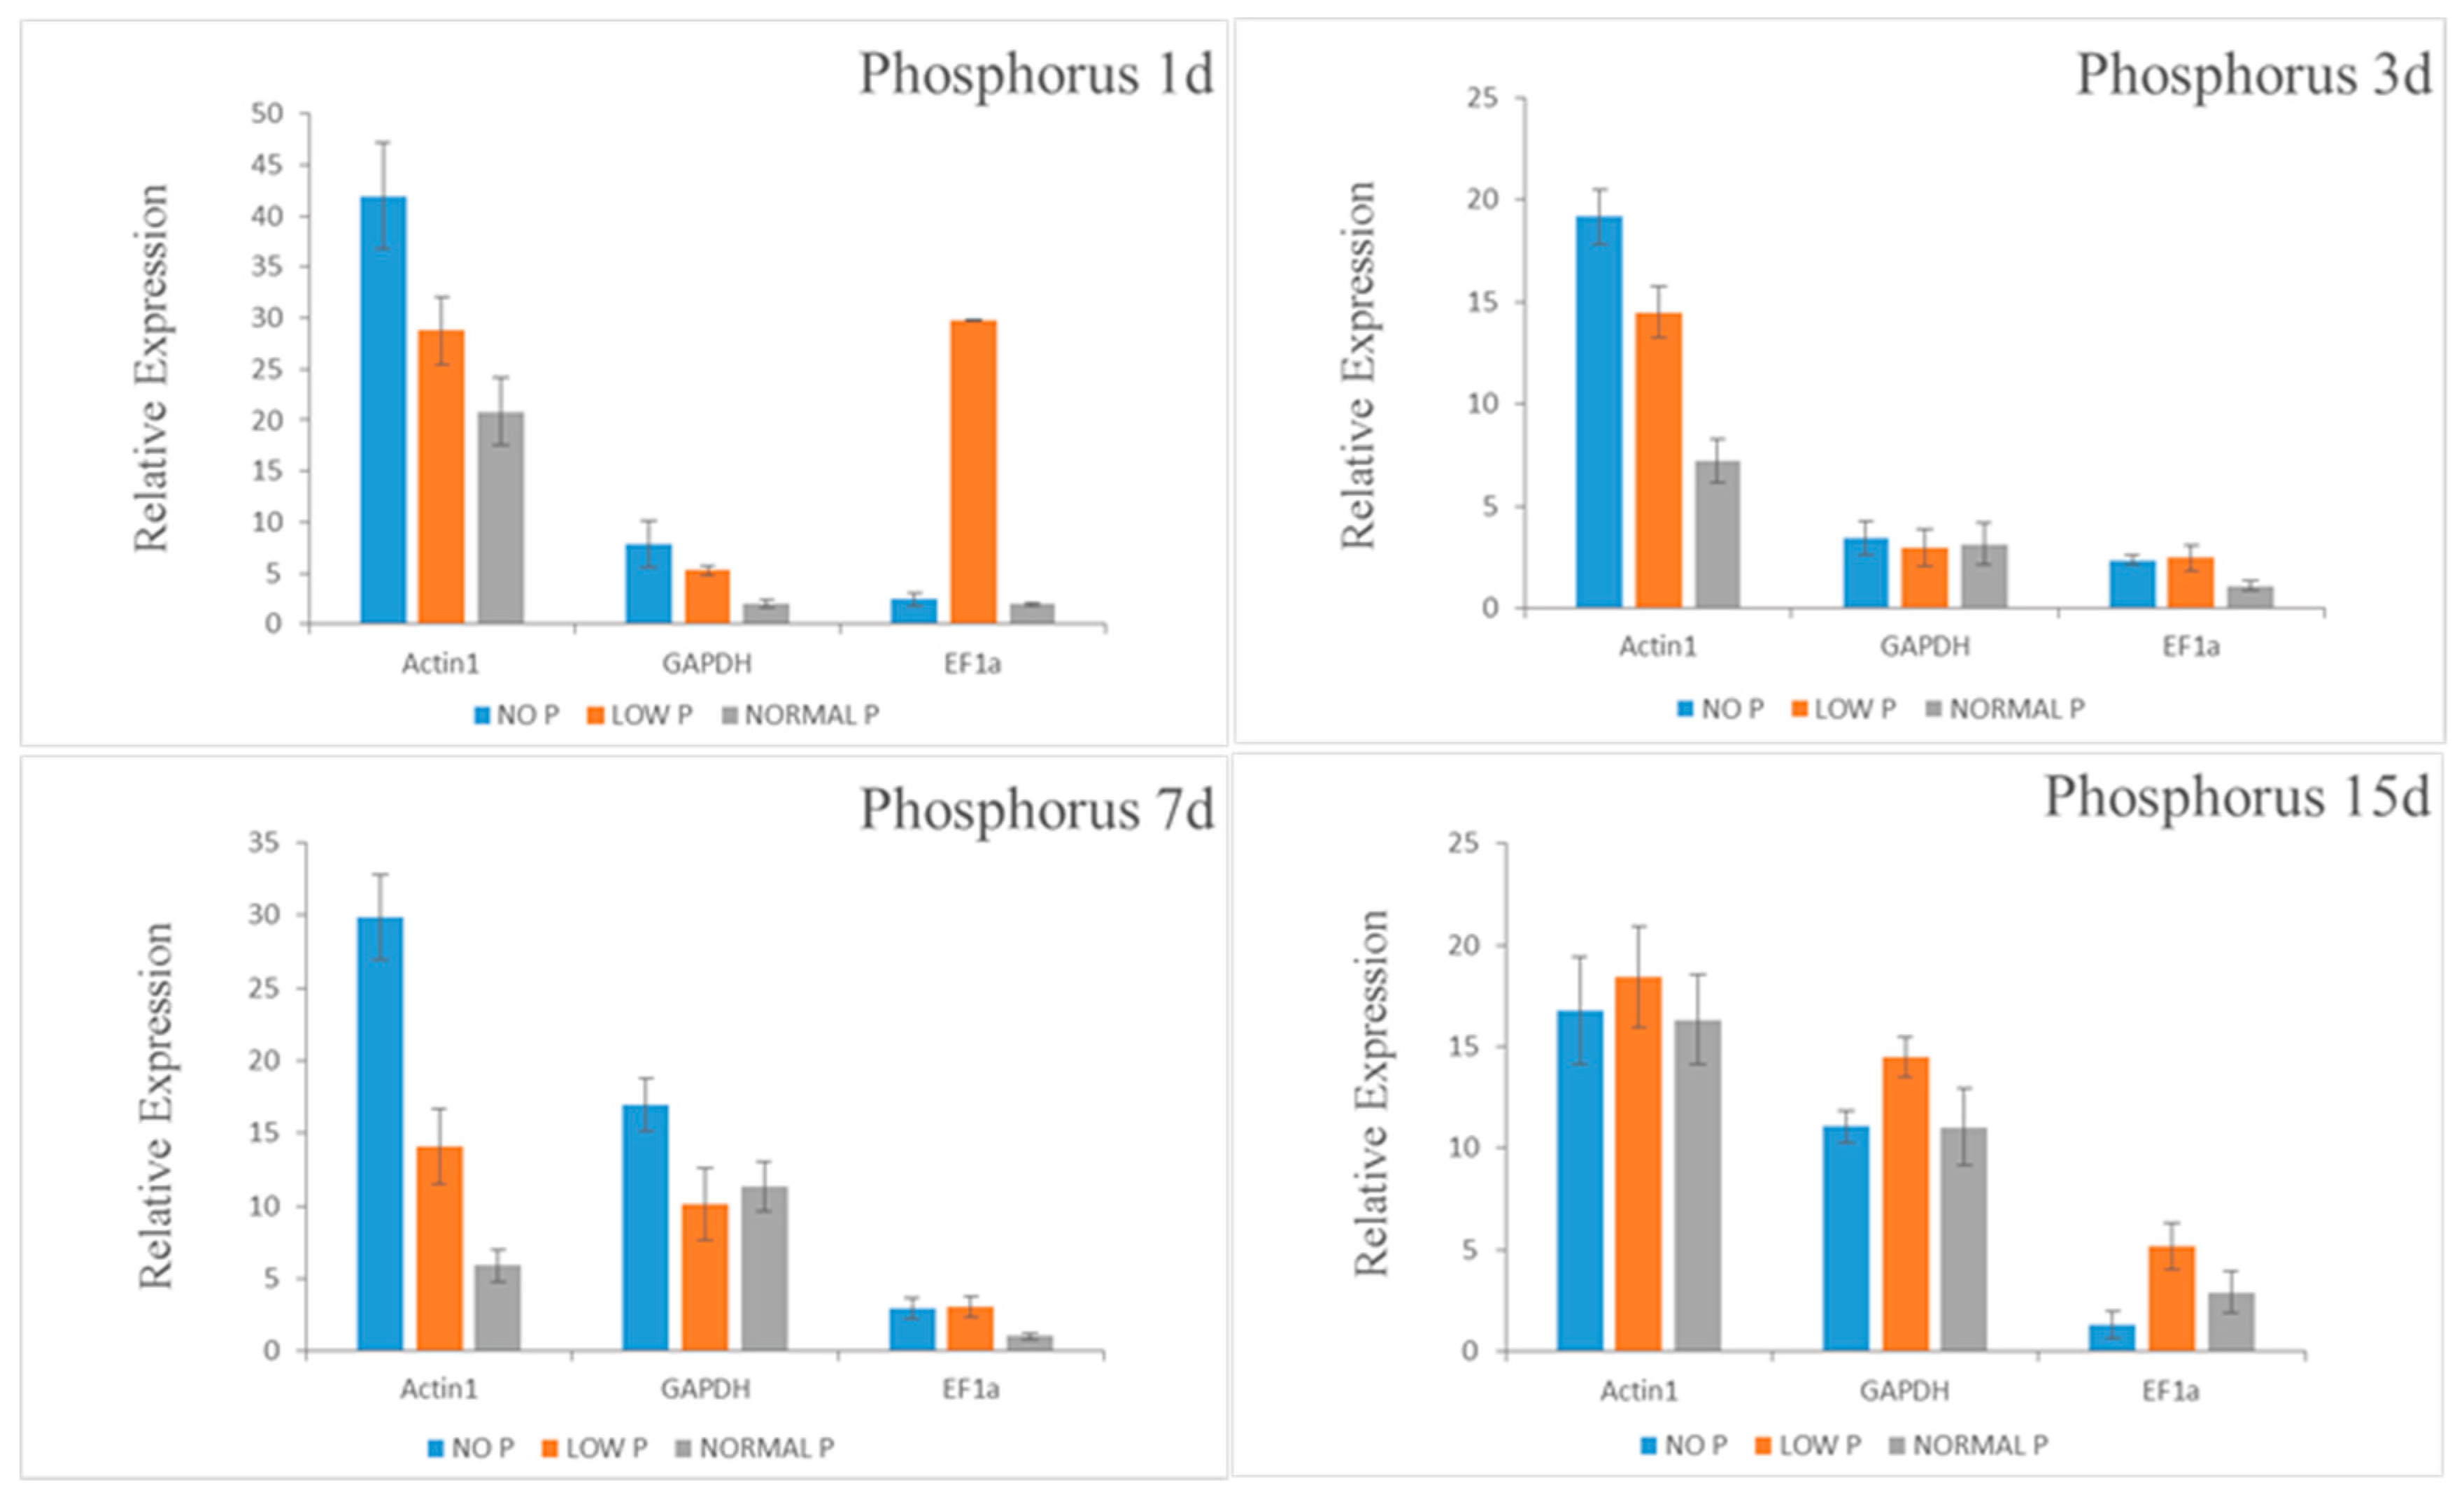
When Actin1 was used as internal reference gene for P starvation experiment, the expression profile of ClPht1;3 was the highest under P deficiency after 1, 3, and 7 days (Figure 4). After 15 days of P treatment, the expression of the target gene (ClPht1;3) slightly decreased in P deficient roots. However, when EF1a (unstable gene) was used for normalization of the target gene, relative expression profile of ClPht1;3 was different compared to normalization of expression done using the two most stable reference genes identified in our study (Actin1 and GAPDH).
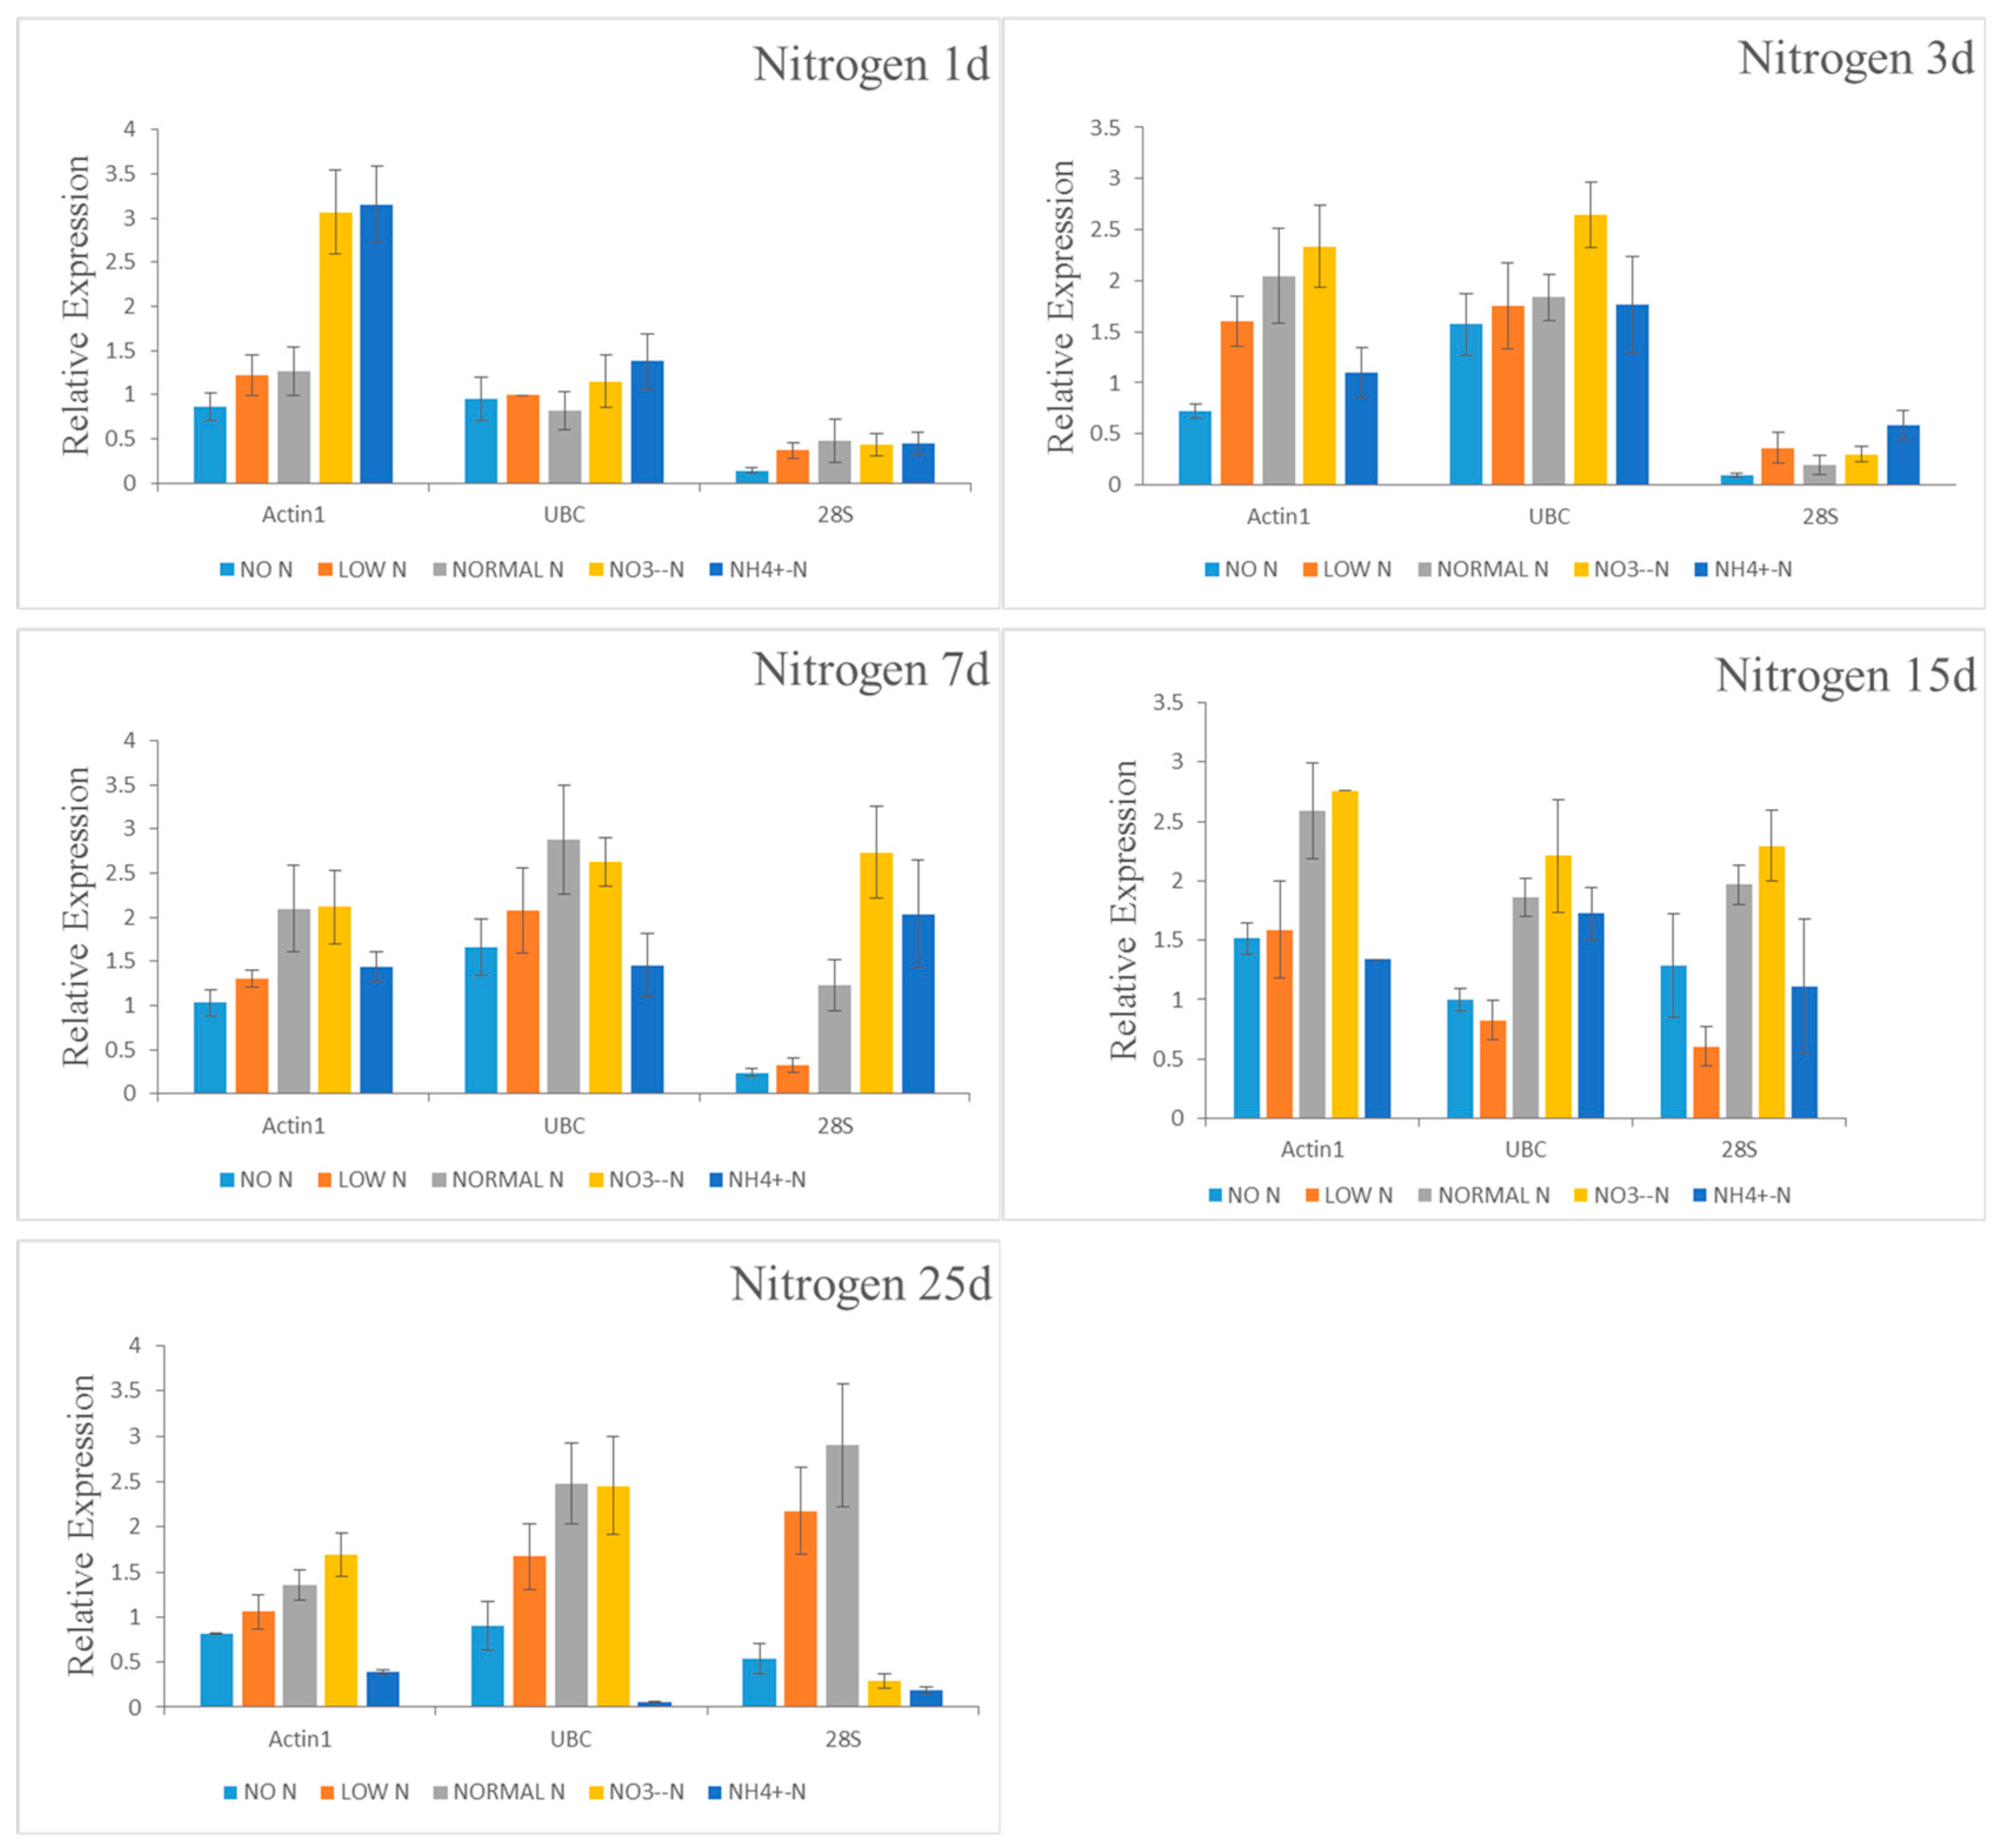
NRT1.1 participated in the absorption of nitrate by plant roots with low affinity, involving transport of different nitrogen concentrations [20]. When Actin1 and UBC were used as reference genes, the relative expression of NRT1.1 was basically the same with the elongation of time at the same concentration (Figure 5). At the same time, the expression level of NRT1.1 was up regulated with the increase in concentration of N and the highest expression level was observed in the treatment of NO3 and the lowest was in the treatment of NH4+. The relative expression of the target gene (NRT1.1) was significantly different from the former two when least stable gene (28S rRNA) was used for normalization of expression of target gene. This indicated that the expression stability of 28S in different nitrogen treated roots was poor and it was not suitable for accurate correction of the relative expression of NRT1.1. As a whole, the results showed that different reference genes were used to correct the expression of target genes in fluorescence quantitative test and different results would be obtained. If the reference genes were not selected properly, the relative expression of target genes could be misestimated.

4. Discussion

The qRT-PCR is widely used in gene expression analysis because of its high specificity and sensitivity. qRT-PCR analysis results are closely related to the selection of reference genes and improper selection of reference genes may lead to deviation of analysis results and even wrong conclusions [48,49,50,51]. Therefore, to ensure the validity of the gene expression analysis results, it is necessary to screen the reference genes before using qRT-PCR to analyze the expression of the target genes. A large number of studies have shown that the screening of reference genes should be accurately evaluated and validated according to plant type [39], tissue location [32], and experimental conditions [21], so as to establish an evaluation system of multiple reference genes, which is an important step towards improving the accuracy of qRT-PCR test [52,53].
In this study, nine commonly used candidate reference genes (GAPDH, UBQ, 18S, 28S, EF1a, UBC, Actin1, elF-3, and CYP) were screened from fine roots of Chinese fir under three abiotic stresses (drought, P, and N stress treatments) at different time and concentrations. In a large number of papers, the stability of these commonly used reference genes is different in different plants, different tissues, different developmental stages and different experimental treatments [42,54]. Our study also showed that the reference genes of Chinese fir roots under different stress treatments were not the same, and the stability of gene expression is highly dependent on external conditions. We identified different stable reference genes for drought stress and nutrient starvation, which effectively normalize the expression of target genes. A previous study screened and validated the stability of five housekeeping genes (Actin, 18S, UBQ, EF1a, and GAPDH) in root and leaf tissues of Chinese fir under different abiotic stresses and found Actin and GAPDH as stable reference genes for root and leaf tissues of Chinese fir, respectively [41]. We also found GAPDH and UBQ as the two most stable genes under drought stress, Actin1 and GAPDH as the two most stable genes under P starvation, and Actin1 and UBC as the two most stable genes under N starvation among the nine candidate reference genes. Thus, not all housekeeping genes are equally valuable to serve as reference genes to normalize the expression level of target genes, as reported previously [55].
To ensure accurate normalization, some authors have recommended that multiple reference genes be used in gene expression analysis [18,56,57,58]. In this experiment, we selected the best two reference genes and the worst one to verify the expression levels of genes related to drought and nutrient stresses. The expression levels of genes related to three abiotic stresses were verified by examining the expression level of 14-3-3-4, ClPht1;3 and NRT1.1 in drought stressed, P, and N stressed roots, respectively. According to the verification results of target gene expression, UBQ and GAPDH were selected as single standardized reference genes under drought stress; Actin1 and GAPDH were selected as single standardized reference genes under P starvation; and Actin1 and UBC were selected as single standardized reference genes under N starvation. The expression patterns of 14-3-3-4, ClPht1;3 and NRT1.1 were similar under the same abiotic stress. The result also showed that the expression pattern of 14-3-3-4, ClPht1;3, and NRT1.1 were almost the same as that of one or two reference genes after normalization. Thus, our results suggest that UBQ gene can be used to standardize Chinese fir root under drought stress, while the Actin gene is the best internal control gene of Chinese fir root under N and P starvation. The stable reference gene selected in this study will be very useful for revealing the gene expression profiles in Chinese fir and related conifer species under abiotic stress; promoting the realization of it at cellular and gene levels. As abiotic stresses, such as drought and low nutrient availability, are major factors limiting tree growth, understanding the genetic basis for coping with such stresses has paramount importance in identifying stress tolerant genotypes. Genes that are up or down regulated during stress have not been fully understood in trees, which necessities further gene expression studies. For gene expression analysis to be accurate, it needs to be normalized using stable reference genes. In this regard, our study will lay the foundation for further investigation of stress-tolerance mechanisms at the molecular level in conifers by providing stable reference genes for normalization of gene expression levels in qRT-PCR analysis.
5. Conclusions

In summary, this study used qRT-PCR technology to determine the optimal reference genes for the relative quantification of transcript abundance in Chinese fir under different abiotic stresses. The expression stability of nine candidate reference genes in Chinese fir root samples was tested under three abiotic treatments with different time intervals and concentrations. As a consequence, we recommend UBQ and the Actin1 gene for drought, P, and N stresses as superior internal controls for normalization of qRT-PCR, respectively. Additionally, our results showed that different suitable reference genes or standardized reference gene combinations could be screened according to different external conditions. The findings reported here will facilitate further studies on stress ecology and gene function analysis in Chinese fir. Our results also provide a basis for normalization of gene expression in other coniferous species, such as Douglas fir.

Author Contributions

Conceptualization, X.M. and M.L.; Formal analysis, R.C. and W.C.; Funding acquisition, M.L.; Investigation, R.C., W.C., W.Z., and Y.L.; Methodology, R.C., W.C., W.Z., Y.L., X.M., and M.L.; Supervision, M.L.; Validation, M.T.; Visualization, R.C.; Writing—original draft, R.C.; Writing—review and editing, M.T.

Funding

This work was financially supported by the National Natural Science Foundation of China (31971674).

Acknowledgments

We are grateful for Weimin Zhong, Wei Liu, Shaoliang Wang and Peng Shuai for their assistance during the lab work.

Conflicts of Interest

The authors declare no conflict of interest.

References

  1. Dong, T.F.; Duan, B.; Zhang, S.; Korpelainen, H.; Niinemets, U.; Li, C.Y. Growth, biomass allocation and photosynthetic responses are related to intensity of root severance and soil moisture conditions in the plantation tree Cunninghamia lanceolata. Tree Physiol. 2016, 36, 807–817. [Google Scholar] [CrossRef]
  2. Yang, Y.S.; Guo, J.; Chen, G.; Xie, J.; Gao, R.; Li, Z.; Jin, Z. Carbon and nitrogen pools in Chinese fir and evergreen broadleaved forests and changes associated with felling and burning in mid-subtropical China. For. Ecol. Manag. 2005, 216, 216–226. [Google Scholar] [CrossRef]
  3. Tian, D.; Xiang, W.; Chen, X.; Yan, W.; Fang, X.; Kang, W.; Dan, X.; Peng, C.; Peng, Y. A long-term evaluation of biomass production in first and second rotations of Chinese fir plantations at the same site. Forestry 2011, 84, 411–418. [Google Scholar] [CrossRef]
  4. Hou, B.F.; Wei, H. Estimation of dry deposition and canopy exchange in Chinese fir plantations. For. Ecol. Manag. 2001, 147, 99–107. [Google Scholar]
  5. Yang, M.; Wang, S.L.; Zhang, W.D.; Wang, Q.K. Dynamics of biomass-and nutrient accumulation in a Chinese-fir plantation. Chin. J. Appl. Ecol. 2010, 21, 1674–1680. [Google Scholar]
  6. Xu, X.; Timmer, V.R. Growth and nitrogen nutrition of Chinese fir seedlings exposed to nutrient loading and fertilization. Plant Soil 1999, 216, 83–91. [Google Scholar] [CrossRef]
  7. Wu, P.; Ma, X.; Tigabu, M.; Chen, W.; Liu, A.Q.; Odén, P.C. Root morphological plasticity and biomass production of two Chinese fir clones with high phosphorus efficiency under low phosphorus stress. Can. J. For. Res. 2011, 41, 228–234. [Google Scholar] [CrossRef]
  8. Bijlsma, R.J.; Lambers, H.; Kooijman, S.A.L.M. A dynamic whole-plant model of integrated metabolism of nitrogen and carbon. 1. Comparative ecological implications of ammonium-nitrate interactions. Plant Soil 2000, 220, 49–69. [Google Scholar] [CrossRef]
  9. Wu, P.; Tigabu, M.; Ma, X.; Odén, P.C.; He, Y.; Yu, X.; He, Z. Variations in biomass, nutrient contents and nutrient use efficiency among Chinese fir provenances. Silvae Genet. 2011, 60, 95–105. [Google Scholar] [CrossRef]
  10. Wu, P.; Wang, G.; Farooq, T.H.; Li, Q.; Zou, X.; Ma, X. Low phosphorus and competition affect Chinese fir cutting growth and root organic acid content: Does neighboring root activity aggravate P nutrient deficiency? J. Soils Sediments 2017, 17, 2775–2785. [Google Scholar] [CrossRef]
  11. Wu, P.; Lai, H.; Tigabu, M.; Wu, W.; Wang, P.; Wang, G.; Ma, X. Does phosphorus deficiency induce formation of root cortical aerenchyma maintaining growth of Cunninghamia lanceolata? Trees 2018, 32, 1633–1642. [Google Scholar] [CrossRef]
  12. Farooq, T.H.; Tigabu, M.; Ma, X.; Zou, X.; Liu, A.Q.; Odén, P.C.; Wu, P. Nutrient uptake, allocation and biochemical changes in two Chinese fir cuttings under heterogeneous phosphorus supply. iForest Biogeosci. For. 2018, 11, 411–417. [Google Scholar] [CrossRef]
  13. Zongbo, Q.; Lichuan, W.; Tong, C.; Yinglang, W.; Xinqiang, H.; Shanfa, L.; Yanwei, W.; Jinxing, L. The regulation of cambial activity in Chinese fir (Cunninghamia lanceolata) involves extensive transcriptome remodeling. New Phytol. 2013, 199, 708–719. [Google Scholar]
  14. Ponchel, F.; Toomes, C.; Bransfield, K.; Leong, F.T.; Douglas, S.H.; Field, S.L.; Bell, S.M.; Combaret, V.; Puisieux, A.; Mighell, A. Real-time PCR based on SYBR-Green I fluorescence: An alternative to the TaqMan assay for a relative quantification of gene rearrangements, gene amplifications and micro gene deletions. BMC Biotechnol. 2003, 3, 18–30. [Google Scholar] [CrossRef]
  15. Bustin, S.A.; Nolan, T. Pitfalls of quantitative real-time reverse-transcription polymerase chain reaction. Biomol. Tech. 2004, 15, 155–166. [Google Scholar]
  16. Mallona, I.; Lischewski, S.; Weiss, J.; Hause, B.; Egea-Cortines, M. Validation of reference genes for quantitative realtime PCR during leaf and flower development in Petunia hybrid. BMC Plant Biol. 2010, 10, 4–14. [Google Scholar] [CrossRef]
  17. Die, J.V.; Román, B.; Nadal, S.; González-Verdejo, C.I. Evaluation of candidate reference genes for expression studies in Pisum sativum under different experimental conditions. Planta 2010, 232, 145–153. [Google Scholar] [CrossRef]
  18. Yang, C.; Pan, H.; Liu, Y.; Zhou, X. Stably expressed housekeeping genes across developmental stages in the two-spotted spider mite, Tetranychusurticae. PLoS ONE 2015, 10, e0120833. [Google Scholar] [CrossRef]
  19. Hao, X.; Horvath, D.P.; Chao, W.S.; Yang, Y.; Wang, X.; Xiao, B. Identification and Evaluation of Reliable Reference Genes for Quantitative Real-Time PCR Analysis in Tea Plant (Camellia sinensis (L.) O. Kuntze). Int. J. Mol. Sci. 2014, 15, 22155–22172. [Google Scholar] [CrossRef]
  20. Tang, X.; Wang, H.; Shao, C.; Shao, H. Reference Gene Selection for qPCR Normalization of Kosteletzkya virginica under Salt Stress. Biomed. Res. Int. 2015, 2015, 1–8. [Google Scholar]
  21. Gutierrez, L.; Mauriat, M.; Guénin, S.; Pelloux, J.; Lefebvre, J.F.; Louvet, R.; Rusterucci, C.; Moritz, T.; Guerineau, F.; Bellini, C. The lack of a systematic validation of reference genes: A serious pitfall undervalued in reverse transcription-polymerase chain reaction (RT-PCR) analysis in plants. Plant Biotechnol. J. 2010, 6, 609–618. [Google Scholar] [CrossRef] [PubMed]
  22. Morse, A.M.; Peterson, D.G.; Islam-Faridi, M.N.; Smith, K.E.; Zenaida, M.; Garcia, S.A.; Kubisiak, T.L.; Amerson, H.V.; Carlson, J.E.; Nelson, C.D.; et al. Evolution of genome size and complexity in Pinus. PLoS ONE 2009, 4, e4332. [Google Scholar] [CrossRef] [PubMed]
  23. Björn, N.; Street, N.R.; Anna, W.; Andrea, Z.; Yao-Cheng, L.; Scofield, D.G.; Francesco, V.; Nicolas, D.; Stefania, G.; Andrey, A. The Norway spruce genome sequence and conifer genome evolution. Nature 2013, 497, 579–584. [Google Scholar]
  24. Kovach, A.; Wegrzyn, J.L.; Parra, G.; Holt, C.; Bruening, G.E.; Loopstra, C.A.; Hartigan, J.; Yandell, M.; Langley, C.H.; Korf, I. The Pinustaeda genome is characterized by diverse and highly diverged repetitive sequences. BMC Genom. 2010, 11. [Google Scholar] [CrossRef] [PubMed]
  25. Bevitori, R.; Oliveira, M.B.; Grossi-De-Sá, M.F.; Lanna, A.C.; Silveira, R.D.; Da Petrofeza, S. Selection of optimized candidate reference genes for qRT-PCR normalization in rice (Oryza sativa L.) during Magnaportheoryzae infection and drought. Gen. Mol. Res. 2014, 13, 9795–9805. [Google Scholar] [CrossRef]
  26. Thellin, O.; Zorzi, W.; Lakaye, B.; De Borman, B.; Coumans, B.; Hennen, G.; Grisar, T.; Igout, A.; Heinen, E. Housekeeping Genes as Internal Standards: Use and Limits. J. Biotechnol. 1999, 75, 291–295. [Google Scholar] [CrossRef]
  27. Chi, X.; Hu, R.; Yang, Q.; Zhang, X.; Pan, L.; Chen, N.; Chen, M.; Yang, Z.; Wang, T.; He, Y.; et al. Validation of reference genes for gene expression studies in peanut by quantitative real-time RT-PCR. Mol. Gen. Genom. 2012, 287, 167–176. [Google Scholar] [CrossRef]
  28. Nicot, N.; Hausman, J.-F.; Hoffmann, L.; Evers, D. Housekeeping gene selection for real-time RT-PCR normalization in potato during biotic and abiotic stress. J. Exp. Bot. 2005, 56, 2907–2914. [Google Scholar] [CrossRef]
  29. Hong, S.Y.; Seo, P.J.; Yang, M.-S.; Xiang, F.; Park, C.-M. Exploring valid reference genes for gene expression studies in Brachypodium distachyonby real-time PCR. BMC Plant Biol. 2008, 8, 112. [Google Scholar] [CrossRef]
  30. Lili, T.; Zhang, X.; Liu, D.; Jin, S.; Cao, J.; Zhu, L.; Deng, F.; Tan, J.; Zhang, C. Screening of Controlled Genes in Real-time Quantitative PCR during Fiber Development and Somatic Embryogenesis in Cotton. Chin. Sci. Bullet. 2007, 52, 2379–2385. [Google Scholar]
  31. Iskandar, H.M.; Simpson, R.S.; Casu, R.E.; Bonnett, G.D.; Maclean, D.J.; Manners, J.M. Comparison of reference genes for quantitative real-time polymerase chain reaction analysis of gene expression in sugarcane. Plant Mol. Biol. Report. 2004, 22, 325–337. [Google Scholar] [CrossRef]
  32. Expósito-Rodríguez, M.; Borges, A.A.; Borges-Pérez, A.; Pérez, J.A. Selection of internal control genes for quantitative real-time RT-PCR studies during tomato development process. BMC Plant Biol. 2008, 8, 131. [Google Scholar] [CrossRef] [PubMed]
  33. Reid, K.E.; Olsson, N.; Schlosser, J.; Peng, F.; Lund, S.T. An optimized grapevine RNA isolation procedure and statistical determination of reference genes for real-time RT-PCR during berry development. BMC Plant Biol. 2006, 6, 27. [Google Scholar] [CrossRef] [PubMed]
  34. Libault, M.; Thibivilliers, S.; Bilgin, D.D.; Radwan, O.; Benitez, M.; Clough, S.J.; Stacey, G. Identification of Four Soybean Reference Genes for Gene Expression Normalization. Plant Genome 2008, 1, 44–54. [Google Scholar] [CrossRef]
  35. Chen, L.; Zhong, H.-Y.; Kuang, J.-F.; Li, J.-G.; Lu, W.-J.; Chen, J.-Y. Validation of reference genes for RT-qPCR studies of gene expression in banana fruit under different experimental conditions. Planta 2011, 234, 377–390. [Google Scholar] [CrossRef]
  36. Kim, B.R.; Nam, H.-Y.; Kim, S.-U.; Kim, S.-I.; Chang, Y.-J. Normalization of reverse transcription quantitative-PCR with housekeeping genes in rice. Biotechnol. Lett. 2003, 25, 1869–1872. [Google Scholar] [CrossRef]
  37. Huis, R.; Hawkins, S.; Neutelings, G. Selection of reference genes for quantitative gene expression normalization in flax (Linumusita tissimum L.). BMC Plant Biol. 2010, 10, 71. [Google Scholar] [CrossRef]
  38. Wei, L.; Miao, H.; Zhao, R.; Han, X.; Zhang, T.; Zhang, H. Identification and testing of reference genes for Sesame gene expression analysis by quantitative real-time PCR. Planta 2013, 237, 873–889. [Google Scholar] [CrossRef] [Green Version]
  39. Wang, H.I.; Chen, J.; Tian, Q.; Wang, S.; Yin, W. Identification and validation of reference genes for Populus euphratica gene expression analysis during abiotic stresses by quantitative real-time PCR. Physiol. Plant. 2014, 152, 529–545. [Google Scholar] [CrossRef]
  40. Bao, W.; Qu, Y.; Shan, X.; Wan, Y. Screening and Validation of Housekeeping Genes of the Root and Cotyledon of Cunninghamia lanceolata under Abiotic Stresses by Using Quantitative Real-Time PCR. Int. J. Mol. Sci. 2016, 17, 1198. [Google Scholar] [CrossRef] [Green Version]
  41. Wang, Z.; Chen, J.; Liu, W.; Luo, Z.; Wang, P.; Zhang, Y.; Zheng, R.; Shi, J. Transcriptome Characteristics and Six Alternative Expressed Genes Positively Correlated with the Phase Transition of Annual Cambial Activities in Chinese Fir (Cunninghamia lanceolata (Lamb.) Hook). PLoS ONE 2013, 8, e71562. [Google Scholar] [CrossRef] [PubMed] [Green Version]
  42. Dianle, N. Cloning and Expression Analysis of 14-3-3 Protein Genes in Cunninghamia Lanceolata (Lamb.) Hook. Master’s Thesis, Fujian Agriculture and Forestry University, Fuzhou, China, 2013. [Google Scholar]
  43. Tong, Z.; Gao, Z.; Wang, F.; Zhou, J.; Zhang, Z. Selection of reliable reference genes for gene expression studies in peach using real-time PCR. BMC Mol. Biol. 2009, 10, 1–13. [Google Scholar] [CrossRef] [PubMed] [Green Version]
  44. Guo, Y.; Chen, J.-X.; Yang, S.; Fu, X.-P.; Zhang, Z.; Chen, K.-H.; Huang, Y.; Li, Y.; Xie, Y.; Mao, Y.-M. Selection of reliable reference genes for gene expression study in nasopharyngeal carcinoma. Acta Pharmacol. Sin. 2010, 31, 1487–1494. [Google Scholar] [CrossRef] [PubMed] [Green Version]
  45. Han, X.; Lu, M.; Chen, Y.; Zhan, Z.; Cui, Q.; Wang, C. Selection of Reliable Reference Genes for Gene Expression Studies Using Real-Time PCR in Tung Tree during Seed Development. PLoS ONE 2012, 7, e43084. [Google Scholar] [CrossRef] [PubMed]
  46. Vandesompele, J.; De Preter, K.; Pattyn, F.; Poppe, B.; Van Roy, N.; De Paepe, A.; Speleman, F. Accurate normalization of real-time quantitative RT-PCR data by geometric averaging of multiple internal control genes. Genome Biol. 2002, 3. [Google Scholar] [CrossRef] [PubMed] [Green Version]
  47. Livak, K.J.; Schmittgen, T.D. Analysis of relative gene expression data using real-time quantitative PCR and the 2-ΔΔCT method. Methods 2001, 25, 402–408. [Google Scholar] [CrossRef]
  48. Xu, W.; Shi, W.; Jia, L.; Liang, J.; Zhang, J. TFT6 and TFT7, two different members of tomato 14-3-3 gene family, play distinct roles in plant adaption to low phosphorus stress. Plant Cell Environ. 2012, 7, 1047–1048. [Google Scholar] [CrossRef]
  49. Albershardt, T.C.; Iritani, B.M.; Ruddell, A. Evaluation of reference genes for quantitative PCR analysis of mouse lymphocytes. J. Immunol. Methods 2012, 384, 196–199. [Google Scholar] [CrossRef] [Green Version]
  50. Luo, H.; Luo, K.; Luo, L.; Li, E.; Guan, B.; Xiong, D.; Sun, B.; Peng, K.; Yang, B. Evaluation of candidate reference genes for gene expression studies in Cymbidium kanran. Sci. Hortic. 2014, 167, 43–48. [Google Scholar] [CrossRef]
  51. Mohelnikovaduchonova, B.; Oliverius, M.; Honsova, E.; Soucek, P. Evaluation of reference genes and normalization strategy for quantitative real-time PCR in human pancreatic carcinoma. Dis. Markers 2014, 32, 203–210. [Google Scholar] [CrossRef]
  52. Pabuayon, I.M.; Yamamoto, N.; Trinidad, J.L.; Longkumer, T.; Raorane, M.L.; Kohli, A. Reference genes for accurate gene expression analyses across different tissues, developmental stages and genotypes in rice for drought tolerance. Rice 2016, 9, 32–39. [Google Scholar] [CrossRef] [PubMed] [Green Version]
  53. Schmidt, G.W.; Delaney, S.K. Stable internal reference genes for normalization of real-time RT-PCR in tobacco (Nicotiana tabacum) during development and abiotic stress. Mol. Gen. Genom. 2010, 283, 233–241. [Google Scholar] [CrossRef] [PubMed]
  54. Aijing, Z. Functional Analysis of Microrna399a in Chinese Fir. Master’s Thesis, Henan Normal University, Xinxiang, China, 2015. [Google Scholar]
  55. Liang, W.; Xiaoxing, Z.; Rebeca, C.-L.; Lingjiao, W.; Weihong, S.; Xueyuan, Y.; Songqing, W.; Pengfei, L.; Hui, D.; Lin, N. Selection and evaluation of reference genes for qRT-PCR analysis in EuscaphiskonishiiHayata based on transcriptome data. Plant Methods 2018, 14, 42–50. [Google Scholar] [CrossRef] [PubMed]
  56. Jacob, F.; Guertler, R.; Naim, S.; Nixdorf, S.; Fedier, A.; Hacker, N.F.; Heinzelmann-Schwarz, H. Careful Selection of Reference Genes Is Required for Reliable Performance of RT-qPCR in Human Normal and Cancer Cell Lines. PLoS ONE 2013, 8, e59180. [Google Scholar] [CrossRef] [Green Version]
  57. Sinha, D.K.; Smith, C.M. Selection of reference genes for expression analysis in Diuraphisnoxia (Hemiptera: Aphididae) fed on resistant and susceptible wheat plants. Sci. Rep. 2014, 4, 5059–5064. [Google Scholar] [CrossRef]
  58. Yang, C.; Pan, H.; Liu, Y.; Zhou, X. Selection of Reference Genes for Expression Analysis Using Quantitative Real-Time PCR in the Pea Aphid, Acyrthosiphonpisum (Harris) (Hemiptera, Aphidiae). PLoS ONE 2014, 9, e110454. [Google Scholar] [CrossRef] [Green Version]
Figure 1. Expression levels (Ct values) of the nine candidate reference genes. The lines across the box indicate median values. The upper and lower edges bordered in each box are interquartile range, which indicate the 25th and 75th percentiles.
Forests 10 01087 g001
Figure 2. Average expression stability (M values) and ranking of candidate reference genes in Chinese fir root with different stress treatment calculated by geNorm. A lower M value indicates a more stable expression. (A): 0%-Root: 0% PEG6000 treatment; (B): 10%-Root: 10% PEG6000 treatment; (C): 15%-Root: 15% PEG6000 treatment; (D): NO P-Root: P-starved supply treatment; (E): Low P-Root: low P supply treatment; (F): Normal P-Root: normal P supply treatment; (G): NO N-Root: N-starved supply treatment; (H): Low N-Root: low N supply treatment; (I): Normal N-Root: normal N supply treatment; (J): NO3-N-Root: NO3 stress treatment; (K): NH4+-N-Root: NH4+ stress treatment.
Forests 10 01087 g002
Figure 3. Relative expression of 14-3-3-4 under drought stress for different time period. UBQ and GAPDH were used as two most stable reference genes, CYP was used as the least stable reference gene. PEG0%: 0% PEG6000 treatment; PEG10%: 10% PEG6000 treatment; PEG15%: 15% PEG6000 treatment; PEG: Polyethylene Glycol treatment of molecular weight 6000.
Forests 10 01087 g003
Figure 4. Relative expression of ClPht1;3 under P stress treatments at different time period. Actin1 and GAPDH were used as two most stable reference genes. EF1a was used as the least stable reference gene. NO P: P-starved supply treatment; LOW P: low P supply treatment; NORMAL P: normal P supply treatment.
Forests 10 01087 g004
Figure 5. Relative expression of NRT1.1 under N stress treatments at different time period. Actin1 and UBC were used as two most stable reference genes, 28S rRNA was used as the least stable reference gene. NO N: N-starved supply treatment; LOW N: low N supply treatment; NORMAL N: normal N supply treatment; NO3 N: NO3 stress treatment; NH4+-N: NH4+ stress treatment.
Forests 10 01087 g005
Table 1. Primer sequences of the candidate reference genes and target genes (ClPht1;3, NRT1.1, 14-3-3-4) together with polymerase chain reaction (PCR) amplification efficiency and the regression coefficient.
Gene NamePrimer Sequence (5′ to 3′)TM (°C)GC Content (%)Amplification Efficiency (%)Reg. Coeff. (R2)
GAPDHF: GCACCTATGTTTGTGGTTGGAGTA60.345.8102.0180.976
R: ACCGTCTTCTGTGTAGCTGTTGTT60.345.8
UBQF: AATAAATGCTTCAAATGTCAGGCTA55.432.095.6530.987
R: TGAGATGGTCTGGTGATGTCGTGG63.754.2
18S rRNAF: GGGAACATTATCACGGACAGCATCAAC63.548.1101.5470.994
R: TGCGACTAATGGTCCAGATAGACTCCT63.548.1
28S rRNAF: AGTTTGTAGAAGCGTCCTCAG58.047.6103.0300.988
R: GGCGCCCCCTTCCA58.878.6
EF1aF: TGGCAAGGAGCTTGAGAAAGAACCCA63.650.098.9270.994
R: ACCCCAACAGCAACAGTCTGACGCAT65.153.8
UBCF: CTCCTGATGATAGAGGTCTAACG60.247.896.6030.991
R: ATGACATGGAGGTCGGTACATAG60.247.8
Actin1F: CTCTCTCAGCACCTTCGAGCAG63.859.1100.4580.965
R: TCCACATACAACCGCTCCACTG61.954.5
elF-3F: TCTGCATCCCAATGATTTGT53.753.794.8290.999
R: TCTTCAGATGTTGCTTGCCT55.845.0
CYPF: TGTGTCAGGGTGGCGACTTCA61.957.194.9310.953
R: TTCGCCATGGAGAGGATGCC61.960.0
ClPht1;3F: CCAATACAACAACTTTCGTCGTG58.443.593.9600.951
R: GTCCTCGTGCTTATTCTGATTTG58.443.5
NRT1.1F: GCCAAGAACACCGTGAACAT57.85098.6580.950
R: TCAGCCCGAAGAAGTGATGT57.850
14-3-3-4F: CATGCCATGGATGAGTACCGAGAAG63.65294.9950.944
R: CGGGATCCTCACATCTCTTCATCT62.050
Table 2. Expression stability values and ranking of reference genes for drought experiment calculated by the NormFinder.
Intra Group
Rank0%-Root10%-Root15%-RootOverall
GeneStabGeneStabGeneStabGeneStab
1UBQ0.185UBQ0.36718S0.221UBQ0.907
2GAPDH0.39428S0.900GAPDH0.343GAPDH1.638
3EF1a0.563GAPDH0.901UBQ0.355Actin12.226
4UBC0.625UBC1.13428S0.37018S2.258
5Actin10.670Actin11.177EF1a0.371EF1a2.397
618S0.786CYP1.218Actin10.379UBC2.416
7elF-31.04618S1.251UBC0.65728S2.703
828S1.433elF-31.391elF-30.827elF-33.264
9CYP1.479CYP1.463CYP1.531CYP4.228
Best geneUBQUBQ18SUBQ
0.1850.3670.2210.907
0%-Root: 0% PEG6000 treatment; 10%-Root: 10% PEG6000 treatment; 15%-Root: 15% PEG6000 treatment; PEG: Polyethylene glycol treatment of molecular weight 6000.
Table 3. Expression stability values and ranking of reference genes for drought experiment calculated by BestKeeper.
Rank0%-Root10%-Root15%-RootAverage
GeneCVGeneCVGeneCVGeneCV
1UBQ5.85UBQ5.27UBQ4.00UBQ5.04
2GAPDH7.3218S5.29GAPDH4.35GAPDH5.92
3EF1a8.03GAPDH6.1018S5.44EF1a6.92
4UBC8.3628S6.57EF1a5.7918S6.96
528S9.58EF1a6.9528S8.12UBC8.01
6Actin19.98UBC7.35UBC8.3128S8.09
718S10.15Actin18.45Actin18.84Actin19.09
8elF-312.19elF-310.37elF-311.84elF-311.47
9CYP14.31CYP10.99CYP16.96CYP14.09
Table 4. Expression stability values and ranking of reference genes for phosphorus experiment calculated by the NormFinder.
Intra Group
RankNo P-RootLow P-RootNormal P-RootOverall
GeneStabGeneGeneStabGeneGeneStab
1Actin10.773Actin10.079CYP0.700Actin12.319
2CYP0.776GAPDH0.079Actin11.467GAPDH2.422
3GAPDH0.80028S0.534GAPDH1.543CYP2.512
4elF-30.915CYP1.036elF-31.553elF-33.879
5UBC1.069UBC1.07718S1.891UBC4.133
6UBQ1.08318S1.159UBC1.987UBQ4.686
7EF1a1.713UBQ1.31328S2.12318S4.861
818S1.811elF-31.411UBQ2.29028S2.512
928S2.737EF1a3.048EF1a2.726EF1a7.487
Best geneActin1Actin1CYPActin1
0.7730.0790.7002.319
NO P-Root: P-starved supply treatment; Low P-Root: low P supply treatment; Normal P-Root: normal P supply treatment.
Table 5. Expression stability values and ranking of reference genes for phosphorus experiment calculated by BestKeeper.
RankNo P-RootLow P-RootNormal P-RootAverage
GeneCVGeneCVGeneCVGeneCV
1GAPDH2.28GAPDH0.59Actin10.97Actin11.32
2Actin12.39Actin10.61GAPDH2.36GAPDH1.74
3EF1a3.3618S0.6328S2.85CYP5.40
4CYP5.80UBC2.11elF-33.0718S6.78
5elF-38.71UBQ5.50CYP4.28elF-37.16
6UBC9.77CYP6.1118S7.89UBC7.56
7UBQ10.2928S8.41UBQ8.1728S7.82
818S11.81elF-39.70UBC10.80UBQ7.99
928S12.20EF1a17.47EF1a17.58EF1a12.80
Table 6. Expression stability values and ranking of reference genes for nitrogen experiment calculated by the NormFinder.
RankNo N-RootLow N-RootNormal N-RootNO3-N-RootNH4+-N-RootOverall
GeneStabGeneStabGeneStabGeneStabGeneStabGeneStab
1Actin10.048UBC0.052Actin10.230UBC0.204Actin10.077UBC0.638
2EF1a0.060Actin10.063UBC0.230elF-30.224UBC0.104Actin10.774
3GAPDH0.094elF-30.08218S0.243Actin10.356GAPDH0.117elF-31.594
4UBC0.121EF1a0.107elF-30.248UBQ0.609UBQ0.170UBQ1.594
5UBQ0.16218S0.117UBQ0.308EF1a0.68628S0.322GAPDH1.964
6elF-30.23428S0.232GAPDH0.32918S0.687CYP0.527EF1a2.354
7CYP0.341UBQ0.34528S0.57028S0.715elF-30.80618S2.554
818S0.446CYP0.385EF1a0.582GAPDH0.815EF1a0.919CYP3.416
928S1.664GAPDH0.609CYP0.620CYP1.54318S1.06128S3.503
Best geneActin1UBCActin1UBCActin1UBC
0.0480.0520.2300.2040.0770.638
Table 7. Expression stability values and ranking of reference genes for nitrogen experiment calculated by BestKeeper.
RankNo N-RootLow N-RootNormal N-RootNO3-N-RootNH4+-N-RootAverage
GeneCVGeneCVGeneCVGeneCVGeneCVGeneCV
1CYP0.33Actin10.36Actin11.02Actin10.73CYP0.28Actin10.55
2Actin10.36CYP1.4818S1.80UBQ0.93UBC0.35UBC1.29
3UBC0.84UBC1.49UBC2.26UBC1.52Actin10.6518S1.46
418S0.9718S1.49UBQ2.3028S31.78GAPDH1.06UBQ1.58
5UBQ1.05EF1a1.51elF-32.7618S1.8118S1.25CYP2.29
6EF1a1.19elF-31.99GAPDH2.94elF-32.04UBQ1.36GAPDH2.31
7GAPDH1.54UBQ2.2828S3.63GAPDH3.18elF-33.41elF-32.418
8elF-31.89GAPDH2.81CYP3.99EF1a3.8328S3.54EF1a2.91
928S2.8728S3.23EF1a4.46CYP5.37EF1a3.5528S2.96