Abstract
Secondary forest areas are increasing worldwide and understanding how these forests interact with climate change including frequent and extreme events becomes increasingly important. This study aims to investigate the effects of the strong 2015/2016 El Niño-induced drought on species-specific leaf phenology, dieback and tree mortality in a secondary dry dipterocarp forest (DDF) in western Thailand. During the 2015/2016 El Niño event, rainfall and soil water content were lower than 25 mm and 5% during 5–6 consecutive months. The dry season was 3–4 months longer during the El Niño than during non-El Niño events. We found that this prolonged drought induced the earlier shedding and a delay in leaf emergence of the DDF. The deciduousness period was also longer during the El Niño event (5 months instead of 2–3 months during non-El Niño event). We found that the DDF species showed different phenological responses and sensitivities to the El Niño-induced drought. The leaf phenology of stem succulent species Lannea coromandelica (Houtt.) Merr. and a complete deciduous species with low wood density. Sindora siamensis Teijsm. ex Miq. was only slightly affected by the El Niño-induced drought. Conversely, a semi-deciduous species such as Dipterocarpus obtusifolius Teijsm. ex Miq. showed a higher degree of deciduousness during the El Niño compared to non-El Niño events. Our results also highlight that dieback and mortality during El Niño were increased by 45 and 50%, respectively, compared to non-El Niño events, pointing at the importance of such events to shape DDF ecosystems.
1. Introduction
Climate change is affecting plant phenology worldwide, mainly through temperature rise in temperate forest [1,2] and through changes in precipitation patterns in tropical dry forests (TDFs) [3]. The exploration of the climate cues regulating plant phenology is crucial to improve how biogeochemical cycles such as carbon and water, may be altered by climate change and how this will in turn feedback on the Earth climate system [4,5]. In seasonal TDFs, it is generally assumed that water availability for plants is the main driver of TDFs phenology. Water availability for plants is dependent on seasonal rainfall distribution, the amount of rainfall, soil water retention and the ability of plants to store water in their tissue [6,7]. In Southeast Asia (SEA), rainfall and temperature fluctuations are strongly regulated by monsoons and El Niño-Southern Oscillation (ENSO) [8,9]. Intense ENSO associated with weaker northeast monsoons and delay of southwest monsoons have caused extreme events in SEA such as large floods and prolonged severe droughts [10,11,12]. By the end of the century, rainfall in SEA is projected by the regional climatic model to intensify, resulting in rising widespread consecutive dry days, while the air temperature in the mainland is expected to rise by 4–5 °C (for the baseline period 1971–2000) [9]. Substantial change in rainfall regimes leading to drier and warmer conditions is especially expected to occur in seasonal TDFs due to the increase in frequency and intensity of the El Niño events [3].
TDFs cover 42% of the tropical and subtropical forests with a distinct rainfall seasonality [13]. In TDFs, multi-stages of leaf phenology occur throughout the dry season. Many trees of TDFs form new leaves after leaf shedding despite no major changes in the climatic conditions. This was suggested to relate to seasonal internal/physiological changes in tree water status [14]. How phenology of TDFs is responding to climate fluctuations and extreme events is still poorly understood compared to the phenology of plants from savanna and moist forests in the tropical regions [3,15]. Although studies focusing on TDFs phenology have recently increased, most of them were located in Africa and tropical America particularly in Mexico, Costa Rica and Brazil [16]. Only a few have examined TDFs phenology in SEA [17].
Dry dipterocarp forests (DDF) are common and widely distributed from northeast India, through Thailand, to Lao PDR and Vietnam [18,19]. It is usually found in the area with annual precipitation of 800–1500 mm and elevation of 300–1200 m above mean seal level. The canopy height of mature forest is usually 15–20 m. This forest type has a relatively low, open canopy composed of species with typically thick, leathery leaves [18]. The dominant trees belong to the Dipterocarpaceae family which are absent from the Neotropic and Afrotropic ecozones where most of studies in the past were concentrated [20], hence their phenological responses to climate may differ. Generally, the dry dipterocarp forest (DDF) in SEA is dominated by the one or two of the following species; Dipterocarpus obtusifolius Teijsm. ex Miq., Dipterocarpus tuberculatus Roxb., Shorea obtusa Wall. and Shorea siamensis Miq. These four dipterocarp species generally make up about 80% of the trees in DDF [21]. Recent studies indicate that some species in this family are sensitive to warm temperature. Leaf temperatures can be higher than 7–8 °C compared to air temperature due to their isohydric strategies leading to less transpirational cooling ability [22].
SEA forests have been critically threatened by anthropogenic and natural disturbance including forest fires over the last decades and DDF has also been highly degraded under increasing pressure from anthropogenic activities such as urban and agricultural expansion [19]. The secondary forests have recently expanded as policy efforts for protecting forest have been implemented and afforestation and reforestation have been encouraged. In 2019, the secondary forests cover the largest area in SEA accounting for 45% of total forests, while the primary or old growth forests were only 35% [23]. The secondary forests become increasingly important due to its relative low-cost climate warming mitigation (high rate of carbon sequestration) and its provision in valuable ecosystem services [24].
El Niño is one of the climatic phenomena that cause widespread drought in SEA. Forest trees have developed strategies to cope with extreme droughts, for example by shedding (partly or fully) the canopy to reduce transpiration [14], by increasing water storage in tree trunk or in the roots [25] or by increasing rooting depth to reach deeper water or ground water [26]. Based on leaf phenology, three groups of species can be distinguished (i) the deciduous species (ii) the brevi-deciduous species (leaves shed with a short leafless period and then replaced by new ones), and (iii) the stem succulent species (leaves are shed earlier during the end of rainy season and remain leaf-less during the entire dry season [27].
Strategies to cope with drought in forest tree can also be investigated using stem traits. For instance, wood stem density has been found to correlate to xylem cavitation [27]. There is a trade-off between cavitation resistance and hydraulic efficiency as a better resistance to cavitation often leads to a lower water conductivity. Therefore, high wood density species tends to have a relatively higher drought resistance compared to the low wood species [27,28]. In addition, a few studies in TDFs have indicated that leaf phenology is related to wood density [27,29]. However, the relationships between leaf phenology, wood density and its resistance to drought have not yet been investigated in the secondary DDF.
Drought is also expected to reduce forest carbon sequestration through tree mortality and dieback. For instance, the prolonged drought during the strong 1997/1998 El Niño induced high tree mortality and dieback in SEA tropical rainforests especially in younger trees [30,31]. Understanding the responses of tree species from different functional groups to drought stress will enable new approaches for predicting and mitigating the future effects of drought [27,32]. Yet, the high diversity of tree species in TDFs complicates the task to distinct different groups of species exhibiting similar phenological responses or adaptation to drought.
Understanding how TDFs respond to extreme climatic events, especially prolonged drought induced by El Niño events should be a priority for improving the forest management as the frequency of extreme events are expected to increase in the coming decades [33]. The 2015/2016 El Niño was reported as one of the top three strongest El Niño in the historical records since 1950 and the first strong El Niño in the 21st centuries [34]. Our objectives in the present study are; (1) to investigate the leaf phenological responses of a DDF forest and of individual DDF species to the 2015/2016 El Niño, and (2) to evaluate the dieback and mortality rate induced by this strong El Niño event.
2. Materials and Methods
2.1. Study Site
The study was conducted in a secondary dry dipterocarp forest (DDF) located in Ratchaburi province in western Thailand (13°35′13″ N: 99°30′4″ E). The forest was previously degraded as it was excessively exploited for timber, charcoal or other products. The current growing trees resulted from a natural regeneration since it was protected in 2005. The soil texture is loamy sand in the top (0–0.6 m below ground) with more than 70% sand particle, and sandy loam in the deeper layers. The soil was strongly acidic with pH 4.8–5.1. Soil organic matter and soil organic carbon content were 0.36–1.06% and 0.3–0.5%, respectively [35].
2.2. Microclimate Measurement
At the site, microclimate variables consisting of air temperature (Tair), relative humidity (RH) and rainfall were measured by sensors mounted on the tower at 10 m above the ground site between mid-2009 and April 2018. Tair and RH were measured at 2 min intervals by a Vaisala sensor (Vaisala HMP45C, Helsinki, Finland), while the rainfall was measured at 30 min intervals by a tipping bucket rain gauge (TE525, Campbell Scientific, Inc., Logan, UT, USA,). Soil temperature and soil water content were measured every 30 min at 5 cm soil depth by using averaging soil thermocouple probe (TCAV, Campbell Scientific, Inc.) and water content reflectometer (CS616, Campbell Scientific, Inc.), respectively. These micrometeorological data were stored in data loggers (CR1000, Campbell Scientific, Inc.).
2.3. Sampling Design, Forest Structural Characteristic and Biodiversity
Four study plots for vegetation studies were randomly laid out in the DDF during February 2015–April 2018. The size of each plot was 10 × 10 m2. This forest is very uniform and homogeneous in term of species composition and soil conditions. There was no significant difference of topography among these plots, as all of them was located in the flat area, with the slope of less than 0.5%. The elevation of the study forest is 110 m above mean sea level, and all plots were within 20–30 m apart so these plots were within the same range of elevation. Approximately 112 trees/plot and 12 species/plot were found. The average canopy height and tree diameter were 7.0 m and 6.8 cm, respectively.
The dominant species was defined by importance value index (IVI) following the Phillips protocol [36]. Only trees with a diameter at breast high (DBH) equal to or greater than 0.5 cm were considered for computing the IVI. The samples in this study consisted of 448 individual trees from 21 species to 16 families. The Dipterocarpaceae family has the largest number of species (five species including Dipterocarpus obtusifolius Teijsm. ex Miq., Shorea siamensis Miq., Shorea obtusa Wall., Shorea roxburghii G. Don and Dipterocarpus tuberculatus Roxb.). This family covered the highest IVI (56.2%) and four out of these five species were in the top five highest IVI (Table S1). In addition, biodiversity indices including Shannon’s diversity index [37], Simpson’s dominance index [38] and Evenness Index (E) [39] were calculated to better characterize the biodiversity of this forest. These indices equaled to 2.30, 0.12 and 0.38, respectively. These indicated this study site was in a range of low to moderate biodiversity.
2.4. Phenological Indices
Four variables of phenology or phenophases including young leaves, mature leaves, senescence leaves, and leafless (or bare branches) were investigated in dry and wet seasons (Figure S1). Young leaves are defined as newly flushed leaves within one week. Mature leaves refer to those that have full expansion with dense green color. Senescence leaves are those that start to turn yellowish-brown and wilt. Leafless period is when there are no leaves left on the branch. All of these leaf phenophases were examined by visualization on the 30th day of the month between March 2015–April 2018. Four phenophases of each individual tree (totally 448 individual tree) were estimated by score-composite technique with a linear scale of 0–4. For example; when all four phenophases of an individual tree were found on the observation day, each phenophase is scored as 1. In case an individual tree has full mature leaves, a score value of mature leaf phenophase of 4 is recorded and three others phenophases (young leaves, senescence leaves and leafless) are scored as 0. The scores of 3, 2, 1 represented three quarters, half and one quarter of each phenophase on the canopy, respectively. The total composite score of 4 is the sum of scores from all four of these phenophases [40].
Additionally, four dominant species having complete deciduousness strategy (S. siamensis Miq., S. obtusa Wall., S. roxburghii G.Don and Sindora siamensis Teijsm. ex Miq.) were monitored to assess the date of the first leaf expansion two times per week between February and May in 2016 (El Niño) and in 2017 (non-El Niño). Note that D. obtusifolius Teijsm. ex Miq. was not monitored due to our inability to identify its first leaf expansion of incomplete deciduous species. The leaf litter production was investigated to confirm the timing of the end of season of five dominant species and others. The leaf litter was collected by 12 litter traps (3 litter traps per plot) with size of 1 × 1 m−2 every month between June 2015 and April 2018. Then, the leaf litter was dried at 80 °C and weighed by separating the leaf litter of five dominant species from other species.
2.5. Clustering of Leaf Phenology
Phenology as crown density was clustered into different group depending on its phenological scores. Individual samples from 12 dominant species (equal or more than four individual trees per species) were selected to optimize the number of clusters by using the Elbow method. This method defined the number of clusters by minimizing the total within-cluster sum of square (WSS) (or total intra-cluster variation) [41]. Results showed that five clusters were suitable for four phenophases (Figure S2). After that, all of the phenological scores covering the duration of El Niño and non-El Niño were pooled together and clustered using the hierarchical clustering model of Ward’s method [42]. This method minimizes the total within-cluster variance. At each step a pair of clusters with minimum between-cluster distance was merged, while the dissimilarity of each cluster was considered from the centroid of each cluster during the process. The dissimilarity between each cluster was calculated from squared Euclidean distance as shown in Equation (1):
where d is the dissimilarity between species i and j, xk is an average score of each specie in every month. The two clusters having the most similarity were merged together, then the dissimilarity of merged cluster was updated based on Equation (2):
where n is the number of species in each cluster. This process was repeated until every species was clustered. This hierarchical cluster analysis based on Ward’s linkage method was processed by using the hclust R-package [42].
2.6. Wood Density
Tree cores (5 mm increment borer, Haglöf, Långsele, Sweden) of seven species including five dominant species (D. obtusifolius Teijsm. ex Miq., S. siamensis Miq., S. obtusa Wall., S. roxburghii G. Don, Sindora siamensis Teijsm. ex Miq.), and two additional species (Ellipanthus tomentosus Kuze var. tomentosus and Lannea coromandelica (Houtt.) Merr.) that were clustered in a unique group in the mature leaf stage separated from five dominant species were sampled. Eight tree cores per species were collected. The wood density was determined by the ratio of dry weight to volume. The dry weight was estimated by placing the core sample in a drying oven at 102 °C for 2 h and weighed immediately after cooling with constant dry mass. Sample volume was estimated by water displacement following Archimedes principle [43].
2.7. Die Back and Mortality
In this study, dieback is defined as a tree showing defoliation and died from the tip of its canopy or primary shoot. Tree mortality is a dead tree exhibiting complete defoliation but still has stem bark and preserves fine branches and shoots. Tree mortality and die back were observed manually every month inside the four plots in association with measurements of the DBH and tree height during March 2015–April 2018. Six species from seven species analyzing the wood density were selected to observe the mortality and dieback based on the number of individual trees (at least 20 individual trees). These included D. obtusifolius Teijsm. ex Miq., S. siamensis Miq., S. obtuse Wall., S. roxburghii G. Don, Sindora siamensis Teijsm. ex Miq. and L. coromandelica (Houtt.) Merr. were selected to analyze dieback and mortality with their tree size over the study period.
2.8. Data Analysis
The Multivariate El Niño/Southern Oscillation (ENSO) Index Version 2 (MEI.v2) combines both oceanic and atmospheric variables, facilitates in a single index an assessment of ENSO. The MEI is the time series of the leading combined Empirical Orthogonal Function (EOF) of five different variables (sea level pressure (SLP), sea surface temperature (SST), zonal and meridional components of the surface wind, and outgoing longwave radiation (OLR)) over the tropical Pacific basin (30°S–30° N and 100°E–70° W) [44]. Linear regressions were applied to analyze the relationships between the MEI.v2 and microclimatic variables recorded at the site as well as between microclimatic variables and the degree of deciduousness. The multiple comparisons of wood density among species was tested by using ANOVA and Tukey’s honestly significant difference (HSD) tests at 95% confidence level. All analyses including linear regressions and visualization were performed with the software R version 3.4.0 [45].
3. Results
3.1. Impact of ENSO on the Microclimate of the Study DDF
The annual average rainfall for 10 years in the forest was 939 ± 206 mm year−1. The seasons in this study were divided into dry and wet season following the monsoon rainfall as described by Tanaka et al. [46]. The wet season starts in May and ends in October and the dry season begins in November and ends in April of the following year. During the 10 years when microclimate was recorded in the forest, the El Niño occurred two times in 2009/2010 (weak El Niño) and 2015/2016 (strong El Niño) [47,48].
The amount of rainfall during the El Niño were as low as 59.1 and 71.4 mm during the dry season, i.e., ~30% of the total rainfall in typical years. During the dry seasons 2009/2010 and 2015/2016, the rainfall was even lower than 25 mm for six consecutive months compared to only three months during the non-El Niño dry seasons. The lower rainfall during both events resulted in lower soil moisture (<5% VWC) for five consecutive months instead of three months during usual dry seasons (Figure 1a). The mean temperature was not much different between El Niño and non-El Niño years, but the maximum temperature was significantly higher in April 2016 (41.7 °C). The maximum vapor pressure deficit (VPD) increased sharply (Figure 1b) with the highest VPD at 4.8 kPa in April 2016. This indicates the high-water vapor demand in surrounding air during that dry season. The severe El Niño induced drought periods were characterized by low rainfall, low soil water deficit, warmer and drier air condition. In fact, the 2015/2016 El Niño has been reported as one of the top three strongest El Niño in the historical records since 1950 and the first strong El Niño in the 21st century [34].
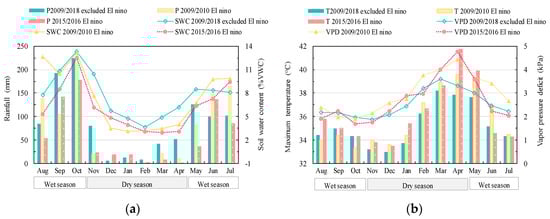
Figure 1.
Comparison of climate variables between two El Niño events in 2009/2010 (yellow) and 2015/2016 (red), and 10 years (2009–2018) (green) microclimate average excluding the two El Niño events; (a) rainfall (p) and soil water content (SWC), (b) maximum air temperature (T), and maximum vapor pressure deficit (VPD).
Microclimate variables recorded at DDF sites were strongly correlated with the Multivariate El Niño/Southern Oscillation (ENSO) index (MEI.v2) [44]. ENSO events (positive values) coincided with reduced rainfall and soil water content (SWC) especially during March-April (Figure 2a,b). The effects of ENSO on SWC and rainfall lasted until June and August, respectively. Positive ENSO value also induced significantly warmer and drier air conditions during March-April (MA) with no lag-time (Figure 2c).
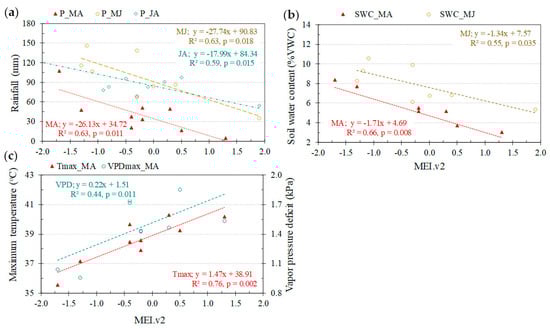
Figure 2.
Relationships between Multivariate El Niño/Southern Oscillation (ENSO) index (MEI.v2) and microclimate variables consisting of (a) rainfall (P), (b) soil water content (SWC) and (c) maximum air temperature (Tmax) and maximum vapor pressure deficit (VPDmax) during March-April (MA), May-June (MJ) and July-August (JA) between 2009 and 2018.
3.2. Impact of El Niño on Leaf Phenology of the DDF
The 2015/2016 El Niño induced contrasting phenological responses among the dominant species of DDF. This has allowed clustering the DDF species into different groups according to their phenological response. Overall, most of the species showed earlier deciduousness in response to the drought-induced El Niño and generally delayed their mature leaf production from April-May to June-July. Considering the mature leaf stage, five clusters were identified. The first cluster includes S. obtusa Wall., S.roxburghii G. Don, Litsea glutinosa (Lour.) C. B. Rob. and Croton oblongifolius Roxb. species which showed complete deciduousness only during the El Niño and partial deciduousness during non-El Niño years (Figure 3, group C1). The second cluster included Sindora siamensis Teijsm. ex Miq., S. siamensis Miq., Phyllanthus emblica L. and Xylia xylocarpa Taub. var. Kerrii Nielsen. These species had a complete deciduousness for each dry season, but during the El Niño year the complete deciduousness period was significantly longer than during the non-El Niño years (Figure 3, group C2). The third cluster contained only one species, L. coromandelica (Houtt.) Merr. that showed the longest and complete deciduousness period during the dry season (Figure 3, group C3). The fourth cluster also included a single species with unique characteristic (Erythrophleum succirubrum Gagnep. For this species, El Niño induced earlier leaf exchange by developing mature leaves about one month earlier compared to non-El Niño years (on May instead of June) (Figure 3, group C4). Finally, the fifth cluster consisted of E. tomentosus Kuze var. tomentosus and D. obtusifolius Teijsm. ex Miq.. These two species maintained their leaves during the whole year, with nevertheless greater deciduousness during the El Niño event. This group could be classified as semi-deciduous type (Figure 3, group C5).
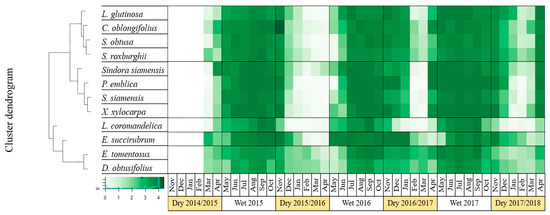
Figure 3.
Phenological pattern of mature leaves of 12 species clustered into five groups (C1–C5) between March 2015–April 2018 (the black lines mark the separation between the different clusters of species based on their phenological patterns), the color gradient in the legend defined the score of mature leaf (0–4) in the canopy. The dark green indicates the full leaf canopy, while the light green and the white colors indicate less leaves and no leaves on the canopy, respectively.
Considering the leafless stage, the clustering analysis shows that L. coromandelica (Houtt.) Merr. and E. succirubrum Gagnep. were separated from other species similar to that of the stage of mature leaves. The first cluster of this stage included only one species, L. coromandelica (Houtt.) Merr. This species had the longest leafless period compared to other species with slightly higher deciduousness during El Niño than non-El Niño years (Figure 4, group-C1). The second cluster included P.emblica L., L.glutinosa (Lour.) C. B. Rob., X.xylocarpa Taub. var. Kerrii Nielsen and S.siamensis Miq., species which showed complete deciduousness with longer and greater magnitude during the dry season 2015/2016 than that of other dry seasons (Figure 4, group-C2). The third cluster included only E. succirubrum Gagnep. This species showed the fastest leaf disappearance with earlier leaf emergence during the dry season 2015/2016 compared to other species (Figure 4, group-C3). The fourth cluster contained S. obtusa Wall. and S. roxburghii G.Don which exhibited higher degree and longer period of deciduousness during the dry season of 2015/2016 (Figure 4, group-C4). E. tomentosus Kuze var. tomentosus, D. obtusifolius Teijsm. ex Miq., C. oblongifolius Roxb. and Sindora siamensis Teijsm. ex Miq. were grouped together in the fifth cluster (Figure 4, group-C5). However, E. tomentosus Kuze var. tomentosus and D. obtusifolius Teijsm. ex Miq. had incomplete leaflessness, while C. oblongifolius Roxb. and Sindora siamensis Teijsm. ex Miq. were distinctly leafless, especially in February.
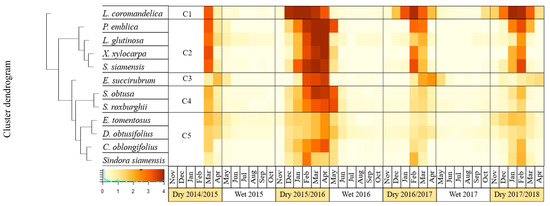
Figure 4.
Phenological pattern of leafless stage or bare branch of 12 species clustered into five groups (C1–C5) between March 2015–April 2018 (the black lines mark the separation between the different clusters of species based on their phenological patterns), dark brown indicates leafless condition while pale yellow indicates branch with leaves.
The El Niño induced-drought affected the emergence of new leaves of most of the four deciduous species. For instance, the emergence of new leaves was delayed by about 2 months from March-April to May-June, excepted for Sindora siamensis Teijsm. ex Miq., which was flushing in March. It is noteworthy that D. obtusifolius Teijsm. ex Miq. produced numerous new leaves during the heavy rain period in October (Figure S3).
Regarding leaf senescence, the differences among species were not quite clear and this made the clustering analysis difficult. However, it is noted that most of the species showed earlier leaf senescence with a narrower time window between December and January during the 2015/2016 El Niño. In other dry seasons, this typically occurs between December and February (Figure S4). L. coromandelica (Houtt.) Merr. and E. succirubrum Gagnep. were distinguished from other species (Figure S4).
3.3. Relationship between Microclimate Conditions and the Degree of Deciduousness in the DDF
For all clusters, the amount of rainfall was significantly correlated with the degree of deciduousness observed in the forest (observations from three wet and three dry seasons from 2015 to 2018) (Figure 5), highlighting the importance of the precipitation for leaf phenology in this DDF ecosystem. Higher degree of deciduousness was found under lower precipitations. Based on slope of the linear regressions between rainfall and mature leaves, we found that L. coromandelica (Houtt.) Merr. which is a stem succulent species in cluster 3 showed the highest sensitivity to external water availability, following by almost DDF species in cluster 2, 1 and 4. In contrast, D. obtusifolius Teijsm. ex Miq. in cluster 5 behave like a semi-deciduous species, showing the lowest sensitivity to water deficit.
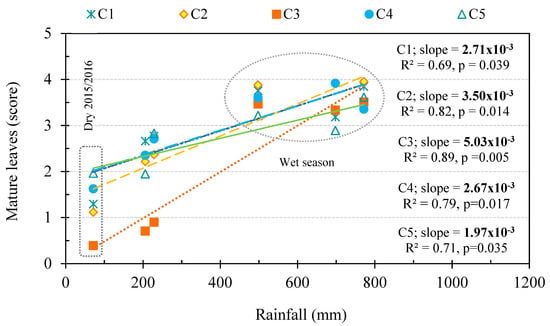
Figure 5.
Relationships between rainfall and mature leaves as a proxy for the degree of deciduousness of five clusters (C1–C5) during the three dry and three wet seasons from 2015 to 2018. Slope indicates the phenological sensitivity (degree of deciduousness) of the cluster in response to water availability, the data points in the circles indicate the mature leave scores during wet season, those outside the circle are the mature leaves scores during the dry season, and the data points in the dashed box are mature leaves scores during the dry season 2015/2016 (during El Niño).
3.4. First Leaf Expansion and Leaf Litter Production of the Dominant Species
During non-El Niño events, three dominant species including S. siamensis Miq., S. obtusa Wall. and S. roxburghii G.Don showed their first leaf emergence in March. During the 2015/2016 El Niño events, their first leaf flushing was delayed to May (Figure S5). It is noteworthy that the first leaves of S. siamensis Miq. emerged earlier than the ones of S. obtusa Wall. and S. roxburghii G.Don. In contrast, the time of the first leaf emergence of Sindora siamensis Teijsm. ex Miq. was not different between El Niño and non-El Niño dry seasons which occurred between mid-March and April. Thus, El Niño had a high impact on the phenology of Shorea sp. but only a little impact on the phenology of Sindora siamensis Teijsm. ex Miq., suggesting a higher drought tolerance of the latter species.
3.5. Wood Density
Wood density varies from 0.54 ± 0.02 g·cm−3 for L. coromandelica (Houtt.) Merr. to 0.90 ± 0.03 g·cm−3 for E. succirubrum Gagnep. (Table 1). The two species with the highest wood density were also the ones showing the fastest leaf flushing and fully mature leaf production during El Niño. On the other hand, the species Sindora siamensis Teijsm. ex Miq. showed the longest leaf lifespan (Figure 3, group C2). The species with the lowest wood density L. coromandelica (Houtt.) Merr. (0.54 ± 0.02 g·cm−3) is a species characterized by a succulent stem. Other species with moderate wood density exhibited late leaf emergence after prolonged drought. There was no clear difference in wood density between deciduous and semi-deciduous species (Table 1).

Table 1.
Leaf phenological behavior and wood density (±standard variation of 8 samples) of seven species distributed in five clusters for mature leaf stage.
3.6. Dieback and Mortality
High rate of dieback was expected during the dry season but in fact 60% of total dieback was usually visible during the following wet season (Figure 6 and Table S2). Relatively higher dieback for the species D. obtusifolius Teijsm. ex Miq., S. roxburghii G.Don and S. siamensis Miq. was observed during the prolonged drought 2015/2016 as compared to other dry seasons (Table S2). During the study period from the dry season 2014 to the dry season 2017/2018 (7 seasons), the highest dieback was recorded during wet season 2015 and dry season 2015/2016. This accounted for 31% of all dieback recorded (Table S2). A high mortality rate occurred consecutively during the dry season 2015/206, wet season 2016 and dry season 2016/2017. D. obtusifolius Teijsm. ex Miq. showed the highest rate of total dieback, and S.obtusa Wall. exhibited the highest percentage of total dieback and mortality (Table S2). It is noted that the mortality of S. obtusa Wall. was partly caused by greater herbivory damages by insects. This may subsequently weaken further its resistance to drought. Most of the dieback occurred in young trees that have DBH smaller than 4 cm and tree height shorter than 4 m, respectively. It was found that the El Niño event stimulated the dieback among all six species invested (Figure 7). The mortality in some trees occurred during the dry season 2016/2017 after that visible dieback was observed during the wet season of 2016, which could be a lag effect of the El-Niño prolonged drought. The dieback during the 2015/2016 drought was 45% compared to 23–26% during pre-drought and post-drought. Tree mortality during the 2015/2016 drought was 50%, compared to 13 and 26% during pre-drought and post-drought, respectively.
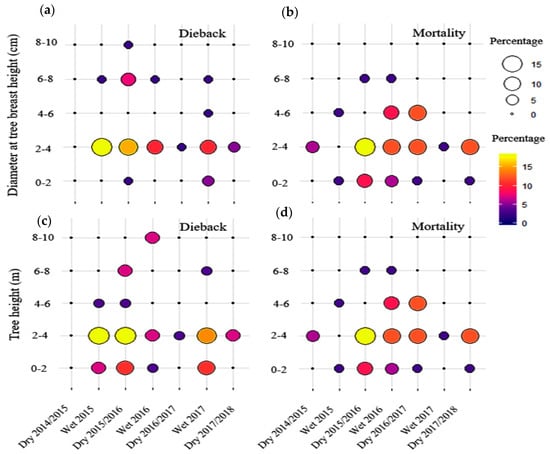
Figure 6.
Dieback (a,c) and mortality (b,d) rate depending on DBH and tree height in the study DDF for each wet and dry seasons from 2014 to 2018. The size of circle from small to big indicates the percentage of tree mortality and dieback (15). The color gradient from purple to yellow also indicates the percentage of mortality and dieback in the same way as the size of circle, but helps to distinguish when the circles have similar sizes (e.g., yellow vs. orange).
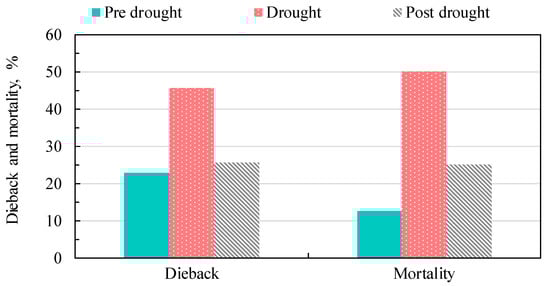
Figure 7.
Percentage of dieback and mortality during pre-drought (Dry season 2014/2015–wet season 2015), drought (Dry season 2015/2016–wet season 2016), and post-drought (Dry season 2016/2017–wet season 2017).
4. Discussion
Extreme events such as ENSO have dominated climate variability in SEA [8,51]. This study highlights the strong link between such ENSO-induced drought and the responses of the DDF species through their leaf phenology, wood density, mortality and dieback. The strong 2015/2016 El Niño induced overall earlier leaf shedding at the beginning of the dry season and later leaf emergence at the beginning of the wet season. This resulted in a longer and greater degree of deciduousness during the dry period (5 months instead of 2–3 months during non-El Niño events). The delayed timing of leaf emergence was largely influenced by the delayed onset of the rainy season (monsoons).
Most of the DDF species responded to the prolonged drought by shedding their leaves earlier, especially stem succulent and deciduous species. Cleland et al., reported that tree species are particularly vulnerable to climate change because their phenology is generally able to track lengthening or shortening of the dry season [52]. With regards to this result, L. coromandelica (Houtt.) Merr. showed the highest sensitivity compared to other species. However, this species seems dormant but stores water in the stem and sheds its leaves earliest (Figure 5). Other deciduous species are also highly sensitive to rainfall and their growing season becomes shorter under severe drought. It has been reported that these deciduous species share one common characteristics that they had a short leaf life span with higher leaf nitrogen content [53]. They thus can escalate growth and have photosynthesis within the relatively short time span. In addition, they could maintain relatively high stomatal conductance, carbon assimilation rates and electron flow through photosynthesis even during the dry season until their leaves are abscised. The carbon uptake during the photosynthetically active period can thus compensate for the absence of carbon assimilation during the leafless period [53,54]. However, the stomatal conductance sharply declines when air temperature becomes higher than 40 °C. This will promote high leaf temperatures and thus reduced photosynthetic efficiency [22].
The behavior of the species D. obtusifolius Teijsm. ex Miq. is also of particular interest. Together with its highest IVI in the DDF, during usual dry seasons, remaining leaves of D. obtusifolius Teijsm. ex Miq. allows supply of the carbon necessary to produce new leaves without affecting the carbon reserves that leads to higher competition compared to other species. Here, we found damage to the leaves of D. obtusifolius Teijsm. ex Miq. during the El Niño, which may be the consequence of a lack of water availability and a high-water vapor demand leading to a strong heat stress (41.7 °C) and ultimately leaf burning. In addition, large leaves are also sensitive to heat stress. Rundel et al. reported that species in Dipterocarpaceae such as S. siamensis Miq. and S. obtusa Wall. have a large leaflet area of 47.7 and 17.8 cm2, respectively. They required two times higher transpiration rates (12 μmol m−2 s−1) to prevent heating above ambient temperature compared to small legume leaves such as Dalbergia oliveri with a leaflet area of 3.9 cm2. Sindora siamesis has a small leaflet area of 1.7 cm2, this species might need less transpiration for cooling leaf temperature. This forest, leaf size of D. obtusifolius Teijsm. ex Miq. is about two times larger than leaves of S. siamensis Miq. (data not shown), explaining why D. obtusifolius Teijsm. ex Miq. would need a larger amount of water to cool down leaves during the El Niño. Usually, leaves endure a senescence process before shedding remobilizing the nutrients to other parts of the tree. However, both heat and drought stress can induce premature leaf senescence or even burning damage [55,56], as we observed here for D. obtusifolius Teijsm. ex Miq.. In deciduous tropical forest, the highest concentration of nutrients is found in the foliage. The nutrients from senescing leaves are remobilized for new foliage and to diminish the demand from the soil [57]. Thus, El Niño-induced droughts may alter nutrient remobilization of D. obtusifolius Teijsm. ex Miq. which could in turn further reduce its performance. Thus D. obtusifolius Teijsm. ex Miq. may be more vulnerable to the impact of El Niño-induced drought compared to other co-existing species in this DDF.
Clustering analysis particularly relevant to distinguish a species from others based on their responses to drought. For example, L. coromandelica (Houtt.) Merr. showed complete deciduousness during the dry season of both El Niño and non-El Niño events. This species was always distinguished from the other species in the clustering analyses, irrespective of its phenophase (mature leaf, leaf senescence or leafless stage). This species had also the lowest wood density of 0.54 g/cm3 and a stem succulent characteristic. Leaf fall of L. coromandelica (Houtt.) Merr. occurred during the transition period from rainy season to dry season which was the earliest compared to other species. Early leaf fall in the species with low wood density was also reported, e.g., for Jatropha mollissima (Pohl) Baill. and Commiphora leptophloeos (Mart.) Gill. [58]. In TDFs, to better cope with drought the deciduous species are generally characterized by short leaf lifespan with low wood density. This is because of a unique characteristic of wide vessels with thin walls that lead to high hydraulic efficiency of such species [59]. In addition, the stem succulent species have the highly effective strategies against drought as they can use to some extent the water storage in the stem to keep their metabolic activities even under intense drought. This plant type normally succeeds as a pioneer species [27]. Water residence time of stem succulent and deciduous species were reported to be twice longer than that the ones of evergreen species while differences in soil moisture did not significantly affect tree water residence times [60]. These characteristics of stem, lifespan of leaves, and wood density can explain why the leaf phenology of L. coromandelica (Houtt.) Merr. was not significantly affected by the strong 2015/2016 El Niño.
The clustering analysis also allows us to tease apart Sindora siamensis Teijsm. ex Miq. and E. succirubrum Gagnep. from the other species when considering the stage of new leaf flushing. Sindora siamensis Teijsm. ex Miq. showed the earliest leaf emergence and the longest lifespan compared to other species, whereas E. succirubrum Gagnep. exhibited a contrasting response to El Niño by advancing the leaf emergence. The highest wood density reflecting cavitation resistance of E. succirubrum Gagnep. might have an important role on their leaf flushing that does not respond to the amount and time of rainfall. On the other hand, Sindora siamensis Teijsm. ex Miq. was able to flush with a little amount of rainfall of approximately 2.5 mm in March 2016 amid of the El Niño event and increasing day length. Rivera et al. reported that increasing day length of 30 min or less could induce spring flushing in some TDF species before the first rains of the wet season [61].
Leaf emergence of species with high wood density was shown to be strongly dependent on rainfall in shrubs of desert in Utah, whereas leaf emergence of low wood density species was reported to be influenced by photoperiod [43]. Species with high wood density have a different strategy to cope with severe drought compared to stem succulent species, as they have a thicker cell wall and/or narrower conduits providing a high resistance to xylem embolism (air bubbles breaking the water column) [43]. For instance, tree species with high wood density were able to survive the severe drought event induced by the strong 1997-1998 El Niño whereas high mortality rate was observed in lower wood density species in Bornean tropical rainforest [62]. Furthermore, the size of DDF species has no effect on wood density, except S. obtusa Wall. that has a positive relationship between tree diameter and wood density [29]. Thus, drought resistance in DDF might be the results of the different strategies adopted in terms of the hydraulic and leaf phenology.
Finally, we found that the 2015/2016 El Niño induced higher dieback and mortality rate of the DDF species compared to non-El Niño events, The annual mortality rate found here was comparable with the ones found during the strong El Niño 1997/1998 in lowland dipterocarp forest of Borneo [30]. Generally, the higher mortality rate observed during prolonged drought is due to insufficient soil water supply causing xylem embolism in the crown. In contrast, it was reported in central Panama that the longer annual dry season during El Niño leads to higher deciduousness. This consequently resulted in lower mortality rate and higher light penetration, in turn promoting growth of the understory [63]. Overall, our results suggest that the expected increase in both magnitude and frequency of El Niño in the future decades due to anthropogenic greenhouse warming [10] may increasingly affect secondary DDF with consequences on the ecosystem community structure, biodiversity, and ecosystem services.
5. Conclusions
Our study highlights the strong impact of prolonged drought induced by the 2015/2016 El Niño on the phenology of DDF species with the most visible effect being a greater degree of deciduousness. Most of the species show earlier shedding and delayed leaf emergence at the beginning and at the end of the dry season, respectively, resulting in a longer and greater degree of deciduousness. More importantly, DDF species responded differently to this strong El Niño event, enabling us to cluster them into different groups corresponding to different strategies. For instance, based on leaf phenology and low wood density, the stem succulent was less vulnerable to the prolonged drought. Our results also revealed a high mortality rate during El Niño, confirming the key role of extreme climatic events in shaping plant communities. Quantifying phenological responses of DDF to drought could be relevant for supporting species selection to maintain a high level of forest ecosystem services of the DDF under the expected increase in extreme El Niño events. In addition, the results are useful for forest management in terms of forest fire warning due to massive litterfall during El Niño. For further study, intensive plant mechanism adaptation of each cluster and predicted model of phenological change should be more concerning.
Supplementary Materials
The following are available online at https://www.mdpi.com/1999-4907/10/11/967/s1, Figure S1: Seasonal change in secondary dry dipterocarp forest between dry season 2016/2017 and 2017/2018 during non- El Niño, and dry season 2015/2016 during El Niño, illustrating the shift of earlier end of season and late of start of season leading to greater degree of deciduousness during El Niño event. Figure S2: Optimal number of clusters for four phenological stages including young leaf, mature leaf, scenescense leaf, and leafless indicating that five clusters are suitable for all phenophases. Figure S3: Dendrogram and phenological pattern of young leaves of 12 species that are grouped into five clusters (C1-C5) between March 2015 and April 2018, Figure S4: Dendrogram and phenological pattern of scenescense leaves of 12 species that are grouped into five clusters (C1-C5) between March 2015 and April 2018. Figure S5: Timing of first leaf expansion of four dominant species including S. siamensis Miq., S. obtuse Wall., S. roxburghii G. Don and Sindora siamensis Teijsm. ex Miq. between March and May 2016 (dry season 2015/2016) and 2017 (dry season 2016/2017). Figure S6: Percentage of leaflitter production for five dominant species, other leaves excepting five dominant species and total leaf fall in secondary dry dipterocarp forest. Table S1: The important value index (IVI) of total 21 species in 16 families, and tree size as tree height and diameter breast height (DBH) in the secondary dry dipterocarp forest. Table S2: Dieback (DB) and mortality (MT) rate of 6 dominant species (at least represented by 20 individual trees each) for each wet and dry seasons from 2014 to 2018.
Author Contributions
A.C. and R.K. provided the idea for this research and prepared the original manuscript, Y.V. helped additionally the analysis and interpretation of the results. R.K. collected the microclimate and phenological data in the study site and initial data analysis. R.K. and T.L. implemented the analysis on the clustering.
Funding
This research was in part funded by the International Research Network (IRN), Thailand Research Fund.
Conflicts of Interest
The authors declare no conflict of interest.
References
- Fu, Y.H.; Zhao, H.; Piao, S.; Peaucelle, M.; Peng, S.; Zhou, G.; Ciais, P.; Huang, M.; Menzel, A.; Peñuelas, J.; et al. Declining Global Warming Effects on the Phenology of Spring Leaf Unfolding. Res. Lett. 2015, 526, 104–106. [Google Scholar] [CrossRef] [PubMed]
- Vitasse, Y.; Signarbieux, C.; Fu, Y.H. Global Warming Leads to More Uniform Spring Phenology across Elevations. Proc. Natl. Acad. Sci. USA 2017, 115, 1004–1005. [Google Scholar] [CrossRef] [PubMed]
- Allen, K.; Dupuy, M.; Gei, M.G.; Hulshof, C.; Medvigy, D.; Pizano, C.; Waring, B.G. Will Seasonally Dry Tropical Forests be Sensitive or Resistant to Future Changes in Rainfall Regimes? Environ. Res. Lett. 2017, 12, 023001. [Google Scholar] [CrossRef]
- Richardson, A.D.; Keenan, T.F.; Migliavacca, M.; Ryu, Y.; Sonnentag, O.; Toomey, M. Climate Change, Phenology, and Phenological Control of Vegetation Feedbacks to the Climate System. Agric. For. Meteorol. 2013, 169, 156–173. [Google Scholar] [CrossRef]
- Cleland, E.E.; Chuine, I.; Menzel, A.; Mooney, H.; Schwartz, M.D. Shifting Plant Phenology in Response to Global Change. Trends Ecol. Evol. 2007, 22, 357–365. [Google Scholar] [CrossRef] [PubMed]
- Borchert, R. Induction of Hydration and Bud Break by Irrigation or Rain in Deciduous Trees of a Tropical Dry Forest in Costa Rica. Trees 1994, 8, 198–204. [Google Scholar] [CrossRef]
- Valdez-Hernández, M.; Andrade, J.L.; Jackson, P.C.; Rebolledo-Vieyra, M. Phenology of Five Tree Species of a Tropical Dry Forest in Yucatan, Mexico: Effects of Environmental and Physiological Factors. Plant Soil 2010, 329, 155–171. [Google Scholar] [CrossRef]
- Räsänen, T.A.; Lindgren, V.; Guillaume, J.H.A.; Buckley, B.M.; Kummu, M. On the Spatial and Temporal Variability of ENSO Precipitation and Drought Teleconnection in Mainland Southeast Asia. Clim. Past 2016, 12, 1889–1905. [Google Scholar] [CrossRef]
- Rahmat, R.; Archevarahuprok, B.; Kang, C.P. A Regional Climate Modelling Experiment for Southeast Asia: Using PRECIS Regional Climate Model and Selected CMIP3 Global Climate Models; Centre for Climate Research Singapore of the Meteorological Service Singapore: Singapore, 2014.
- Cai, W.; Borlance, S.; Lengaigne, M.; Van Rensch, P.; Collins, M.; Vecchi, G.; England, M.H. Increasing Frequency of Extreme El Niño Events due to Greenhouse Warming. Nat. Clim. Chang. 2014, 4, 111–116. [Google Scholar] [CrossRef]
- Loo, Y.Y.; Billa, L.; Singh, A. Effect of Climate Change on Seasonal Monsoon in Asia and its Impact on the Variability of Monsoon Rainfall in Southeast Asia. Geosci. Front. 2014, 6, 817–823. [Google Scholar] [CrossRef]
- Sooktawee, S.; Humphries, U.; Limsakul, A.; Wongwises, P. Possible Impacts of Northeast Monsoon on Precipitation and Temperature over the Indochina Peninsula. In Proceedings of the Second Environment Asia International Conference on Human Vulnerability and Global Environmental Change, Chonburi, Thailand, 15–17 May 2013. [Google Scholar]
- Murphy, P.G.; Lugo, A.E. Ecology of tropical dry forest. Annu. Rev. Ecol. Evol. Syst. 1986, 17, 67–88. [Google Scholar] [CrossRef]
- Borchert, R. Soil and Stem Water Storage Determine Phenology and Distribution of Tropical Dry Forest Trees. Ecology 1994, 75, 1437–1449. [Google Scholar] [CrossRef]
- Chen, X.; Wang, L.; Inouye, D. Delayed Response of Spring Phenology to Global Warming in Subtropics and Tropics. Agric. For. Meteorol. 2017, 234, 222–235. [Google Scholar] [CrossRef]
- Stan, K.; Sanchez-Azofeifa, A. Tropical Dry Forest Diversity, Climatic Response, and Resilience in a Changing Climate. Forests 2019, 10, 443. [Google Scholar] [CrossRef]
- Sakai, S.; Kitajima, K. Tropical Phenology: Recent Advances and perspectives. Ecol. Res. 2019, 34, 50–54. [Google Scholar] [CrossRef]
- Khamyong, N.; Wangpakapattanawong, P.; Chairuangsri, S.; Inta, A.; Tiansawat, P. Tree Species Composition and Height-Diameter Allometry of Three Forest Types in Northern Thailand. CMU J. Nat. Sci. 2018, 17, 289–306. [Google Scholar] [CrossRef]
- Wohlfart, C.; Wegmann, M.; Leimgruber, P. Mapping Threatened Dry Deciduous Dipterocarp Forest in Southeast Asia for Conservation Management. Trop. Conserv. Sci. 2014, 7, 597–613. [Google Scholar] [CrossRef]
- U.S. DOE (Department of Energy). Research Priorities for Tropical Ecosystems under Climate Change Workshop Report, DOE/SC-0153 U.S.; Department of Energy Office of Science: Germantown, MD, USA, 2012.
- Nguyen, T.T.; Baker, P.J. Structure and Composition of Deciduous Dipterocarp Forests in Central Vietnam: Patterns of Species’ Dominance and Regeneration Failure. Plant Ecol. Divers. 2016, 9, 589–601. [Google Scholar] [CrossRef]
- Rundel, P.; Boonpragob, K.; Patterson, M. Seasonal Water Relations and Leaf Temperature in a Deciduous Dipterocarp Forest in Northeastern Thailand. Forests 2017, 8, 368. [Google Scholar] [CrossRef]
- Estoque, R.C.; Gomi, K.; Togawa, T.; Ooba, M.; Hijioka, Y.; Akiyama, C.M.; Kuroda, K. The Future of Southeast Asia’s Forests. Nat. Commun. 2019, 692, 903–916. [Google Scholar] [CrossRef]
- Powers, J.S.; Marín-Spiotta, E. Ecosystem Processes and Biogeochemical Cycles in Secondary Tropical Forest Succession. Annu. Rev. Ecol. Evol. Syst. 2017, 48, 497–519. [Google Scholar] [CrossRef]
- Borchert, R. Responses of Tropical Trees to Rainfall Seasonally and Its Long-Term Changes. Clim. Chang. 1998, 39, 381–393. [Google Scholar] [CrossRef]
- Lopez-Iglesias, B.; Villar, R.; Poorter, L. Functional Traits Predict Drought Performance and Distribution of Mediterranean Woody Species. Acta Oecol. 2014, 56, 10–18. [Google Scholar] [CrossRef]
- Worbes, M.; Blanchart, S.; Fichtler, E. Relations between Water Balance, Wood Traits and Phenological Behavior of Tree Species from a Tropical Dry Forest in Costa Rica-a Multifactorial Study. Tree Physiol. 2013, 33, 527–536. [Google Scholar] [CrossRef] [PubMed]
- Markesteijn, L.; Poorter, L.; Paz, H.; Sack, L.; Bongers, F. Ecological Differentiation in Xylem Cavitation Resistance is Associated with Stem and Leaf Structural Traits. Plant Cell Environ. 2011, 34, 137–148. [Google Scholar] [CrossRef]
- Kenzo, T.; Sano, M.; Yoneda, R.; Chann, S. Comparison of Wood Density and Water Content between Dry Evergreen and Dry Deciduous Forest Trees in Central Cambodia. Jpn. Agric. Res. Q. 2017, 51, 363–374. [Google Scholar] [CrossRef]
- Itoh, A.; Nanami, S.; Harata, T.; Ohkubo, T.; Tan, S.; Chong, L.; Yamakura, T. The Effect of Habitat Association and Edaphic Conditions on Tree Mortality during El Niño-induced Drought in a Bornean Dipterocarp Forest. Biotropica 2012, 44, 606–617. [Google Scholar] [CrossRef]
- Nakagawa, M.; Tanaka, K.; Nakashizuka, T.; Ohkubo, T.; Kato, T.; Maeda, T.; Teo, S. Impact of Severe Drought Associated with the 1997–1998 El Niño in a Tropical Forest in Sarawak. J. Trop. Ecol. 2000, 16, 355–367. [Google Scholar] [CrossRef]
- Rodriguez-Zaccaro, F.D.; Groover, A. Wood and Water: How Trees Modify Wood Development to Cope with Drought. Plants People Planet 2019. [Google Scholar] [CrossRef]
- Álvarez-Yépiz, J.C.; Martínez-Yrízar, A.; Fredericksen, T.S. Special Issue: Resilience of Tropical Dry Forests to Extreme Disturbance Events. For. Ecol. Manag. 2018, 426, 1–6. [Google Scholar] [CrossRef]
- L’Heureux, M.L.; Takahashi, K.; Watkins, A.B.; Barnston, A.G.; Becker, E.J.; Di Liberto, T.E.; Mosquera-Vásquez, K. Observing and Predicting the 2015/16 El Niño. Bull. Am. Meteorol. Soc. 2017, 98, 1363–1382. [Google Scholar] [CrossRef]
- Hanpattanakit, P. Temporal Variations of Soil Respiration in a Dry Dipterocarp Forest. Ph.D. Thesis, King Mongkut’s University of Technology Thonburi, Bangkok, Thailand, 2013. [Google Scholar]
- Phillips, E.A. Methods of Vegetation Study; Henery Halt and Co. Inc.: New York, NY, USA, 1959; p. 107. [Google Scholar]
- Shannon, C.E.; Weaver, W. The Mathematical Theory of Communication; Communication Research; The University of Illinois Press: Urbana, IL, USA, 1964; p. 125. [Google Scholar]
- Simpson, E.H. Measurement of Diversity. Nature 1949, 163, 688. [Google Scholar] [CrossRef]
- Hill, M.O. Diversity and Evenness: A Unify, Notation and its Consequences. Ecology 1973, 54, 427–432. [Google Scholar] [CrossRef]
- Kuaraksa, C.; Elliott, S.; Hossaert-Mckey, M. The Phenology of Dioecious Ficus spp. Tree Species and its Importance for Forest Restoration Projects. For. Ecol. Manag. 2012, 265, 82–93. [Google Scholar] [CrossRef]
- Kassambara, A. Determining the Optimal Number of Clusters: 3 Must Know Methods. Available online: https://www.datanovia.com/en/lessons/determining-the-optimal-number-of-clusters-3-must-know-methods/ (accessed on 30 November 2018).
- Murtagh, F.; Legendre, P. Ward’s Hierarchical Agglomerative Clustering Method: Which Algorithms Implement Ward’s Criterion? J. Classif. 2014, 31, 275–295. [Google Scholar] [CrossRef]
- Hacke, U.G.; Sperry, J.S.; Pittermann, J. Drought Experience and Cavitation Resistance in Six Shrubs from the Great Basin, Utah. Basic Appl. Ecol. 2000, 1, 31–41. [Google Scholar] [CrossRef]
- NOAA (National Oceanic and Atmospheric Administration). Multivariate ENSO Index Version 2 (MEI.v2). Available online: https://www.esrl.noaa.gov/psd/enso/mei/ (accessed on 20 June 2019).
- R Core Team. A Language and Environment for Statistical Computing; R Core Team: Vienna, Austria, 2017. [Google Scholar]
- Tanaka, N.; Kume, T.; Yoshifuji, N.; Tanaka, K.; Takizawa, H.; Shiraki, K.; Suzuki, M. A Review of Evapotranspiration Estimates from Tropical Forests in Thailand and Adjacent Regions. Agric. For. Meteorol. 2008, 148, 807–819. [Google Scholar] [CrossRef]
- Kirtphaiboon, S.; Wongwises, P.; Limsakul, A.; Sooktawee, S.; Humphries, U. Rainfall Variability over Thailand Related to the El Nino-Southern Oscillation ENSO). J. Sustain. Energy Environ. 2014, 5, 1–6. [Google Scholar]
- NOAA (National Oceanic and Atmospheric Administration). Cold and Warm Episodes by Season. Available online: https://origin.cpc.ncep.noaa.gov/products/analysis_monitoring/ensostuff/ONI_v5.php (accessed on 30 December 2018).
- Trisurat, Y.; Alkemade, R.; Arets, E. Projecting Forest Tree Distributions and Adaptation to Climate Change in Northern Thailand. J. Ecol. Nat. Environ. 2009, 1, 55–63. [Google Scholar]
- Elliott, S.; Baker, P.J.; Borchert, R. Leaf Flushing during the Dry season: The Paradox of Asian Monsoon Forests. Glob. Ecol. Biogeogr. 2006, 15, 248–257. [Google Scholar] [CrossRef]
- Limsakul, A.; Singhruck, P. Long-Term Trends and Variability of Total and Extreme Precipitation in Thailand. Atmos. Res. 2016, 169, 301–317. [Google Scholar] [CrossRef]
- Cleland, E.E.; Allen, J.M.; Crimmins, T.M.; Dunne, J.A.; Pau, S.; Travers, S.E.; Wolkovich, E.M. Phenological tracking enables positive species responses to climate change. Ecology 2012, 93, 1765–1771. [Google Scholar] [CrossRef] [PubMed]
- Ishida, A.; Yamazaki, J.Y.; Harayama, H.; Yazaki, K.; Ladpala, P.; Nakano, T.; Maeda, T. Photoprotection of Evergreen and Drought-Deciduous Tree Leaves to Overcome the Dry Season in Monsoonal Tropical Dry Forests in Thailand. Tree Physiol. 2013, 43, 15–28. [Google Scholar] [CrossRef] [PubMed]
- Ishida, A.; Diloksumpun, S.; Ladpala, P.; Staporn, D.; Panuthai, S.; Gamo, M.; Puangchit, L. Contrasting Seasonal Leaf Habits of Canopy Trees between Tropical Dry-Deciduous and Evergreen Forests in Thailand. Tree Physiol. 2006, 26, 643–656. [Google Scholar] [CrossRef] [PubMed]
- Milla, R.; Castro-Díez, P.; Maestro-Martínez, M.; Montserrat-Martí, G. Relationships between Phenology and the Remobilization of Nitrogen, Phosphorus and Potassium in Branches of Eight Mediterranean Evergreens. New Phytol. 2005, 168, 167–178. [Google Scholar] [CrossRef] [PubMed]
- Estiarte, M.; Penuelas, J. Alteration of the Phenology of Leaf Senescence and Fall in Winter Deciduous Species by Climate Change: Effects on Nutrient Proficiency. Glob. Chang. Biol. 2015, 21, 1005–1017. [Google Scholar] [CrossRef]
- Gautam, T.P.; Mandal, T.N. Storage and Flux of Nutrients in Disturbed and Undisturbed Tropical Moist Forest of Eastern Nepal. Int. J. For. Res. 2018. [Google Scholar] [CrossRef]
- Lima, A.L.A.; Rodal, M.J.N. Phenology and Wood Density of Plants Growing in the Semi-arid Region of Northeastern Brazil. J. Arid Environ. 2010, 74, 1363–1373. [Google Scholar] [CrossRef]
- Méndez-Alonzo, R.; Paz, H.; Zuluaga, R.C.; Rosell, J.A.; Olson, M.E. Coordinated Evolution of Leaf and Stem Economics in Tropical Dry Forest Trees. Ecology 2012, 93, 2397–2406. [Google Scholar] [CrossRef]
- Graefe, S.; Fang, D.; Butz, P. Water Residence Times in Trees of a Neotropical Dry Forest. Trees 2019, 33, 1225–1231. [Google Scholar] [CrossRef]
- Rivera, G.; Elliott, S.; Caldas, L.S.; Nicolossi, G.; Coradin, V.T.R.; Borchert, R. Increasing Day-Length Induces Spring Flushing of Tropical Dry Forest Trees in the Absence of Rain. Trees 2002, 16, 445–456. [Google Scholar] [CrossRef]
- Hiromi, T.; Ichie, T.; Kenzo, T.; Ninomiya, I. Interspecific Variation in Leaf Water Use Associated with Drought Tolerance in Four Emergent Dipterocarp Species of a Tropical Rain Forest in Borneo. J. For. Res. 2012, 17, 369–377. [Google Scholar] [CrossRef]
- Condit, R.; Aguilar, S.; Hernandez, A.; Perez, R.; Lao, S.; Angehr, G.; Foster, R.B. Tropical Forest Dynamics across a Rainfall Gradient and the Impact of an El Niño Dry Season. J. Trop. Ecol. 2004, 20, 51–72. [Google Scholar] [CrossRef]
© 2019 by the authors. Licensee MDPI, Basel, Switzerland. This article is an open access article distributed under the terms and conditions of the Creative Commons Attribution (CC BY) license (http://creativecommons.org/licenses/by/4.0/).