Article

Factors Affecting the Chipping Operation Based on the Screen Size of the Drum Chipper

1
Forest Technology and Management Research Center, National Institute of Forest Science, 498 Gwangneungsumogwon-ro, Soheul-eup, Pocheon 11186, Korea
2
Department of Biosystems Engineering, Kangwon National University, 1 Gwangwondaehakgil, Chuncheon 24341, Korea
3
Department of Forestry, Korea National College of Agriculture and Fisheries, 1515 Kongjwipatwji-ro, Deokjin-gu, Jeonju 54874, Korea
*
Author to whom correspondence should be addressed.
Forests 2019, 10(11), 1029; https://doi.org/10.3390/f10111029
Submission received: 27 September 2019 / Revised: 25 October 2019 / Accepted: 13 November 2019 / Published: 15 November 2019
(This article belongs to the Section Forest Ecology and Management)

Abstract

:
Forest biomass has recently been highlighted as a renewable energy source in South Korea. As the Renewable Energy Certificate weight has been revised to encourage the use of forest biomass for energy production, forest operations have focused on the development of new technologies and harvesting methods for the extraction and utilization of forest biomass. This study examined the application of a drum chipper to forest biomass and analyzed the effects of screen size (40, 50, 65, and 80 mm) on productivity, cost, and particle size distribution. When the screen size was 40 mm to 65 mm, the chipping productivity improved by up to 3.6 times, the fuel consumption decreased by up to 29.7%, and the chipping cost was reduced by up to 31.9%. The fines content tended to decrease with an increase in screen size. The size of woodchips was less than 100 mm in length and ranged from 10 to 63 mm. The 65 mm screen was the most effective (e.g., producing optimal wood chip size at an acceptable production rate) for the chipping operation. Harvesting methods and drying time are also important factors that determine the utilization efficiency of forest biomass. Therefore, further research should be focused on the effect of moisture content on chipping productivity, power required, and fine particle size in forest biomass productions.

1. Introduction

Due to the successful forest rehabilitation project and continuous afforestation in South Korea, forests with mature stands occupy 72.1% of the entire forest area. As the mature stands become dominant, forest operations such as clear cutting and thinning operations tend to gradually increase [1]. Although demand for wood has increased, most of the richer countries’ policies have been to mainly export wood products. The Korea Forest Service (KFS) is going to increase the self-sufficiency ratio of timber from 16.3% (2017) to 25.0% (2035). The production and use of wood are expected to increase [1]. The demand for forest biomass (such as wood chips and pellets) is on the rise and is diversified into Combined Heat and Power (CHP) generation and heating for rural communities in South Korea [2].
Since 2012, the mandatory Renewables Portfolio Standard (RPS) requires each power utility to generate a certain percentage of power using renewable energy. However, despite an increase in the demand for forest biomass, the management infrastructure has not been sufficiently established. Therefore, extracting forest biomass (small frees, tops, branches, etc.) is still costly, and only a part of afforestation products is collected. In practice, with a cut-to-length harvesting system using a grappled loader, which extracts logs and biomass separately, most of the timber production costs are high in South Korea. Thus, extracting and utilizing forest biomass is not economically feasible [3,4]. As for all the forest projects, in 2017, the total cut volume was approximately 6.75 million cubic meters, and the harvested volume was approximately 4.7 million cubic meters in South Korea. In other words, approximately 30% of the cut volume was left on forest lands because of the high cost of extraction. Only approximately 18.8% of products derived from afforestation are harvested and utilized [5]. Collecting and using forest biomass from thinning as a whole-tree have the potential to solve the shortages of energy fuels or industrial materials.
This study examined chips produced for fuel from unused forest biomass as heat energy sources. In South Korea, wood chips are used for fuel (65.5%), boards (34.5%), and pulp (21.8%), and the wood chips for fuel account for 75% of the total distribution, followed by those for boards (41.7%) and those for pulp (8.3%). Thus, wood chips for fuel occupy the largest proportion both in production and distribution [6]. The primary source material of wood chips has been saw logs. However, as the Renewable Energy Certificate (REC) weight has increased, the demand for wood chips for fuel, which are made of unused forest biomass, is expected to rise.
Many studies have attempted to improve the economy of the chipping operation and the quality of wood chips using various woodchippers. Nati et al. [7,8] evaluated the quality of wood chips and the fuel consumption of the chipping operation according to productivity, moisture content, and particle size distribution, which are influential factors for producing fuel chips from forest biomass. The authors used a drum chipper and a disc chipper to process logging residues. The results showed that blunt blades, rather than sharp ones, decreased productivity and increased fuel consumption, and the disc chipper produced higher quality wood chips. When an open drum chipper was used, both productivity and fuel consumption improved in proportion to the screen size and the percentage of effective chip size was increased [9]. Spinelli and Hartsough [10] developed a wood chipping model that was configured from the most influential factors for estimating the productivity of a woodchipper, which were the engine power of the woodchipper, the size of woodchips, the chipping site, and the input equipment. Among the major influential factors for the productivity of the chipping operation, Spinelli and Visser [11] analyzed (personal, operational, and mechanical) delay times. It was reported that the delay time accounted for 73.8% of the chipping operation on average and was primarily caused by personal factors. Accordingly, the improvement of personal delay time could significantly enhance productivity. Yoshida et al. [12] attempted to evaluate the performance of a mobile chipper objectively. They evaluated the productivity of five types of mobile woodchippers by implementing a simulation model for each engine power. The results indicated that a large amount of raw materials would be needed to sustain chipping operations.
In South Korea, a few studies examined the application of a woodchipper with respect to the productivity enhancement, cost reduction, and characteristics of wood chips. Hwang [13] analyzed the productivity, cost, and particle size distribution of wood chips, produced by using a woodchipper processing forest biomass. Cha et al. [14] examined the particle size distribution and the power requirement according to the conditions of a woodchipper. The power requirement changed according to the input angle of the woodchipper, but the particle size distribution was not affected. Mun [15] pointed out that a whole-tree harvesting system needs to be preferentially applied to utilize logging residues as forest biomass.
In addition, in South Korea, according to a survey of wood fuel energy companies, the moisture content, wood chip size, and ash content of wood chips need to be maintained at approximately 25–30%, 50–80 mm, and less than 10%, respectively.
The aim of the study was to infer the effect of four screen sizes (40, 50, 65, and 80 mm) on the chipping operation productivity, cost, fuel consumption, number of feedings per hour, weight per turn, and wood chip particle size distribution for forest biomass.

2. Materials and Methods

2.1. Study Area and Raw Materials

The study area was located in 1533-4, Yoochon-ri, Gandong-myeon, Hwacheon-gun, and Gangwon-do (38°03′10.7″ N 127°47′26.5″ E). The organizations in Hwacheon purchased about 400 tonnes of forest biomass from the school of the Seoul Metropolitan Office of Education (SOME) in South Korea for $22.7/ton. As the organizations could not shred biomass into wood chips on their own, the biomass purchased for this study was composed of miscellaneous trees and had been naturally air dried and left stacked at the site for approximately two years (Figure 1).

2.2. Chipping Operation Using a Drum Chipper

A drum chipper (645T, KESLA, Joensuu and Finland) was used for the test. The drum chipper was operated using the PTO (Power Take-Off) of a 203 horsepower forestry tractor (203T, VALTRA, Suolahti and Finland) and was equipped with a crane and a log grapple (Figure 2). The drum had a diameter of 570 mm and 6 blades (3 blades on the right and left sides, respectively). The screen could be attached between the drum and the outlet of chips.

2.3. Chipping Operation Method

The chipping operation was done to analyze the productivity and cost of wood chips by the screen size (40, 50, 65, and 80 mm) of the drum chipper. The reason for the different screen sizes was that it was the size that consumers could select and use.
The process of the chipping operation was examined by applying the time and motion study method and measuring the sequential operations by means of a stopwatch. The chipping operation was analyzed based on the productive time (ton per hour) only. This study was focused on how different the productivity, fuel consumption, number of feedings per hour, and weight per turn of the chipping operation by screen size were.
The amount of wood chips produced was measured using a 7.5 ton arm-roll truck (FP7.5EM-H11, Finemotors, Gwangju and South Korea) with a 15 m3 loading bay. After the loading bay was filled with wood chips, the truck was driven onto a scale (CAS RW-10L) for measurement (Figure 3). The chipping operation was surveyed for operation time and production weight through three repetitions by each screen size. The fuel consumption of the tractor that powered the drum chipper was measured by a tractor fuel digital indicator. In addition, a new set of blades was used for each screen size during the test.

2.4. Sampling and Physical Properties’ Methods of the Wood Chips

After the chipping operation was complete, wood chip samples were collected from the front, middle, and end areas of the load bay and then stored in three paper bags for moisture content and a 20 L gunny sack for particle size distribution. To measure the moisture content of the wood chips, the samples were put into a dryer (LBV-100, Jeio Tech, Daejeon and South Korea) and left there for 24 h at 105 °C. The weight of the wood chips was measured using an electronic scale (XB4200HX, CAS, Yangju and South Korea) (18134-1, ISO, Genevaand Switzerland). To measure the particle size distribution of the wood chips, the particle sizes were classified into less than 5 mm (fines), 5 < Ø ≤ 10 mm (small sized chips), 10 < Ø ≤ 45 mm (medium sized chips), 45 < Ø ≤ 63 mm (large sized chips), and over 63 mm (oversized particles) in accordance with ISO 3310-2. The wet-basis moisture content was controlled at 20% and below to prevent particles from sticking together during the test. The particle size distribution test was performed using a vibrating screener (RP-10, CISA, Barcelonaand Spain), and then, the weights for each particle size class were measured (Figure 4).

2.5. Statistical Analysis

A statistical analysis was conducted on the productivity, fuel consumption, moisture content, number of feedings, weight of feeding per hour, and weight per turn data in order to identify influential factors affecting the chipping productivity based on the screen size of the drum chipper. SPSS 23.0 (IBM Inc., Armonk, Ny, USA) was used to perform the statistical analysis. Influential factors were statistically identified by performing a one-way ANOVA analysis and Duncan’s multiple range test (α = 0.05).

3. Results and Discussions

3.1. Analysis of Productivity and Fuel Consumption of the Chipping Operation by Screen Size

Table 1 shows the average and standard deviation of the productivity, fuel consumption, number of feedings per hour, weight per turn, and operation cost of chipping operation by screen size. The analysis revealed that productivity showed a tendency to decrease as fuel consumption increased. The productivity and cost of the chipping operation were 11.3 oven dry ton (odt)/h and $19.4/odt at 65 mm. This was the most efficient (Table 1). In addition, the lowest fuel consumption (2.6 liters/odt) was when the sizes were 65 and 80 mm (Figure 5).
It is generally known that productivity increases and fuel consumption decreases as the screen size increases for a drum chipper with increasing size of the chipper [9,16]. As such, to analyze the effect of the screen size, one-way ANOVA analysis was conducted on productivity and fuel consumption. The analysis of the results showed that there were statistically significant differences depending on the screen size (Table 2). When post hoc tests were conducted using Duncan’s multiple range test, it was found that 40 and 50 mm, as well as 65 and 80 mm belonged to the same groups, respectively (Table 3).
According to the previous studies, Eliasson et al. [9] conducted research using a drum chipper (645, KESLA, Joensuu and Finland) and found that the operation productivity was increased by up to 2.2 times and fuel consumption decreased by up to 57.1% depending on the screen size (25, 50, and 100 mm). Roser et al. [16] conducted research using a drum chipper (C4560, KESLA, Joensuu and Finland) with screens and found that productivity was decreased by 47 m3 as the screen size (35 and 80 mm) decreased. Although these results may slightly vary depending on the moisture content and the shape of the raw materials, productivity tended to increase and fuel consumption tended to decrease as the screen size increased. Nati et al. [7] reported that productivity and fuel consumption efficiency increased as the screen size increased for woodchippers with screens mounted on the bottom, respectively. In this study, it was found that productivity was higher at 65 mm than 80 mm, which was the largest screen size, and fuel consumption was similar. As 65 and 80 mm were in the same group from a statistical perspective, however, the tendency that productivity increased and fuel consumption decreased as the screen size increased was also found in this study as in the previous studies.

3.2. Analysis of Productivity and Fuel Consumption of the Chipping Operation by the Number of Feedings and Screen Size

An analysis was conducted considering the number of feedings per hour as a factor that affects the productivity and fuel consumption of the chipping operation. It was found that the effect of the number of feedings per hour exhibited statistically significant differences depending on the screen size (Table 4), and two number of feedings per hour groups were found (Table 5).
The analysis results showed that when the number of feedings per hour was lowest for the same screen for a screen size of 40 mm, productivity was lowest (Figure 6).
Although the number of feedings per hour for 50 mm was similar to that of 40 mm, the weight per turn amount of 50 mm was higher than that of 40 mm, thereby resulting in higher productivity (Table 1). When the number of feedings per hour was lowest for the same screen for a screen size of 50 mm, productivity was found to be highest, as opposed to for 40 mm. The effect of the weight per turn exhibited no statistically significant difference depending on the screen size (Table 6).
This is because the number of feedings per hour was directly related to productivity. In particular, when the size was 65 mm, the weight per turn was 0.053 odt, which was lower than the 0.059 odt/turn when the size was 80 mm, and the number of feedings per hour was higher. Moreover, high productivity can be indirect evidence of the fact that it is beneficial to increase the number of feedings per hour within the range that can be accepted by the drum chipper. These results are similar to those of Rose et al. [16], who showed that the number of feedings per hour and the operating time of the woodchipper were related to productivity and that the crane operation was affected by screen size. It was found that the average fuel consumption was affected more by the screen size than by the number of feedings per hour as with productivity (Figure 7).
When the sizes were 65 and 80 mm, for which the number of feedings per hour was highest, the lowest fuel consumption was observed, and it was found that fuel consumption decreased as the number of feedings per hour increased for the same screen. When the sizes were 40 and 50 mm, however, the average fuel consumptions were found to be 3.7 and 3.5 liters/odt. This appears to be because the power transmission load increased as the screen size decreased due to the continuous raw material input, while the residence time of the produced wood chips in the chipper rotor was increased. These results are similar to those of Eliassion et al. [9] that fuel consumption increased as the screen size decreased during the chipping operation and fuel consumption was affected by the screen sizes. Therefore, further research is required considering factors affecting the chipping operation in addition to the application of a system capable of inputting the same amount and the measurement of the subsequent power transmission torque to identify the effects of factors such as the screen size and moisture content on the number of feedings per hour.

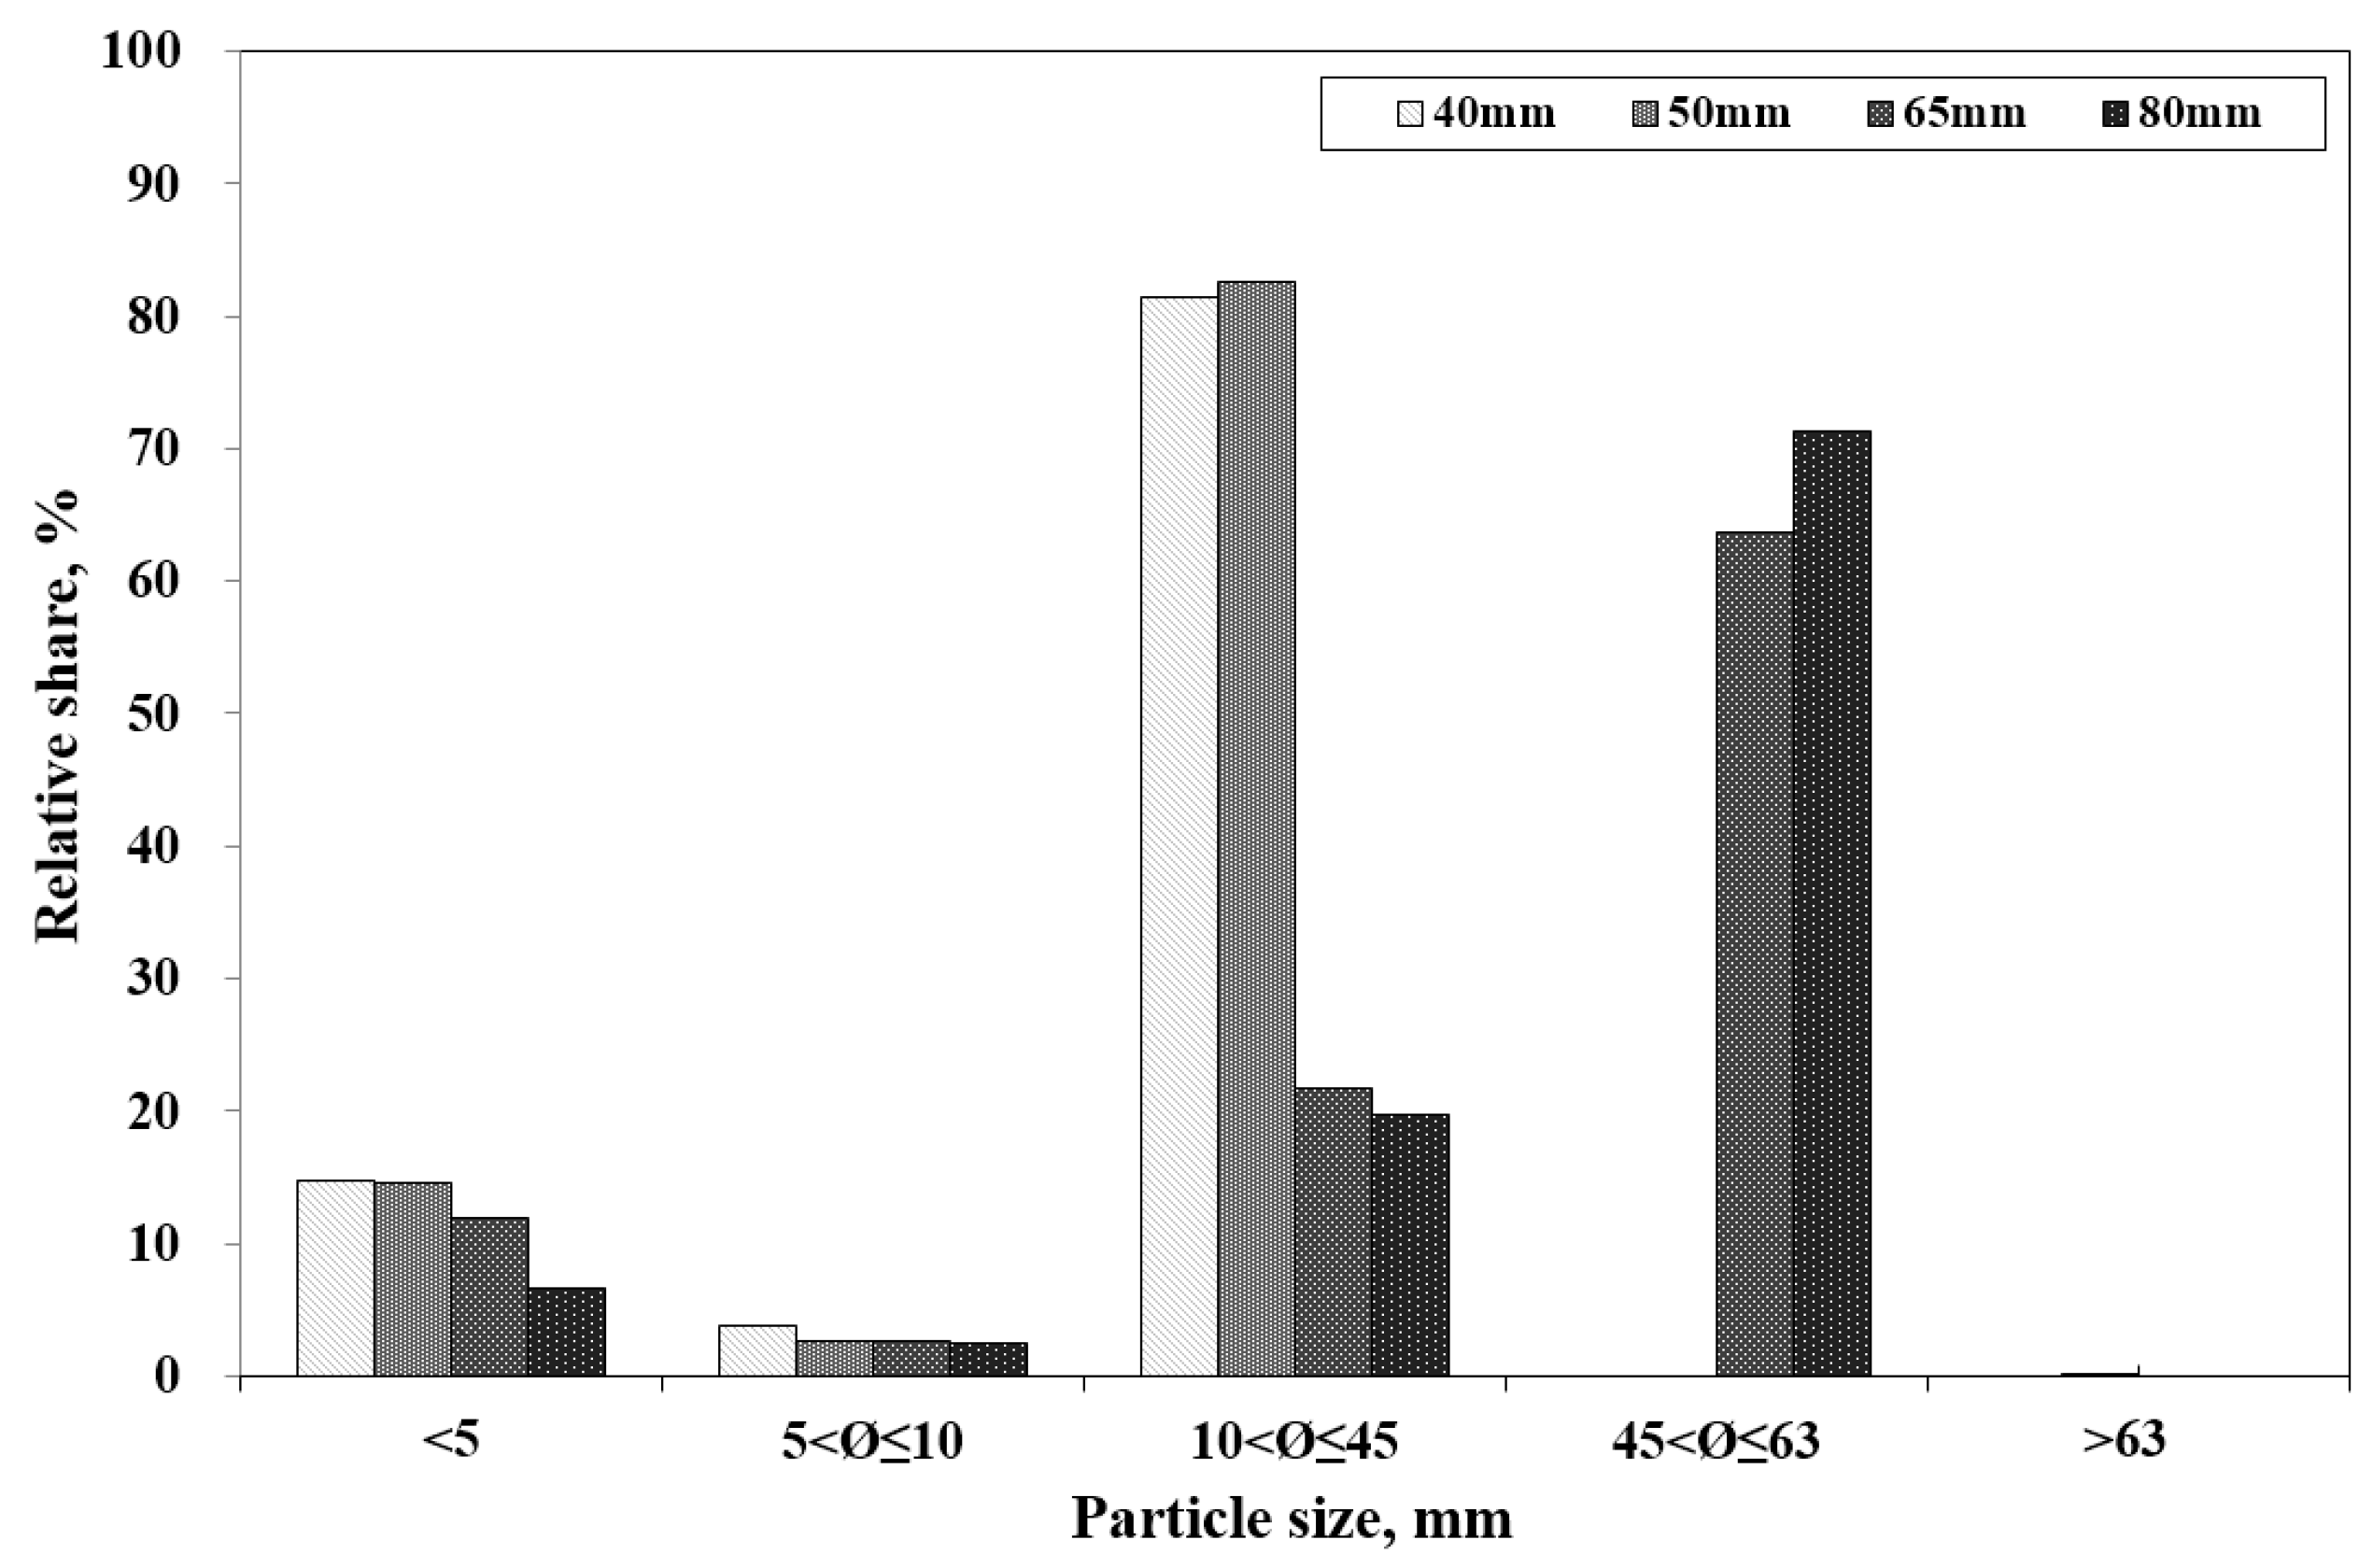
3.3. Analysis of the Particle Size Distribution of Wood Chips by Screen Size

The particle size distribution of wood chips was analyzed according to the screen size of the drum chipper. No chip with a size of 63 mm or larger was shown in the analysis of the particle size distribution by screen size (Figure 8). When the screen sizes were 65 mm and 80 mm, the distributions of the particle size of 45 < Ø ≤ 63 mm were 63.6% and 71.3%, respectively.
Wood chips with a particle size of 10 < Ø ≤ 45 mm accounted for at least 80% of the total when the 40 mm screen and 50 mm screen were used. For these screen sizes, no chips were 45 < Ø ≤ 63 mm. This particle size of 45 < Ø ≤ 63 mm appeared when the 65 mm screen and 80 mm screen were used. Wood chips with a particle size of 5 < Ø ≤ 10 mm mostly appeared for the smallest screen size, the 40 mm sieve (3.7%). Fines with a particle size of 5 mm and below mostly occurred for the 40 mm screen (14.8%) and 50 mm screen (14.6%), but decreased to 11.9% and 6.6% for the 65 mm screen and an 80 mm screen, respectively (Figure 8). The distribution of these fines tended to increase along with the decrease of the screen size. The distribution of the particle size of 10 < Ø ≤ 45 mm tended to decrease along with the increase of screen size. This is because the retention time of chips in the rotor was reduced along with the increase of the screen size.

3.4. Improvement of Wood Chips’ Quality by Screen Size

The wood chips’ size distribution and moisture content are especially important factors for using wood chips as fuel [9]. Currently, the Specifications and Quality Requirements for Wood Products (2018) proposed by the National Institute of Forest Science [17] require that the fines content of wood chips should be less than 5% of the total weight based on the weight of wet matter. According to ISO 17827-1, the moisture content of wood chips should not exceed 60%, and when the particle size is property classes P16S, the moisture content needs to be less than 15%, and otherwise less than 10%. However, this study applied the National Institute of Forest Science requirements to the analysis of the particle size distribution.
As shown in Table 1, the fines content according to screen size was at least 5%. When the screen size was 40 mm, the fines content was highest, the productivity was lowest, and a high cost was demanded. Besides, in general, the five types of screen sizes did not satisfy the requirements. A screening operation is needed to solve this problem.
Oh et al. [2] analyzed the particle size distributions before and after a screening operation for wood chips that had been produced by a cut-to-length harvesting system. The fines content before the screening operation was 10.7%, but decreased to 1.4% after the screening operation. In other words, the fines content was reduced by about 87.0%. Accordingly, productivity and cost were analyzed again by considering the screening operation and the fines content of less than 5% (Table 6).
Based on the cost calculation for a screening operation presented by Korea Forest Service [18], the cost ($/odt) of the screening operation for this study was recalculated by considering the moisture content during the chipping operation.
When the fines content was less than 5%, the cost of the chipping operation, with the 40 mm screen which was the highest cost decreased by 10.2%, respectively. In this case, since the screening operation was included, the total unit cost was $ 43.9/odt, which was higher than before the screening operation by 30.6%. Moreover, as the screen size increased, the productivity and cost of the chipping operation tended to increase and decrease, respectively by conducting the screening operation (Table 7).
Forest biomass includes much ash and many leaves, which results in a high nitrogen content. Besides, the on-site treatment also causes the ingress of foreign substances. Accordingly, forest biomass as fuel creates many problems. However, if forest biomass is used as an energy source immediately after a logging operation, a drying cost, as well as an additional cost of a screening operation are required, which aim to satisfy the requirements regarding the size and ash content of wood chips. Thus, several additional costs may occur.
In this regard, the whole-tree harvesting system, which can reduce the ingress of foreign substances during extraction, needs to be applied to utilize wood chips made of forest biomass efficiently. A further study is also needed to decrease the drying cost by prediction of the moisture content according to drying time after the logging operation.

4. Conclusions

Recently, interest in the production of renewable energy using forest biomass has been increasing. The Renewable Energy Certificate (REC) weight revision is changing the flow of the forestry market for the extraction and utilization of unused forest biomass.
This study aimed to establish an efficient method of producing wood chips. Accordingly, this study inferred the effect of screen size (40, 50, 65, and 80 mm) on the chipping operation productivity and cost, fuel consumption, number of feedings per hour, weight per turn, and wood chip particle size distribution for forest biomass.
When it comes to the chipping operations, most of the studies showed that productivity increased and fuel consumption decreased as the screen size increased for most woodchippers with a screen. In this study, it was found that productivity was higher and fuel consumption was lower at 65 mm, rather than at 80 mm, which was the largest screen size, when the chipping operation was analyzed using four different screen sizes (40, 50, 65, and 80 mm). It appeared that productivity was higher at a screen size of 65 mm than at 80 mm because the number of feedings per hour was higher, and the arrangement of raw materials (diameter distribution and composition ratio) and the skill of the operator (less than one year) most directly affected productivity and fuel consumption at the time of the chipping operation. In addition, it was determined that the number of feedings per hour was important for the chipping operation. As for the particle size distribution of wood chips thus produced, the fines content was at least 5% for every screen size. However, the wood chips were so uniform that no particle size of over 100 mm appeared. Accordingly, the particle size was categorized to be 10–63 mm. When the screen size increased, the cost of the chipping operation decreased. To solve this problem, a screening operation for wood chips was considered.
The results of the re-analysis showed that, when the screen size was 40 mm, the productivity of chipping operations was increased by 10.8% and the cost of chipping operations decreased by 10.2%. Besides, as the screening operation was included, the total cost became 30.6% higher than before the screening operations.
Finally, further research is required to improve the efficiency of the chipping operations through an experimental design that considers the moisture content and arrangement (position, diameter distribution, and composition ratio) of various raw materials, as well as the skill of the operator.

Author Contributions

Investigation, M.-J.C., S.-H.P. and H.-S.M.; writing—original draft preparation, Y.-S.C.; writing—review and editing, S.-K.H. and J.-H.O.; supervision, D.-H.K.

Funding

This research received no external funding.

Acknowledgments

All sources of funding of the study should be disclosed. Please clearly indicate grants that you have received in support of your research work. Clearly state if you received funds for covering the costs to publish in open access.

Conflicts of Interest

The authors declare no conflict of interest.

References

  1. Korea Forest Service. Statistical Yearbook of Forestry; Korea Forest Service: Daejeon, Korea, 2018; pp. 39, 286.
  2. Oh, J.H.; Choi, Y.S.; Kim, D.H.; Paik, S.H.; Mun, H.S.; Cho, M.J.; Jung, M.S.; Jung, D.H.; Ji, B.Y. Cost-Effective Production and Utilization of Residual Forest Biomass for Small Scaled Residential Heating; National Institute of Forest Science: Seoul, Korea, 2017; p. 150.
  3. Cho, M.J.; Cho, K.H.; Choi, B.K.; Cha, D.S. Yarding productivity of tree-length harvesting using a small cable-yarder in steep slope. For. Sci. Technol. 2018, 14, 132–137. [Google Scholar] [CrossRef]
  4. Lee, C.G.; Choi, Y.S.; Ju, Y.M.; Lee, S.Y.; Nam, Y.S.; Cho, L.H.; Kim, J.M.; Oh, K.C.; Cho, M.J.; Lee, E.J.; et al. A study on the productivity and cost analysis of the timber and logging residue in CTL system of excavator yarding for using the woody resources. New Renene 2016, 12, 51–58. [Google Scholar]
  5. Korea Forest Service. Provision of Promoting the Use and Promotion of Forest Biomass Energy; Korea Forest Service: Daejeon, Korea, 2018.
  6. Korea Forest Service. Wood Utilization Survey Report; Korea Forest Service: Daejeon, Korea, 2017; p. 298.
  7. Nati, C.; Eliasson, L.; Spinelli, R. Effect of chip type, biomass type and blade wear on productivity, fuel consumption and product quality. Croat. J. For. Eng. 2014, 35, 1–7. [Google Scholar]
  8. Nati, C.; Spinelli, R.; Fabbri, P. Wood chip size distribution in relation to blasé wear and screen use. Biomass Bioenergy 2010, 34, 583–587. [Google Scholar] [CrossRef]
  9. Eliasson, L.; Hofsten, H.V.; Johannesson, T.; Spinelli, R.; Thierfelder, T. Effects of sieve size on chipper productivity, fuel consumption and chip size distribution for open drum chippers. Croat. J. For. Eng. 2015, 36, 11–17. [Google Scholar]
  10. Spinelli, R.; Hartsough, B. A survey of Italian chipping operations. Biomass Bioenergy 2001, 21, 433–444. [Google Scholar] [CrossRef]
  11. Spinelli, R.; Visser, R.K.M. Analyzing and estimation delays in wood chipping operations. Biomass Bioenergy 2009, 33, 429–433. [Google Scholar] [CrossRef]
  12. Yoshida, M.; Berg, S.; Sakurai, R.; Sakai, H. Evaluation of chipping productivity with five different mobile chippers at different forest sites by a stochastic model. Croat. J. For. Eng. 2016, 37, 309–318. [Google Scholar]
  13. Hwang, J.S. Study on Utilization of the Forest Biomass for Small Scaled Heating Energy. Master′s Thesis, Kangwon National University, Chun-cheon, Korea, 2009. [Google Scholar]
  14. Cha, D.S.; Hwang, J.S.; Oh, J.H. Power requirement and particle size distribution characteristic by crush condition of wood crusher. In Proceedings of the 2011 Winter Meeting of the Korean Forest Society, Gueongju, Korea, 2011; pp. 851–853. [Google Scholar]
  15. Mun, H.S. An analysis on Productivity and Cost of the Logging Operation for Utilization of the Forest-Biomass. Master′s Thesis, Kyunpook National University, Daegu, Korea, 2014. [Google Scholar]
  16. Roser, D.; Mala-Yuego, B.; Prinz, R.; Emer, B.; Sikanen, L. Chipping operations and efficiency in different operational environments. Silva Fenn. 2012, 46, 275–286. [Google Scholar] [CrossRef] [Green Version]
  17. National Institute of Forest Science. Standards and Quality Standards of Wood Products; National Institute of Forest Science: Seoul, Korea, 2018; p. 14.
  18. Korea Forest Service. Development of Low Cost Production and Supply Technology for Increasing Logging Residue and Non-Commercial Thinning Log Utilization; Forest Science Technology R&D report; Korea Forest Service: Daejeon, Korea, 2017; p. 17.
Figure 1. Location of the study site.
Forests 10 01029 g001
Figure 2. Tractor mounted drum chipper (KESLA C645T).
Forests 10 01029 g002
Figure 3. Weighing equipment for the wood chips.
Forests 10 01029 g003
Figure 4. Measurement equipment for wood chips’ particle size distribution.
Forests 10 01029 g004
Figure 5. Analysis of the productivity and fuel consumption of the chipping operation by screen size.
Forests 10 01029 g005
Figure 6. Analysis of the productivity of chipping by the number of feedings per hour and screen size.
Forests 10 01029 g006
Figure 7. Analysis of the fuel consumption of the chipping operation by number of feedings per hour.
Forests 10 01029 g007
Figure 8. Particle size distribution as a percentage of screen size. (Mosture content., 31.9% (40 mm), 26.8% (50 mm), 30.6% (65 mm), 33.0% (80 mm).
Forests 10 01029 g008
Table 1. Average productivity, in oven dry ton (odt) per hour, fuel consumption (liter per odt), number of feedings per hour (turn per hour), weight of turn (odt per turn), and cost in dollars per oven dry ton (odt) depending on screen size.
Screen Sizes
(mm)
Fines
(%)
Productivity a
(odt/h)
Fuel Consumption a
(liters/odt)
Number of Feedings per hour a
(turns/h)
Weight of Turn a
(odt/turn)
Operation
Cost
($/odt)
4014.87.7 ± 1.063.7 ± 0.12166.3 ± 20.650.047 ± 0.0128.5
5014.68.6 ± 0.863.5 ± 0.43163.9 ± 12.120.053 ± 0.0125.7
6511.911.3 ± 0.902.6 ± 0.14213.5 ± 11.590.053 ± 0.0019.4
806.610.9 ± 1.132.6 ± 0.19184.9 ± 15.210.059 ± 0.0020.1
a The value is the standard deviation of each measurement.
Table 2. One-way ANOVA for the productivity, fuel consumption, number of feedings per hour, and weight of turn on screen size. n = 12.
SourceDFSum of SquaresMean SquaredF-ValueProb > F
Productivity326.78.99.00.006
Fuel consumption33.11.116.20.001
Number of feedings per hour34724.51574.86.70.014
Weight of turn30.0000.0002.40.144
Table 3. Duncan’s multiple range test for the productivity and fuel consumption per odt on screen size. n = 12.
Screen SizesNProductivityScreen SizesNFuel Consumption
Duncan
(Uses harmonic mean sample size = 3.000)
4037.7 a-8032.6 a-
5038.6 a-6532.6 a-
803-10.9 b503-3.5 b
653-11.3 b403-3.7 b
Significant-0.2990.607Significant-0.7570.446
The same letters are not significantly different at p = 0.05. a,b Duncan’s multiple range test group.
Table 4. One-way ANOVA for number of feedings per hour on screen size. n = 12.
SourceDFSum of SquaresMean SquaredF-ValueProb > F
Number of feedings per hour34724.51574.86.70.014
Table 5. Duncan’s multiple range test for the number of feedings per hour on screen size. n = 12.
Screen SizesNNumber of Feedings
Duncan
(Uses harmonic mean sample size = 3.000)
503163.8 a-
403166.3 a-
803184.7 a184.9 b
653-213.5 b
Significant-0.1460.052
The same letters are not significantly different at p = 0.05. a,b Duncan’s multiple range test group.
Table 6. One-way ANOVA for the weight of turn on screen size. n = 12.
SourceDFSum of SquaresMean SquaredF-ValueProb > F
Weight of turn30.0000.0002.40.144
Table 7. Analysis of the productivity and cost of the chipping and screening operation considering fines particles by screen size (fine content was less than 5 percent).
Screen Size
(mm)
Productivity
(odt/h)
Chipping Cost
($/odt)
Screening Cost
($/odt)
Total Cost
($/odt)
407.230.213.743.9
508.526.013.539.6
6510.620.413.934.3
8010.820.014.434.4

