Article

Influence of Stem Taper on the Yield of Black Spruce Stands and Trees Following Commercial Thinning †

1
Ministère de l’Économie et de l’Innovation, Direction régionale du Saguenay-Lac-Saint-Jean; 3950, boulevard Harvey, Saguenay, QC G7X 8L6, Canada
2
Département des sciences fondamentales, Université du Québec à Chicoutimi, 555, boulevard de l’université, Chicoutimi, QC G7H 2B1, Canada
3
Institut de recherche sur les forêts, Université du Québec en Abitibi-Témiscamingue, 445 boul. de l’Université, Rouyn-Noranda, QC J9X-5E4, Canada
*
Author to whom correspondence should be addressed.
This manuscript is part of a Ph.D. thesis by the first author, available online at https://constellation.uqac.ca/249/.
Forests 2019, 10(11), 1024; https://doi.org/10.3390/f10111024
Submission received: 12 September 2019 / Revised: 11 November 2019 / Accepted: 12 November 2019 / Published: 14 November 2019
(This article belongs to the Section Forest Ecophysiology and Biology)

Abstract

:
In this work, we examine the effects of commercial thinning on stand volume and individual stem form in nine naturally regenerated black spruce (Picea mariana (Mill.) B.S.P.) stands. We compared these study sites with controls in the commercial boreal forest of northern Quebec, Canada. At stand level, dendrochronological data provided insight into changes in stand volume ten years after thinning. Analysis of a subsample of six individual trees from each commercially thinned stand and three individual trees from the controls illustrated the role of thinning on stem shape development. Although average volume increased for residual stems in thinned stands slightly more than in the controls (110% versus 106%), the treatment effect stand-level volume increment or stand-level total volume harvested (ten years after treatment) was not statistically significant. Moreover, at tree level, thinning did not significantly affect stem volume increment. However, radial growth increment significantly increased after treatment. Trees from commercially thinned stands showed a significantly higher growth increment along the lower first two-thirds of the stem. Response to thinning at tree level correlated strongly with the size and number of harvested competitors around a residual stem. We conclude that commercial thinning modified wood allocation rather than wood volume and did not affect taper and stem shape. These patterns of post-cutting growth are explained by wood allocation following thinning. After commercial thinning, growth increment is favored at the expense of height growth. As the treatment effect was found at the stem scale rather than at the stand scale, further research is needed in regard to commercial thinning treatments to investigate how to increase productivity at the stand scale.

1. Introduction

Black spruce (Picea mariana (Mill.) B.S.P.) is an important commercial and reforested species in Eastern Canada [1,2]. The traditional harvesting method used in black spruce stands is clear-cutting; however, forest management practices in the boreal forest have evolved, and in Quebec, ecosystem-based management is now applied to respond to concerns about sustainability [3]. Intermediate stand management activities (e.g., thinning) achieve numerous resource management objectives, including the improvement and maintenance of wildlife habitats, wildfire hazard reduction, ecosystem restoration, and timber production [4]. The Canadian Forest Service defines partial cutting as “any cutting in which only part of the stand is harvested”; however, they specify no minimum level of retention. Commercial thinning is one type of partial cutting treatment. Many studies examining the boreal ecosystem response to partial cutting have focused on biodiversity and how various levels of cutting affect forest ecology, including regeneration [5], biodiversity protection [6], and cover retention [7]. The issue of timber production rates in partial cuts, however, has received less attention [8,9,10], specifically in naturally regenerated, unmanaged black spruce stands. Timber production yield can be evaluated at different scales as it depends on a range of factors. Yields can be expressed according to the produced stand volume and also by volume increment of individual trees. At the individual scale, predicting wood volume and lumber yield requires information regarding stem shape [11,12,13] and lumber yield [14,15]. Two stems having the same volume but that differ in terms of taper will produce two different lumber volumes. In natural, unmanaged stands, given the high stand density before treatment, we may assume substantial changes in stem form after a canopy opening; for example, wind-induced bending events increase linearly with increased spacing between trees [16,17].
In this study, we focus on fire-origin black spruce stands that had undergone commercial thinning at least ten years before sampling. Using measurements collected at two scales—stand and stem levels—this study aimed to examine changes in wood volume within thinned black spruce stands and take into consideration stand and treatment characteristics. At the stem level, we evaluated variations in stem taper and shape after treatment to better explain our stand-scale observations. We hypothesized that thinning led to an increased individual volume caused by availability of light and nutrients. Stand-level volume may increase several years after treatment. Thinning should also induce changes in radial growth along the stem. Indeed, wind entrance within stands—in response to the opening of the canopy—should affect the pattern of wood deposition along the stem and modify stem taper as demonstrated by Lemay et al. [11].

2. Material and Methods

2.1. Study Area

We studied nine commercially thinned stands and their controls from 2006 to 2008 in a portion of the boreal forest of Quebec, Canada. We used two main criteria to select our sites: (1) thinning which had occurred in the naturally regenerated, unmanaged natural black spruce stands and (2) that this treatment happened at least ten years prior to our sampling. Stands also had to be accessible by truck and be located close to trails to allow us to carry field material and samples on foot. As this was a recent silvicultural treatment in the boreal forest of Canada, information about commercial thinning, with regard to type and technical details, is not available.
Whenever possible, we selected a nearby unmanaged natural black spruce stand which had similar characteristics to the treatment stand to be a control (Table 1). In two instances, when multiple stands shared similar environmental characteristics, the same control stand was used to compare more than one nearby partially thinned stand. Study plots covered an area 47.9° N to 49° N and 70.5° W to 72.7° W. Elevations of the study sites ranged between 210 to 671 m above see-level. The region is characterized by cold winter temperatures and a short vegetative period. The average minimum temperature is −18.3 °C during the coldest month and 17.9 °C during the warmest month. Average annual precipitation varies from 920 cm to 1187 cm in the studied stands [18]. All relevant stand characteristics are presented in Table 1.

2.2. Stand Measurements

In each stand, we established a 20 × 20 m quadrat (400 m2) comprising at least 35 black spruce (diameter at breast height (DBH) > 9 cm). At one control site, LJC, we selected only 25 trees because of environmental constraints. For each tree in the quadrat, we determined total tree height (H), DBH, and diameter at stump height (DSH). In thinned stands, stump circumference was also recorded.
To determine tree age and variations in stand-level radial growth after thinning, we recovered an increment core from each living tree at 25 cm above the ground; the core was aligned along a N–S axis. Initial merchantable basal area (Ginit, m2 ha−1) and the resulting percentage basal area harvested (Gharvested, %) were calculated according to Perron et al. [19] (Equation (1), Table 1), i.e.,
G = π × f a c t o r 40000 × i   =   1 n D B H i 2
where G is the basal area, factor is the conversion factor for correcting obtained values to a value in ha, and n represents the number of trees in the quadrat. The conversion factor also considers the nature of the measurement variability. For harvested trees, Ginit was calculated using DSH corrected using the DBH/DSH ratio. Harvested tree height was assessed using the stumps of residual stems of similar diameter within or close to the quadrat [20,21].
We calculated stem volume from volume tables for black spruce as a function of stem DBH and H [22]. Based on this information, we determined at stand level the average volume by stem (AVS, m3) and stand volume (V, m3 ha−1) for the year of thinning and for the sampling year (AVSinit, AVSf, Vinit, and Vf, respectively). The total volume harvested was also calculated (Table 2). For our analysis, we considered stands ready for final felling in the year of sampling.

2.3. Selected Tree Measurements

2.3.1. Selected Tree Neighborhood

We randomly selected and felled, among dominant and codominant trees, six black spruce in each thinned stand and three black spruce in the control stands. A total of 71 trees were harvested for stem analysis. We recorded the neighborhood conditions of sampled trees to interpret stand response (Table 3).
Based on these data, we calculated a competition index (CI) for each selected tree using Hegyi’s diameter–distance CI [23] (Equation (2)), i.e.,
CI i   =   j   =   1 n ( D B H j D B H i × 1 D I S T i j )
where CIi is the competition index of the subject tree i, j is the competitor tree located within 4 m of the subject tree (3.5 × mean crown radius of canopy trees), and DISTij is the distance between the subject and competitor trees. We considered a tree a potential competitor when its DBH was greater or equal to two-thirds of the DBH of the subject tree [23,24].
We calculated two Hegyi indices: (1) the stump competition index (CIs) and (2) the competition index for the year of treatment (CIinit). CIs characterizes the influence of the harvested tree on the growth of the selected trees, whereas CIinit characterizes the competition among the remaining trees after treatment.

2.3.2. Growth Measurement

Once felled, we removed a 5 cm disc at each meter of the stem, starting at ground level and moving up to the crown. Each sample disc was dried and sanded. We measured tree-ring widths from four perpendicular radii using Henson and WinDendro software [25]. We then cross-dated the rings [26,27]. Tree-ring dating was verified using the COFECHA program [28]. We obtained the radii for each year and for the top and bottom of each section by summing the ring widths up to that year.
To compare trees of differing height and size, we expressed height and tree-level growth values relatively, following Assman’s method [21]. We calculated the relative height (RH) of all selected trees as the ratio between disc height and H.
Tree-level decennial relative growth was calculated; α was expressed based on RH for the ten years prior to (Equation (3)) and the ten years post-treatment (Equation (4)), i.e.,
α before = t = 9 t = 0 α R H t = 9 0 α 1.3 / H
α after = t = 1 t = 10 α R H t = 9 t = 0 α 1.3 / H
where t is time (in years, with t = 0 the year of treatment), and α is the tree-level radial growth increment. We measured α for each disc taken along the stem.
For statistical analyses, the tree-level relative growth increment (GrowthInc) was calculated as the ratio between αafter and αbefore.

2.3.3. Stem Shape

A common approach for studying stem shape is to assume that a tree is composed of three segments with its form constant within a segment and differing between segments. Each segment is described by a “power function”, a continuous function which has an exponent. The limit between segments is commonly called the inflection point. Various studies have suggested that the inflection point ranges from 20% to 25% of the total height from the ground [29,30] and that the relative height is fairly constant within a species, regardless of tree size [13]. Thus, to calculate shape characteristics of the middle segment of the stem, we recorded the diameter at two relative positions along the stem, namely, at 0.2 and 0.7 of total stem height [31]. We determined the positions using the tree height at harvest time.
Stem shape was calculated using the equation of Forslund [32] (Equation (5)), i.e.,
A SEC   =   l n
where an ASEC equal to 2 represents a parabola and an ASEC value of 1 represents a cone [31].
Taper was calculated by determining the stem diameter change divided by the stem length between the two diameter measurements [32] (Equation (6)), i.e.,
T   =   D R H = 0.2 D R H = 0.7 L
where DRH is the diameter at relative height RH and L is the length between the two relative heights. Profile shape was defined as the geometric shape of the stem profile between the two diameter measurements and it was quantified by the exponent ASEC in the power function.
We determined taper and stem shape (ASEC) for the five-year average, for ten years prior to treatment, and for the mean five to ten years after treatment.

2.3.4. Statistical Analysis

Statistical analyses were performed using R software run with the nlme package and the lme function using a confidence level of 95 per cent [33]. Linear mixed-effect models were built to investigate variations in the variables of interest (V, GrowthInc, taper, and ASEC) with treatment (thinned/control). For all analyses, treatment was the main effect. Models were run using restricted maximum likelihood (REML) to estimate the final parameters. Before our analyses, we calculated Pearson correlations to investigate possible autocorrelation between explanatory variables. We verified the model’s assumptions using graphical diagnostics (i.e., residual versus predicted, Cook’s distances and hat values, and distribution of observed values) initially with a general linear model without random effects but with all explanatory variables integrated into it, as well as for the final model. After these analyses, we used the natural log transformations of GrowthInc (lnGrowthInc) and taper (lnTaper) in the models.
At stand level, to study variations in stand volume increment (stand volume increment and Vtot harvested) with treatment and stand characteristics, we built a seven-block unbalanced split-plot design. Initial density (Ginit) was added as a covariate for each site within a block. Blocks were randomized factors. To evaluate stem volume increment (AVSf/AVSinit) variations with treatment, we built a mixed model which had trees nested within a block as random effects and Ginit as a covariate. Then, for partially harvested stands only, we ran a linear model with Ginit and percentage of basal area harvested (Gharvested) as explanatory variables.
To evaluate the treatment effect on tree-level radial growth allocation (GrowthInc), we developed a mixed-effect model which had discs nested within selected trees, which were nested within a block as random factor effects. Relative height was included in the model as a factor effect and DBH, Ginit, tree slenderness (slenderness, H/DBH), CIs, and CIinit were included as covariates. As H and DBH were correlated, H was not included in the models. To evaluate growth increment variation with RH, we computed orthogonal contrasts. First-level RH (RH = 0) was compared with all superior levels and then RH = 0.1 was compared with RH > 0.1, and so on.
To evaluate the treatment effect on stem shape and taper, we built a mixed-effect model having two repeated measures (time = before/after) for each tree nested within a block as random factor effects. Again, DBH, Ginit, slenderness, CIs, and CIinit were included as covariates.

3. Results

The mean age of the stands varied from 48 to 82 years (Table 1). Stand density before thinning varied between 800 and 3900 trees ha−1. At the year of harvest, the thinned stands had a mean age of 58 years while control stands had an average age of 55 years. Based on Ginit, Gharvested varied from 9.7% to 52.5%; this percentage can be classified as light to heavy thinning.

3.1. Variations in Volume

The Vtot of thinned stands was less than that of the control stands (222.3 m3 ha−1 versus 243.0 m3 ha−1, Table 2). In terms of residual stems only, stand-level increment after thinning was slightly higher than in the control stands (110.2% versus 106.3%, Table 2). After thinning, merchantable stand-level increment was higher for seven of the nine thinned stands relative to their controls. Stand-level increment, however, was not significantly affected by either treatment or Ginit (Table 4). The Vinit affected significantly Vtot at ten years post-treatment; however, treatment did not have a significant effect (Table 4).
By stand, the average stand-level increment (AVSf/AVSinit) varied from 90.5% (a reduction of average volume increment) to 150.0% with a mean of 118.7% (Table 2). Thinned stands presented an average stand-level increment at the final harvest of 125.6%; the value for the controls was 105.7%. Treatment did not significantly affect stand-level increment; this lack of effect was mainly due to between-tree variations. Calculated on the intercept model only, the variance component showed that the fraction of total variance due to tree was about 99%, whereas the fraction of total variance due to block was about 0.1% (data not shown). Gharvested did not significantly affect stand-level increment in the thinned stand (p = 0.34, data not shown).

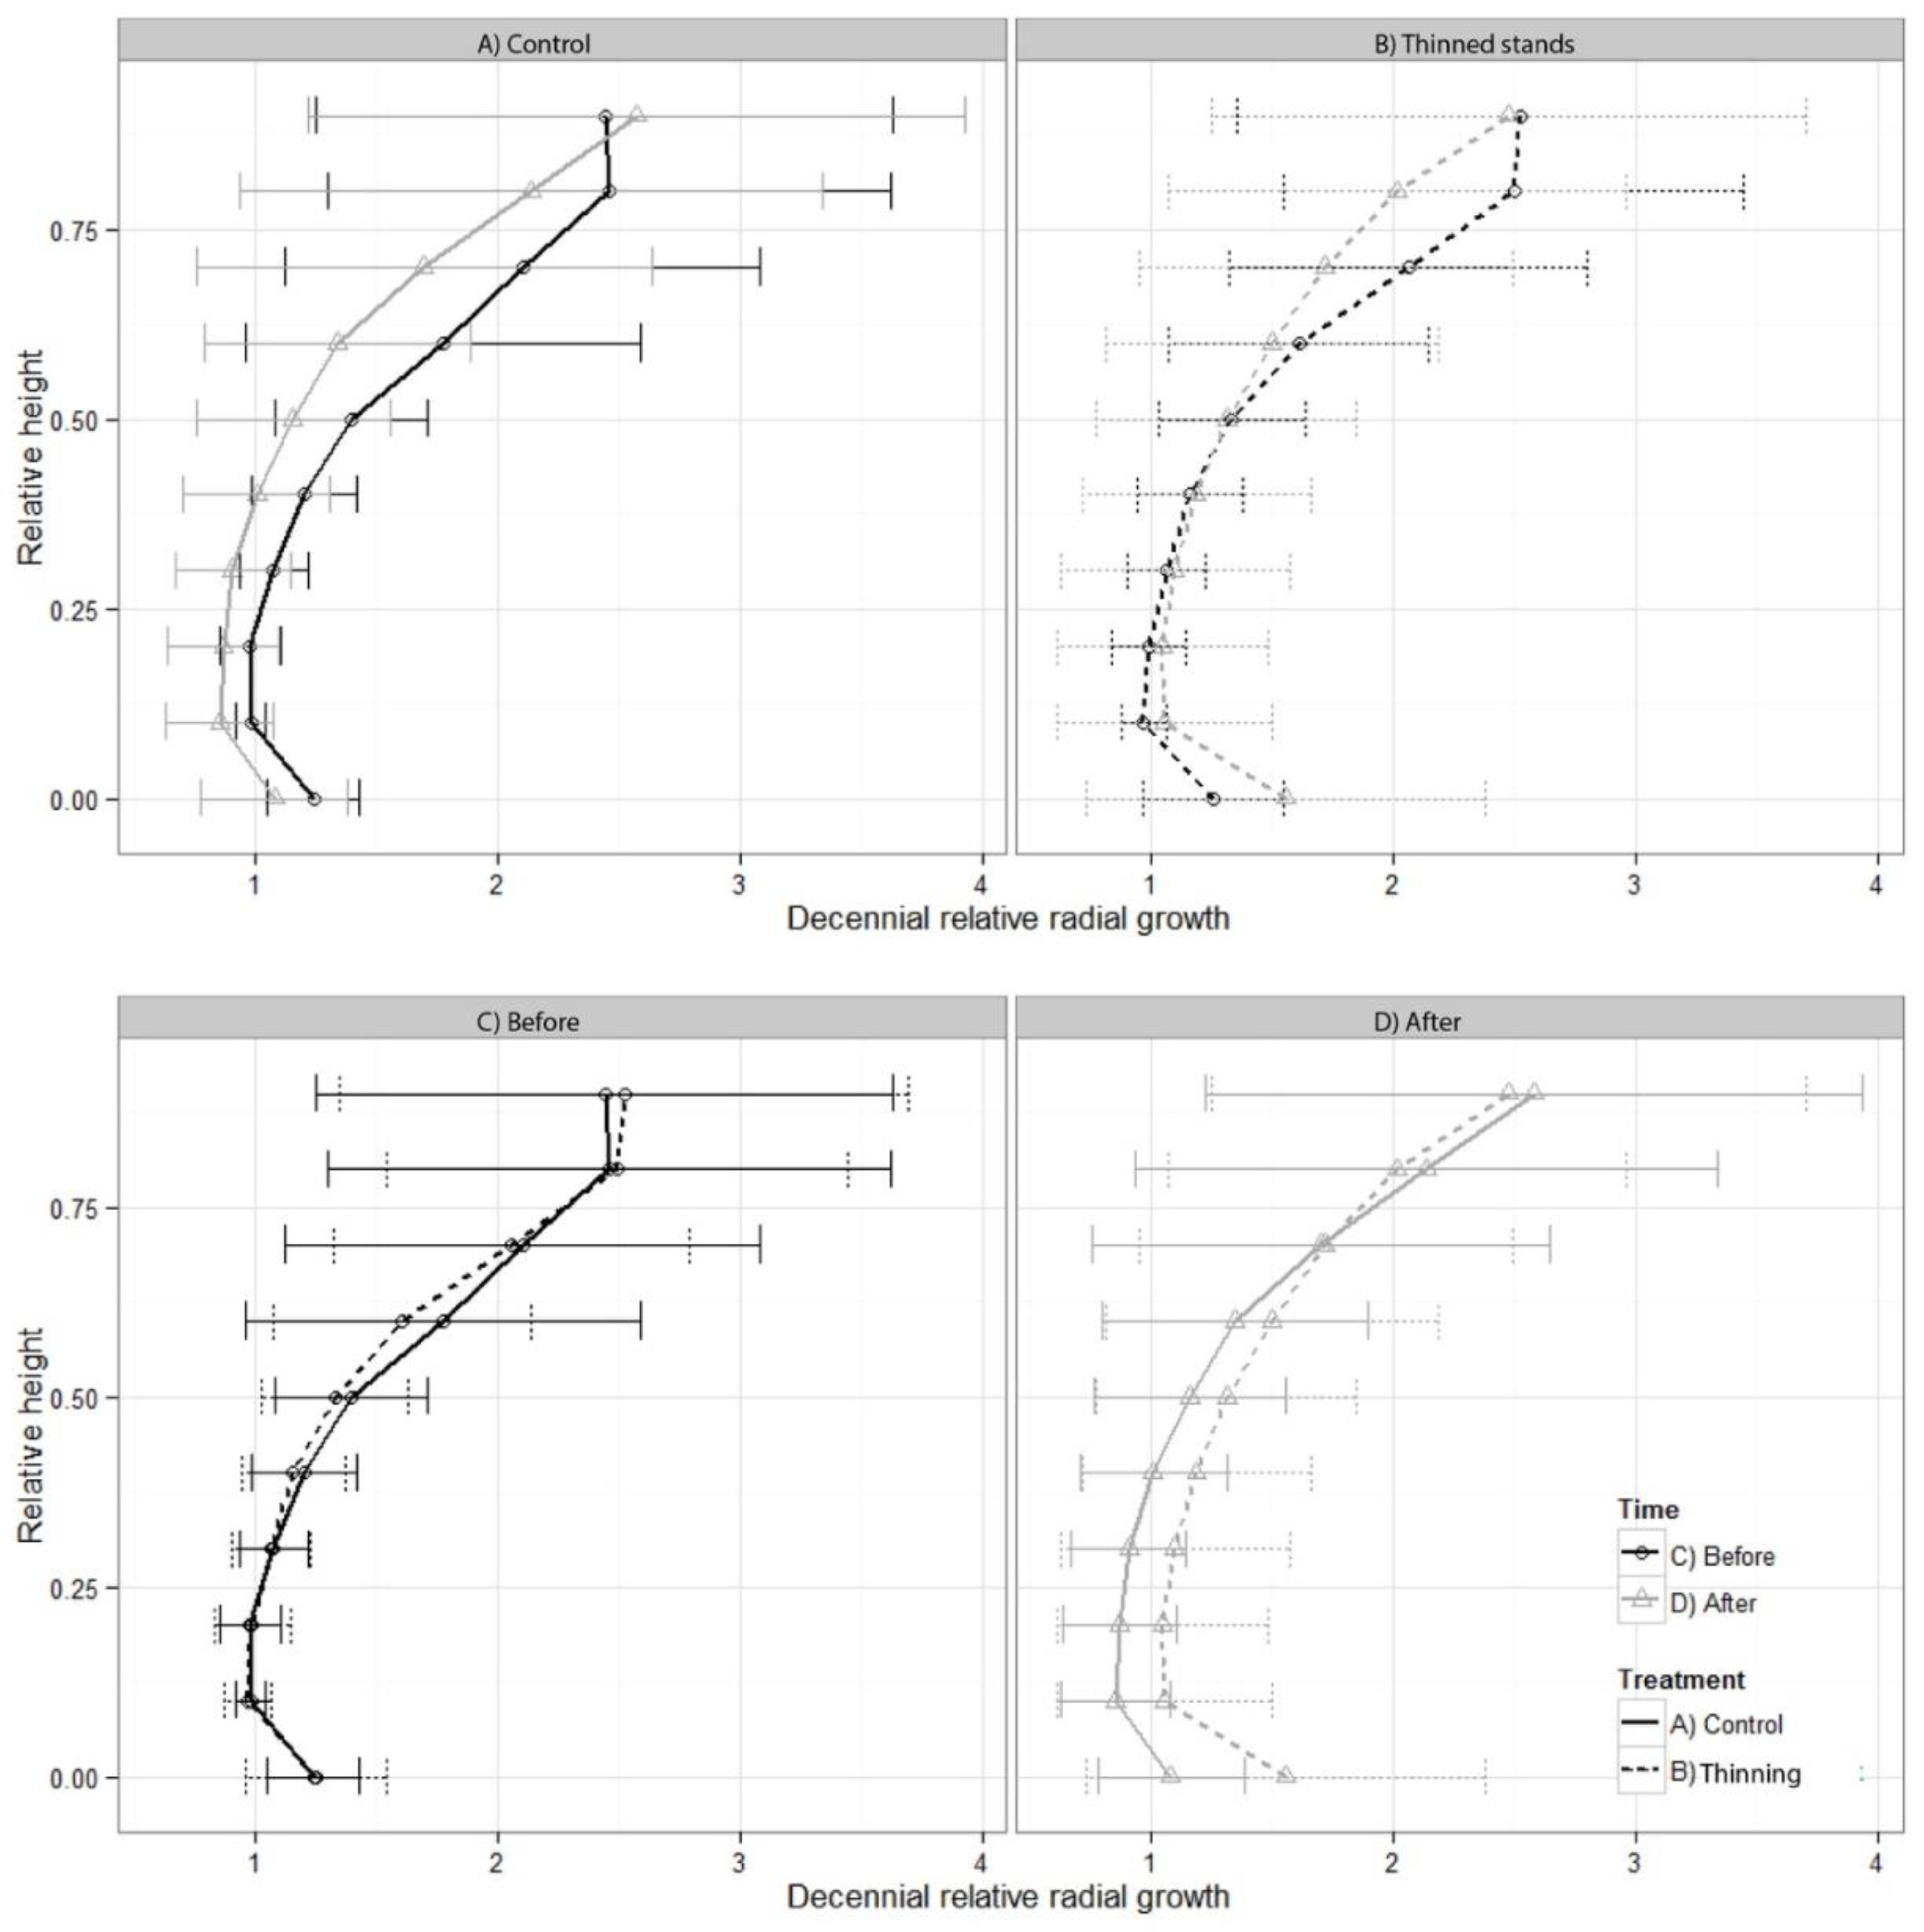
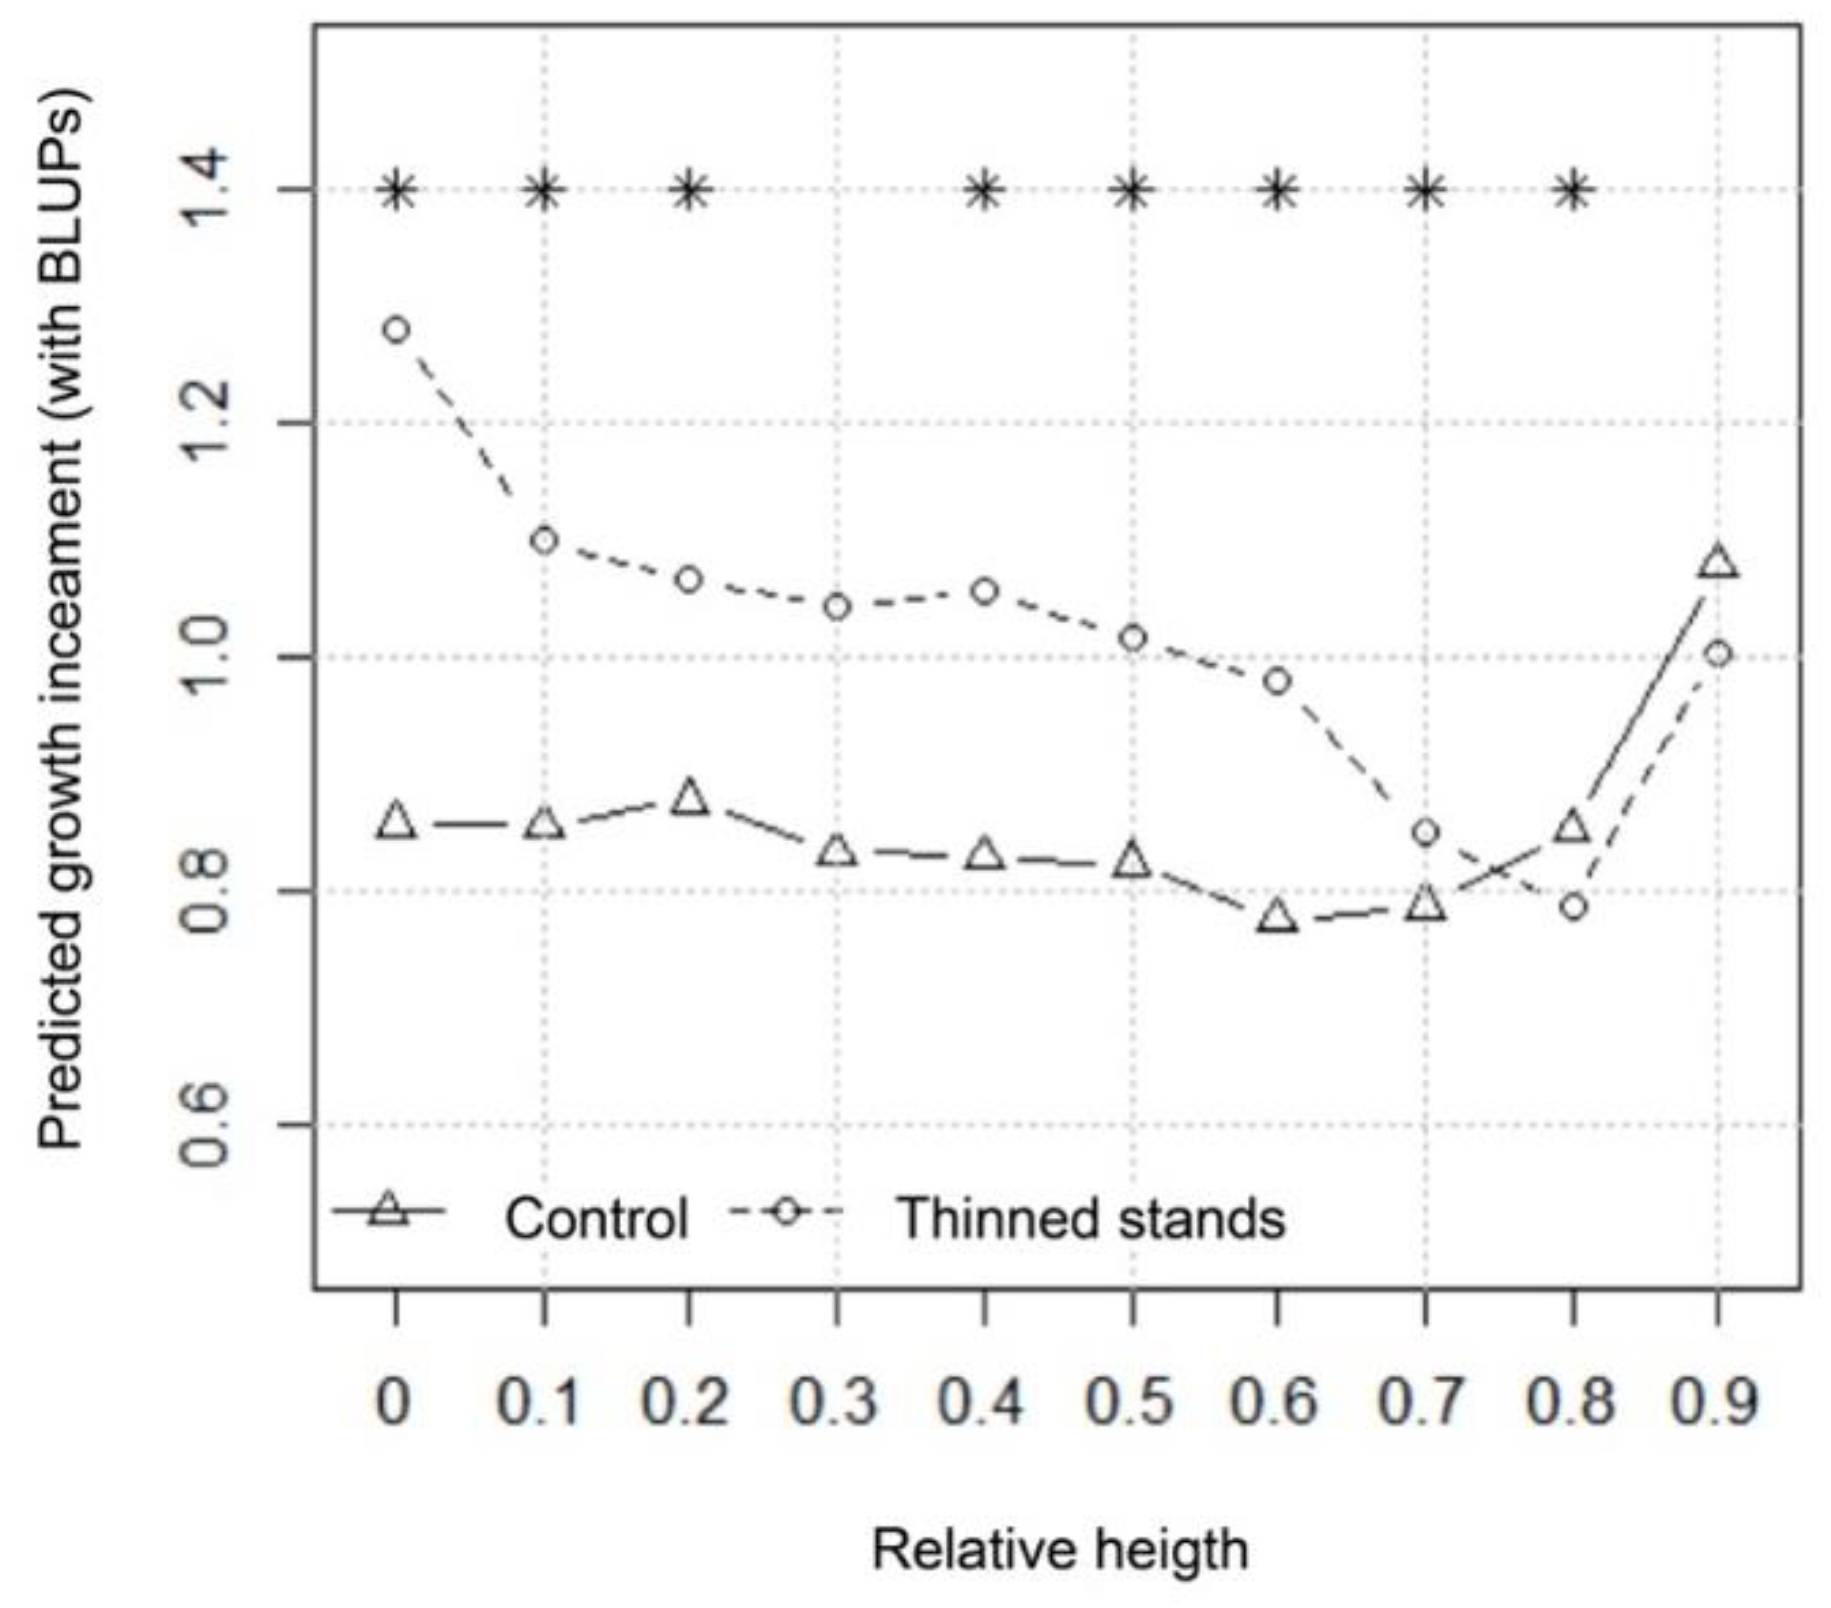
3.2. Radial Growth Response in Relation to Taper and Stem Shape

The DBH of trees selected for stem analysis from the thinned stands varied from 9.1 cm to 28.5 cm, with a mean of 16.9 cm. The DBH of trees selected for stem analysis from the control stands varied from 9.5 cm to 23.5 cm, with a mean of 16.1 cm. Selected trees from thinned stands averaged approximately 2.2 competitors with a DBH between 11.2 and 33.2 cm and a mean DBH of 17.2 cm. Selected trees from the control stands averaged approximately 3.4 competitors, having a DBH of 8.8 to 25.7 cm with a mean DBH of 15 cm (Table 2). Trees selected from the thinned stands had an average of 1.3 stumps around them; the number of stumps varied from 0 to 6. Mean stump diameter was 17.1 cm, ranging from 8.3 cm to 35 cm in diameter.
To evaluate wood allocation, we studied tree-level decennial relative radial growth along the stem (α) before (αbefore) and after (αafter) treatment. Figure 1a,b shows that α at the base of the tree increased slightly after thinning while αafter was lower than αbefore in control stands. We observed that the αbefore along the stem was similar for both thinned and control stands; however, αafter was higher in the lower two-thirds of tree height in thinned stands than in controls (Figure 1c,d).
DBH, slenderness, and CIinit (reflecting the number of competitor trees, their diameter, and their distance from the selected tree before treatment) did not significantly affect relative GrowthInc. They were excluded from the final model (Table 5a).
At tree level, thinning led to a significant increase of GrowthInc (p = 0.0007, Table 5a). GrowthInc decreased with relative height. More specifically, the treatment effect on GrowthInc varied significantly with relative height (p < 0.0001, Table 5a). Based on orthogonal contrasts, for the first two-thirds of tree height, GrowthInc was significantly higher in thinned stands than for control trees; at the top of the tree, GrowthInc was significantly higher for the control trees (Figure 2). Eventually, at the stem level, only CIs (representing the number of stumps and their distance from the selected sampled tree) had a positive significant effect on GrowthInc.
Treatment and time significantly affected ASEC, although the interaction treatment × time was not significant (Table 5b).
We observed similar results for taper variations (Table 5c). Logically, slenderness influenced taper significantly, and selected trees from the thinned stands had a significantly lower taper.

4. Discussion

4.1. Thinning Effect on Stand Attributes

Based on our study sites, stand-level volume growth increment from thinned stands, ten years after treatment, was not sufficient to recover the control stand volume. We observed no significant change of stand volume increment after thinning. Contrasting results are found in the literature with regard to partial harvesting and its effects on stand volume increment. Stinson [33], studying stands of second-growth Douglas fir (Pseudotsuga menziesii (Mirb.) Franco), found that low thinning from below led to an increase in total harvest volume with extended rotations. By contrast, Mäkinen et al. [34] observed a decrease in annual volume increment per unit area 8–10 years after intensive thinning in a study of Scots pine (Pinus silvestris L.). Their results, however, suggested that when coupled with a fertilization treatment, this harvesting method would enable a shorter rotation period. Similar results have been reported for stands of Sitka spruce (Picea sitchensis (Bong.) Carr.) [35].
In black spruce stands 15 years after treatment, stand volume of a heavily thinned stand was about 75% of the control stand volume. However, when a spruce budworm (Choristoneura fumiferana Clemens) outbreak occurred in the stand, the thinned stand was not affected relative to the control sites, and stand volume eventually reached the same volume as the control, 33 years after harvesting [9].
We may argue that different types of thinning (from above, from below, thinning intensity, species, and sites, etc.) serve different purposes and thus produce different results. One of the earliest studies focusing on the effect of partial harvesting on black spruce stands demonstrated that light thinning (25%) had little impact on the growth of individual trees within a 65-year-old stand; a 50% thinning increased the basal area growth rate by 30% 15 years after treatment [36]. In this study, however, thinning intensity did not significantly affect stand or average stem volume variation and the inter-block variation was negligible. Moreover, Ginit did not affect stand-level increment. This lack of effect could be related to stand productivity. For example, in a Norway spruce (Picea abies (L.) Karst) stand, Lundqvist et al. [37] found that standing volume had a significant effect on growth increment after thinning. However, this effect was apparent only in the southern site (no effect was observed in the study’s northern site).

4.2. Wood Allocation and Stem Shape Variations Following Treatment

At tree level, growth increment was significantly higher for selected trees from thinned stands than the control stands. Similar observations have been noted for jack pine (Pinus banksiana Lamb.) [38], Douglas fir [39], black spruce [24], and Norway spruce [40,41]. More specifically, growth increment was affected strongly by CIS (the number and the size of harvested competitors). The lack of effect of treatment on average stem volume increment by stand may thus not be the result of an ineffective treatment but rather the heterogeneous response at the stem scale depending on a tree’s neighborhood. At the stand level, the characteristics of harvested trees (size, number) are related to partial harvest type (from above, from below, or single-tree selection system, etc.) rather than intensity. In uneven-aged Norway spruce stands, thinning from above (removing the larger trees) has been found to lead to a consistent increase of volume increment compared to thinning from below [37]. In the same type of stand, the system of single-tree selection has also been found to induce a higher growth volume increment compared to low thinning and dimension cutting [42]; more marked differences were observed in a planted Norway spruce stand in Sweden [40].
We also observed a specific pattern of wood deposition for selected trees from thinned stands. Contrary to control stands, where tree-level growth increment was located at the top of the tree, selected trees from thinned stands demonstrated a growth allocation along the first two-thirds of the stem. Neither taper nor stem shape (ASEC) were affected significantly by thinning. The significant effect of treatment on both ASEC and taper reflects a between-site difference (control versus thinned) rather than a real effect of the treatment. With regard to Figure 2, this result is logical according to the inflection point position selected for ASEC and taper calculation. Both 0.2 and 0.7 RH are included in the growth increment zone for selected trees from thinned stands. These results agree with Goudiaby et al. [43], who observed that the vertical distribution of specific volume increment was constant in black spruce stems after thinning. This led to no modifications of the stem taper. In a similar sense, Sharma and Parton [44] observed that the stand density effect on taper was more pronounced in jack pine than in black spruce.
Ever since theories related to stem form were first proposed [45], foresters have concurred that silvicultural practices favoring growth increment also produce changes in stem shape. Various authors have suggested that the patterns of wood deposition along the stem are affected by variations in crown size, which in turn are affected by tree characteristics and stand conditions (particularly stand density) [46,47,48,49]. This hypothesis has been verified for some species, including Douglas fir and Sitka spruce (Picea sitchensis), for which Mitchell [17] found that basal allocation temporarily increased after thinning, suggesting a period of acclimatized growth during which trees re-equilibrate with post-thinning wind loads. In Jack pine stands (Pinus banksiana Lamb.), Goudiaby et al. [43] also detected a positive correlation between stem volume growth, growth efficiency (stem to foliage biomass ratio), and foliage biomass at mid-crown. However, for shade-tolerant species such as black spruce, opening the canopy may not necessarily affect branch development, taper, or stem shape in the same way [49]. Thus, Goudiaby et al. [43] again observed no change in growth efficiency, foliage biomass, or biomass density after thinning. Despite these observations, the model suggested that ASEC decreased when CIS increased; therefore, the stem would become more conical when the number and the size of direct competitors harvested are important.
By contrast, our control trees showed a tree-level growth increment located at the top of the tree, a higher position than for trees selected from thinned stands. This variation in tree-level growth allocation may contribute to the relative success of thinning in regard to volume increment. Mitchell [17] has suggested that a temporary reduction in height increment, increased radial increment, and increased basal allocation after thinning may contribute to reducing the height-diameter ratio. In studies of Douglas fir and Sitka spruce, this reduction was more pronounced in trees that were initially slenderer. These results are in accordance with the negative slenderness effect observed for changes in taper.
As we had anticipated an increase in stand volume increment ten years after treatment, our observations in commercially thinned stands did not meet our expected results. However, this result is attenuated by wood allocation being located along the merchantable portion of the stem. As treatment did not affect taper stem shape, economic loss during sawmilling can be avoided [15].

5. Conclusions

Depending on the purpose of thinning and other partial harvest—simplifying stand structure, converting even-aged stand to uneven-aged stands, increasing stand productivity, or decreasing or extending rotation—our results show that in natural black spruce stands, the thinning effect is greater at the individual scale than the stand scale. After treatment, growth increment along the main part of the stem is favored to the detriment of growth at the top of the tree.

Author Contributions

Conceptualization, M.V. and C.K.; methodology, M.V. and C.K.; validation, M.V., C.K. and A.K.; formal analysis, M.V., resources, C.K. and A.K.; writing—original draft preparation, M.V., writing—M.V., C.K., and A.K., review and editing, M.V., and C.K.; project administration, C.K.; funding acquisition, C.K.

Funding

This research was funded by FQRNT grant 2007-FT-118063. The Consortium de Recherche sur la Forêt Boréale Commerciale provided additional support.

Acknowledgments

The authors would like to thank Mireille Boulianne for lab assistance; Simon Gaboury, for helpful discussions; and Maxime Blackburn, Charles-Augustin Déry-Bouchard, Audrey Lemay, Boris Luszczynski, Émilie Pamerleau-Couture, Pierre-Yves Plourde, Germain Savard, and Marc-André Valiquette for field assistance. Special thanks to the Associate editor and two anonymous reviewers for their remarkable work which greatly improved the manuscript.

Conflicts of Interest

The authors declare no conflict of interest.

References

  1. Parent, B.; Fortin, C. Ressources Et Industries Forestières—Portrait Statistique Édition 2008; Gouvernement du Québec. Ministère des Ressources Naturelles et de la Faune-Direction du Développement de L’industrie des Produits Forestiers: Québec, QC, Canada, 2008; p. 513.
  2. Zhang, S.Y.; Koubaa, A. Les Résineux de l’est du Canada: Écologie Forestière, Caractéristiques, Transformation Et Usages; Publication spéciale SP-526F; FPInnovations: Québec, QC, Canada, 2009; p. 400. [Google Scholar]
  3. Bureau du forestier en chef. Bilan D’aménagement Forestier Durable Au Québec 2000–2008; Gouvernement du Québec, Roberval: Québec, QC, Canada, 2010; p. 290.
  4. Keyser, T.L. Thinning and site quality influence aboveground tree carbon stocks in yellow-poplar forests of the southern Appalachians. Can. J. For. Res. 2010, 40, 659–667. [Google Scholar] [CrossRef]
  5. Greene, D.F.; Zasada, J.C.; Sirois, L.; Kneeshaw, D.; Morin, H.; Charron, I.; Simard, M.J. A review of the regeneration dynamics of North American boreal forest tree species. Can. J. For. Res. 1999, 29, 824–839. [Google Scholar] [CrossRef]
  6. Lafleur, B.; Fenton, N.J.; Simard, M.; Leduc, A.; Paré, D.; Valeria, O.; Bergeron, Y. Ecosystem management in paludified boreal forests: Enhancing wood production, biodiversity, and carbon sequestration at the landscape level. For. Ecosyst. 2018, 5, 27. [Google Scholar] [CrossRef]
  7. Norton, M.R.; Hannon, S.J. Songbird response to partial-cut logging in the boreal mixedwood forest of Alberta. Can. J. For. Res. 1997, 27, 44–53. [Google Scholar] [CrossRef]
  8. Montoro Girona, M.; Rossi, S.; Lussier, J.-M.; Walsh, D.; Morin, H. Understanding tree growth responses after partial cutting: A new approach. PLoS ONE 2017, 12, 1–18. [Google Scholar] [CrossRef] [PubMed]
  9. Soucy, M.; Lussier, J.M.; Lavoie, L. Long-term effects of thinning on growth and yield of an upland black spruce stand. Can. J. For. Res. 2012, 42, 1669–1677. [Google Scholar] [CrossRef]
  10. Zhou, D.; Zhao, S.Q.; Liu, S.; Oeding, J. A meta-analysis on the impacts of partial cutting on forest structure and carbon storage. Biogeosciences 2013, 10, 3691–3703. [Google Scholar] [CrossRef]
  11. Lemay, A.; Krause, C.; Achim, A.; Begin, J. Growth and wood quality of black spruce and balsam fir following careful logging around small merchantable stems (CLASS) in the boreal forest of Quebec, Canada. Forestry 2018, 91, 271–282. [Google Scholar] [CrossRef]
  12. Pamerleau-Couture, E.; Rossi, S.; Pothier, D.; Krause, C. Wood properties of black spruce (Picea mariana (Mill.) BSP) in relation to ring width and tree height in even- and uneven-aged boreal stands. Ann. For. Sci. 2019, 76, 43. [Google Scholar] [CrossRef]
  13. Kozak, A. A variable-exponent taper equation. Can. J. For. Res. 1988, 18, 1363–1368. [Google Scholar] [CrossRef]
  14. Brais, S.; Harvey, B.D.; Bose, A. Stem- and stand-level growth and mortality following partial cutting in eastern boreal poplar—White spruce stands. Can. J. For. Res. 2019, 49, 463–470. [Google Scholar] [CrossRef]
  15. Zhang, S.Y.; Chauret, G.; Swift, E.; Duchesne, I. Effects of precommercial thinning on tree growth and lumber quality in a jack pine stand in New Brunswick, Canada. Can. J. For. Res. 2006, 36, 945–952. [Google Scholar] [CrossRef]
  16. Gardiner, B.A.; Stacey, G.R.; Belcher, R.E.; Wood, C.J. Field and wind tunnel assessments of the implications of respacing and thinning for tree stability. Forestry 1997, 70, 233–252. [Google Scholar] [CrossRef]
  17. Anyomi, K.A.; Ruel, J.-C. A multiscale analysis of the effects of alternative silvicultural treatments on windthrow within balsam fir dominated stands. Can. J. For. Res. 2015, 45, 1739–1747. [Google Scholar] [CrossRef]
  18. Perron, J.-Y.; Fortin, M.; Ung, C.-H.; Morin, P.; Blais, L.; Blais, G.; Carpentier, J.-P.; Cloutier, J.; Del Degan, B.; Demers, D.; et al. Dendrométrie Et Inventaire Forestier. In Manuel de Foresterie, 2nd ed.; OIFQ, Ed.; Éditions Multimondes: Québec, QC, Canada, 2009; pp. 567–630. [Google Scholar]
  19. Hillman, G.R.; Takyi, S.K. Response of black spruce to thinning and fertilization in a drained swamp. North J. Appl. For. 1998, 15, 98–105. [Google Scholar] [CrossRef]
  20. Viens, É. Effets de L’éclaircie Commerciale Sur La Croissance Et La Forme de La Tige du Pin Gris (Pinus banksiana Lamb.) en Abitibi, Québec. Master’s Thesis, Université du Québec à Chicoutimi, Chicoutimi, Saguenay, QC, Canada, 2001. [Google Scholar]
  21. Perron, J.Y. Tarif de Cubage Général, Volume Marchand; Gouvernement du Québec, Ministère de l’Énergie et des Ressources: Québec, QC, Canada, 1985; p. 53.
  22. Mailly, D.; Turbis, S.; Pothier, D. Predicting basal area increment in a spatially explicit, individual tree model: A test of competition measures with black spruce. Can. J. For. Res. 2003, 33, 435–443. [Google Scholar] [CrossRef]
  23. Vincent, M.; Krause, C.; Zhang, S. Radial growth response of black spruce roots and stems to commercial thinning in boreal forest. Forestry 2009, 82, 557–571. [Google Scholar] [CrossRef]
  24. Guay, R.; Gagnon, R.; Morin, H. A new automatic and interactive tree ring measurement system based on a line scan camera. For. Chron. 1992, 68, 138–141. [Google Scholar] [CrossRef]
  25. Stokes, M.A.; Smiley, T.L. An Introduction to Tree-ring Dating; University of Chicago Press: Chicago, IL, USA, 1968. [Google Scholar]
  26. Krause, C.; Gionest, F.; Morin, H.; MacLean, D.A. Temporal relations between defoliation caused by spruce budworm (Choristoneura fumiferana Clem.) and growth of balsam fir (Abies balsamea (L.) Mill.). Dendrochronologia 2003, 21, 23–31. [Google Scholar] [CrossRef]
  27. Holmes, R.L. Computer assisted quality control in tree-ring dating and measurement. Tree-Ring Bull. 1983, 43, 69–78. [Google Scholar]
  28. Demaerschalk, J.P.; Kozak, A. Whole-bole system—Conditioned dual-equation ystem for precise prediction of tree profiles. Can. J. For. Res. 1977, 7, 488–497. [Google Scholar] [CrossRef]
  29. Perez, D.-N.; Burkhart, H.-E.; Stiff, C.-T. A variable-form taper function for Pinus oocarpa Schiede in central Honduras. For. Sci. 1990, 36, 186–191. [Google Scholar]
  30. Morris, D.M.; Forslund, R.R. The relative importance of competition, microsite, and climate in controlling the stem taper and profile shape in jack pine. Can. J. For. Res. 1992, 22, 1999–2003. [Google Scholar] [CrossRef]
  31. Forslund, R.R. The power function as a simple stem profile examination tool. Can. J. For. Res. 1991, 21, 193–198. [Google Scholar] [CrossRef]
  32. R Core Team. R: A Language and Environment for Statistical Computing; R Foundation for Statistical Computing: Vienna, Austria, 2018. [Google Scholar]
  33. Stinson, S.D. 50 years of low thinning in second-growth Douglas-fir. For. Chron. 1999, 75, 401–405. [Google Scholar] [CrossRef]
  34. Mäkinen, H.; Hynynen, J.; Isomäki, A. Intensive management of Scots pine stands in southern Finland: First empirical results and simulated further development. For. Ecol. Manag. 2005, 215, 37–50. [Google Scholar] [CrossRef]
  35. Skovsgaard, J.P. Analysing effects of thinning on stand volume growth in relation to site conditions: A case study for even-aged Sitka spruce (Picea sitchensis (Bong.) Carr.). Forestry 2009, 82, 87–104. [Google Scholar] [CrossRef]
  36. Weetman, G.F.; Roberge, M.R.; Meng, C.H. Black spruce-15-year growth and microbiological response to thinning and fertilization. Can. J. For. Res. 1980, 10, 502–509. [Google Scholar] [CrossRef]
  37. Lundqvist, L.; Chrimes, D.; Elfving, B.; Morling, T.; Valinger, E. Stand development after different thinnings in two uneven-aged Picea abies forests in Sweden. For. Ecol. Manag. 2007, 238, 141–146. [Google Scholar] [CrossRef]
  38. Bella, I.E.; De Franceschi, J.P. Commercial Thinning Improves Growth of Jack; Information Report NOR-X-112; Northern Forest Research Centre: Edmonton, AB, Canada, 1974. [Google Scholar]
  39. Curtis, R.O.; Marshall, D.D. Levels-of-growing-stock Cooperative Study in Douglas-fir: Report No. 14-Stampede Creek: 30-year Results; Research paper PNW-RP-543; Pacific Northwest Research Station, USDA-Forest-Service: Washington, DC, USA, 2002; p. 77.
  40. Pape, R. Effects of thinning regime on the wood properties and stem quality of Picea abies. Scand. J. For. Res. 1999, 14, 38–50. [Google Scholar] [CrossRef]
  41. Mäkinen, H.; Isomäki, A. Thinning intensity and growth of Norway spruce stands in Finland. Forestry 2004, 77, 349–364. [Google Scholar] [CrossRef]
  42. Lähde, E.; Laiho, O.; Norokorpi, Y. Structure transformation and volume increment in Norway spruce-dominated forests following contrasting silvicultural treatments. For. Ecol. Manag. 2001, 151, 133–138. [Google Scholar] [CrossRef]
  43. Goudiaby, V.; Brais, S.; Berninger, F.; Schneider, R. Vertical patterns in specific volume increment along stems of dominant jack pine (Pinus banksiana) and black spruce (Picea mariana) after thinning. Can. J. For. Res. 2012, 42, 733–748. [Google Scholar] [CrossRef]
  44. Sharma, M.; Parton, J. Modeling stand density effects on taper for jack pine and black spruce plantations using dimensional analysis. For. Sci. 2009, 55, 268–282. [Google Scholar]
  45. Larson, P.R. Stem form development of forest trees. For. Sci. 1963, 9, 1–42. [Google Scholar] [CrossRef]
  46. Tasissa, G.; Burkhart, H.E. An application of mixed effects analysis to modeling thinning effects on stem profile of loblolly pine. For. Ecol. Manag. 1998, 103, 87–101. [Google Scholar] [CrossRef]
  47. Sharma, M.; Zhang, S.Y. Variable-exponent taper equations for jack pine, black spruce, and balsam fir in eastern Canada. For. Ecol. Manag. 2004, 198, 39–53. [Google Scholar] [CrossRef]
  48. Hébert, F.; Krause, C.; Plourde, P.-Y.; Achim, A.; Prégent, G.; Ménétrier, J. Effect of tree spacing on tree level volume growth, morphology, and wood properties in a 25-year-old Pinus banksiana plantation in the boreal forest of Quebec. Forests 2016, 7, 276. [Google Scholar] [CrossRef] [Green Version]
  49. Lemay, A.; Krause, C.; Achim, A. Primary and secondary branch growth in black spruce and balsam fir after careful logging around small merchantable stems (CLASS). Forests 2019, 10, 500. [Google Scholar] [CrossRef] [Green Version]
Figure 1. Mean relative radial tree-level growth ten years before (black) and ten years after (grey) treatment along the bole for thinned (dashed line) and control (solid line) stands. Data are unitless. Decennial relative radial tree-level growth (A) for control stands before and after treatment; (B) for thinned stands before and after treatment; (C) for both stand types; and (D) after treatment for both stand types.
Forests 10 01024 g001
Figure 2. Tree-level mean growth increment for each relative height from model estimates of the control and thinned stands. BLUPs, best linear unbiased prediction. Stars represent significantly different growth increments between treatments at a given relative height.
Forests 10 01024 g002
Table 1. Summary statistics of studied sites.
SiteLocationAnnual Precipitation (mm)Temperature
(Min/Max, °C)
Year of ThinningAgeinitDBHinit (cm)Ginit (Residuals and Harvested, m2 ha−1)Gharvested (%)
HEB95N47.887 W71.464992.9−12.1/17.9199548.4 (10)13.0 (3.7)29.1619.6
HEB96-1N48.315 W71.679992.9−12.1/17.9199658.7 (9)15.4 (4.1)23.769.7
HEB96-2N48.279 W71.683992.9−12.1/17.9199653.2 (8)16.6 (4)41.0531.8
HEB CN48.145 W71.589992.9−12.1/17.9 51.3 (9)15.8 (5.2)48.27
LB95N48.033 W72.331012.7−16.8/17.3199581.9 (27)14.7 (3.2)33.0813.1
LB CN48.032 W72.3341012.7−16.8/17.3 67.1 (23)14.6 (4.4)17.15
LC96N48.143 W71.8791036.7−11.7/19.3199656.3 (6)15.1 (1.8)44.8539.6
LC CN48.143 W71.8781036.7−11.7/19.3 54.9 (13)20.7 (4.8)35.24
LJ96N48.983 W72.738919.8−18.4/17.6199646.8 (6)13.6 (2.5)42.3052.5
LJ CN48.983 W72.741919.8−18.4/17.6 53.1 (7)12.3 (2.5)48.87
MV95N48.794 W70.5441187.3−16.1/17.5199560.9 (11)14.1 (3.1)40.0439.7
MV96N48.76 W70.5511187.3−16.1/17.5199659.5 (8)12.9 (2.4)32.9830.8
MV CN48.764 W70.551187.3−16.1/17.5 52.8 (12)14.6 (3.8)49.82
SL97N48.874 W71.7471061.4−11.7/18.2199757.1 (7)17.1 (2.4)40.1037.4
SL CN48.874 W71.4751061.4−11.7/18.2 50.2 (7)15.5 (5.6)33.99
Mean for harvested stands 5814.738.530.5
Mean for controls 5515.638.9
Legend: C, controls; G, basal area; init, year of partial cutting; DBH, diameter at breast height. Mean values are followed by their standard deviation in parentheses.
Table 2. Stand volume (V) and stand-level average volume by stem (AVS) at the year of harvest (init) and ten years after treatment (f).
StandsVinitit
(m3 ha−1)
Vf
(m3 ha−1)
Vtot (Partial and Final Harvest)AVSinit
(m3)
AVSf
(m3)
Stand Volume Increment (%) (RES Stems Only)
HEB9583.8269.4688.780.0730.104107.69
HEB96-1219.16204.29225.500.1950.215103.20
HEB96-2248.14182.18263.630.1400.152109.30
HEB C285.64306.04306.040.1270.136107.14
LB95204.48187.85216.970.1340.163107.12
LB C96.40110.41110.410.1010.116114.54
LC96272.16180.16294.350.1250.185114.05
LC C229.39237.41237.410.2550.264103.50
LJ96239.99124.97259.030.0840.076117.97
LJ C283.74298.07298.070.0730.076105.05
MV95190.80124.75201.480.0790.111109.36
MV96157.27120.41172.110.0680.102114.05
MV C268.48280.42280.420.0980.102104.45
SL97263.55183.81278.520.1620.223108.86
SL C218.27225.40225.400.1400.145103.27
Mean
Harvested stands208.82153.10222.260.1180.148110.18
Controls230.32242.96242.960.1320.140106.33
Legend: C, controls; RES stems only, residual stems only.
Table 3. Summary statistics of the selected trees and their competitors.
SitesNumber of Selected TreesMean DBH (cm)Mean H (m)Number of Living CompetitorsMean DBH of Living Competitors (cm)Number of Stumps of CompetitorsMean DBH of Stumps of Competitors (cm)
HEB95617.1 (3.4)12.5 (1.4)1.5 (1.5)13.4 (1.8)1.3 (1.0)11.6 (3.7)
HEB96-1617.2 (3.1)14.4 (2.1)2.2 (1.0)19.7 (2.7)0.7 (1.2)18.8 (2.5)
HEB96-2619.4 (3.2)16.3 (2.3)2.7 (0.8)15.2 (2.1)0.8 (0.4)18.3 (6.2)
HEB C318.9 (4.5)16.0 (2.3)3.3 (1.2)14.4 (3.2)N/AN/A
LB95616.7 (2.9)16.1 (2.6)3.0 (2.5)17.5 (1.1)1.7 (1.2)18 (4.6)
LB C316.9 (6.1)14.1 (3.6)2.7 (0.6)16.5 (0.8)N/AN/A
LC96622.5 (5.6)18.2 (1.9)1.8 (0.8)19.2 (2.2)2.5 (2.2)11.2 (0.7)
LC C317.9 (3.4)16.6 (0.6)2.3 (1.2)23.4 (2.0)N/AN/A
LJ96612.3(2.0)13.2 (0.9)2.2 (0.8)13.2 (0.8)1.7 (1.2)12.8 (2.9)
LJ C312.2 (2.4)14.0 (1.6)6.0 (1.7)11.1 (0.6)N/AN/A
MV95615.1 (3.6)13.0 (1.7)2.5 (1.6)15.8 (1.0)0.7 (0.8)12.7 (1.2)
MV96514.4 (1.6)12.7 (0.7)2.0 (1.6)15.0 (1.1)1.6 (1.8)9.8 (0.2)
MV C316.2 (1.6)12.7 (0.7)2.3 (2.1)12.1 (1.3)N/AN/A
SL97617.0 (3.2)16.0 (1.5)1.8 (1.0)25.2 (7.3)0.8 (1.3)15 (1.7)
SL C314.4 (3.5)13.9 (2.7)3.7 (2.1)11.5 (2.4)N/AN/A
Mean
Harvested stands616.9 (1.2)14.7 (0.5)2.2 (0.6)17.2 (2.0)1.3 (0.5)14.2 (1.9)
Controls316.1 (3.6)14.5 (1.9)3.4 (1.5)14.8 (1.7)N/AN/A
Legend: C, controls; H, height; N/A, not applicable. Mean values are followed by their standard deviation in parentheses.
Table 4. ANOVA for fixed effects for (a) stand-level increment, (b) Vtot harvested, and (c) stand-level increment.
VariableEffectNum DFDen DFF Valuep Value
(a) Stand volume incrementIntercept
Treatment
Ginit
1
1
1
7
7
7
19.655
1.583
−0.057
<0.0001
0.139
0.956
(b) Vtot harvestedIntercept
Treatment
Vinit
1
1
1
7
7
7
0.593
0.670
50.815
0.564
0.516
<0.0001
(c) Stem volume incrementIntercept
Treatment
Ginit
1
1
1
928
928
928
0.659
−0.182
0.561
0.510
0.856
0.575
Table 5. ANOVA for fixed effects for (a) lnGrowthInc, (b) ASEC, and (c) lnTaper. Only significant effects are presented in the table.
VariableEffectNum DFDen DFF Valuep Value
(a) lnGrowthInc 1Intercept1621433.040<0.0001
Treatment16312.7620.0007
Relative height (RH)962123.516<0.0001
CIs16316.9480.0001
Treatment × RH96217.810<0.0001
(b) ASEC 2Intercept170286.119<0.0001
Treatment1638.550340.0048
Time170211.583<0.0001
CIs1634.37940.0404
(c) lnTaper 3Intercept170367.546<0.0001
Treatment1634.6650.0346
Time17035.913<0.0001
Slenderness16323.072<0.0001
1 lnGrowthInc = log(GrowthInc); ASEC2 = Stem shape; 3 lnTaper = log(Taper). Legend: GrowthInc, growth increment; CIs, stump competition index.

