Article

Contrasting Temperature and Precipitation Patterns of Trees in Different Seasons and Responses of Infrared Canopy Temperature in Two Asian Subtropical Forests

1
Synthesis Research Center of Chinese Ecosystem Research Network, Key Laboratory of Ecosystem Network Observation and Modeling, Institute of Geographic Sciences and Natural Resources Research, Chinese Academy of Sciences, Beijing 100101, China
2
College of Resources and Environment, University of Chinese Academy of Sciences, Beijing 101408, China
3
South China Botanical Garden, Chinese Academy of Sciences, Guangzhou 510650, China
*
Author to whom correspondence should be addressed.
Forests 2019, 10(10), 902; https://doi.org/10.3390/f10100902
Submission received: 15 August 2019 / Revised: 2 October 2019 / Accepted: 5 October 2019 / Published: 13 October 2019
(This article belongs to the Section Forest Ecology and Management)

Abstract

:
Canopy temperature (Tc), one of the most important plant ecophysiological parameters, has been known to respond rapidly to environmental change. However, how environmental factors—especially the temperature and precipitation pattern—impact Tc has been less discussed for forest stands. In this study, we investigated seasonal variations and responses of the Tc and canopy-to-air temperature difference (ΔT) associated with environmental conditions in two subtropical forests with contrasting temperature and precipitation patterns—Dinghushan (DHS) (temperature and precipitation synchronous site: hot and wet in the summer) and Qianyanzhou (QYZ) (temperature and precipitation asynchronous site: hot and arid in the summer). The results showed that Tc exhibits clear diurnal and seasonal variations above air temperature throughout the day and year, suggesting that the canopy of both DHS and QYZ is typically warmer than ambient air. However, the canopy-warming effect was substantially intensified in QYZ, and the difference of ΔT between dry and wet seasons was small (−0.07 °C) in DHS, while it was up to 0.9 °C in QYZ. Regression analysis revealed that this resulted from the combined effects of the increased solar radiation and vapor pressure deficit (VPD), but reduced canopy conductance (gc) caused by drought in the summer in QYZ. Sensitivity analysis further indicated that the responses of ΔT to VPD and gc changes were quite divergent, presenting negative responses to the enhanced VPD and gc in QYZ, while there were positive responses in DHS. The high productivity coupled with low transpiration cooling that occurs in a temperature and precipitation synchronous condition mainly contributes to the positive responses of ΔT in DHS. This study reveals the seasonal variations, environmental responses, and underlying causes of Tc under different temperature and precipitation patterns, providing useful information for the regional assessment of plant responses to future climate change.

1. Introduction

Canopy temperature (Tc) is a paramount ecophysiological indicator that affects many ecosystem functions and processes including photosynthesis, respiration, evapotranspiration, and heat exchange [1,2]. The characteristics of Tc often change rapidly with stomatal conductance and environmental conditions, which further influences the dynamic interactions between the plant and the atmosphere [1,3].
Tc has been widely treated as a key plant water status indicator for cropland irrigation management. Recently, an increasing number of studies have begun to focus on the variation of Tc in natural or planted forests. For example, a study of mixed forest stands by Scherrer et al. [4] revealed that responses of Tc to water stress depended on tree species and dense-canopy species exhibited a warmer canopy than open-canopy species. Meier and Scherer [5] quantified the spatio-temporal patterns of Tc in urban forest, and found that a high fraction of impervious surfaces enhanced the increase of plant Tc. Tropical rainforests, subtropical evergreen forests, and savanna forests were found to show different Tc responses to climate change, with a higher sensitivity occurring in tropical rainforests [6,7]. Forest Tc measurements provide rapid and direct information on the plant water status over a large area [4,6]. Knowledge of species Tc and how Tc responds to the expected climate change are useful for predictions of changes in the community composition and timber productivity, as well as forest water resource management, for optimizing the benefits of forests [4,8,9]. Tc largely depends on the energy balance and is closely coupled with the plant water status. Previous studies have indicated that Tc is approximate to ambient air temperature at the beginning of a drought and is increasingly enhanced as the drought intensifies [4]. Substantial increases of Tc are commonly found in dry seasons or drought years [6,10]. This infers that water stress coupled with a high temperature drives plants to reduce stomatal conductance and plant transpiration for holding water, thereby warming leaves of the canopy upwards [11,12]. However, studies of a subtropical montane forest where the temperature was relative cool also pointed out that the dry season only caused weak canopy heating compared to the wet season [6,7]. This implies that the impacts of the temperature and precipitation condition on Tc are variable among stands, and the responses of Tc to temperature and precipitation factors may also be highly variable; however, the roles of temperature and precipitation factors (especially their pattern) have been less discussed.
The subtropical forest in Eastern Asia is one of the most important biomes, with high rates of carbon sequestration and unique climate characteristics [13]. This area is characterized by a typical monsoon climate, with clear dry and rainy seasons, influenced by monsoons from the Indian and Pacific Oceans. Because of the different influences of the two monsoons, the temperature and precipitation seasonality exhibits a divergent pattern in this region: during the summer, the southern part of this region is warm and rainy, while the southeastern part is warm and dry. We hypothesized that disparate patterns of the temperature and precipitation factors would drive different variations and responses of plant Tc in forest stands. In this study, we integrated Tc measurements from two subtropical forests with contrasting temperature and precipitation patterns in the Asian monsoon region to (1) quantify the differences in magnitude and seasonal dynamics of Tc; (2) examine the dominant factors driving the Tc seasonal variation; and (3) identify the differences in the responses of Tc to radiation, wind speed, and temperature-related factor changes in the two forests. These findings could advance our knowledge of the changes of plant canopy properties that may occur due to future climate change.

2. Materials and Methods

2.1. Site Description

The Dinghushan (DHS) subtropical forest site (23°10′16″ N, 112°31′48″ E, 300 m a.s.l.) is located at the DHS Biosphere Reserve in Guangdong Province, southern China (Figure 1). The region is characterized by a typical subtropical monsoon humid climate, with a mean annual temperature of 20.5 °C. The lowest and highest monthly mean temperature is 12.0 °C in January and 28.0 °C in July, respectively. The average annual rainfall is 1700 mm, of which more than 80% falls during the wet season (April–September) [14]. The predominant soil type is lateritic red earth. The soil bulk density is 1.01 g cm−3 at the soil surface of 0–40 cm, with a pH value of 3.8 [15]. The evergreen broadleaved forests are well-protected natural forest dominated by Castanopsis chinensis, Schima superba, Cryptocarya chinensis, Cryptocarya concinna, and Machilus chinensis. The canopy height of the dominant tree species is approximately 22 m and the mean leaf area index (LAI) is approximately 4 [15] (Table 1).
The Qianyanzhou (QYZ) subtropical forest site (26°44′52″ N, 115°03′47″ E, 102 m a.s.l.) is located at the QYZ experimental station of the Chinese Ecosystem Research Network, Jiangxi Province, southeast China (Figure 1). The area is characterized by a typical subtropical monsoon climate, with a mean annual temperature of 17.9 °C and mean total precipitation of 1472.8 mm (average of 1985–2012). The lowest and highest monthly mean temperature is −5.8 °C and 39.5 °C, respectively. Weathered from red sandstone, the soil is mainly red earth, with a bulk density of 1.57 g cm−3 at the soil surface of 0–40 cm [16]. The soil pH is around 4.7 [15]. The evergreen coniferous forest was planted in 1985. The dominant tree species are Masson pine (Pinus massoniana Lamb), Slash pine (Pinus elliottii Engelm), and Chinese fir (Cunninghamia lanceolata Hook), with mean heights of 13 m [17]. The mean LAI is around 3.5 [15] (Table 1).

2.2. Tc and Meteorological Factor Measurements

Flux towers, with eddy covariance systems, were established at the DHS and QYZ sites. An LI-7500 open-path H2O/CO2 analyzer (Li-7500, Li-Cor Inc., Lincoln, NE, USA) and a three-dimensional sonic anemometer (CSAT3, Campbell Scientific Inc., Logan, UT, USA) were mounted at 32 m and 23 m on the DHS and QYZ towers, respectively. An infrared temperature sensor (IRTS-P, Apogee Instruments, Inc., Logan, UT, USA) was installed on each tower to measure Tc. The sensors were aimed at the canopy and positioned at the height of 10.0 m above the forest canopy, with a consistent 28.5° field of view (FOV). Every 30 min, the average Tc was calculated and stored by a CR10X datalogger (Campbell Scientific Inc., Logan, UT, USA).
Synchronous meteorological factors (air temperature, relative humidity, and wind speed) were measured at the same height as the infrared temperature sensor on both towers. Air temperature and relative humidity sensors (HMP45C, Campbell Scientific Inc., USA) and wind speed sensors (A100R, Vector Inc., Rhyl Denbighshire, UK) were sampled at 2 Hz, and every 30 min, mean values were calculated and stored. A four-component net radiometer (CNR-1, Kipp & Zonen Inc., Delft, The Netherlands) and a pyranometer (CM11, Kipp & Zonen Inc., The Netherlands) were used to measure the downward, upward, and short- and long-wave radiation. In addition, the soil volumetric water content and soil temperature were measured using time domain reflectometry (TDR) probes (CS615-L, Campbell Scientific Inc.) and thermocouples (105T, Campbell Scientific Inc.), respectively. Soil heat flux was measured through two plates (HFT-3, Campbell Scientific Inc.) placed at the depth of 5 cm below the ground. Precipitation was monitored using a rain gauge (52203, RM Young Inc., Traverse City, MI, USA). All meteorological data were calculated at 30 min intervals and stored by the CR10X dataloggers (Campbell Scientific Inc.).

2.3. Canopy Conductance

Canopy conductance (gc) is the weighted integration of a leaf’s conductance of trees [18]. Daily gc in this study was calculated by averaging 30 min mean values from 11:00 to 14:00 on fine days, following the Penman–Monteith equation [19,20]:
g c = γ · λ E ( s ( R n G ) λ E ( s + γ ) ) ( 1 / g a ) + ρ a c p V P D
where λE is the latent heat flux (W m−2); γ is the psychrometric constant, which is a function of the air temperature (kPa K−1); s is the slope of relation between the saturated vapor pressure and temperature (kPa K−1); Rn is the net radiation (W m−2); G is the soil heat flux (W m−2); ρa is the air density (kg m−3); cp is the specific heat of air (J kg−1 K−1); VPD is the air vapor pressure deficit (kPa); and ga is the boundary layer conductance (m s−1).
The boundary layer conductance (ga) refers to the shapes of the wind speed, temperature, and humidity profiles in the surface boundary layer. Based on the terms of the Monin–Obukhov similarity theory, ga was calculated as follows [21,22]:
g a = k u * l n ( ( Z r d ) / Z 0 )
where u* is the friction velocity (m s−1); k is the von Karman constant (0.4); Zr is the reference or measurement height (m); d is the zero plane displacement height (m), which is given as 0.78 h; Z0 is the roughness length (m), which is given as 0.075 h; and h is the height of the canopy (m).

2.4. Sensitivity of Tc to Environmental Factor Change

Based on the atmospheric boundary layer water and energy exchange theory, the sensible heat flux (H) and latent heat flux (λE) can be expressed as [23]
H = ρ a c p ( T c T a ) r a H
λ E = ρ a c p ( e s ( T 0 ) e a ) γ r V
where Tc is the canopy temperature (K), Ta is the air temperature (K), raH is the resistance of heat transport to air (s m−1), rv is the total resistance of water vapor to transport (s m−1), es(T0) is the saturated vapor pressure at the surface (kPa), and ea is the vapor pressure in the air (kPa).
The water vapor pressure is a function of temperature, and can be transformed by the Penman function as
( e s ( T 0 ) e a ) = s ( T c T a ) + V P D
where VPD is the air vapor pressure deficit (kPa). By combining the above Equations (3)–(5) and the energy balance function, we can calculate the difference between the canopy and air temperature as follows:
Δ T = T c T a = r a H γ r V ( R n G ) r a H ρ a c p V P D ρ a c p ( γ r V + s r a H )
where ΔT is the difference between the canopy temperature (Tc) and air temperature (Ta) (K), and raH is the parallel sum of raH,forced and raH,free, which is given as raH = (raH,forced−1 +raH,free−1)−1 [12,23]. raH,forced and raH,free were calculated from the empirical relations of Monteith [24] and Jones [12], respectively:
r a H , f r e e = 400 | T c T a | 0.33
r a H , f o r c e d = 100 ( D W s ) 0.5
where D is the leaf dimension (m); Ws is the wind speed (m s−1); and rV is the sum of leaf stomatal resistance (rc) (s m−1) and the boundary layer resistance to water vapor transport ra (s m−1), given as rV = rc + ra.

2.5. Data Analysis

A curve estimate analysis was performed to examine the relationships between diurnal and seasonal variations of ΔT and each of the potential factors, including the solar radiation (Rg), air temperature (Ta), vapor pressure deficit (VPD), wind speed (Ws), 5 cm soil water content (Swc), and canopy conductance (gc), and to determine whether the relationship was significant at the level of α = 0.05. The best fit curve was selected by the largest coefficient of determination (R2). A nonlinear regression model (NRM) was further built to analyze the effects on and relative contributions of influencing factors to the variations of ΔT in SPSS (Statistical Product and Service Solutions) software (version 20.0, Chicago, IL, USA).
We built a model to estimate the variation of ΔT based on the Tc calculating Equations (6)–(8) and the revealed dominant influencing factors. Daily Tc values and environmental factors in the dry season were used for model estimation and validation at both sites. The adjusted-R2 and Root Mean Square Error (RMSE) in relationships of the simulated and observed data were used to assess the performance of the model.

3. Results

3.1. Seasonal Variation of Meteorological Factors

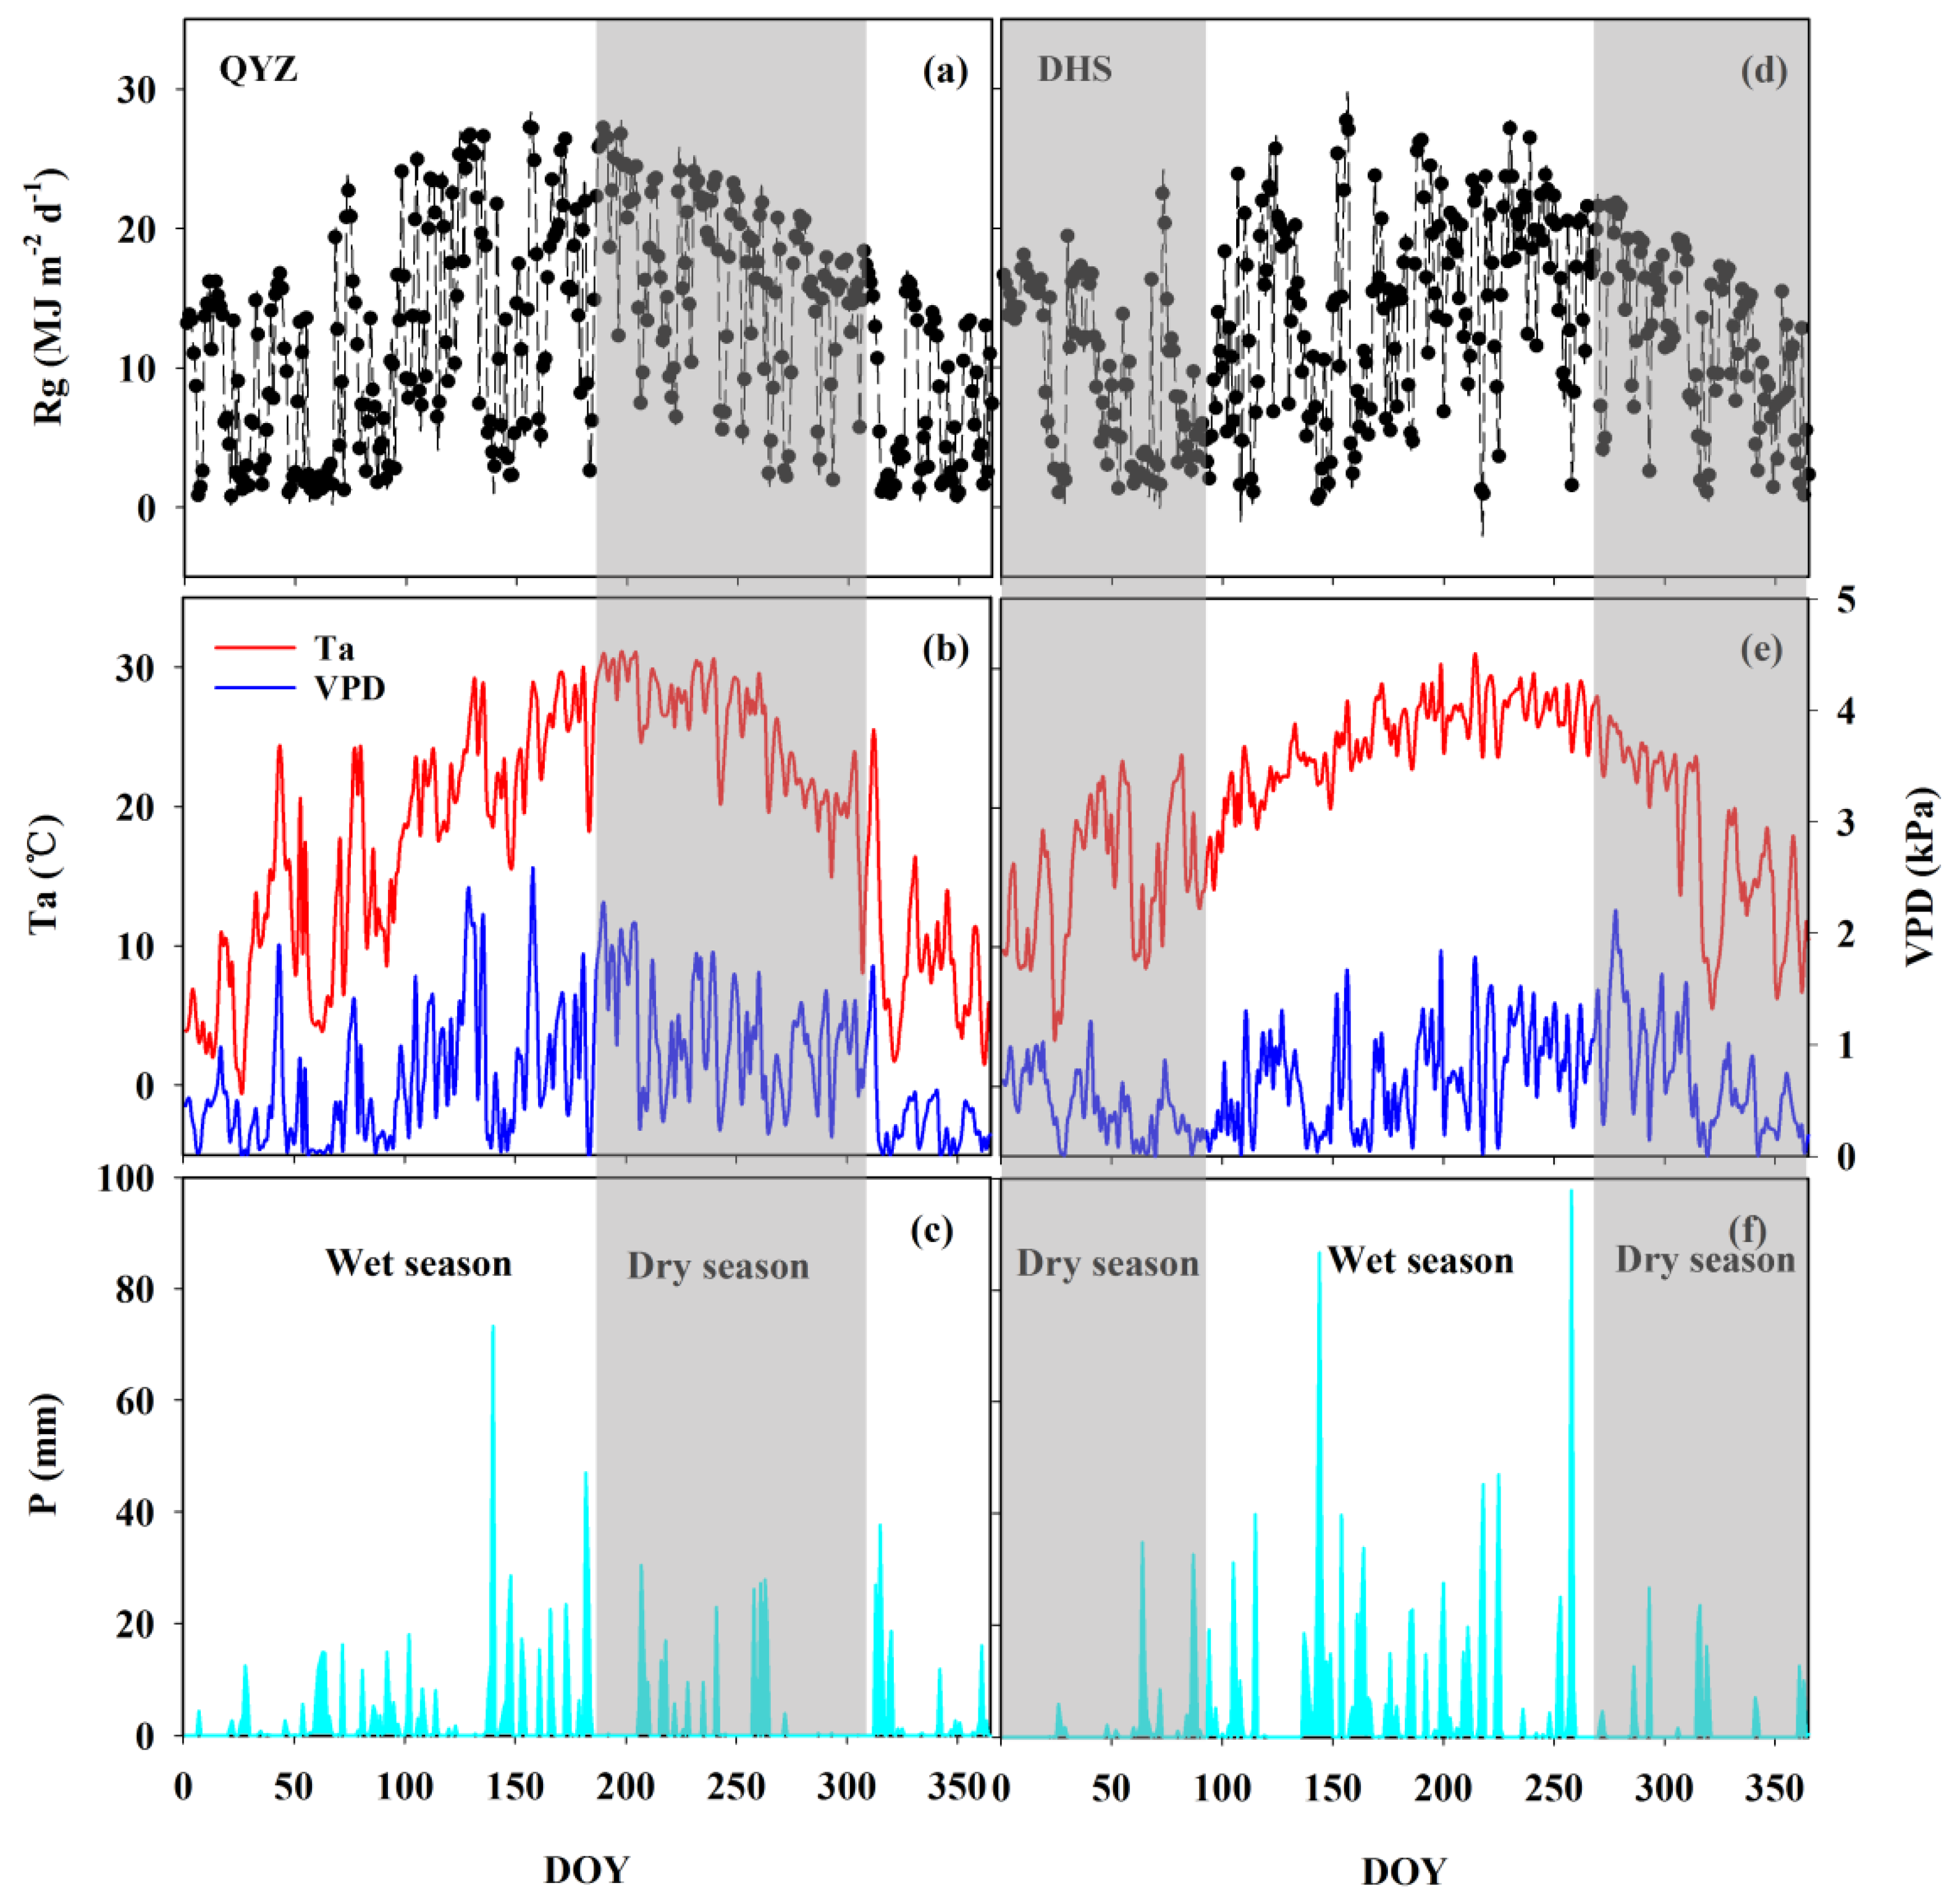
Seasonal variation of daily meteorological factors, Rg, Ta, VPD, and total rainfall (P), at both sites, are shown in Figure 2. Rg fluctuated during the entire year (Figure 2a,d), but no significant differences in the total Rg were found between the two sites (Table 2). Ta exhibited a unimodal seasonal pattern, with the maximum Ta occurring in summer (June–August), at both sites (Figure 2b,e). The mean annual Ta and soil temperature (Ts) at the DHS site were slightly higher than those of the QYZ site. The mean annual Ta and Ts was 20.29 °C and 20.39 °C in DHS and 18.28 °C and 17.77 °C in QYZ, respectively. No significant differences in the mean annual VPD, Swc, and P were found between the two sites (Table 2). However, climate factors showed opposite variation patterns across seasons between the two sites (Figure 2 and Table 2).
As shown in Table 2, clear wet and dry seasons were detected at both sites. At the DHS site, about 78% of the P (1354 mm) occurred from April to September (defined as the wet season) and 22% occurred from October to March (defined as the dry season). At the QYZ site, about 67% of the P (1015 mm) occurred from November to June (wet season) and 33% occurred from July to October (dry season). These seasonal variations of rainfall were in line with the long-term records and previous studies for both sites [14,16]. Radiation and temperature showed opposite relationships with rainfall across seasons between the two sites. The mean Rg in the dry season was about 3.48 MJ m−2 d−1 lower than that in the wet season at the DHS site, while at the QYZ site, the mean Rg was 5.8 MJ m−2 d−1 higher than that in the wet season (Table 2). The mean Ta was accordingly 8.45 °C lower in the dry season compared to the wet season at the DHS site, while it was 11.03 °C higher in the dry season than the wet season at the QYZ site (Table 2). Therefore, in the dry season, the climate was arid and cool at the DHS site, whereas it was arid and hot at the QYZ site (Table 2).

3.2. Diurnal Variations of Tc and Other Factors

Tc showed consistently unimodal diurnal patterns with Ta at both sites (Figure 3). However, the diurnal variation of ΔT was different in the same season between the two sites. In the dry season, the maximum ΔT value occurred at 11:00 at the QYZ site (Figure 3a), and it occurred at 13:00 at the DHS site (Figure 3b). The nighttime ΔT values at the DHS site were lower than those of the QYZ site, while the daytime ΔT values were higher compared to those of the QYZ site (Figure 3e). The maximum ΔT values in the dry season at the QYZ and DHS sites were 3.32 °C and 4.51 °C, respectively, with a higher ΔT value of 1.19 °C at the DHS site (Figure 3e). In the wet season, the maximum ΔT value occurred at 11:30 and 12:30 at the QYZ and DHS sites, respectively (Figure 3c,d). A higher ΔT value was exhibited at the DHS site throughout the day. The maximum ΔT value was 2.16 °C higher at the QYZ site compared to that at the DHS site (Figure 3f). However, the difference of the maximum ΔT value between the dry and wet seasons was up to 0.9 °C at the QYZ site, while it was small (−0.07 °C) at the DHS site (Figure 3e,f).
The influencing factors for the diurnal variation of ΔT were further detected by the curve estimate analysis (Table 3). The analysis indicated that Rg, Ta, VPD, Ws, and Swc significantly influenced the diurnal variations of ΔT, whereas Rg was the primary factor affecting the diurnal ΔT during the dry and wet seasons at the two sites (Table 3). Rg accounted for over 95% of the variations in ΔT during the dry and wet seasons at the two sites (Figure S1).

3.3. Seasonal Variations of Tc and Other Factors

The average Tc from 11:00 to 14:00 was calculated for each day during the study period at both sites. As shown in Figure 4, Tc showed a clear seasonal variation pattern following that of Ta at both sites. However, ΔT greatly varied across seasons, and the difference of the ΔT value between the dry and wet season was divergent between the two sites. At the QYZ site, the ΔT value in the dry season was 0.82 °C higher than that of the wet season, while at the DHS site, the ΔT value in the dry season was 0.16 °C lower than that of the wet season (Figure 4).
The effects of the dominant influencing factors on the seasonal variation of ΔT were further detected and quantified by the curve estimate and nonlinear regression analysis. The analysis indicated that Rg, followed by Ws, were the primary factors affecting the ΔT across seasons at the two sites (Table 4). Rg and Ws together accounted for 76% and 78% of the variations in ΔT at the QYZ site, and accounted for 86% and 35% of the variation in ΔT at the DHS site, in the dry and wet seasons, respectively (Table 4). In the dry season, ΔT was also impacted by VPD at the QYZ site, and impacted by VPD and gc at the DHS site. Compared with the wet season (ss% = 82.7, and 40.2), meteorological factors caused larger variation of ΔT in the dry season at both sites (ss% = 90.8, and 91.7), which suggests the close dependence of Tc on climate in the dry season (Table 4).

3.4. Sensitivity of ΔT to Changes in Environmental Factors

By combining the above Tc calculating Equations (6)–(8) and the revealed dominant influencing factors, we could build the model to estimate the variation of ΔT as
T c T a = α R n / g c + β R n w s 0.5 δ V P D   w s 0.5 / g c + θ + ε
where α, β, δ, θ, and ε are model-fitting parameters.
Daily Tc values and environmental factors in the dry season were used for model parameterization and validation at both sites. The results of model validation showed that the simulated ΔT was in good agreement with the observed ΔT (Figure S2), and the established ΔT models (Table 5) could predict 86% and 94% of the variation in the observed ΔT for the QYZ and DHS site, respectively.
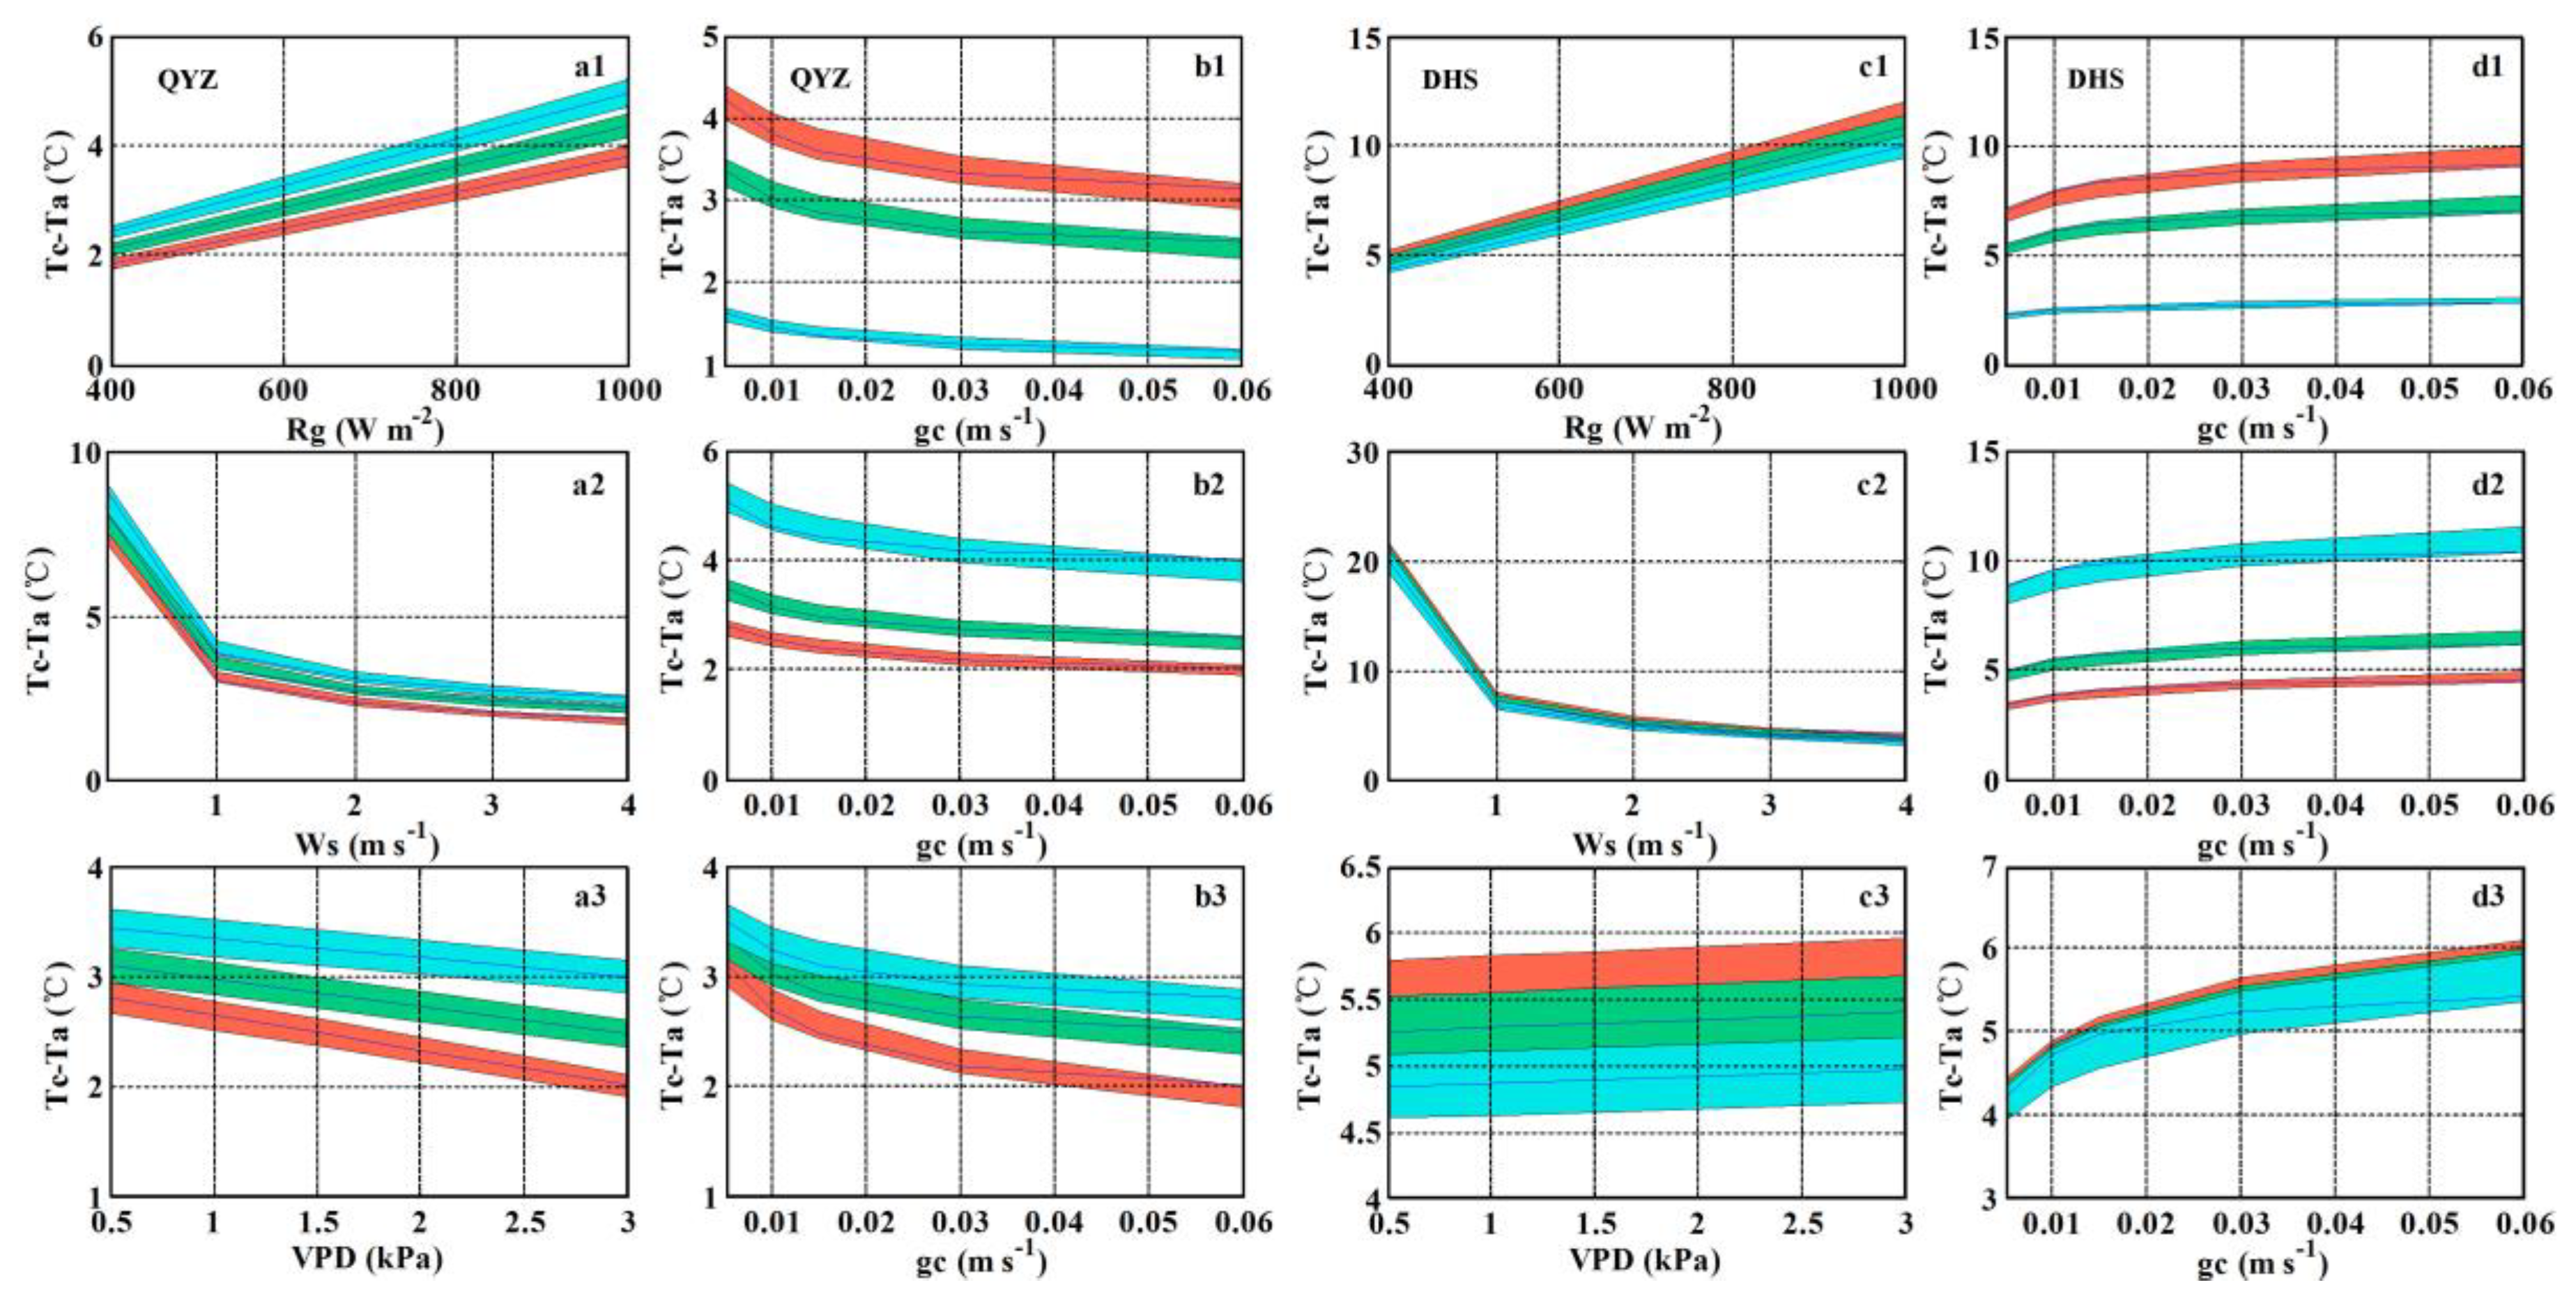
To explore the differences in responses of ΔT to changes in environmental factors at the QYZ and DHS sites, we further evaluated the variation of ΔT at different conditions of Rg, Ws, VPD, and gc. As shown in Figure 5, ΔT was very sensitive to the simulated meteorological conditions at the two sites. ΔT increased linearly with increasing Rg. The increase of ΔT was steeper at the DHS site, with an average that was 3.8 °C higher than that of the QYZ site (Figure 5a1,c1). However, with a reduced gc level, the increase of ΔT was larger at the QYZ site compared to that at the DHS site, indicating that the relation between Rg and ΔT had a higher sensitivity to the degree of gc at the QYZ site. ΔT decreased non-linearly with increasing Ws, indicating the cooling effects of winds on Tc. The reduction of ΔT at the QYZ site was nearly three times that of the DHS site (Figure 5a2,c2). ΔT showed a linear response to the increasing VPD, which was consistent with the results of previous studies [6,23]. However, the responses of ΔT to VPD showed opposite patterns between the two sites (Figure 5a3,c3). At the QYZ site, ΔT linearly decreased with increasing VPD, while at the DHS site, it showed an increasing trend. The variation of ΔT with increasing VPD was enlarged with the increase of gc. There was a much larger difference of ΔT among the three gc levels at the QYZ site, indicating that the relation between VPD and ΔT was more sensitive to the degree of gc at the QYZ site.
ΔT also showed opposite patterns with increasing gc between the two sites (Figure 5b,d). At the QYZ site, ΔT decreased nonlinearly with increasing gc, while it increased at the DHS site. At high Rg and VPD, and low Ws levels, ΔT showed the maximum variation with increasing gc. Given the same Rg, VPD, and Ws levels, the variation of ΔT was larger at the DHS site than the QYZ site.

4. Discussion

Our analysis showed that the Tc of the two sites exhibited clear diurnal and seasonal variation above Ta throughout the day and the year, indicating that the canopy of the studied subtropical forests is typically warmer than ambient air. These warming effects are consistent with previous findings in tropical, subtropical, and temperate natural forests, as well as urban forests [4,6,7,23,25]. By contrast, Asian subtropical forests (2.42–4.58 °C) have a comparable canopy heating effect to temperate forests (3.5–5 °C), while they exert greater heating effects compared to tropical forests (−0.2–2 °C). Our results also showed that in both the dry and wet season, DHS exhibited a consistently higher Tc-Ta than QYZ. This different warming effect is most likely associated with the different tree species, plant architectures, and leaf sizes of the two sites [1,4,26]. The forest of the DHS site is dominated by broadleaved species with a larger leaf size than needle leaves in QYZ. Additionally, the DHS site presents a higher community leaf area index (LAI: 0.4) than that in QYZ (LAI: 3.5). This relatively dense canopy can warm leaves up greatly compared to the open canopy, which is a result that was similarly found by Scherer et al. [4].
Water stress has been supposed to augment the increase of Tc. Substantial increases of ΔT in the dry season or in drought years are commonly found in studies on croplands and forests [6,10]. Under water stress, plants most likely reduce stomatal conductance to decrease transpiration, thereby leading to an increase of leaf temperature [11,12]. This hypothesis is supported by the findings in this study. However, our results showed that the impacts of water stress on Tc were divergent, with different temperature and precipitation patterns. The difference in ΔT between the dry and wet seasons was small (−0.07 °C) in the temperature and precipitation synchronous site of DHS, while it was up to 0.9 °C in the asynchronous site of QYZ. This great heating effect on canopy leaves can most likely be attributed to the following two reasons: (i) the high inputs of Rg and (ii) the reduced gc caused by drought in the dry season.
The regression analysis indicated that Rg was the dominant factor in ΔT variations at both sites. Rg could account for over 95% of the diurnal variations and 59–80% of the seasonal variations in ΔT during the dry and wet seasons (Table 4). With the increase of radiation, Tc appeared to positively increase, demonstrating the evident heating effects of radiation energy on Tc (Figure 5). Comparative results further showed that the mean Rg during the dry season at the QYZ site was 5.8 MJ m−2 d−1 higher than that during the wet season, and it was 5.69 MJ m−2 d−1 higher than that of the DHS site (Table 2). The intensive Rg input on the canopy during the dry season most likely drives ΔT [6,7,27].
Enhanced VPD and decreased gc caused by drought in the dry season may be other reasons for the enhanced increase of ΔT at the QYZ site. We found that there was no significant difference in VPD and gc between the dry and wet season at the DHS site, whereas the VPD and gc during the dry season was significantly increased and decreased, respectively, at the QYZ site (Figure S3). This decreased gc is expected to impede the transpiration and heat dissipation of leaves [4,12,23], resulting in an increase of ΔT at the QYZ site. Our results showed that the sensible heat flux was decreased during the dry season at the QYZ site (Figure S4). Despite the fact that the two sites shared similar climate zones, different temperature and precipitation patterns impacted ΔT and its responses to environmental change. Our results showed that ΔT increased linearly with Rg and decreased nonlinearly with Ws (Figure 5a1–a2,c1–c2), which confirmed the warming effect of radiation and cooling effect of wind on Tc [6,7,23,27]. However, we found that the ΔT at the two sites responded differently to the temperature-influenced variables, such as VPD and gc. These different inter-site responses primarily resulted from the divergent temperature and precipitation patterns of the sites, i.e., the arid and hot dry season at the QYZ site, and the arid and cool dry season at the DHS site (Table 2). A previous study has shown that gc increase with temperature in a cold environment and tended to decrease when the environment became warmer [28]. A warm condition with water-deficit plants would decrease gc, thereby increasing the leaf temperature. Conversely, plants in cold areas most likely increase gc to maximize photosynthesis and production. Yan et al. [14] indicated that at the DHS site, the dry season acts as an important period for net carbon uptake, with a mean net carbon uptake that is approximately 81.4% higher than that in the wet season. Our results consistently demonstrated that there was a high ecosystem productivity in the dry season at the DHS site in the studied period (Figure S5). Meanwhile, the low temperature leading to a low VPD and low transpiration rate in the dry season were also found at the DHS site by current and previous studies [29]. As a result, the high productivity and low transpiration cooling during the dry season jointly contributed to the positive response of ΔT to gc at the DHS site. Assuming that the seasonal droughts continue to intensify in the Asian subtropical region, as predicted in global warming scenarios [30,31,32], the Tc may increase further in the temperature and precipitation asynchronous sites, impacting plant growth and ecosystem productivity. Therefore, maintaining the water balance under forest management is strongly needed for sites with seasonal droughts.

5. Conclusions

Measurements of infrared canopy temperature provided a useful understanding of the plant response to environmental changes in different forest ecosystems. This study indicated that the canopy of subtropical forests is typically warmer than ambient air. The canopy-warming effect was intensified at the temperature and precipitation asynchronous site. This enhanced increase of canopy-to-air temperature difference primarily resulted from the higher solar radiation inputs and enhanced vapor pressure deficit, as well as the reduced canopy conductance caused by drought, in the dry season. Moreover, the canopy-to-air temperature difference presented consistent linear responses to solar radiation and nonlinear responses to wind speed, while exhibiting the opposite responses to temperature-controlled factors (vapor pressure deficit and canopy conductance) under the influences of different temperature and precipitation patterns. This study suggests that despite the similar climate zones, the pattern of the temperature and precipitation condition crucially affects the canopy-warming effect and its response to environmental change. In order to more accurately predict plant responses to environmental change, this impact needs to be taken into account.

Supplementary Materials

The following are available online at https://www.mdpi.com/1999-4907/10/10/902/s1, Figure S1: The relationship between the diurnal variations of the measured solar radiation (Rg) and canopy to air temperature difference (ΔT:Tc-Ta) at the Qianyanzhou (QYZ) (a) and Dinghushan (DHS) (b) site, Figure S2: The relationships between the simulated and observed seasonal variations in canopy to air temperature difference (ΔT:(Tc-Ta) at the Qianyanzhou (QYZ) (a) and Dinghushan (DHS) (b) site., Figure S3: The seasonal variations of vapor pressure deficit (VPD) and canopy conductance (gc) at the Qianyanzhou (QYZ) (a) (c) and Dinghushan (DHS) (b) (d) site, Figure S4: The seasonal variations of sensible heat and latent heat flux at the Qianyanzhou (QYZ) (a) (c) and Dinghushan (DHS) (b) (d) site, Figure S5: The seasonal variations of net ecosystem productivity (a) and evapotranspiration (b) at the Dinghushan (DHS) site.

Author Contributions

Z.C. performed the data analysis and wrote the paper. G.Y. revised the paper. J.Y. and H.W. conducted the measurement.

Funding

This study was supported by the National Key Research and Development Program of China (No. 2016YFA0600103 and 2016YFA0600104), National Natural Science Foundation of China (No. 31600347, 41671045 and 41501381), and Strategic Priority Research Program of the Chinese Academy of Sciences (XDA19020302).

Acknowledgments

We would like to thank the anonymous reviewers for their valuable comments and suggestions which improved our paper.

Conflicts of Interest

The authors declare no conflict of interest.

References

  1. Leuzinger, S.; Korner, C. Tree species diversity affects canopy leaf temperatures in a mature temperate forest. Agric. For. Meteorol. 2007, 146, 29–37. [Google Scholar] [CrossRef]
  2. Blonquist, J.M.; Norman, J.M.; Bugbee, B. Automated measurement of canopy stomatal conductance based on infrared temperature. Agric. For. Meteorol. 2009, 149, 1931–1945. [Google Scholar] [CrossRef]
  3. Jarvis, P.G.; Mcnaughton, K.G. Stomatal control of transpiration: Scaling up from leaf to region. Adv. Ecol. Res. 1986, 15, 1–49. [Google Scholar]
  4. Scherrer, D.; Bader, M.K.F.; Korner, C. Drought-sensitivity ranking of deciduous tree species based on thermal imaging of forest canopies. Agric. For. Meteorol. 2011, 151, 1632–1640. [Google Scholar] [CrossRef]
  5. Meier, F.; Scherer, D. Spatial and temporal variability of urban tree canopy temperature during summer 2010 in Berlin, Germany. Theor. Appl. Climatol. 2012, 110, 373–384. [Google Scholar] [CrossRef]
  6. Song, Q.H.; Deng, Y.; Zhang, Y.P.; Deng, X.B.; Lin, Y.X.; Zhou, L.G.; Fei, X.H.; Sha, L.Q.; Liu, Y.T.; Zhou, W.J.; et al. Comparison of infrared canopy temperature in a rubber plantation and tropical rain forest. Int. J. Biometeorol. 2017, 61, 1885–1892. [Google Scholar] [CrossRef] [PubMed]
  7. Song, Q.H.; Zhang, Y.P.; Sha, L.Q.; Deng, X.B.; Deng, Y.; Wu, C.S.; Lu, Z.Y.; Chen, A.G.; Zhang, S.B.; Li, G.; et al. Canopy temperature variability in a tropical rainforest, subtropical evergreen forest, and savanna forest in Southwest China. Iforest-Biogeosci. For. 2017, 10, 611–617. [Google Scholar] [CrossRef] [Green Version]
  8. Gessler, A.; Keitel, C.; Kreuzwieser, J.; Matyssek, R.; Seiler, W.; Rennenberg, H. Potential risks for European beech (Fagus sylvatica L.) in a changing climate. Trees Struct. Funct. 2007, 21, 1–11. [Google Scholar] [CrossRef]
  9. Zweifel, R.; Rigling, A.; Dobbertin, M. Species-specific stomatal response of trees to drought - a link to vegetation dynamics? J. Veg. Sci. 2009, 20, 442–454. [Google Scholar] [CrossRef]
  10. Ballester, C.; Jiménez-Bello, M.A.; Castel, J.R.; Intrigliolo, D.S. Usefulness of thermography for plant water stress detection in citrus and persimmon trees. Agric. For. Meteorol. 2013, 168, 120–129. [Google Scholar] [CrossRef]
  11. Campbell, G.S.; Norman, J.M. Estimation of plant water status from canopy temperature: An analysis of the inverse problem. In Applications of Remote Sensing in Agriculture; Steven, M.D., Clark, J.A., Eds.; Butterworths: London, UK, 1990. [Google Scholar]
  12. Jones, H.G. Use of infrared thermometry for estimation of stomatal conductance as a possible aid to irrigation scheduling. Agric. For. Meteorol. 1999, 95, 139–149. [Google Scholar] [CrossRef]
  13. Yu, G.R.; Chen, Z.; Piao, S.L.; Peng, C.H.; Philippe, C.; Wang, Q.F.; Li, X.R.; Zhu, X.J. High carbon dioxide uptake by subtropical forest ecosystems in the East Asian monsoon region. Proc. Natl. Acad. Sci. USA 2014, 111, 4910–4915. [Google Scholar] [CrossRef] [PubMed] [Green Version]
  14. Yan, J.H.; Zhang, Y.P.; Yu, G.R.; Zhou, G.Y.; Zhang, L.M.; Li, K.; Tan, Z.L.; Sha, L.Q. Seasonal and inter-annual variations in net ecosystem exchange of two old-growth forests in southern China. Agric. For. Meteorol. 2013, 182–183, 257–265. [Google Scholar] [CrossRef]
  15. Yu, G.R.; Zhang, L.M.; Sun, X.M.; Fu, Y.L.; Wen, X.F.; Wang, Q.F.; Li, S.G.; Ren, C.Y.; Song, X.; Liu, Y.F.; et al. Environmental controls over carbon exchange of three forest ecosystems in eastern China. Glob. Chang. Biol. 2008, 14, 2555–2571. [Google Scholar] [CrossRef]
  16. Tang, Y.K.; Chen, Y.M.; Wen, X.F.; Sun, X.M.; Wu, X.; Wang, H.M. Variation of carbon use efficiency over ten years in a subtropical coniferous plantation in southeast China. Ecol. Eng. 2016, 97, 196–206. [Google Scholar] [CrossRef]
  17. Wen, X.F.; Wang, H.M.; Wang, J.L.; Yu, G.R. Ecosystem carbon exchanges of a subtropical evergreen coniferous plantation subjected to seasonal drought, 2003–2007. Biogeosciences 2010, 7, 357–369. [Google Scholar] [CrossRef]
  18. Baldocchi, D. On using eco-physiological, micrometeorological and biogeochemical thoery to evaluate carobn dioxide, water vapor and trace gas fluxes over vegettion: A perspetive. Agric. For. Meteorol. 1998, 90, 1–25. [Google Scholar] [CrossRef]
  19. Monteith, J.L.; Unsworth, M.H. Principles of Environmental Physics, 2nd ed.; Elsevier: Amesterdam, The Netherlands, 2008. [Google Scholar]
  20. Ryu, Y.; Baldocchi, D.D.; Ma, S.; Hehn, T. Interannual variability of evapotranspiration and energy exchange over an annual grassland in California. J. Geophys. Res. Atmos. 2008, 113, 1–16. [Google Scholar] [CrossRef]
  21. Monin, A.S.; Obukhov, A.M. Basic laws of turbulent mixing in the ground layer of the atmosphere. Tr. Geofiz. st. Akad. Nauk, SSSR no. 24. In Sammelband zur Statistischen Theorie der Turulenz (German translation 1958); Goering, H., Ed.; Akademie Verlag: Berlin, Germany, 1954. [Google Scholar]
  22. Yu, G.R. Progress in evapotranspiration models for terrestrial vegetation of different canopy types. Resour. Sci. 2001, 23, 72–84. [Google Scholar]
  23. Maes, W.H.; Steppe, K. Estimating evapotranspiration and drought stress with ground-based thermal remote sensing in agriculture: A review. J. Exp. Bot. 2012, 63, 4671–4712. [Google Scholar] [CrossRef]
  24. Monteith, J.L. Principles of Environmental Physics; Edward Arnold: London, UK, 1973. [Google Scholar]
  25. Yang, Z.; Zhang, Y.P.; Yu, G.R.; Zhao, S.J.; Song, Q.H.; Gao, J.M. Characteristics of canopy and air temperature in tropical seasonal rainforests in Xishuangbanna. Chin. J. Ecol. 2009, 28, 845–849. [Google Scholar]
  26. Still, C.; Powell, R.; Aubrecht, D.; Kim, Y.; Helliker, B.; Roberts, D.; Richardson, A.D.; Goulden, M. Thermal imaging in plant and ecosystem ecology: Applications and challenges. Ecosphere 2019, 10, e02768. [Google Scholar] [CrossRef]
  27. Maes, W.H.; Achten, W.M.J.; Reubens, B.; Muys, B. Monitoring stomatal conductance of Jatropha curcas seedlings under different levels of water shortage with infrared thermography. Agric. For. Meteorol. 2011, 151, 554–564. [Google Scholar] [CrossRef]
  28. Saito, T.; Kumagai, T.; Tateishi, M.; Kobayashi, N.; Otsuki, K.; Giambelluca, T.W. Differences in seasonality and temperature dependency of stand transpiration and canopy conductance between Japanese cypress (Hinoki) and Japanese cedar (Sugi) in a plantation. Hydrol. Process 2017, 31, 1952–1965. [Google Scholar] [CrossRef]
  29. Yu, G.R.; Song, X.; Wang, Q.F.; Liu, Y.F.; Guan, D.X.; Yan, J.H.; Sun, X.M.; Zhang, L.M.; Wen, X.F. Water-use efficiency of forest ecosystems in eastern China and its relations to climatic variables. New Phytol. 2008, 177, 927–937. [Google Scholar] [CrossRef] [PubMed]
  30. Bates, B.C.; Kundzewicz, Z.W.; Wu, S.; Palutikof, J.P. Climate change and water. In Technical Paper of the Intergovernmental Panel on Climate Change; IPCC Secretariat: Geneva, Switzerland, 2008. [Google Scholar]
  31. IPCC. Summary for Policymakers. In Climate Change 2013: The Physical Science Basis. Contribution of Working Group I to the Fifth Assessment Report of the Intergovernmental Panel on Climate Change; Stocker, T.F., Qin, D., Plattner, G.K., Tignor, M., Allen, S.K., Boschung, J., Nauels, A., Xia, Y., Bex, V., Midgley, P.M., Eds.; Cambridge University Press: Cambridge, UK; New York, NY, USA, 2013. [Google Scholar]
  32. Chevuturi, A.; Klingaman, N.P.; Turner, A.G.; Hannah, S. Projected changes in the Asian-Australian monsoon region in 1.5 °C and 2.0 °C global-warming scenarios. Earth’s Fut. 2018, 6, 339–358. [Google Scholar] [CrossRef]
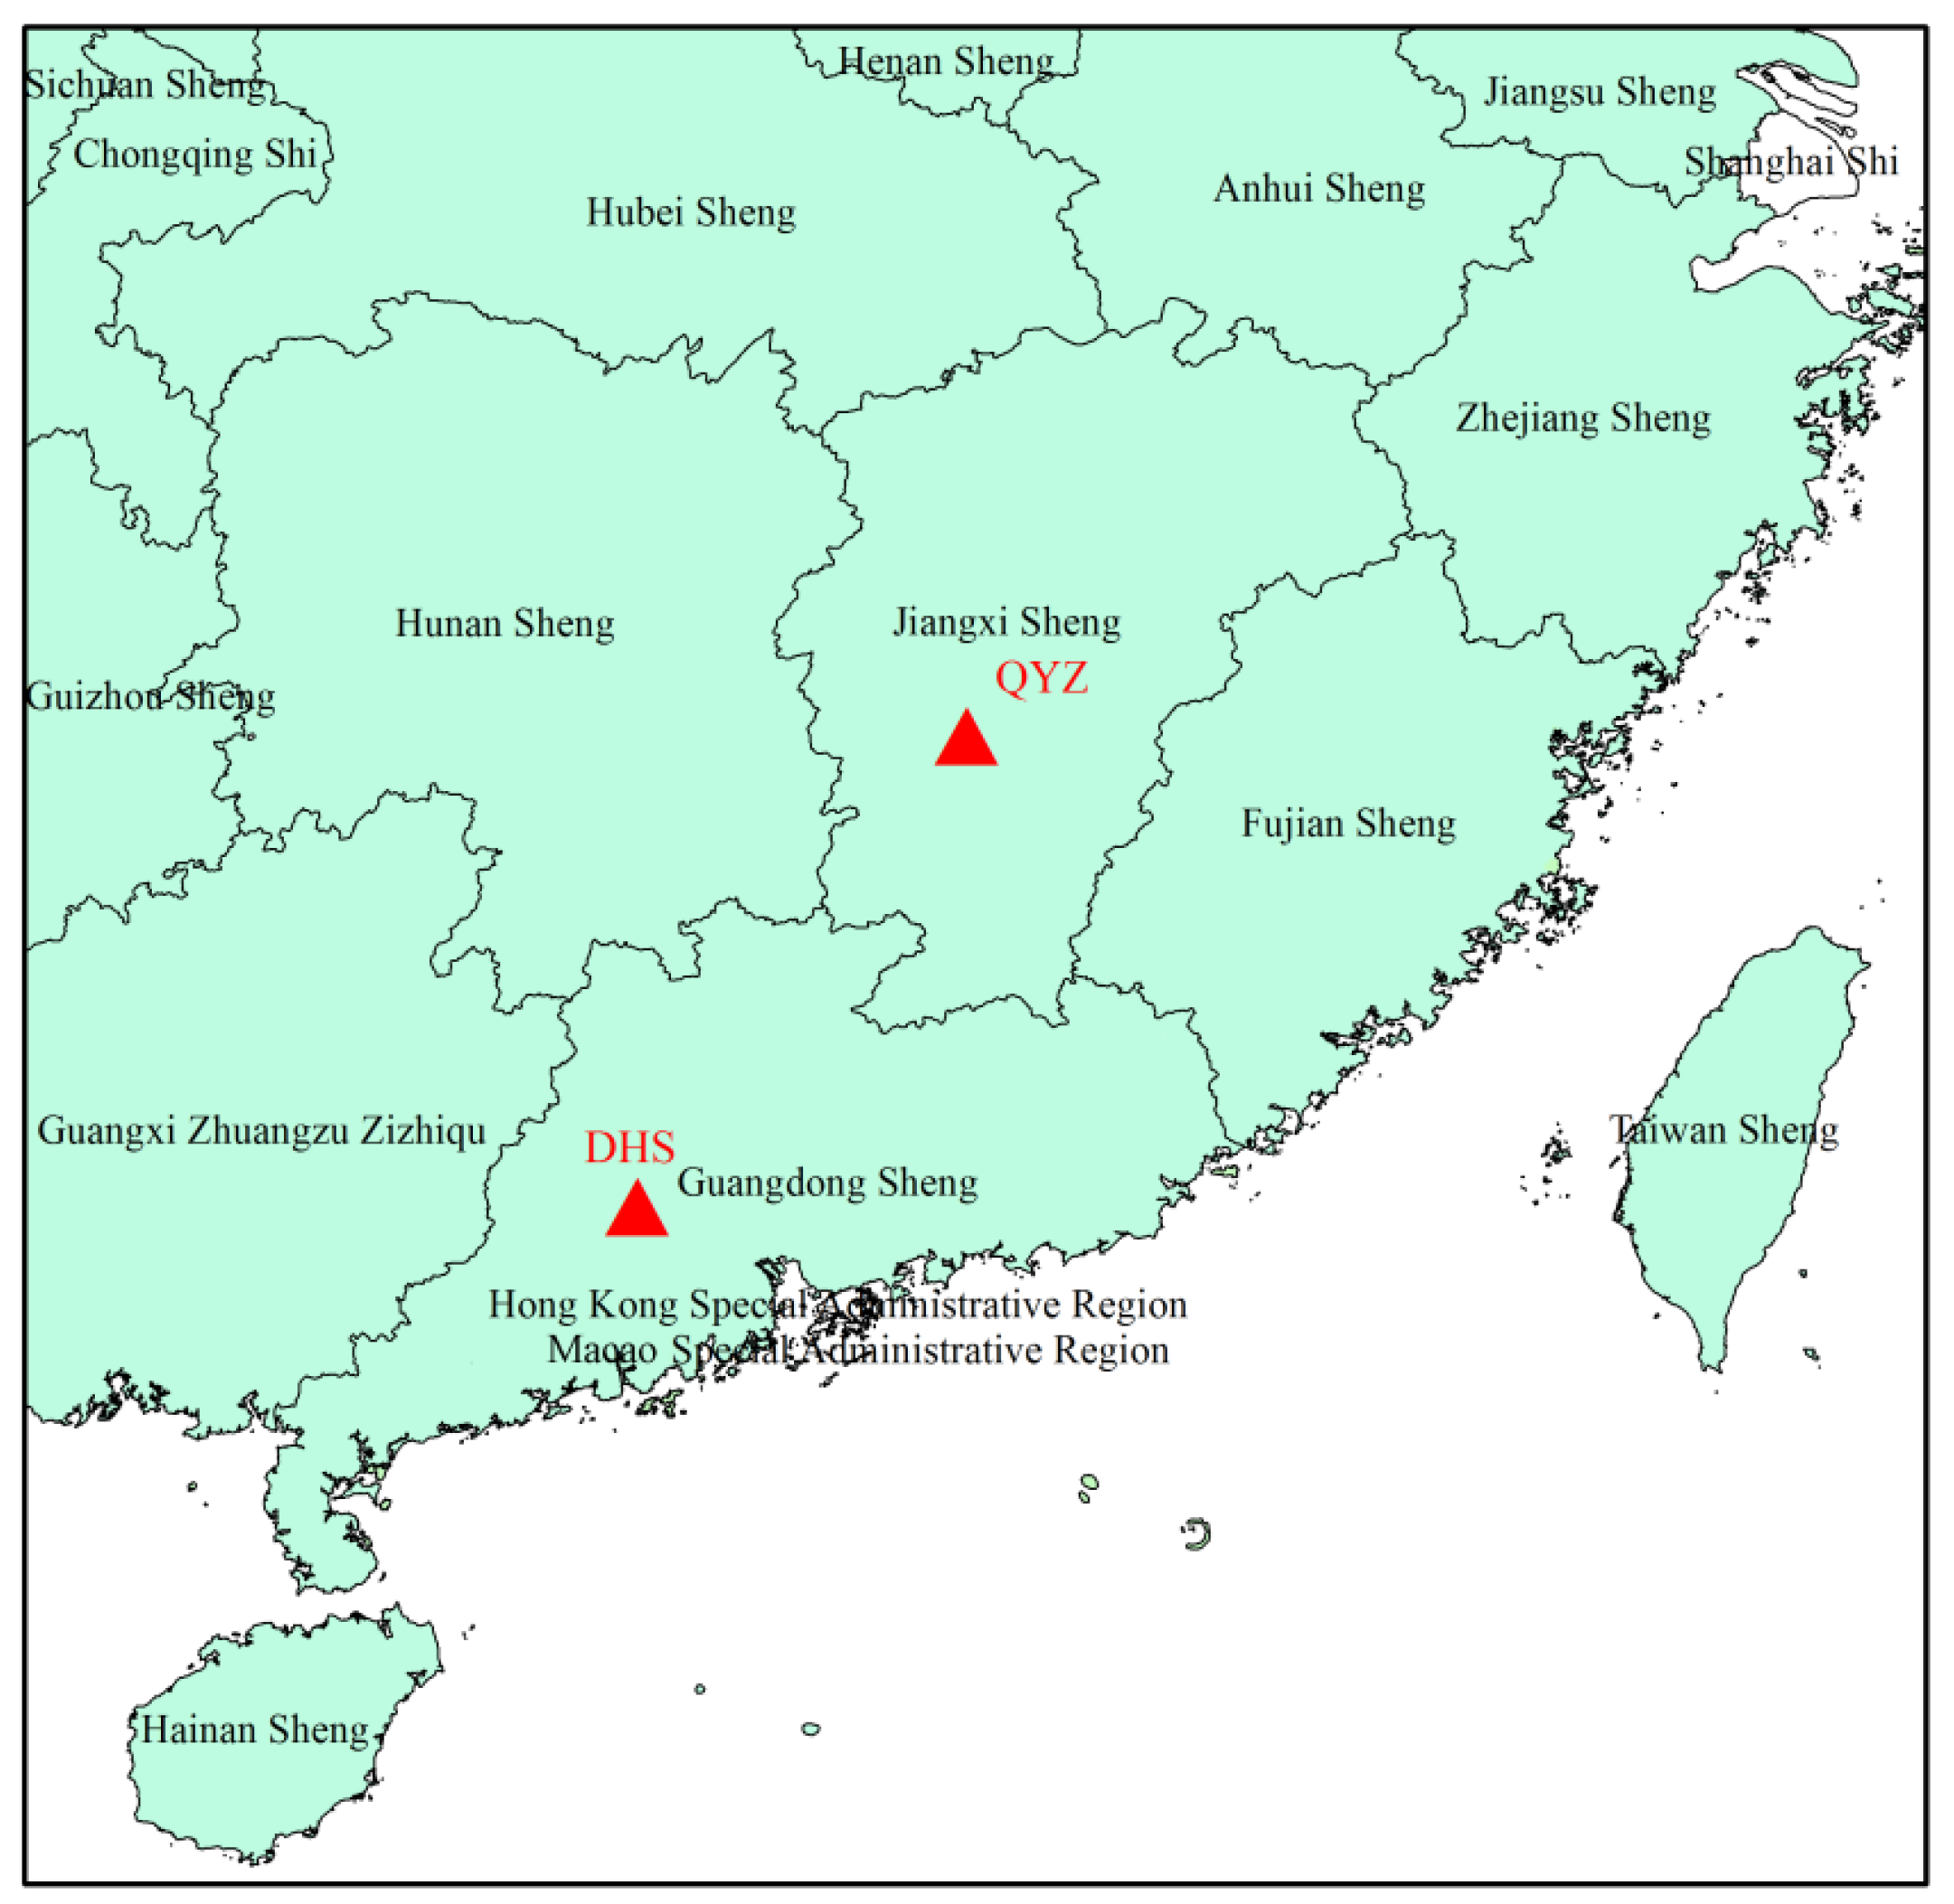
Figure 1. Locations of study sites (indicated by the triangle). DHS, Dinghushan; QYZ, Qianyanzhou.
Forests 10 00902 g001
Figure 2. Seasonal variations of meteorological factors at the QYZ and DHS sites. Total solar radiation (Rg) (a,d), mean air temperature (Ta) and vapor pressure deficit (VPD) (b,e), and total rainfall (P) (c,f). DHS, Dinghushan; QYZ, Qianyanzhou.
Forests 10 00902 g002
Figure 3. Mean diurnal variations of Tc, Ta, and ΔT in the dry and wet seasons at the QYZ and DHS sites. Tc, canopy temperature; Ta, air temperature; ΔT, canopy-to-air temperature difference. Tc and Ta in the dry (a) and wet season (c) at the QYZ site; Tc and Ta in the dry (b) and wet season (d) at the DHS site; ΔT in the dry (e) and wet season (f) at both sites. DHS, Dinghushan; QYZ, Qianyanzhou.
Forests 10 00902 g003
Figure 4. Mean daily variations of Tc, Ta and ΔT at the QYZ (a) and DHS (b) sites. Tc, canopy temperature; Ta, air temperature; ΔT, canopy-to-air temperature difference. DHS, Dinghushan; QYZ, Qianyanzhou. Daily values were the 30 min mean values from 11:00 to 14:00.
Forests 10 00902 g004
Figure 5. Sensitivity of canopy-to-air temperature difference (ΔT) to changes in environmental factors. The red, green, and blue bands in (a1a3) and (c1c3) indicate the different conditions of gc at the maximum gc, 1/4 maximum gc, and 1/10 maximum gc at the QYZ and DHS sites. The red, green, and blue bands in (b1b3) and (d1d3) indicate the different conditions of Rg, Ws, and VPD at the QYZ and DHS sites. The red, green, and blue bands in (b1) and (d1) indicate the different conditions of Rg at 800 W m−2, 600 W m−2, and 200 W m−2 at the QYZ and DHS sites. The red, green, and blue bands in (b2) and (d2) indicate the different conditions of Ws at 3 m s−1, 1.5 m s−1, and 0.5 m s−1 at the QYZ and DHS sites. The red, green, and blue bands in (b3) and (d3) indicate the different conditions of VPD at 3 kpa, 1.5 kpa, and 0.5 kpa at the QYZ and DHS sites. Tc, canopy temperature; Ta, air temperature; ΔT, canopy-to-air temperature difference; Rg, solar radiation; gc, canopy conductance; Ws, wind speed; VPD, vapor pressure deficit; DHS, Dinghushan; QYZ, Qianyanzhou.
Forests 10 00902 g005
Table 1. Site descriptions.
SitesDHSQYZ
Location23°10′16″ N, 112°31′48″ E26°44′52″ N, 115°03′47″ E
Elevation(m)300102
Mean annual temperature (°C)20.517.9
Total rainfall (mm)17001472.8
Predominant speciesCastanopsis chinensis, Schima superba, Cryptocarya chinensisPinus massoniana Lamb,
Pinus elliottii Engelm,
Cunninghamia lanceolata Hook
Canopy height (m)2213
Leaf area index43.5
Soil typelateritic red earthred earth
Soil Ph3.84.7
Soil bulk density (g cm−3)1.011.57
Measurement of canopy temperature (height)32 m23 m
Measurement of air temperature, relative humidity, and wind speed (height)32 m23 m
Measurement of radiation (height)36 m39 m
Measurement of soil volumetric water content (depth)5 cm5 cm
Measurement of soil temperature (depth)5 cm5 cm
Measurement of soil heat flux (depth)5 cm5 cm
Measurement of precipitation (height)36 m39 m
DHS, Dinghushan; QYZ, Qianyanzhou.
Table 2. Mean air temperature (Ta, °C), vapor pressure deficit (VPD, kPa), 5 cm soil temperature at (Ts, °C), 5 cm soil water content (Swc, m3 m−3), solar radiation (Rg, MJ m−2 d−1), and total rainfall (P, mm) in the dry season, wet season, and whole year at the QYZ and DHS sites.
Parameters QYZ DHS
Dry Season (Jul–Oct)Wet Season (Nov–Jun)AnnualDry Season (Oct–Mar)Wet Season (Apr–Sep)Annual
Rg16.4410.6412.5910.7514.2312.49
Ta25.6314.6018.2816.2624.7120.49
VPD1.050.560.720.570.700.63
Ts24.2314.5417.7717.1823.6120.39
Swc0.130.170.160.170.240.20
P339676101529810561354
DHS, Dinghushan; QYZ, Qianyanzhou.
Table 3. Dominant influencing factors for the variation of ΔT in the dry and wet seasons at the QYZ and DHS sites.
ParametersQYZDHS
Dry SeasonWet SeasonDry SeasonWet Season
R2pR2pR2pR2p
Rg0.956<0.001 ***0.959<0.001 ***0.955<0.001 ***0.952<0.001 ***
Ta0.273<0.001 ***0.2060.001 **0.2250.003 **0.2320.001 **
VPD0.1620.005 **0.1430.008 **0.2260.003 **0.1820.003 **
Ws0.326<0.001 ***0.451<0.001 ***0.0250.2870.1500.006 **
SWC0.1460.007 **0.466<0.001 ***0.0240.2960.349<0.001 ***
ΔT, canopy-to-air temperature difference; Rg, solar radiation; Ta, air temperature; VPD, vapor pressure deficit; Ws, wind speed; Swc, 5 cm soil water content; DHS, Dinghushan; QYZ, Qianyanzhou. *** and ** represent the effects were significant at level of p < 0.001, and p < 0.01.
Table 4. Determination coefficient (R2) and degree of explanation (ss%) values for factors affecting the variation of ΔT in the dry and wet seasons at the QYZ and DHS sites.
RgTaVPDWsSWCgc
QYZDry seasonR20.5880.0940.3930.1370.0930.077
P<0.0010.001<0.001<0.0010.0010.003
ss%58.83.210.917.60.10.2
Wet seasonR20.6910.1640.3830.1270.0010.032
P<0.001<0.001<0.001<0.0010.6990.012
ss%69.10.13.89.4-0.4
DHSDry seasonR20.7950.1290.6280.1360.1190.173
P<0.001<0.001<0.001<0.001<0.001<0.001
ss%79.50.22.46.40.13.2
Wet seasonR20.3150.0580.2230.1500.1040.012
P<0.001<0.001<0.001<0.001<0.0010.279
ss%31.50.81.93.12.9-
ΔT, canopy-to-air temperature difference; Rg, solar radiation; Ta, air temperature; VPD, vapor pressure deficit; Ws, wind speed; Swc, 5 cm soil water content; gc, canopy conductance; DHS, Dinghushan; QYZ, Qianyanzhou.
Table 5. Models for assessing canopy-to-air temperature difference (ΔT) in the dry season at the QYZ and DHS sites.
SitesModelsAdjusted-R2RMSE ( °C)
QYZ 0.0067 R n / g c + 0.931 R n w s 0.5 80.682 V P D   w s 0.5 / g c + 230.199 + 1.001 0.8570.333
DHS 0.0045 R n / g c + 6.465 R n w s 0.5 + 26.303 V P D   w s 0.5 / g c + 416.031 + 0.635 0.9420.543
ΔT, canopy-to-air temperature difference; Rn, net radiation; gc, canopy conductance; Ws, wind speed; VPD, vapor pressure deficit; DHS, Dinghushan; QYZ, Qianyanzhou; Adjusted-R2, adjusted coefficient of determination; RMSE (°C), Root Mean Square Error.