Branch Occlusion and Discoloration under the Natural Pruning of Mytilaria laosensis

1
Research Institute of Tropical Forestry, Chinese Academy of Forestry, Guangzhou 510520, China
2
Institute of Forestry, Nanjing Forestry University, Nanjing 210037, China
3
Experimental Center of Tropical Forestry, Chinese Academy of Forestry, Pingxiang, Guangxi 536000, China
*
Author to whom correspondence should be addressed.
Forests 2019, 10(10), 892; https://doi.org/10.3390/f10100892
Submission received: 29 August 2019
/
Revised: 3 October 2019
/
Accepted: 6 October 2019
/
Published: 9 October 2019
(This article belongs to the Section Forest Ecology and Management)
Abstract
:The production of knot-free and high-quality wood can be a vital issue in silviculture and forest management. In this study, knot properties, branch occlusion, and wood discoloration were investigated in an 11-year-old Mytilaria laosensis plantation in Guangxi, China, to examine the effectiveness of natural pruning in reducing knot-related defects. A total of 1513 occluded branches from 20 trees were sampled and dissected. Occluded branches were most common at heights of 2–6 m, and the mean diameter of the occluded branches gradually increased with height from the base to 6 m. Linear and generalized linear mixed-effect models were developed to reveal the relationship between branch occlusion and discoloration. The mortality of branches was highest in the third and fourth year and it took roughly three to six years to occlude. The mixed-models indicated that the branch occlusion time was positively correlated with the occluded branch diameter and dead branch stub length, and negatively correlated with the stem radial increment during branch occlusion. Branch discoloration was positively correlated with the occluded branch diameter and branch occlusion time, and was negatively correlated with the branch angle. The probability of wood discoloration also increased with the branch occlusion time. Our findings contribute to a better understanding of the spatiotemporal allocation and internal characteristics of occluded branches, and provide a reference for growing high-quality M. laosensis wood.
1. Introduction
Regulating the development of tree crowns and their branches is an important method of forest management to promote tree growth. Silvicultural interventions such as pruning and thinning are commonly applied to improve timber quality and tree growth [1,2]. Nevertheless, the branches constituting the tree crown are also important for the inner structure of the stem [3,4]. Branch development can result in knot-related defects on the wood.
Knots are the primary cause of defects in log grading [5], and can be divided into live (sound) and dead (decaying) knots, where live knots are intergrown with the wood, unlike dead knots, which are encased. Knot-related defects mainly result from the decaying portion of knots caused by fungal infections, and greatly affect the appearance, quality, and mechanical properties of the wood [6,7,8], which are important indices in timber grading evaluation. Hence, exploring methods for minimizing the occurrence of dead knot-related defects has become an essential research topic.
To data, only a few studies have analyzed knot-related properties after natural pruning for broadleaved species [9,10,11]. The studies of Hein on Fraxinus excelsior and Acer pseudoplatanus showed that occluded branch diameters and the mean stem radial increment played vital roles in predicting knot characteristics [12]. The duration of branch occlusion was also found to be strongly related to the branch dimension [13]. Decay or discoloration was significantly correlated with the occluded branch diameter, dead branch stub length, and duration of branch occlusion [14]. Nevertheless, there are few published studies on the relationships between branch occlusion, knot characteristics, and wood discoloration for valuable tropical and subtropical tree species.
Mytilaria laosensis Lecomte is a valuable broad-leaved tree species that is mainly distributed in the tropical and subtropical areas of Southeast Asia and south China [15,16]. M. laosensis has been widely used in the establishment of fast-growing and high-yield plantations owing to its high productivity, exceptional quality, and attractive wood grain. Furthermore, these trees have evident impacts on many environmental factors, such as soil and water conservation, and contribute to soil improvement [17]. However, due to the large amount of branches, as well as weak natural pruning, the timber of M. laosensis greatly suffers from knot-related defects [18] (Figure 2), and information on forest management methods to reduce these defects in this species is lacking.
The overall goals of this study were to (i) identify the spatial distribution of occluded branches and the process of occlusion at different ages in an M. laosensis plantation, (ii) model the relationships between the main branch properties of M. laosensis, and (iii) predict the extent of branch discoloration on the stem and the probability of wood discoloration. These results should contribute to a deeper understanding of the characteristics of occlusions in M. laosensis, and provide silvicultural guidance for the cultivation of M. laosensis and other valuable timber species.
2. Material and Methods
2.1. Experimental Site
The study site is located at Qingshan Forest Farm, Experimental Center of Tropical Forestry, Pingxiang City, Guangxi Zhuang Autonomous Region, China (22°02′–22°19′ N, 106°43′–106°52′ E) (Figure 1). This site has a subtropical climate, with obvious dry and wet seasons. The annual average temperature is about 19.5 °C–21.4 °C, with a maximum of 38.7 °C and a minimum of −1.5 °C. Annual precipitation is about 1210 mm, and is concentrated from April to October. The plantation is on a south-facing slope, with a mean altitude of 440 m. The soils at the study site are categorized as red soils from siliceous rock. The former planting species of this site was Cunninghamia lanceolata (Lamb.) Hook. Being planted in 1977, this forest had an initial planting density of 10,000 trees/hm2, which was thinned to 6667 trees/hm2 in 1987, and finally harvested in 2006. No fertilization was applied in this plantation.
2.2. Measurements
M. laosensis seedlings were planted in 2008, with an initial planting density of 1667 stems per hectare (2 m × 3 m spacing). Five plots (20 m × 30 m) were randomly selected in the forests for evaluation. No thinning or fertilization had been conducted at this site. In February 2019, each tree was measured in all five plots; abbreviations of measurement variables and their units are listed in Table 1. Following measurement, four dominant or co-dominant trees were selected and felled by a chainsaw for the data analysis per plot. The height of the tree, diameter at breast height (DBH), height of the lowest living branch, and crown width of these trees were measured in the 11-year-old M. laosensis plantation (Table 2); a total of 20 trees in each plot were selected for felling and measurement. After the tree was felled, the number and height of all the occluded branches on the stem were numbered and counted. Because smaller branches have little influence on the growth and quality of trees, and the knots that form after the development of smaller branches are difficult to judge from their appearance alone, branches with a diameter of less than 5 mm were not counted (Figure 2). Stem sections of about 20–30 cm length with completely occluded branches were cut with a chainsaw. If there were multiple occluded branches in different directions at the same height, the larger-diameter segments were selected for retention. Each disc was then ground with an electric sander with 120-grit sandpaper, and the angle between each occluded branch and the north on the surface of the disc was marked (using a pencil) as the azimuth. Finally, a band saw was used to longitudinally dissect along the center of the occluded branches or the core of the branches, and the split surface with the complete knot structure was polished with a polisher. A total of 1513 occluded branch samples were obtained for the measurement and analysis (Table 3).
The internal occluded branch and knots were measured according to the method described by Hein [1]. For the specimen, the year of death (YD) of the branch is calculated as the average between the first year in which the branch begins to occlude and the last year in which the dead branch stub persists. The year of branch occlusion (YO) is the year in which the stub is completely covered by the new annual ring. The branch occlusion time (OT) is the duration from the year of death of the branch to the year of branch occlusion, calculated as the difference between the year of branch closure and the year of branch death. The occluded branch diameter (OBD) refers to the maximum width of the branch (M–K in Figure 3). For natural pruning, we defined a dead branch as part of the branch stub, i.e., the part that has been significantly spoiled and not connected to the surrounding rings [1]. The branch discoloration length (DL) was measured along the branch pith (J–P in Figure 3). The branch exsertion angle (EA) was defined as the upward angle between the pith of the stem and the pith of the branch (∠GNJ in Figure 3). The dead branch of stub length (DBSL) was measured along the direction of the stem radius (C–F in Figure 3). Regarding the existence of dead knots and wood discoloration, we referred to Danescu’s research method [19]. In brief, we recorded whether there was cork tissue (CT) inside the knot, covering part of the surface of the branch, and formed by part of the callus; this was recorded as present or not. In addition, we recorded whether these discolored parts spread from the branches to the center of the stem (DSW); if the discolored part of the branch extended from the branches to the stem, it was judged to be discolored. The stem radial increment during branch occlusion (IROT) was measured at the point where the stem was uniform, without any bulge.
2.3. Statistical Analysis
Since the data collected included continuous variables (e.g., DL, DBSL, and OBD), count variables (e.g., YD, YO, and OT), and binary variables (e.g., DSW), different models were applied. Continuous variables were analyzed with linear mixed-effects models (LMMs), where random effects and residuals were assumed to obey a normal distribution. Count variables and binary variables were modeled using generalized linear mixed effects models (GLMMs). If the data were skewed, logarithmic transformation was performed before modeling. The data also had a hierarchical structure; that is, the branches were nested within the trees, and the trees were nested within the plots. Our LMM and GLMM models accounted for this nested structure by including plots, trees nested within plots, and branches nested within trees in the models.
The fixed and random effects were all tested using likelihood ratio tests when applying the restricted maximum likelihood estimation. To reveal the potential relationships between the occluded branch properties, OT, DBSL, EA, DL, and DSW were selected as response variables. The independent fixed variable, as well as random effects, such as plots, trees, and branches, were tested. Variables with a biologically plausible interpretation were included in the models at the significance ≤0.01. The optimal equations were selected through the principle of minimizing Akaike’s Information Criterion and Bayesian’s Information Criteria [20]. When fitting the models, the predictors were all diagnosed with variance inflation factors (VIF) [21]. In the process of selecting variables, independent variables with VIF values above 5 were considered to be collinear. The stepwise regression was used to determine the independent variables when they were collinear.
To evaluate the model’s performance, we used the root mean squared error (RMSE) to test the constructed model against the original data. For the GLMMs and LMMs, the marginal R2(m) (including the fixed effect) and the conditional R2(c) (including both the fixed effect and the random effect) were used to examine the performance of the model [22]. For the binomial-GLMMs, we used the area under curve (AUC) value [23] to evaluate the model fit. All models were developed using SPSS 21.0 (IBM-SPSS Inc., Chicago, IL, USA).
3. Results
3.1. Spatial Distribution of Branch Occlusions
The number of occluded branches in the stem of M. laosensis initially increased and then decreased with increasing tree height, and then tended to level out (Figure 4). Specifically, the number of occluded branches reached a maximum at 3 m, and then tended to level out from 8 m to the top of the tree. The stem section from a height of 2 m to 6 m accounted for more than 30% of the total number of occluded branches. The average diameter of knots increased gradually from the base of the stem to a maximum at 6 m, after which the knot size tended to plateau.
3.2. Temporal Distribution of Branch Occlusion
The distribution of the number of occluded branches of M. laosensis of different ages is shown in Figure 5. The majority of branches died in the first to second year of growth (52.6%), followed by the third to fourth year (39.31%), fifth to sixth year (5.56%), and seventh to eighth year of growth (1.46%). Years 5–6 and years 7–8 were the peak years for the completion of occlusion, accounting for about 87.17% of all occluded branches. The process of occlusion starts from the development of the branches and continues until the branch falls off, and the stem then grows over the wound. Most of the branches (76.65%) took about 3–6 years to occlude completely, and a small number took about 7–8 years to occlude.
3.3. Models for Branch Occlusion
3.3.1. Branch Occlusion Time
The GLMM was used to predict the occlusion of branches and the characteristics of knots. The branch occlusion time (OT) was estimated with a log-linear negative binomial. The fixed factors in the model were statically significant. No random effects were found to be statistically significant in Equation (1). The estimated value and standard error of fixed effects of Equation (1) are shown in Table 4. OT was significantly positively related to the occluded branch diameter (OBD) and dead branch stub length (DBSL), and negatively correlated with the mean IROT.
Therefore, Equation (1) demonstrates that the DBSL had a stronger relationship with OT than OBD had with OT (Figure 6a,b). The model explained half of the total variance (R2 = 56.29%; RMSE = 0.27 years).
ln (OTtb) = a0 + a1 × OBDtb + a2 × DBSLtb + a3 × IROTtb
3.3.2. Dead Branch Stub Length
The model for DBSL was estimated with a log-link function with a normal distribution of errors. This model indicated that OBD was the only significant predictor (Equation (2)). The parameter estimates and standard errors of the equation are presented in Table 4.
This model showed that DBSL increased significantly with increasing OBD (Figure 6c). However, the model could only explain a very small amount of the total variation (R2 = 9.56%; RMSE = 20.89 mm).
ln (DBSLtb) = a0 + a1 × ln (OBDtb)
3.3.3. Branch Exsertion Angle
The exsertion angle (EA) was estimated using a log-link function with a normal distribution of errors. The EA was correlated with log-transformed OBD. The estimates and standard error of the model and significant predictor are presented in Table 4.
Simulations with Equation (3) showed that EA decreased with increasing OBD (Figure 6d). The model explained only a small proportion of the total variation (R2(c) = 16.94%; R2(m) = 12.51%; RMSE = 7.22°).
ln (EAtb) = a0 + a1 × ln (OBDtb) + γpt
3.3.4. Branch Discoloration Length
The discoloration length (DL) was modeled using a log-link function with a normal distribution of errors. DL was correlated with OT, OBD, and IA (Equation (4)). The factors involved in the model were all statistically significant. The parameter estimates and standard errors of the equation are presented in Table 4.
The simulation plots of Equation (4) illustrated that the DBSL decreased with increasing EA, especially for branches less than 20° (Figure 6e). However, the DBSL increased with increasing OBD. This model could explain more than one quarter of the total variation (R2(c) = 26.17%; R2(m) = 17.64%; RMSE = 16.37 mm).
ln (DLtb) = a0 + a1 × OT + a2 × ln(OBDtb) + a3 × ln(IAtb) + δpt
3.4. Wood Discoloration
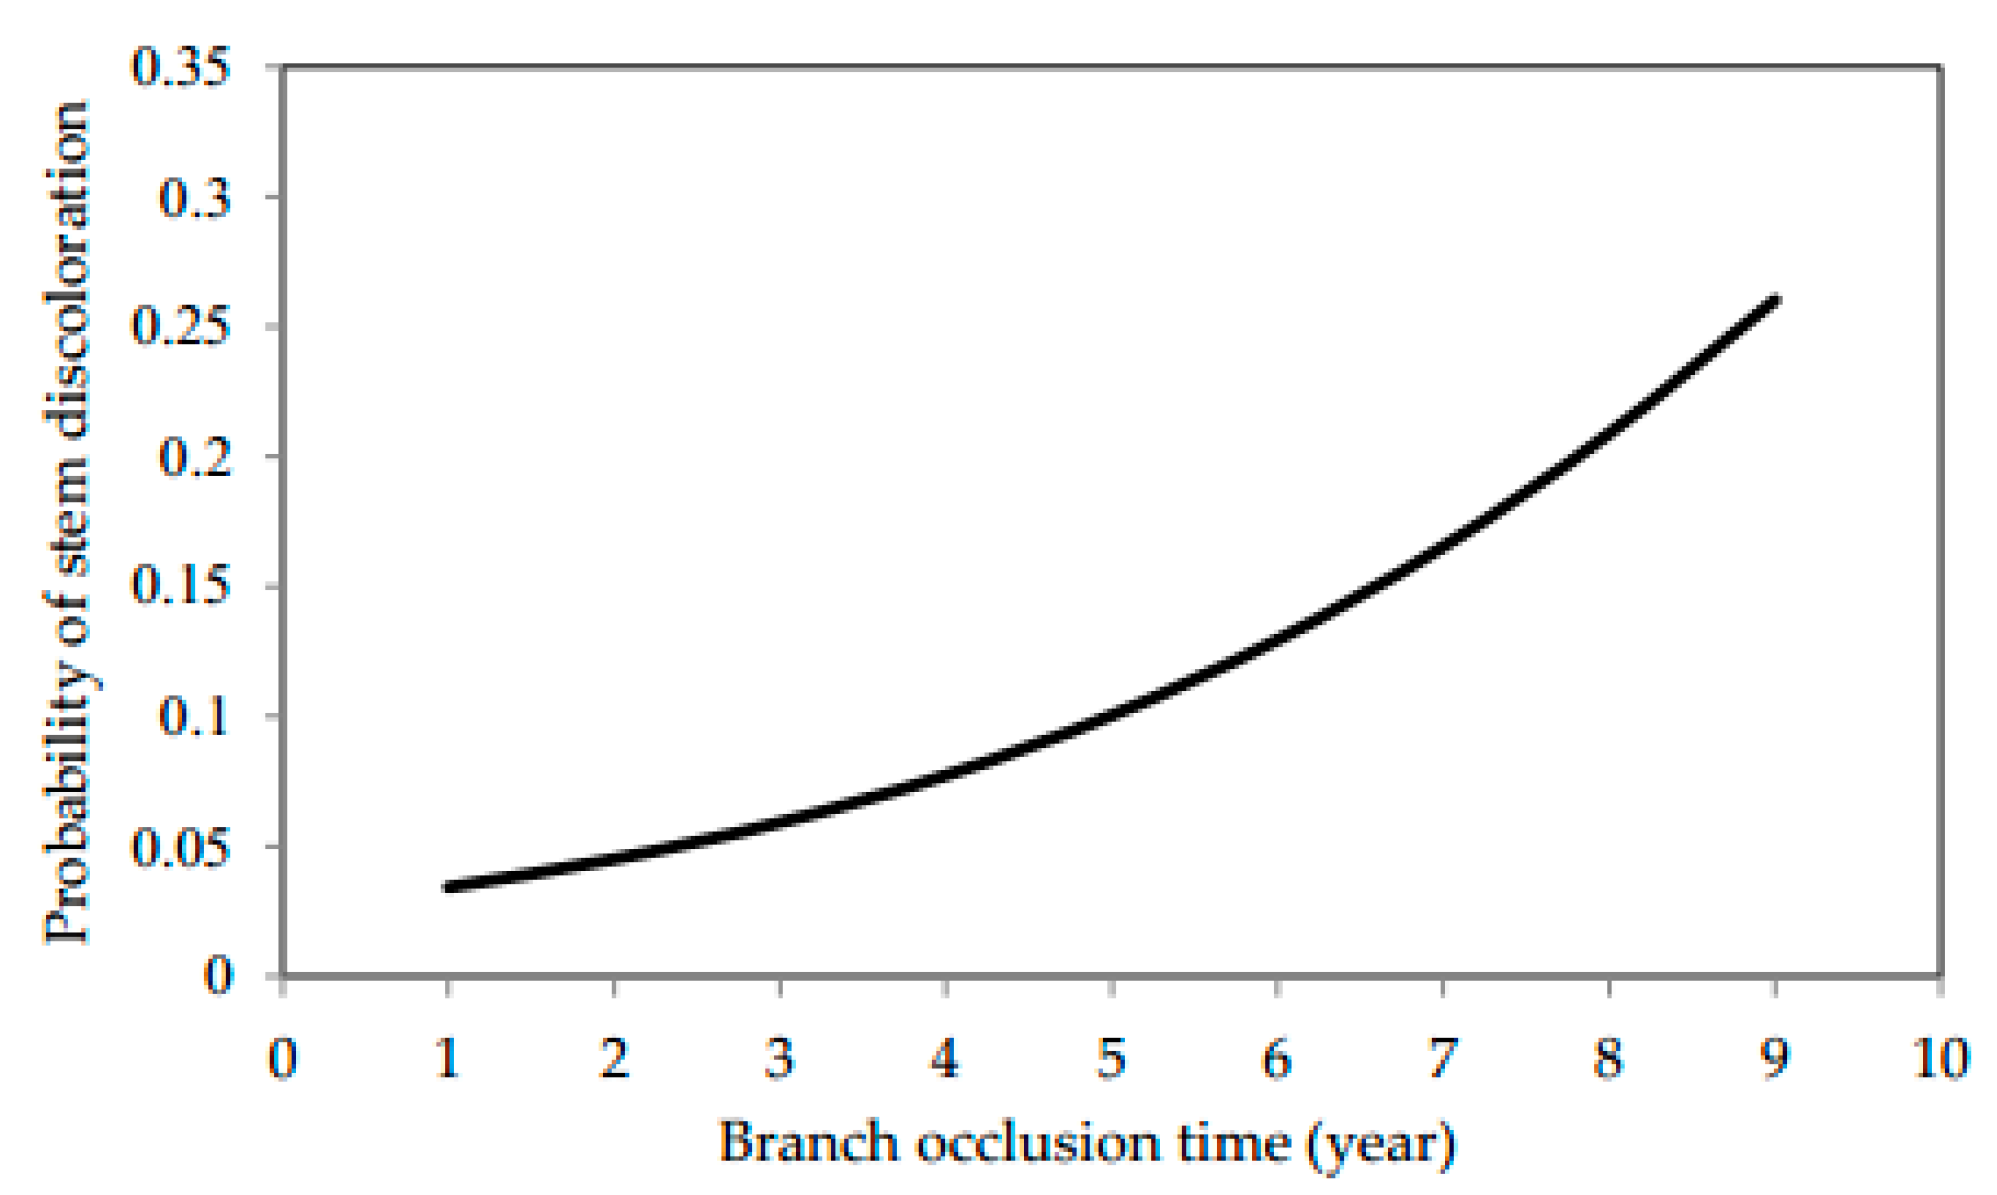
The binomial-GLMM was used to determinate the discoloration of the stem. As shown in Equation (5), the possibility of discoloration of the wood (DSW) was significantly related to the branch OT (Figure 7). The parameter estimates and standard errors in the model are presented in Table 4.
Simulation of Equation (5) illustrated that as the OT increases, the possibility of wood discoloration also increases. The model performance was quite good (R2(c) = 81.54%; R2(m) = 57.18%; AUC = 0.932).
logit (DSWtb) = a0 + a1 × OT + εptb
4. Discussion
4.1. Branch Distribution
Knots were found to be mainly distributed on a tree at a height of 3–6 m; however, this is also the most valuable part of the tree. Moreover, the mean occluded branch diameter also showed an increasing trend for this part of the tree. This revealed that the most serious problem with the timber quality of M. laosensis is the knot size and amount, where knots have been identified as an important timber downgrading defect [24]. A previous study showed that a high planting density contributed to reducing the knot size [25]. This may have been due to the fact that high-density planting contributes to increases in competition between the trees and branches for limited growing space, water, and nutrients [26,27]. As the tree height increased above 6 m, the range of the average diameter of knots increased, and the coefficient of variation trend became stable. This is consistent with the results of Trincado’s study of the branch properties of Pinus taeda [28]. A possible explanation for this pattern could be that as the depth of the tree crown increases, the interaction among the internal branches increases, resulting in an overall decrease in the diameter of the branches [26,29], which usually results in a small diameter range of branches within the tree crown.
Understanding temporal trends in branch and knot characteristics can help guide artificial pruning strategies. The current study showed that the mortality of branches was highest 3 to 4 years after planting. After the branches died and fell, dead branch stubs remained in the tree [30]. Our results showed that completion of the occlusion process requires about 5 to 6 years. Therefore, we can speculate that establishing the pruning period of M. laosensis within 4 to 6 years after planting may contribute to diminishing the formation of knot-related defects and result in a longer length of clear wood. In addition, the effects of different pruning intensities, pruning seasons, and pruning tools should also be considered [31,32].
4.2. Branch Occlusion Time
In this study, OT increased with increasing OBD and DBSL, and decreased with increasing IROT (Figure 6a,b). Similar results have been found for Fraxinus excelsior [33], Acer pseudoplatanus [33], Quercus rubra [34], and Betula alnoides [14]. We also found that DBSL was more closely related to OT than to OBD. These findings are in agreement with those of some studies on Pseudotsuga menziesii [35] and Pinus ponderosa [36]. However, Eq (2) showed a significant but weak relationship between OBD and DBSL. The reason for this may be that branch fractures are mostly caused by natural damage and accidental human damage, which leads to a wide range in the length of the dead stubs [1]. Consequently, OT could be reduced by pruning and other silvicultural measures. To reduce the DBSL and OBD, we can intensify competition in the forest, as more trees may reduce the growth of branches in a competitive environment. Wang et al. [25] studied the influence of different densities of B. alnoides and found that a high density can significantly reduce the diameter of branches. Furthermore, the stem diameter growth rate could be improved by fertilization and thinning [37,38]. Therefore, a combination of these measures will help to reduce the OBD and thus improve the stem diameter growth rate for the production of high-quality wood.
4.3. Branch Exsertion Angle
We further explored the relationship between EA and wood properties or other knot variables. EA showed a significant relationship with OBD: as the OBD increased, EA decreased (Figure 6d). A similar relationship was reported for several other hardwood species [11,12,14,33]. In addition, DL increased with decreasing EA. Beaulieu et al. [11] found that EA was mainly dependent on the age of the branch. However, this situation is more frequent in conifers, and is not as obvious for broadleaved trees [39]. In addition, EA and DL were found to be negatively correlated, which was especially evident when the EA was less than 20° (Figure 6e). Therefore, the DL of branches might be effectively reduced by increasing the EA [14]. However, the goodness of fit of the equation was low, indicating that there were other unknown factors affecting EA, which could include tree variables such as branch position, crown structure, or genetic control [40]. This suggests that a combination of genetic improvement and forest management may contribute to the improvement of timber quality.
4.4. Discoloration
DL had a significant relationship with OT, OBD, and EA. Our model showed that DL was positively correlated with the OT and OBD, and was negatively correlated with EA, which was consistent with previous studies [14,19]. The present study revealed that a shorter OT for branches of the same size will be associated with a smaller DL, suggesting that faster occlusion contributes to reducing the size of branches, which will in turn diminish the risk of infections [6].
The ability of trees to resist the spread of decay will determine the overall degree of decay and quality of the wood [41,42]. A longer OT means longer wound exposure, and thus a greater risk of fungi infecting trees and invading the heartwood of the tree. In the current study, under natural pruning, there were only a few cases where wood discoloration was observed in M. laosensis. Danescu et al. [19] found that naturally shed branches did not cause any stem discoloration on F. excelsior L., whereas discoloration was observed on A. pseudoplatanus. Beadle et al. [43] also found discoloration on Acacia mangium under natural pruning. The difference in the susceptibility of different species to discoloration may be related to the chemical composition of the wood, type of fungi causing infection, site quality, environmental conditions [44,45,46], etc. The effects of pruning on M. laosensis and in response to different densities and management measures are topics worthy of further study.
5. Conclusions
We found that the number of occluded branches was greatest at stem heights of 2–6 m. For the 11-year-old trees examined in this study, the average diameter of knots increased gradually from the base of the stem to a maximum at 6 m. Pruning in the fifth to sixth year after planting will contribute to the production of longer lengths of knot-free wood. The simulation showed that bigger branches are significantly correlated with a longer branch occlusion time, longer discoloration length, larger dead branch stub, and steeper branch exsertion. Our results suggest that accelerating the occlusion of branches will help to minimize the risk of wood discoloration. The occluded branch diameter and dead branch stub length were two fundamental indicators affecting timber quality. Artificial pruning can help to reduce the effects of dead branches. Further research is needed to investigate the effect of pruning and other silvicultural measures (e.g., planting density, fertilization, and thinning) on branch occlusion and thus the timber quality of M. laosensis.
Author Contributions
G.Y., J.H., and G.Q. designed the experiments; J.Y., R.L., and G.Q. performed the experiments; J.H. and G.Q. analyzed the data; G.Q. wrote the paper.
Funding
This study was financially supported by the Guangdong Forestry Science and Technology Innovation Project (2016KJCX004) and the Science Foundation of Experiment Center of Tropical Forestry, Chinese Academy of Forestry (RL2011-04).
Acknowledgments
The authors thank Wenfu Guo, Baoguo Yang, and Weijun He for help with data collection. We also would like to thank Zeng Jie and Chunsheng Wang for their comments on this article. Sincere thanks to the three anonymous reviewers for their very helpful and invaluable suggestions on this manuscript.
Conflicts of Interest
The authors declare no conflicts of interest.
References
- Hein, S. Knot attributes and occlusion of naturally pruned branches of Fagus sylvatica. For. Ecol. Manag. 2008, 256, 2046–2057. [Google Scholar] [CrossRef]
- Montagu, K.D.; Kearney, D.E.; Smith, R.G.B. The biology and silviculture of pruning planted eucalypts for clear wood production—A review. For. Ecol. Manag. 2003, 179, 1–13. [Google Scholar] [CrossRef]
- Maguire, D.A.; Kershaw, J.R.; Hann, D.W. Predicting the effects of silvicultural regime on branch size and crown wood core in Douglas-fir. For. Sci. 1991, 37, 1409–1428. [Google Scholar]
- Roeh, R.L.; Maguire, D.A. Crown profile models based on branch attributes in coastal Douglas-fir. For. Ecol. Manag. 1997, 96, 77–100. [Google Scholar] [CrossRef]
- Karaszewski, Z.; Bembenek, M.; Mederski, P.S.; Szczepanska-Alvarez, A.; Byczkowski, R.; Kozlowska, A.; Michnowicz, K.; Przytula, W.; Giefing, D.F. Identifying beech round wood quality-distribution of beech timber qualities and influencing defects. Drewno. Pr. Nauk. Donies. Komunik. 2013, 56, 39–54. [Google Scholar]
- Macdonald, E.; Hubert, J. A review of the effects of silviculture on timber quality of Sitka spruce. Forestry 2002, 75, 107–138. [Google Scholar] [CrossRef]
- Shigo, A.L. Compartmentalization: A conceptual framework for understanding how trees grow and defend themselves. Annu. Rev. Phytopathol. 1984, 22, 189–214. [Google Scholar] [CrossRef]
- O’Hara, K.L. Pruning wounds and occlusion: A long-standing conundrum in forestry. J. For. 2007, 105, 131–138. [Google Scholar]
- Kicki, J. Effects of initial spacing on the stem and branch properties and graded quality of Picea abies (L.) karst. Scand. J. For. Res. 1992, 7, 12. [Google Scholar]
- Mäkinen, H.; Song, T. Evaluation of models for branch characteristics of Scots pine in Finland. For. Ecol. Manag. 2002, 158, 25–39. [Google Scholar] [CrossRef]
- Beaulieu, E.; Schneider, R.; Berninger, F.; Ung, C.H.; Swift, D.E. Modeling jack pine branch characteristics in Eastern Canada. For. Ecol. Manag. 2011, 262, 1748–1757. [Google Scholar] [CrossRef]
- Hein, S.; Mäkinen, H.; Yue, C.; Kohnle, U. Modelling branch characteristics of Norway spruce from wide spacing in Germany. For. Ecol. Manag. 2007, 242, 155–164. [Google Scholar] [CrossRef]
- Smith, R.G.B.; Dingle, J.; Kearney, D.; Montagu, K. Branch occlusion after pruning in four contrasting sub-tropical eucalypt species. J. Trop. For. Sci. 2006, 18, 117–123. [Google Scholar]
- Wang, C.S.; Hein, S.; Zhao, Z.G.; Guo, J.J.; Zeng, J. Branch occlusion and discoloration of Betula alnoides under artificial and natural pruning. For. Ecol. Manag. 2016, 375, 200–210. [Google Scholar] [CrossRef]
- Chen, L.; Zeng, J.; Jia, H.Y.; Zeng, J.; Guo, W.F.; Cai, D.X. Growth and nutrient uptake dynamics of Mytilaria laosensis seedlings under exponential and conventional fertilizations. Soil Sci. Plant Nutr. 2012, 58, 618–626. [Google Scholar] [CrossRef]
- Guo, W.F.; Cai, D.X.; Jia, H.Y.; LI, Y.X.; Lu, Z.F. Growth laws of Mytilaria laosensis plantation. For. Res. 2006, 19, 585. [Google Scholar]
- Huang, Z.T.; Wang, S.F.; Jiang, Y.M.; Mo, J.X. Exploitation and utilization prospects of eximious native tree species Mytilaria laosensis. J. Guangxi Agric. Sci. 2009, 40, 1220–1223. [Google Scholar]
- Wang, Z.H.; Yin, G.T.; Yang, J.C.; Qin, G.M. Effects of different density on branch development of Mytilaria laosensis. For. Res. 2019, 32, 78–86. [Google Scholar]
- Dănescu, A.; Ehring, A.; Bauhus, J.; Albrecht, A.; Hein, S. Modelling discoloration and duration of branch occlusion following green pruning in Acer pseudoplatanus and Fraxinus excelsior. For. Ecol. Manag. 2015, 335, 87–98. [Google Scholar] [CrossRef]
- Pinheiro, J.; Bates, D. Mixed-Effects Models in S and S-PLUS; Springer Science and Business Media: Berlin, Germany, 2006. [Google Scholar]
- Stewart, G.W. Collinearity and least squares regression. Stat. Sci. 1987, 2, 68–84. [Google Scholar] [CrossRef]
- Nakagawa, S.; Schielzeth, H. A general and simple method for obtaining R2 from generalized linear mixed effects models. Methods Ecol. Evol. 2013, 4, 133–142. [Google Scholar] [CrossRef]
- Pepe, M.S. Receiver operating characteristic methodology. J. Am. Stat. Assoc. 2000, 95, 308–311. [Google Scholar] [CrossRef]
- Zhang, S.; Chauret, G.; Duchesne, I.; Schnelder, R. Maximizing the Value of Jack Pine Resource; Technical Report; Forintek Canada Corp: Quebec, QC, Canada, 2005. [Google Scholar]
- Wang, C.; Zhao, Z.; Hein, S.; Zeng, J.; Schuler, J.; Guo, J.J.; Zeng, J. Effect of planting density on knot attributes and branch occlusion of Betula alnoides under natural pruning in southern China. Forests 2015, 6, 1343–1361. [Google Scholar] [CrossRef]
- Moberg, L. Models of internal knot diameter for Pinus sylvestris. Scand. J. For. Res. 2000, 15, 177–187. [Google Scholar] [CrossRef]
- Moberg, L. Models of internal knot properties for Picea abies. For. Ecol. Manag. 2001, 147, 123–138. [Google Scholar] [CrossRef]
- Trincado, G.; Burkhart, H.E. A framework for modeling the dynamics of first-order branches and spatial distribution of knots in Loblolly pine trees. Can. J. For. Res. 2009, 39, 566–579. [Google Scholar] [CrossRef]
- Mäkinen, H. Effect of intertree competition on branch characteristics of Pinus sylvestris families. Scand. J. For. Res. 1996, 11, 129–136. [Google Scholar] [CrossRef]
- Sandi, M.; Sandi, W.; Nicolescu, V.N. Wood discoloration in relation to wound size in northern red oak (Quercus rubra L.) trees subject to artificial pruning. Span. J. Rural Dev. 2012, 3, 53–60. [Google Scholar] [CrossRef]
- Maurin, V.; DesRochers, A. Physiological and growth responses to pruning season and intensity of hybrid poplar. For. Ecol. Manag. 2013, 304, 399–406. [Google Scholar] [CrossRef]
- Hevia, A.; Álvarez-González, J.G.; Majada, J. Comparison of pruning effects on tree growth, productivity and dominance of two major timber conifer species. For. Ecol. Manag. 2016, 374, 82–92. [Google Scholar] [CrossRef]
- Hein, S.; Spiecker, H. Comparative analysis of occluded branch characteristics for Fraxinus excelsior and Acer pseudoplatanus with natural and artificial pruning. Can. J. For. Res. 2007, 37, 1414–1426. [Google Scholar] [CrossRef]
- Nicolescu, V.N.; Sandi, M.; Păun, M. Occlusion of pruning wounds on northern red oak (Quercus rubra) trees in Romania. Scand. J. For. Res. 2013, 28, 340–345. [Google Scholar] [CrossRef]
- O’Hara, K.L.; Buckland, P.A. Prediction of pruning wound occlusion and defect core size in ponderosa pine. West. J. Appl. For. 1996, 11, 40–43. [Google Scholar] [CrossRef]
- Petruncio, M.; Briggs, D.; Barbour, R.J. Predicting pruned branch stub occlusion in young, coastal Douglas-fir. Can. J. For. Res. 1997, 27, 1074–1082. [Google Scholar] [CrossRef]
- Forrester, D.I.; Baker, T.G. Growth responses to thinning and pruning in Eucalyptus globulus, Eucalyptus nitens, and Eucalyptus grandis plantations in southeastern Australia. Can. J. For. Res. 2011, 42, 75–87. [Google Scholar] [CrossRef]
- Forrester, D.I.; Collopy, J.J.; Beadle, C.L.; Warren, C.R.; Baker, T.G. Effect of thinning, pruning and nitrogen fertiliser application on transpiration, photosynthesis and water-use efficiency in a young Eucalyptus nitens plantation. For. Ecol. Manag. 2012, 266, 286–300. [Google Scholar] [CrossRef]
- Hein, S.; Collet, C.; Ammer, C.; Goff, N.L.; Skovsgaard, J.P.; Savill, P. A review of growth and stand dynamics of Acer pseudoplatanus L. in Europe: Implications for silviculture. Forestry 2008, 82, 361–385. [Google Scholar] [CrossRef]
- Day, M.E.; Greenwood, M.S.; Diaz-Sala, C. Age-and size-related trends in woody plant shoot development: Regulatory pathways and evidence for genetic control. Tree Physiol. 2002, 22, 507–513. [Google Scholar] [CrossRef]
- Schwarze, F.; Engels, J.; Mattheck, C. Holzzersetzende Pilze in Bäumen. Strategien der Holzzersetzung Rombach Ökologie 1999, 5. [Google Scholar]
- Wardlaw, T.J.; Neilsen, W.A. Decay and other defects associated with pruned branches of Eucalyptus nitens. Tasforests Hobartt 1999, 11, 49–58. [Google Scholar]
- Beadle, C.; Barry, K.; Hardiyanto, E.; Irianto, R.; Mohammed, C.; Rimbawanto, A. Effect of pruning Acacia mangium on growth, form and heart rot. For. Ecol. Manag. 2007, 238, 261–267. [Google Scholar] [CrossRef]
- Barry, K.M.; Pearce, R.B.; Mohammed, C.M. Properties of reaction zones associated with decay from pruning wounds in plantation grown Eucalyptus nitens. For. Pathol. 2000, 30, 233–245. [Google Scholar] [CrossRef]
- Lonsdale, D.; Pautasso, M.; Holdenrieder, O. Wood-decaying fungi in the forest: Conservation needs and management options. Eur. J. For. Res. 2008, 127, 1–22. [Google Scholar] [CrossRef]
- Barry, K.M.; Irianto, R.S.B.; Tjahjono, B.; Tarigan, M.; Agustini, L.; Hardiyanto, E.B.; Mohammed, C.L. Variation of heart rot, sap wood infection and polyphenol extractives with provenance of Acacia mangium. For. Pathol. 2006, 36, 183–197. [Google Scholar] [CrossRef]
Figure 1.
The location of the study site.
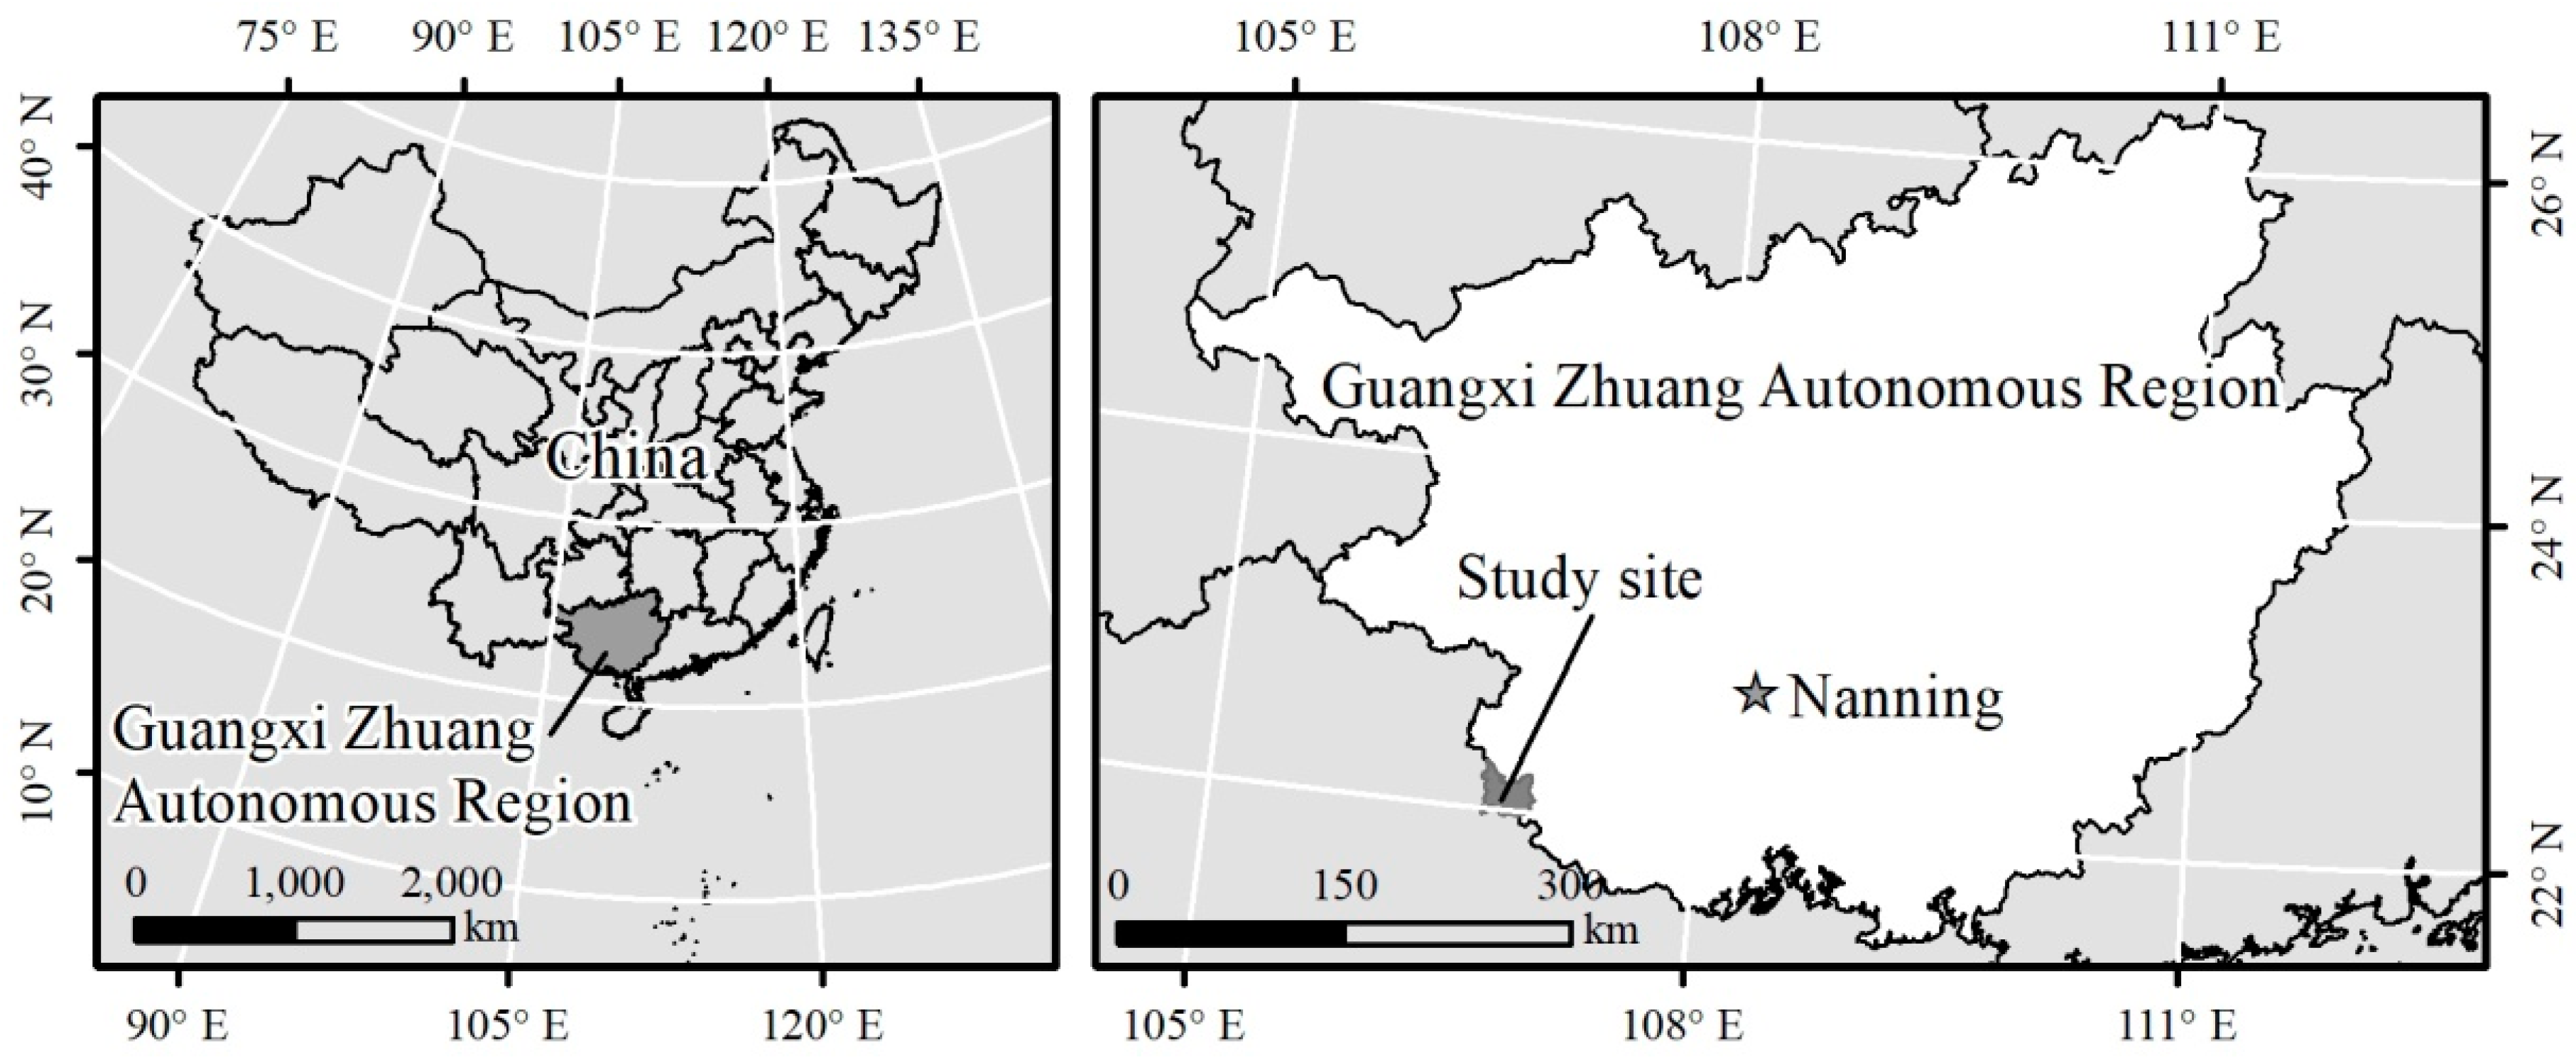
Figure 2.
The dead branches below the live crown of a standing Mytilaria laosensis (a); the appearance of the occluded branch (b); the longitudinal section of an occluded branch (c).
Figure 2.
The dead branches below the live crown of a standing Mytilaria laosensis (a); the appearance of the occluded branch (b); the longitudinal section of an occluded branch (c).
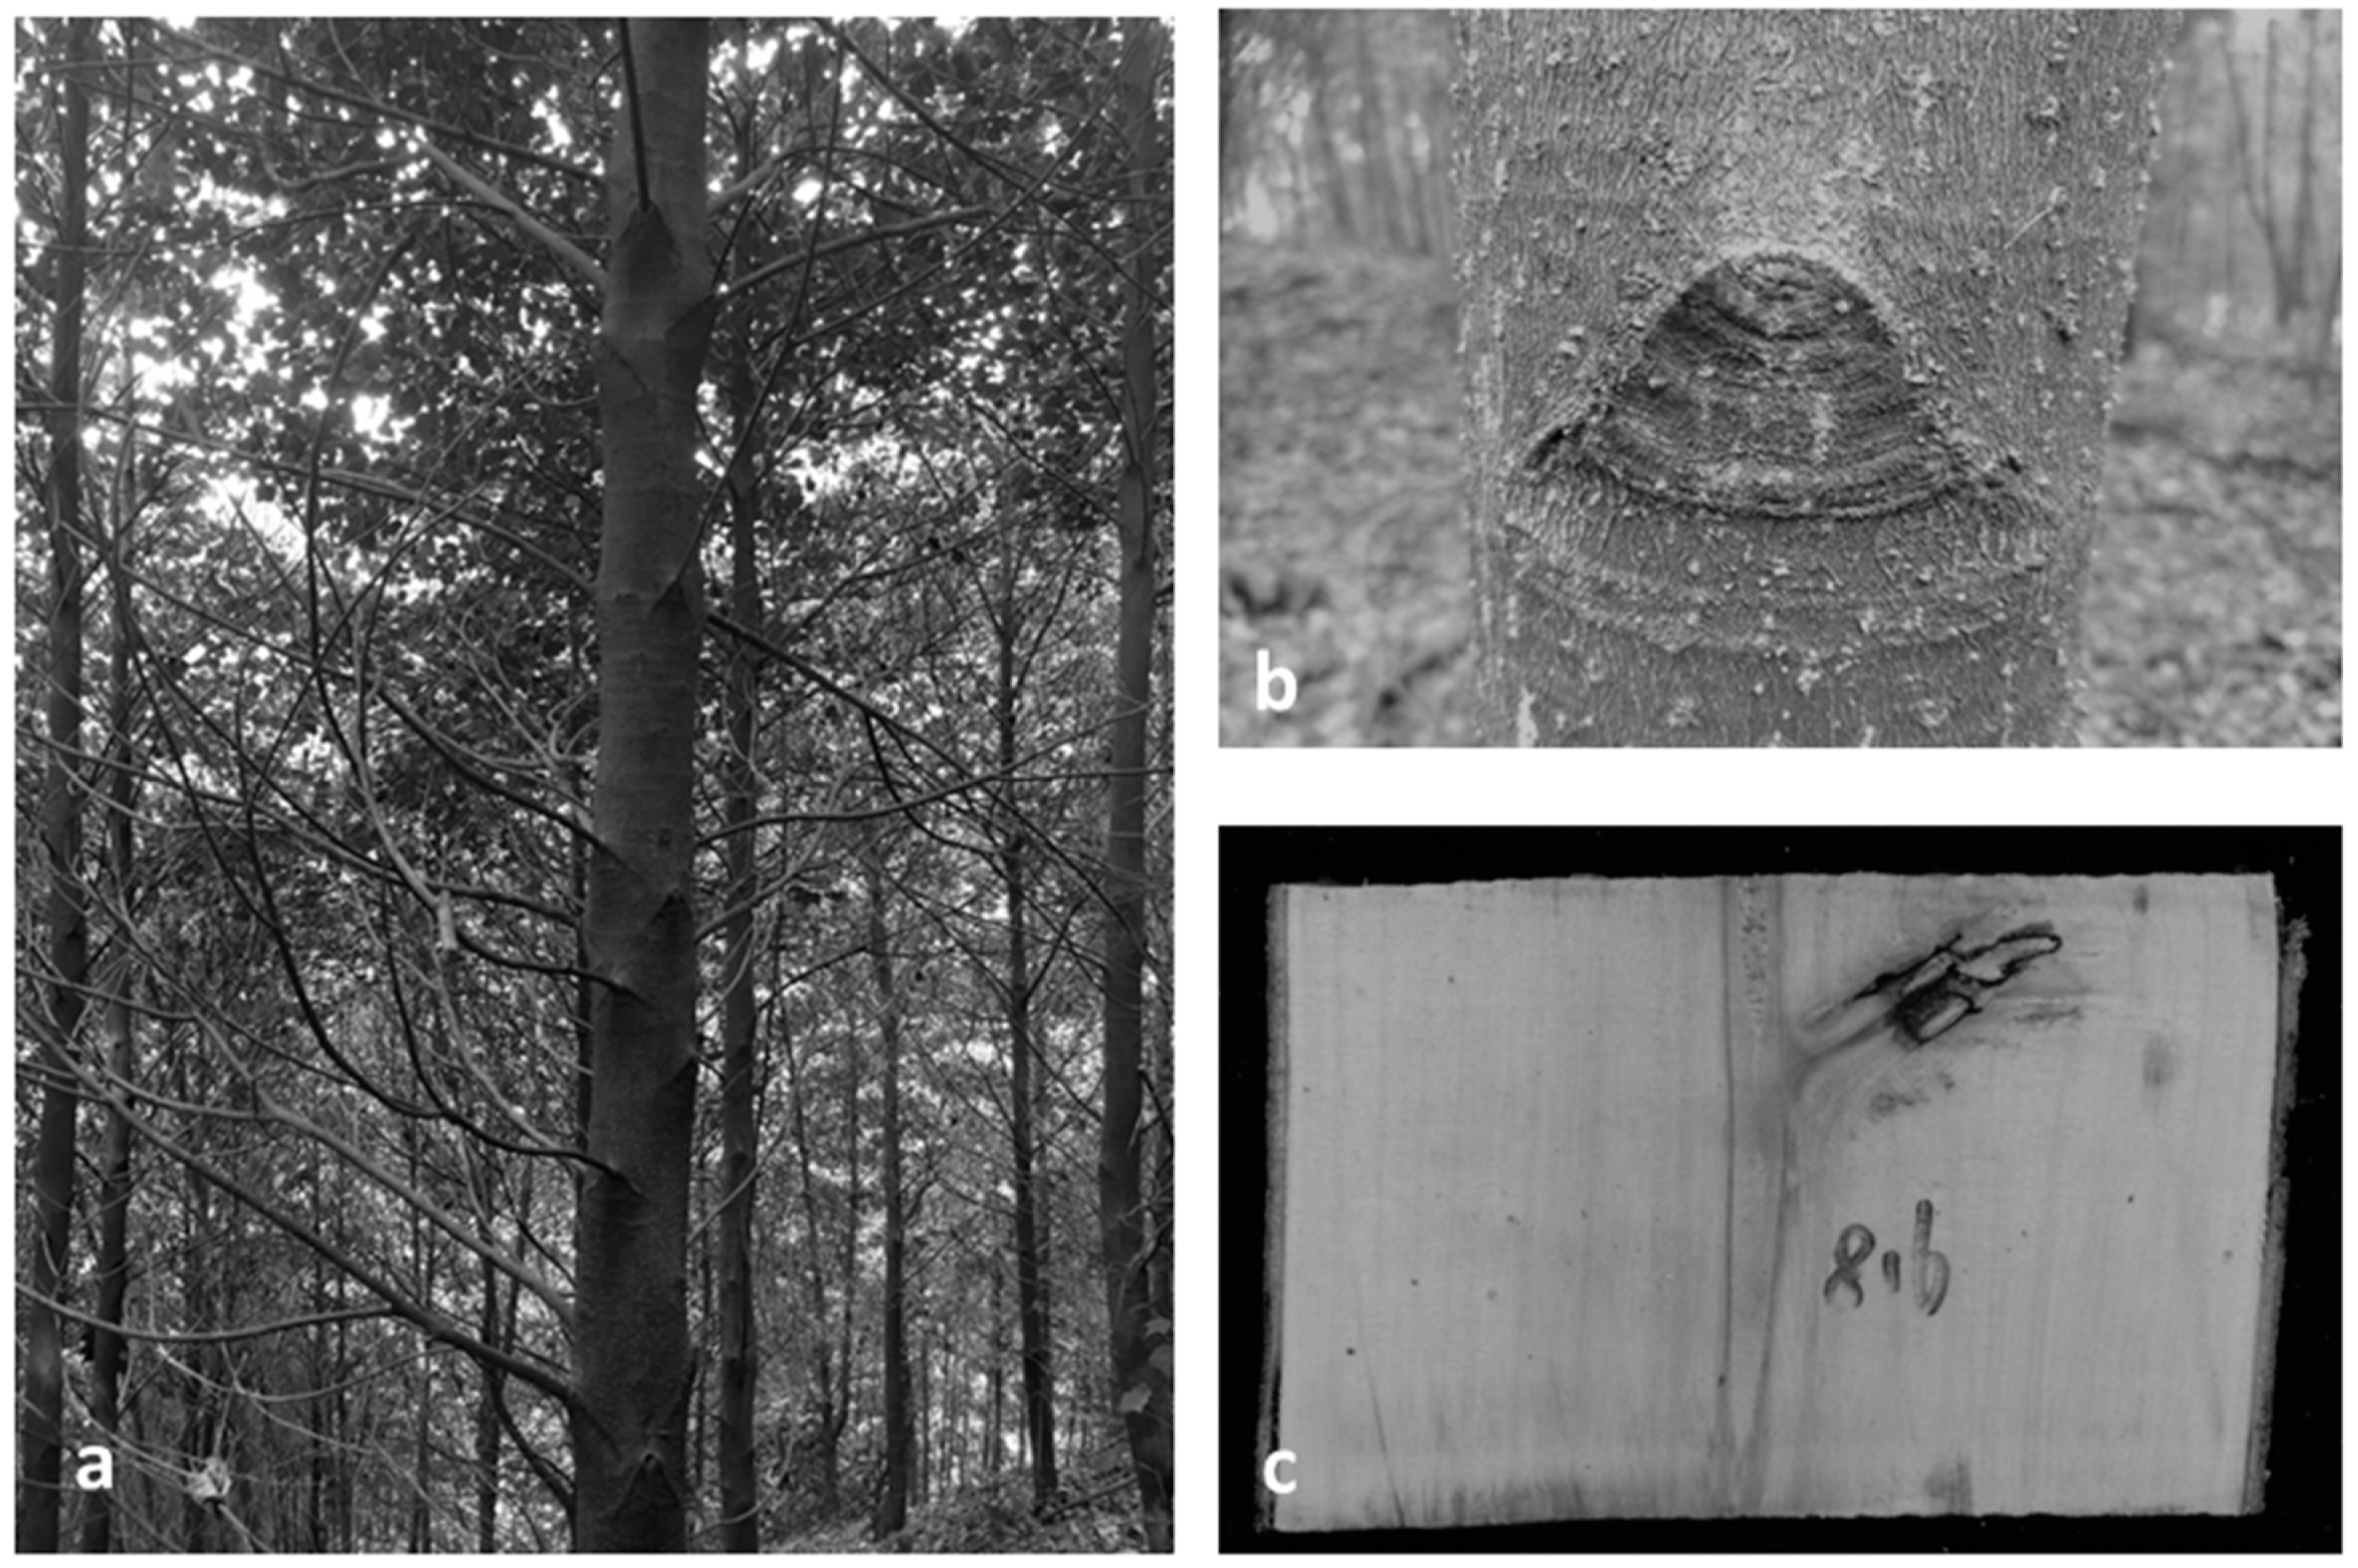
Figure 3.
Longitudinal section of the occluded branch after natural pruning (modified from Hein [1]). MK = OBD; JP = DL; CF = DBSL; ∠GNJ = EA; YD = (Y1 + Y2)/2, in which Y1 is the first year of branch occlusion and Y2 is the last year of branch growth. The dark gray portion shows the decayed part under a naturally pruning branch. OBD: occluded branch diameter; DL: branch discoloration length; DBSL: dead branch of stub length; EA: branch exsertion angle; YD: year of branch death; YO: year of branch occlusion.
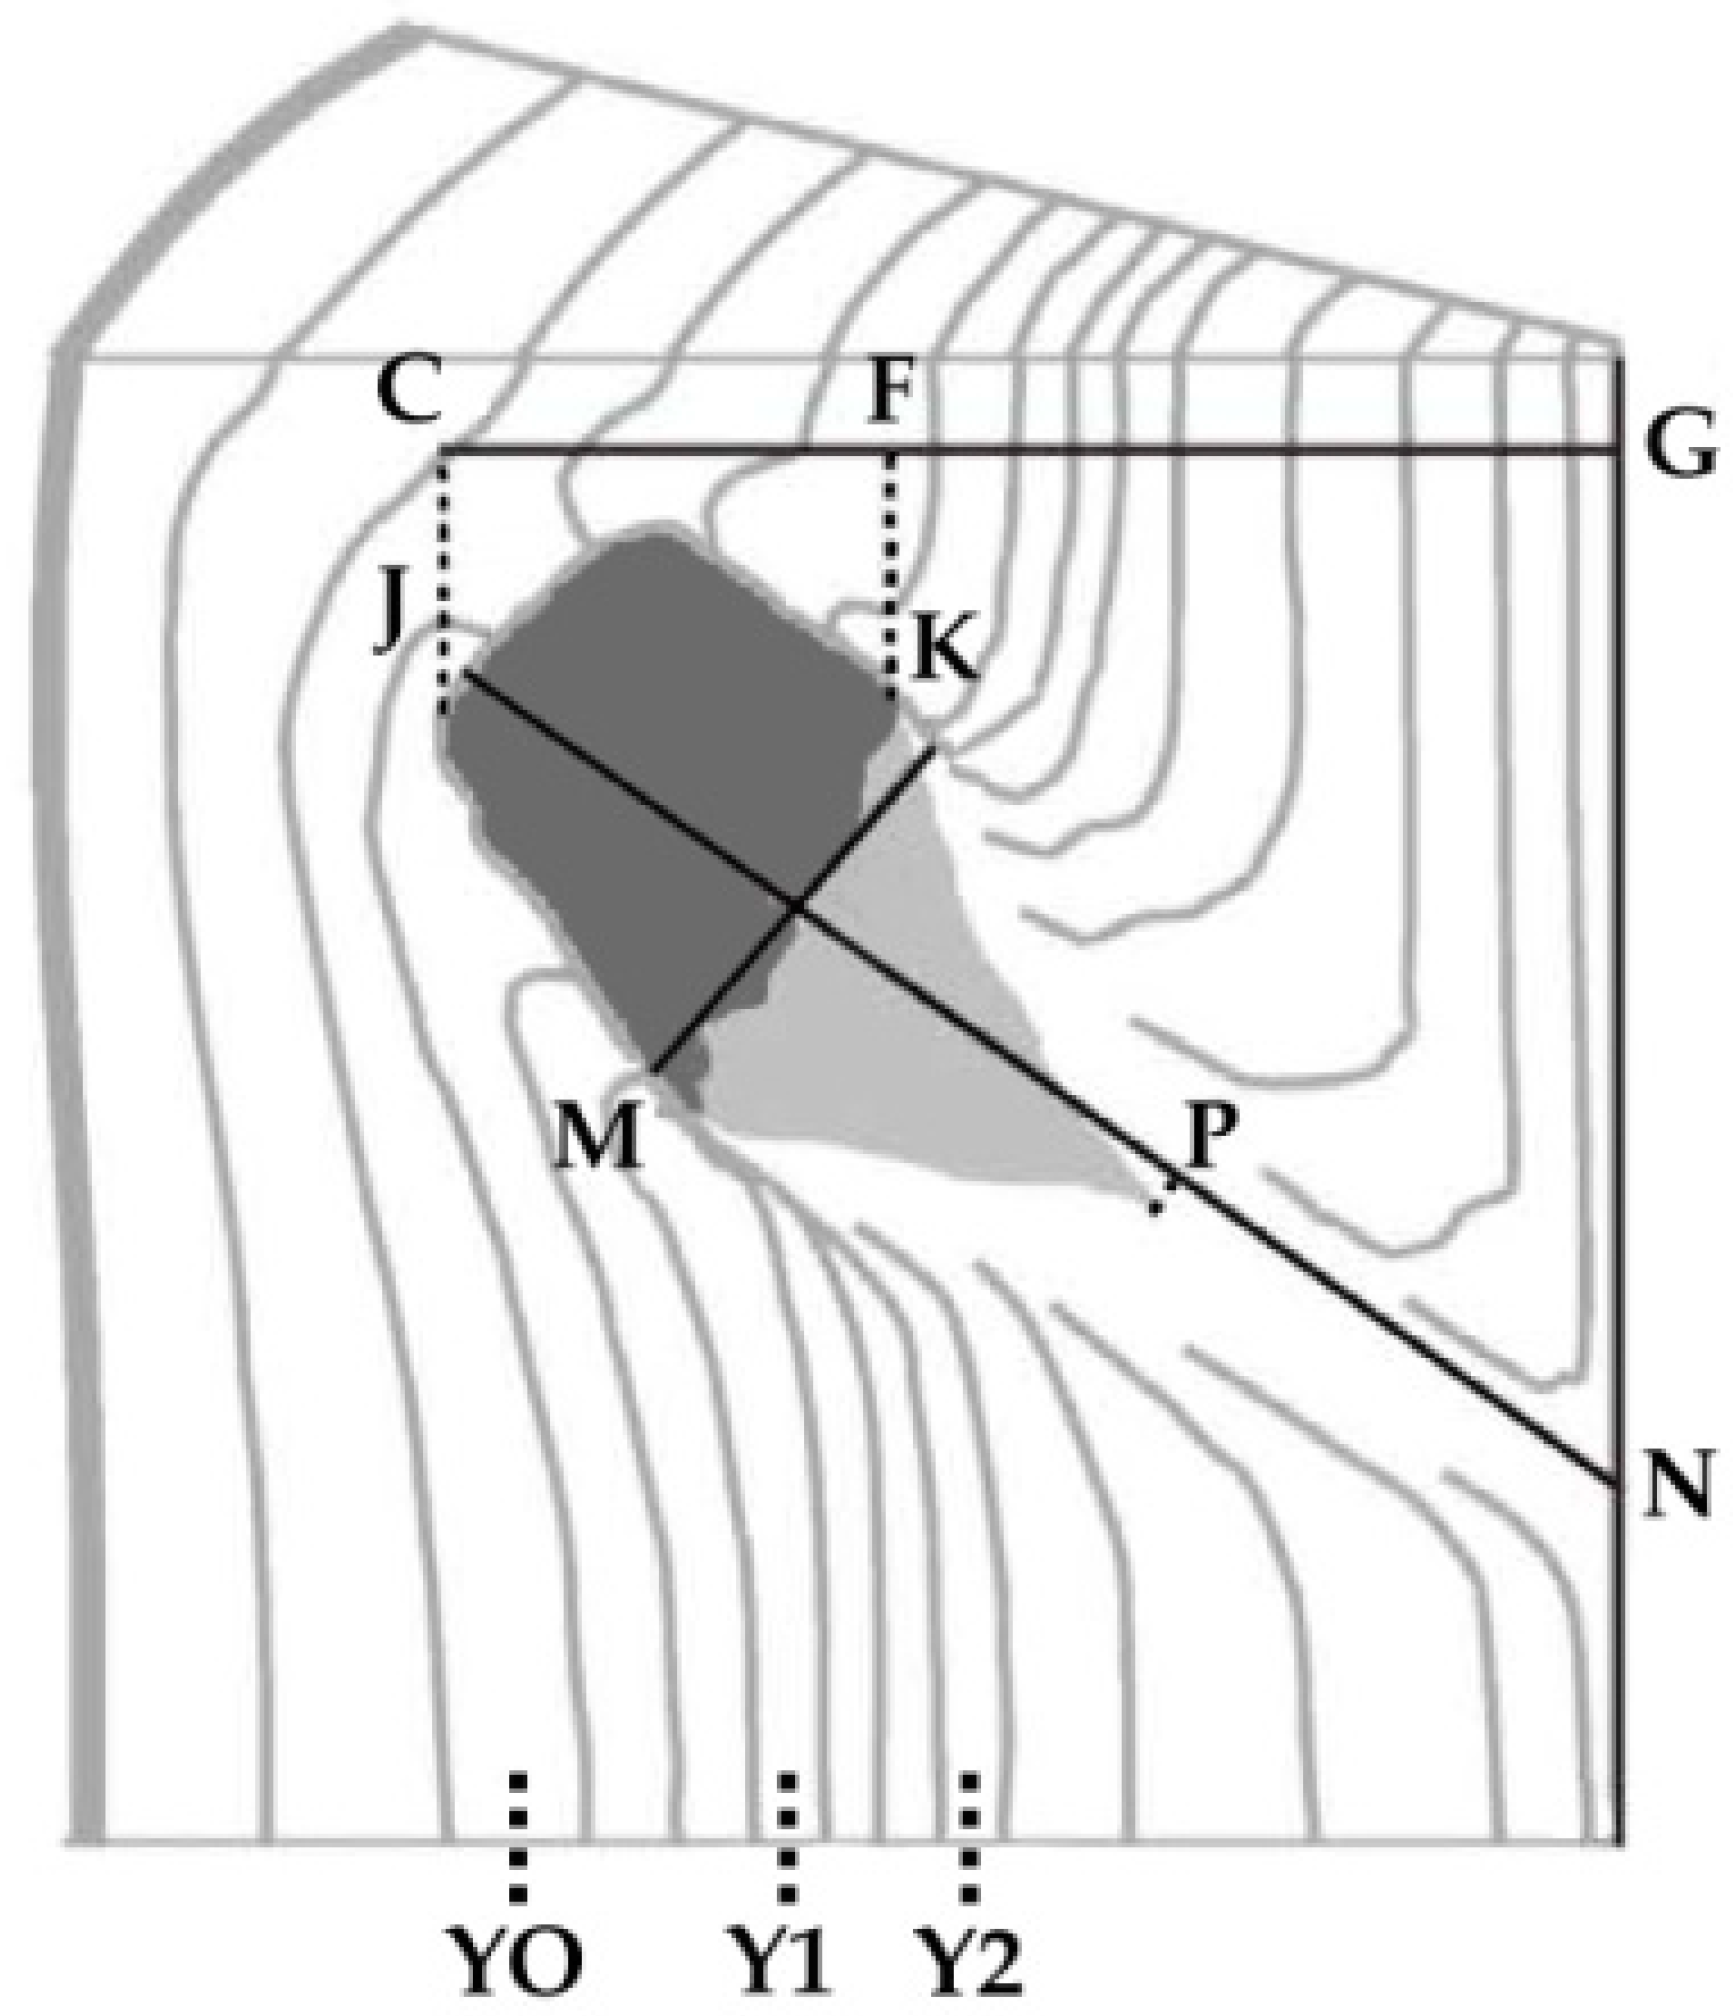
Figure 4.
Distribution of occluded branches according to tree height (the whole dataset) with respect to the number of occluded branches (NOB) and mean diameter of occluded branches (MDOB). Plots were made at intervals of 0.1 m heights.
Figure 4.
Distribution of occluded branches according to tree height (the whole dataset) with respect to the number of occluded branches (NOB) and mean diameter of occluded branches (MDOB). Plots were made at intervals of 0.1 m heights.
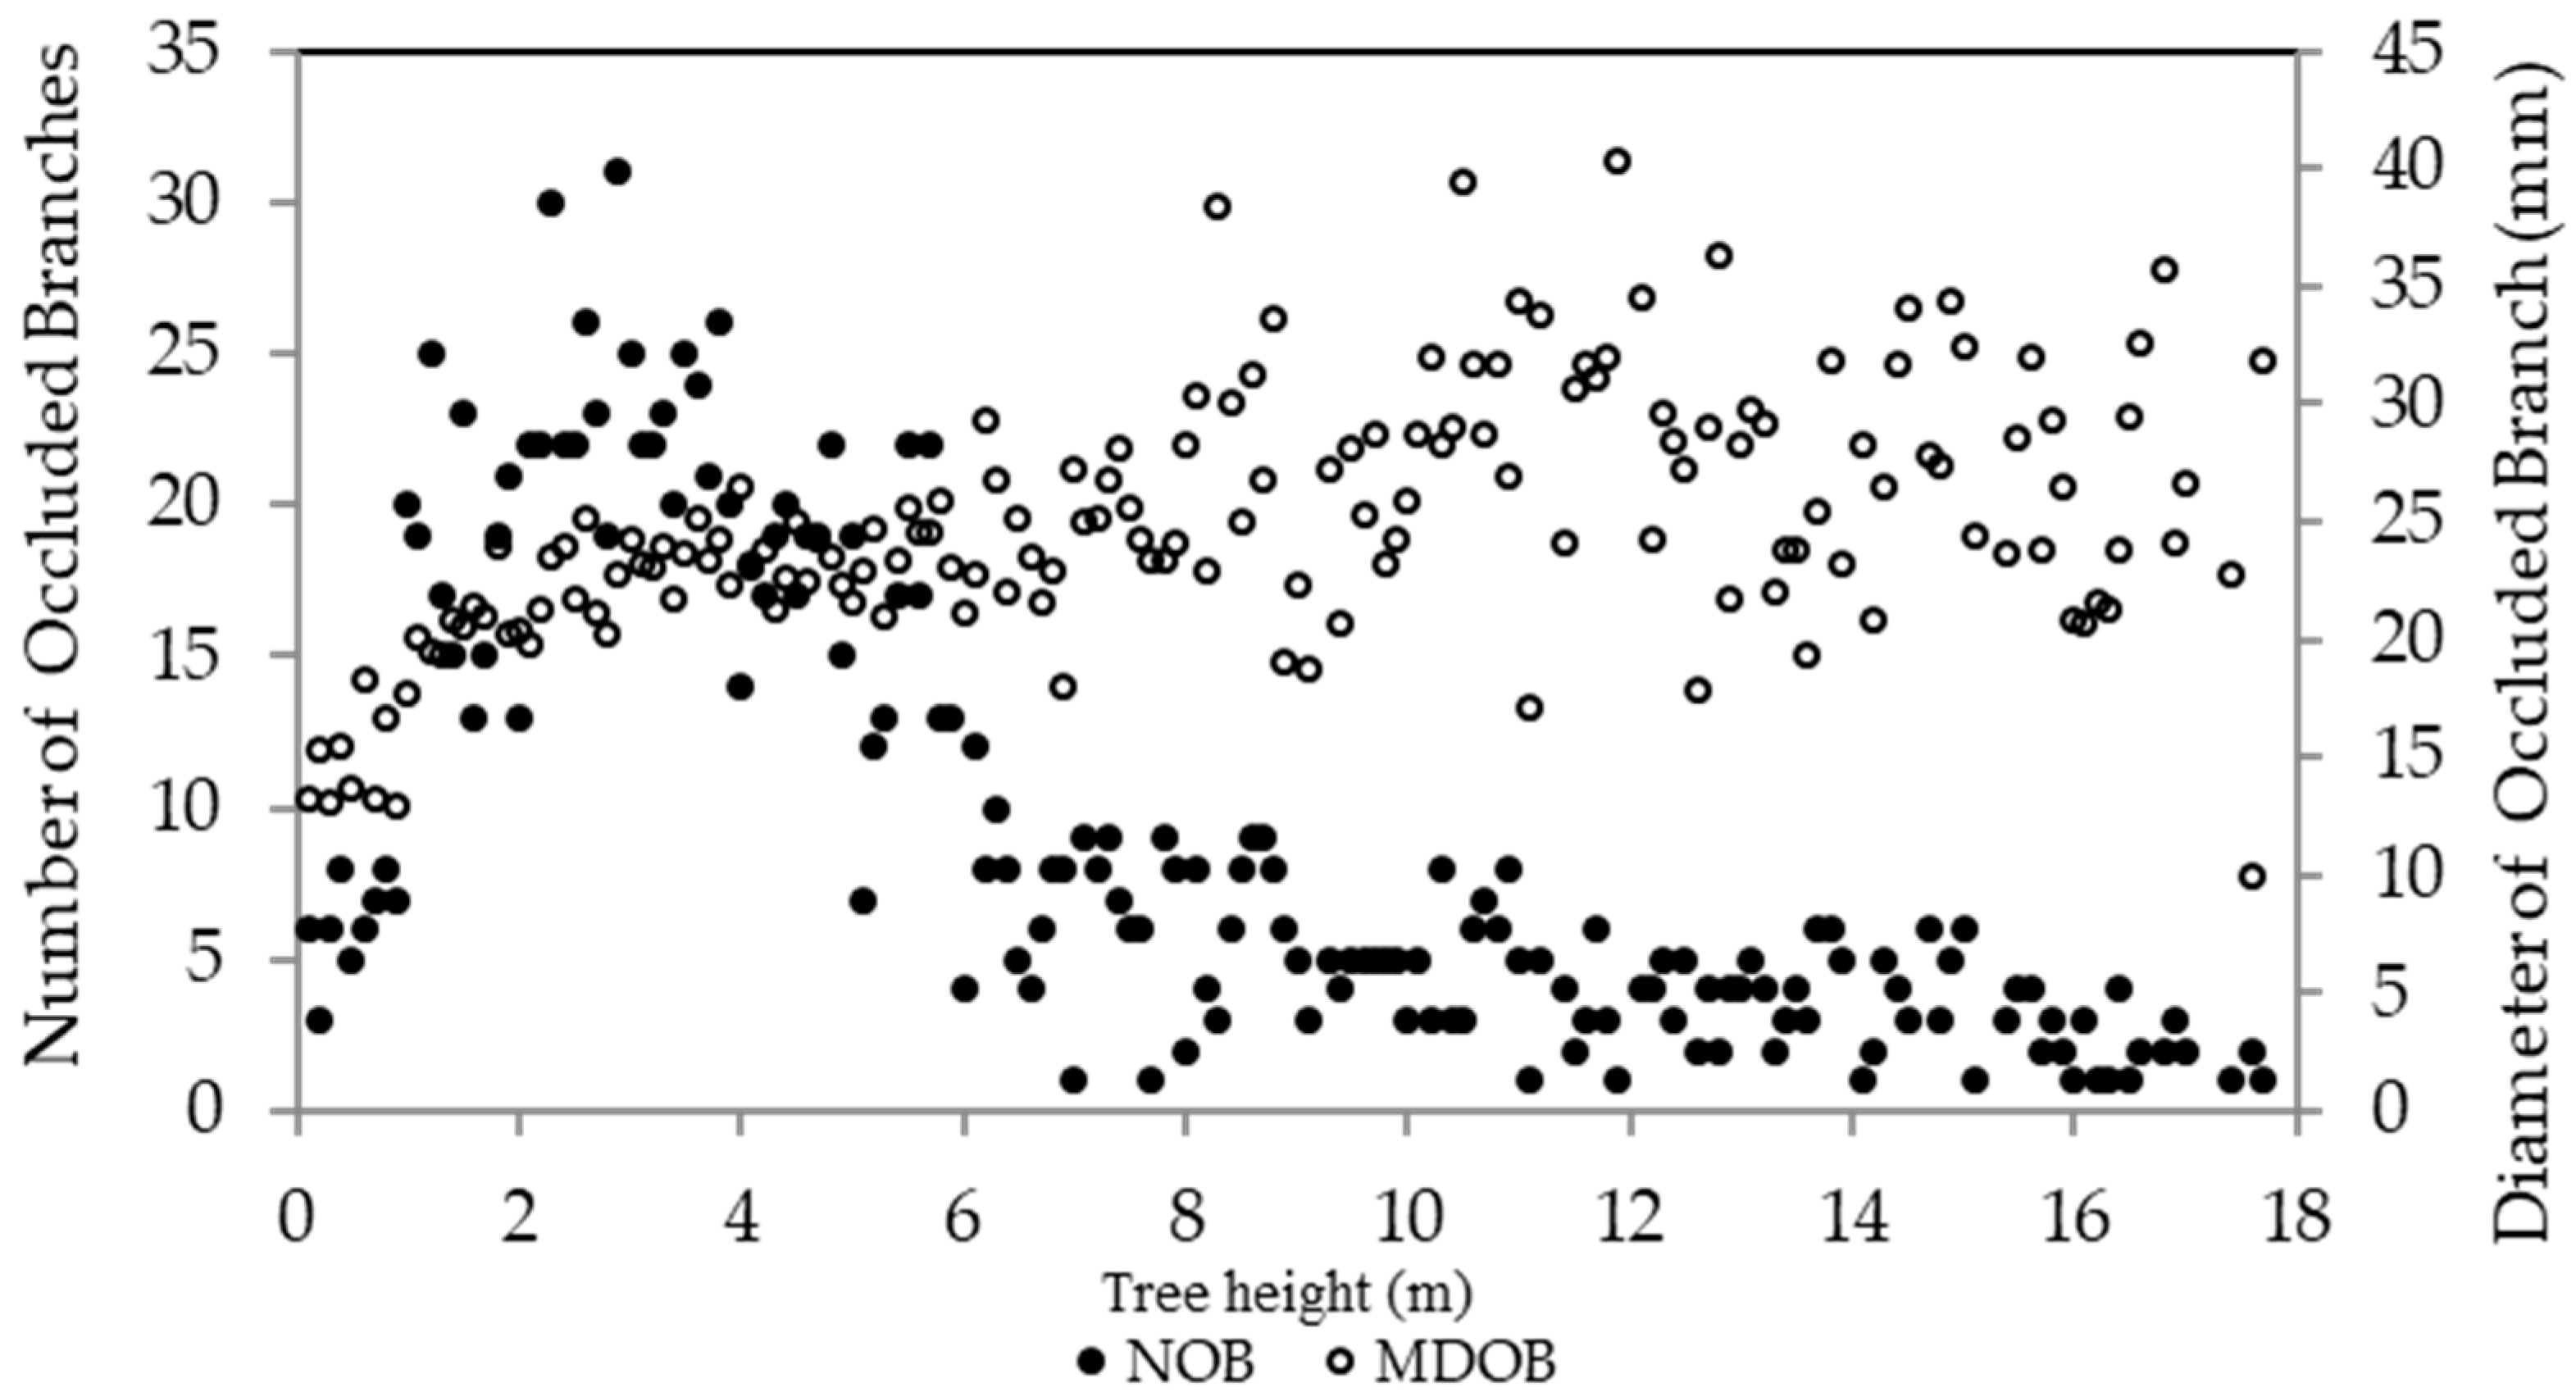
Figure 5.
Temporal distribution of branch occlusion. YD and YO are the year of branch death and occlusion, respectively. OT is the time of branch occlusion.
Figure 5.
Temporal distribution of branch occlusion. YD and YO are the year of branch death and occlusion, respectively. OT is the time of branch occlusion.
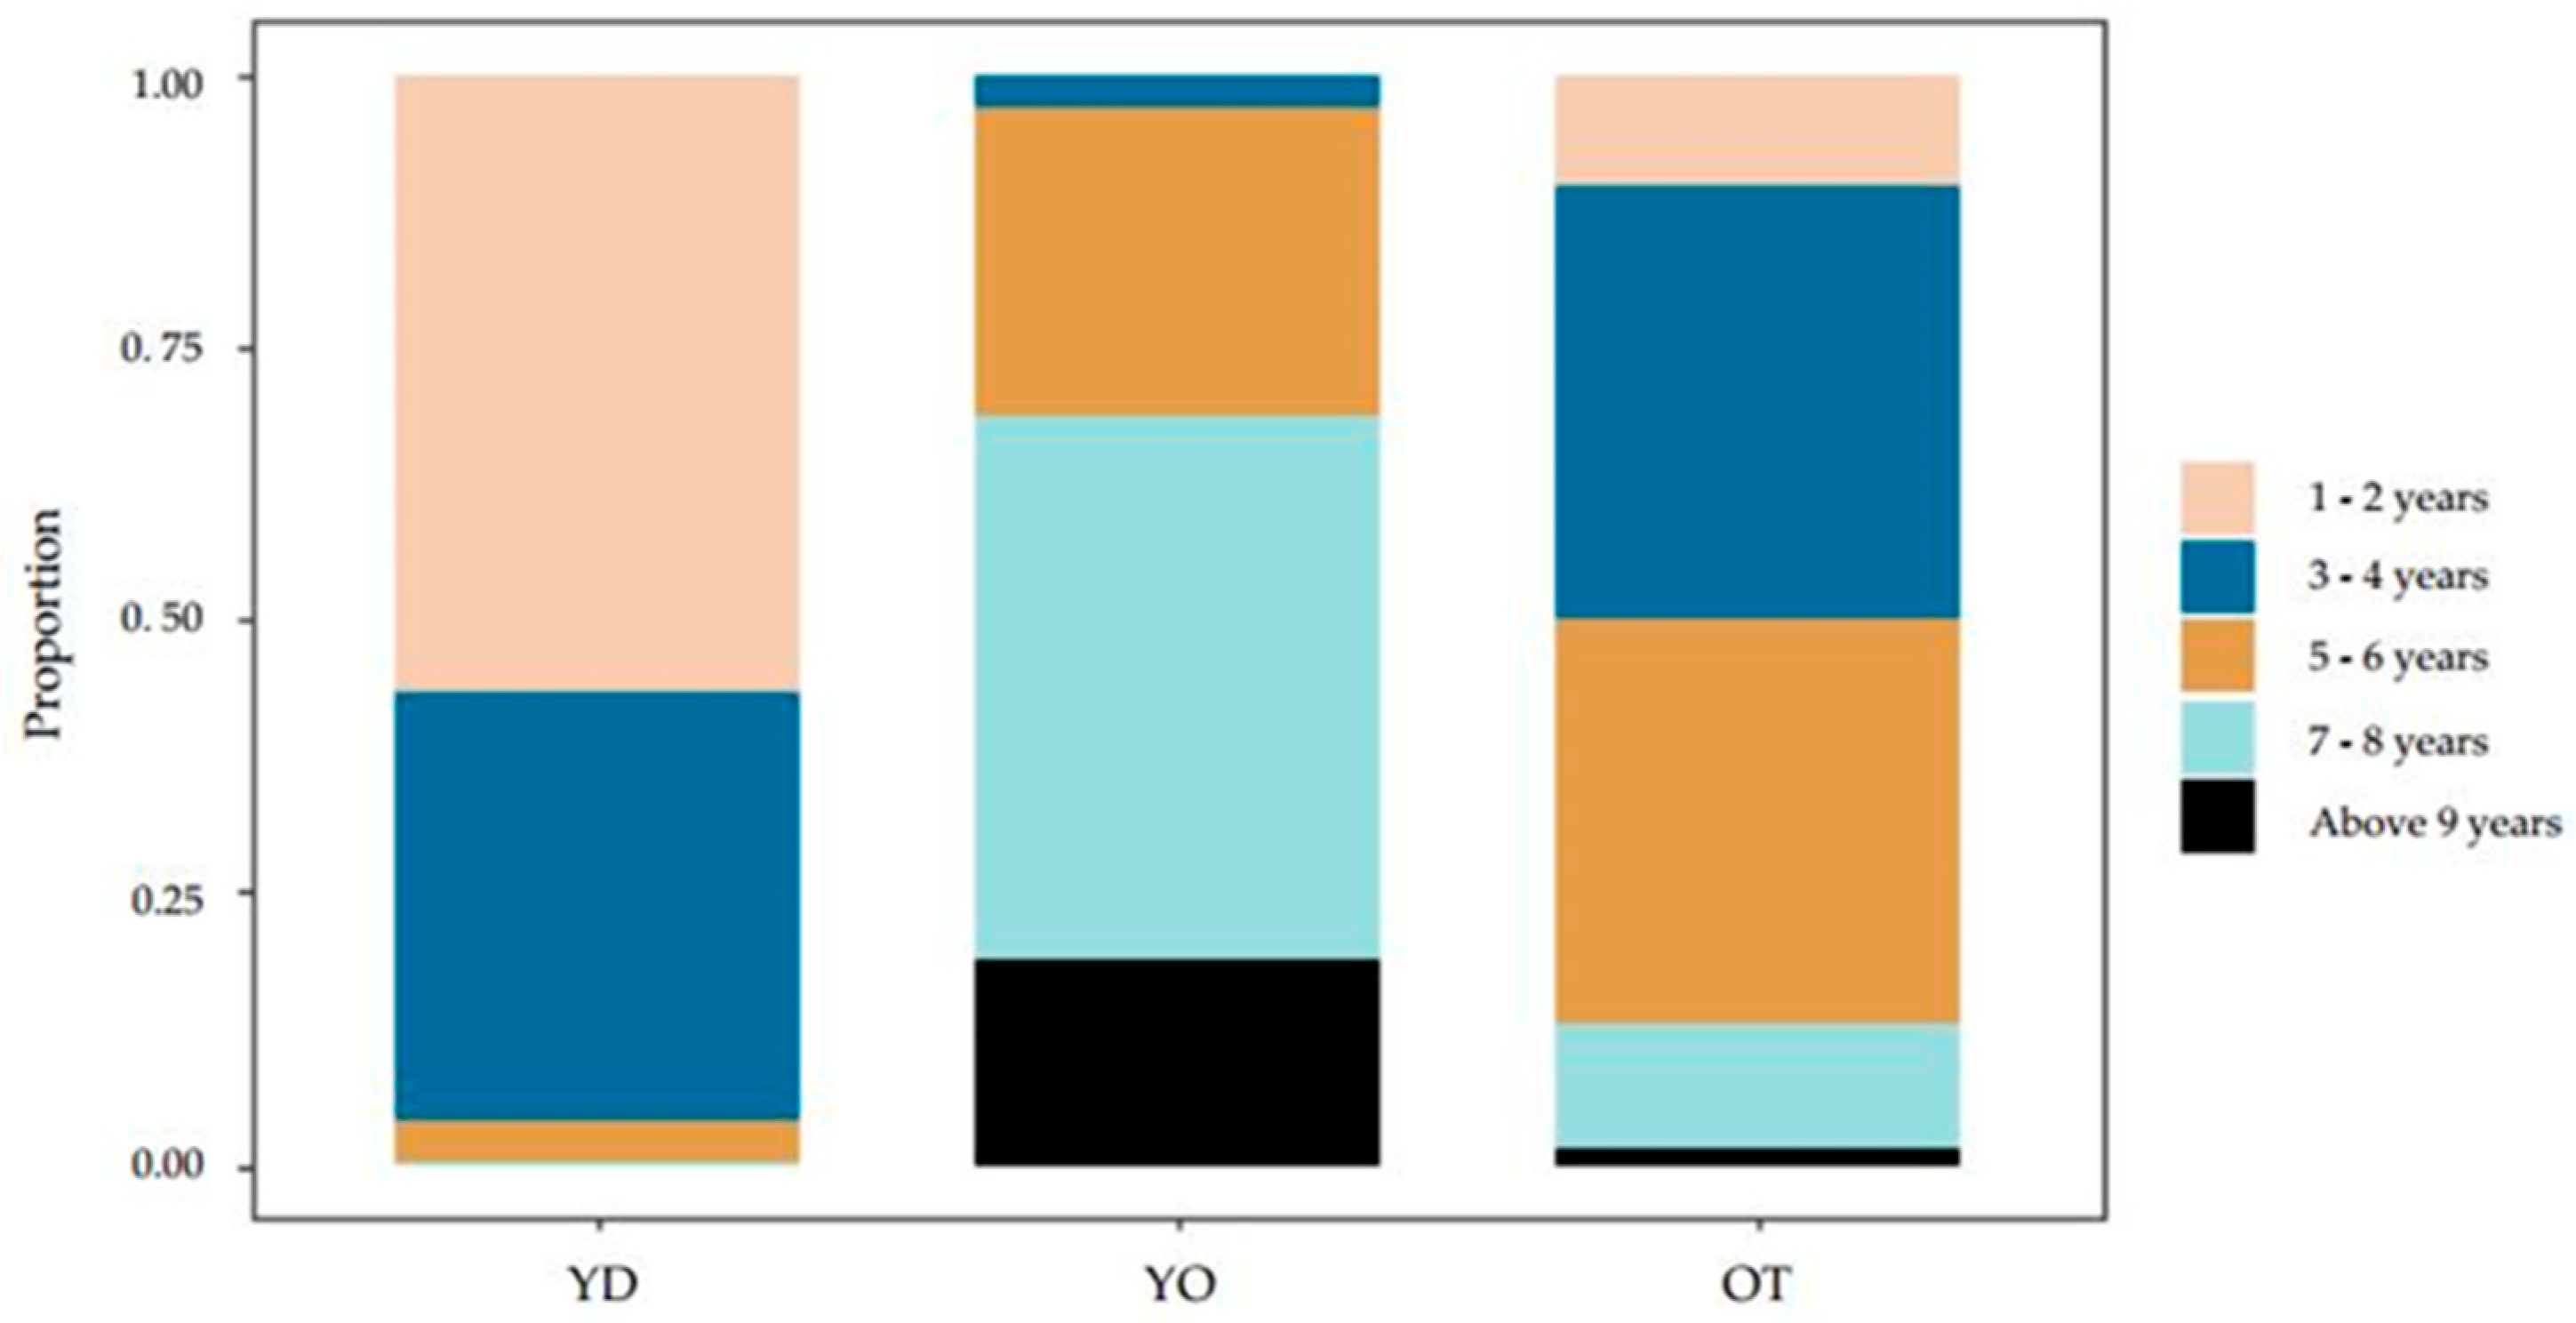
Figure 6.
Simulation curves based on marginal models for predicting the branch occlusion time (a,b), dead branch stub length (c), branch exsertion angle (d), and discoloration length (e,f). (a) Predicted branch occlusion time under natural pruning from the mean dead branch stub length of the whole dataset and different levels of mean stem radial increment during branch occlusion against the occluded branch diameter. (b) Predicted branch occlusion time from the mean occluded branch diameter and different levels of mean stem radial increment during branch occlusion against the dead branch stub length. (c) Predicted dead branch stub length against the occluded branch diameter. (d) Predicted branch exsertion angle against the occluded branch diameter. (e) Predicted discoloration length from the mean occluded branch diameter and different levels of branch occlusion time against the branch exsertion angle. (f) Predicted discoloration length from the mean branch exsertion angle and different levels of branch occlusion time against the occluded branch diameter.
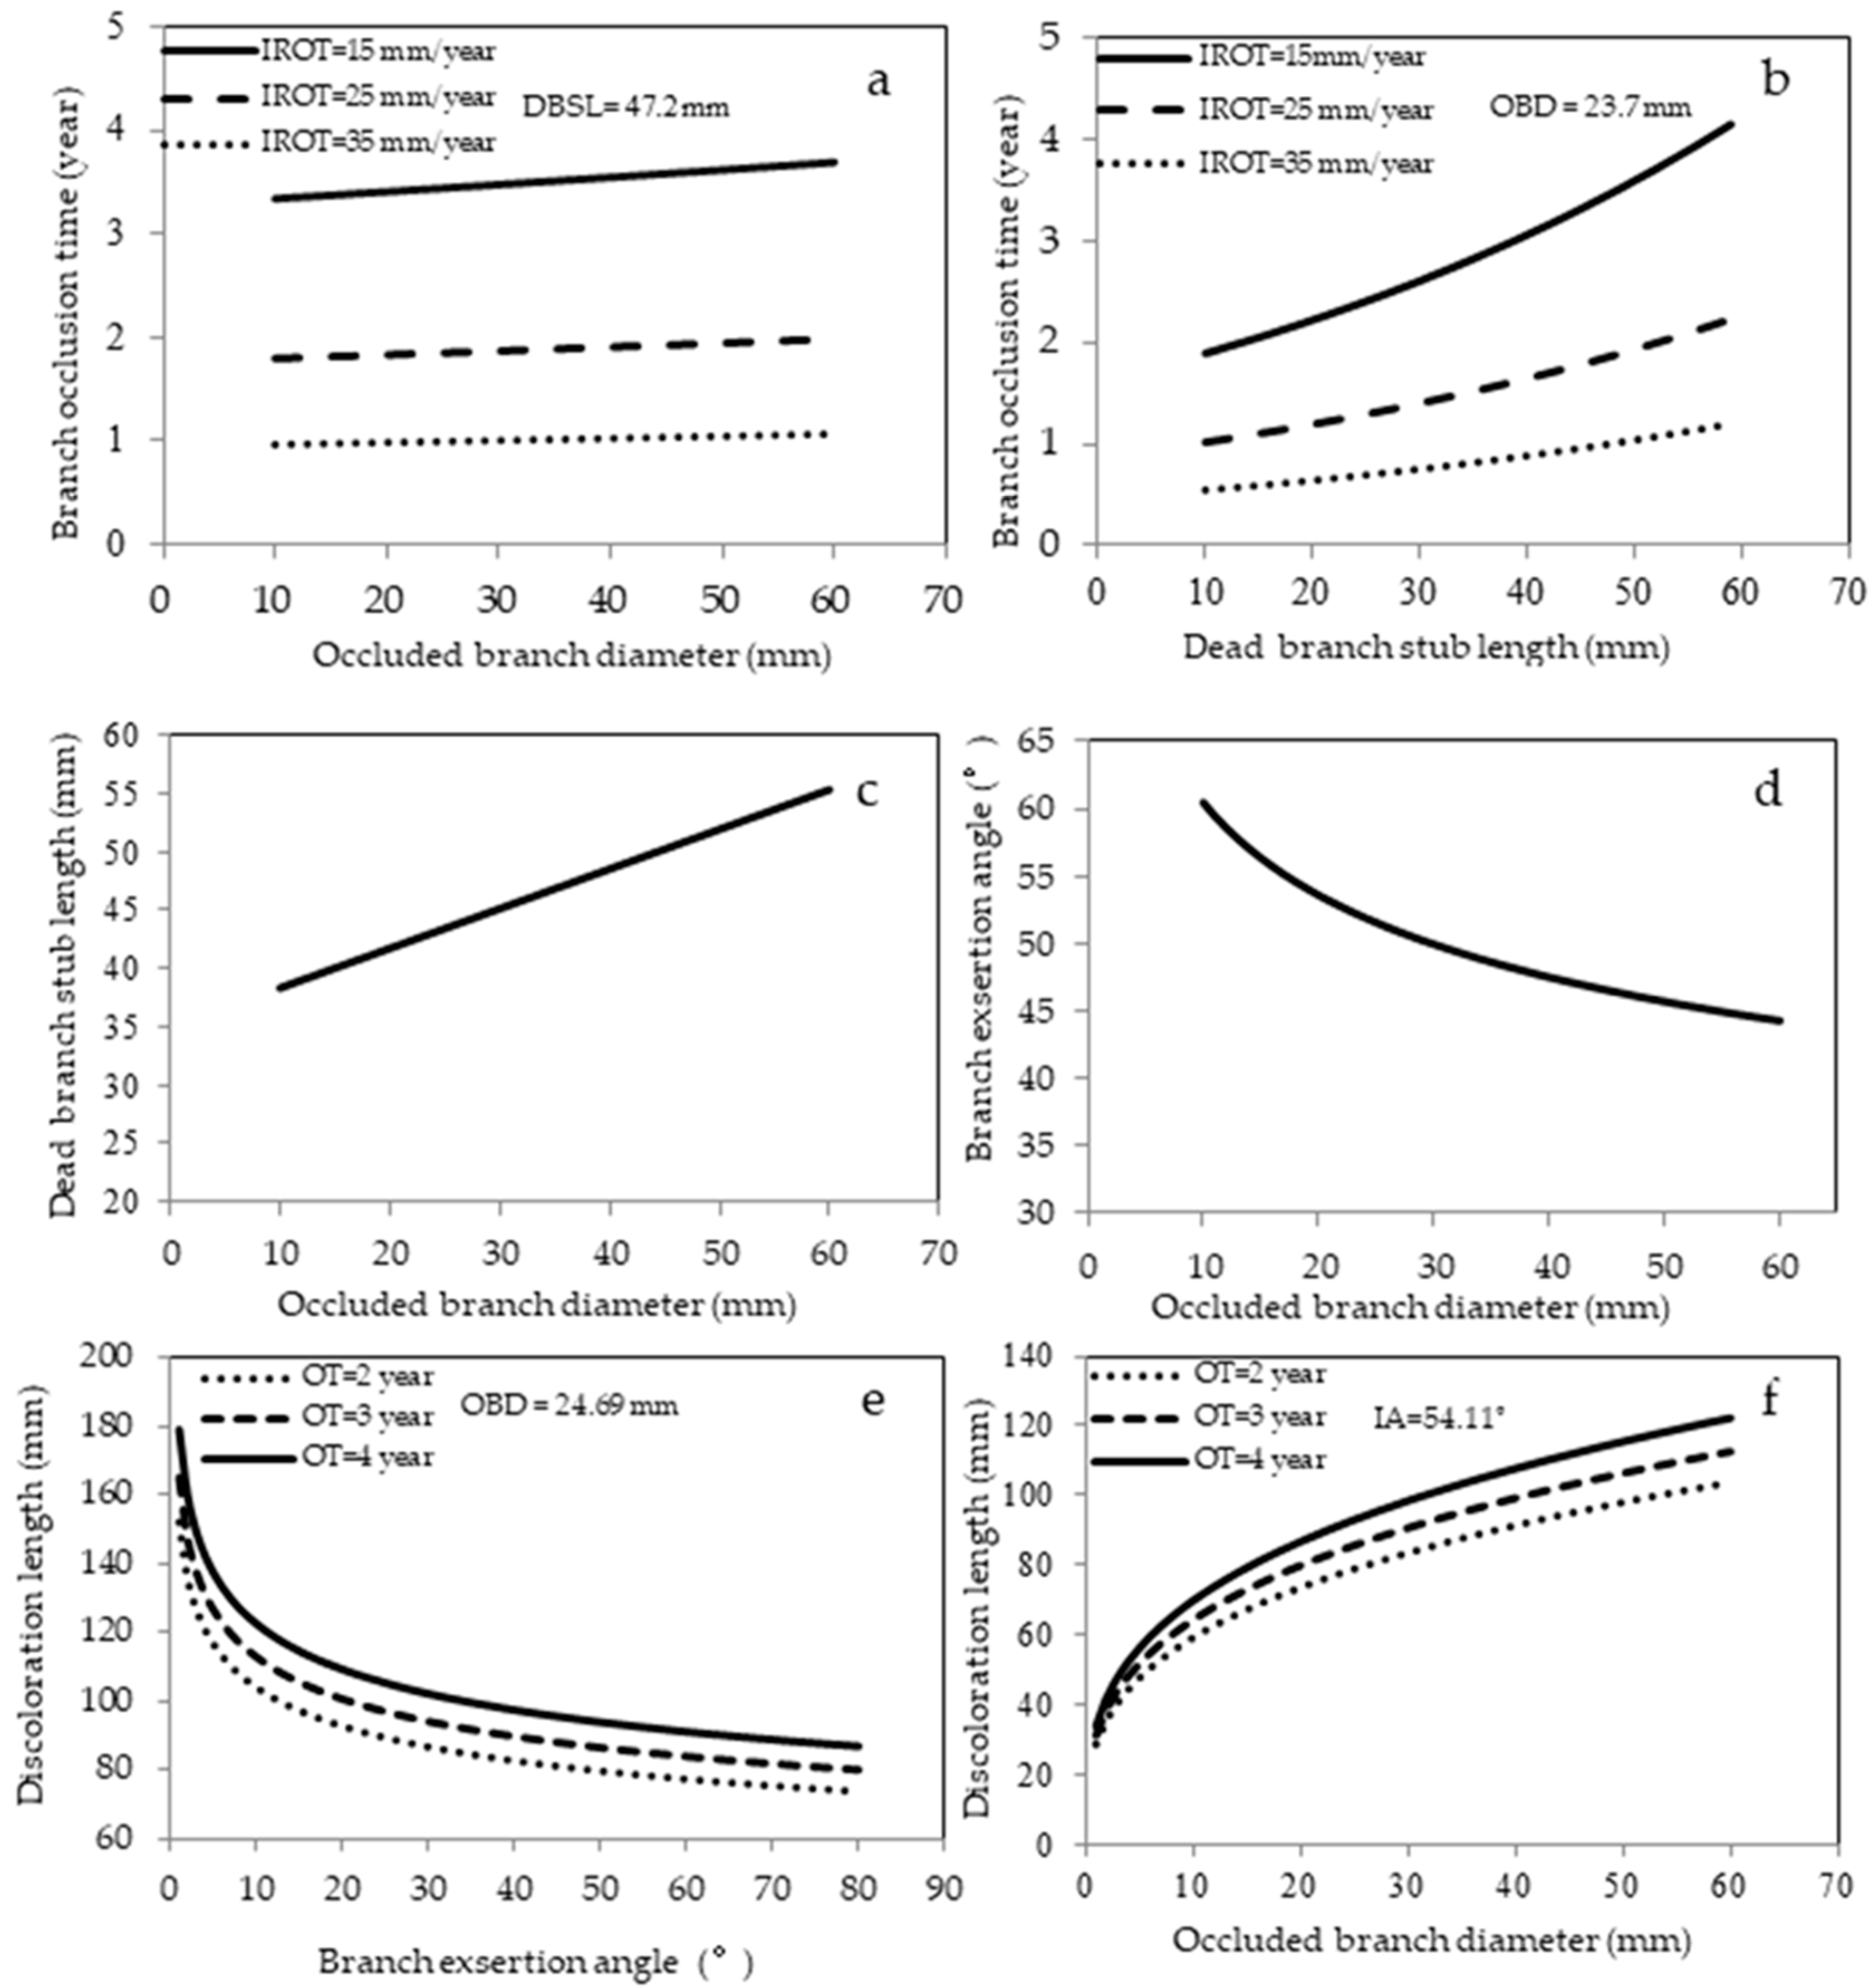
Figure 7.
Predicted probability of wood discoloration for M. laosensis and the branch occlusion time.
Figure 7.
Predicted probability of wood discoloration for M. laosensis and the branch occlusion time.

Table 1.
Variable abbreviations.
| Variables | Definition | Unit |
|---|---|---|
| Tree-level variables | ||
| H | Tree total height | (m) |
| DBH | Diameter at breast height | (cm) |
| HCB | Height of the crown base | (m) |
| CD | Diameter of the crown | (m) |
| Branch-level variables | ||
| EA | Branch exsertion angle | (°) |
| BH | Branch height on stem | (m) |
| YD | Year of branch death | (year) |
| YO | Year of branch complete occlusion | (year) |
| OT | Branch occlusion time | (year) |
| IROT | Mean stem radial increment during | (mm/year) |
| the branch occlusion | ||
| OB | Occluded branch | |
| OBD CT | Occluded branch diameter Cork tissue (0 = absent, 1 = present) | (mm) |
| DBSL | Dead branch stub length | (mm) |
| DL | Discoloration length | (mm) |
| DSW | Discoloration in stem wood | |
| (0 = absent, 1 = present) | ||
| Model descriptors | ||
| a, b, c | Coefficient of fixed effect | |
| t, tb | Subscripts for tree, branch | |
| α, β, γ | Coefficient of random effect | |
| Ln ( ) | Natural log-link | |
| RMSE | Root mean squared error | |
| R2(c). R2(m) | Conditional and marginal R2 |
Table 2.
Summary tree statistics.
| Variables | Unit | Minimum–Maximum | Mean |
|---|---|---|---|
| Tree total height | m | 16.4–22.8 | 19.3 |
| Diameter at breast height | cm | 17.2–25.3 | 21.1 |
| Height of the live crown base | m | 4.2–8.8 | 6.8 |
| Diameter of the crown | m | 6.5–10.4 | 8.6 |
Table 3.
Summary individual-branch statistics.
| Variables (Abbreviation) | Unit | Minimum–Maximum | Mean |
|---|---|---|---|
| Branch exsertion angle (EA) | (°) | 3.9–98.5 | 54.1 |
| Branch height on the stem (BH) | (m) | 0.1–18.8 | 9.5 |
| Year of branch death (YD) | (year) | 2–8 | 2.6 |
| Branch occlusion time (OT) | (year) | 1–10 | 4.6 |
| Mean stem radial increment during | (mm/year) | 1.3–55 | 11.1 |
| branch occlusion (IROT) | |||
| Occluded branch diameter (OBD) | (mm) | 4.7–59.1 | 23.7 |
| Dead branch stub length (DBSL) | (mm) | 6.1–148.5 | 47.2 |
| Discoloration length (DL) | (mm) | 17.2–193.3 | 100.3 |
| Discoloration in stem wood (DSW) | 0–1 | 0.09 |
Table 4.
Estimated coefficients and standard errors for equations.
| Equation | Response Variable | Parameters | Predictor Variable | Estimate | SE | R2(m) | R2(c) |
|---|---|---|---|---|---|---|---|
| Equation (1) | Branch occlusion time (OT) * | a0 | Intercept | 1.361 | 0.037 | 56.29% | - |
| a1 | OBD | 0.022 | 0.003 | ||||
| a2 | DBSL | 0.016 | 0.001 | ||||
| a3 | IROT | −0.062 | 0.004 | ||||
| Equation (2) | Dead branch stub length (DBSL) * | a0 | Intercept | 2.935 | 0.133 | 9.56% | - |
| a1 | OBD * | 0.226 | 0.039 | ||||
| Equation (3) | Branch exsertion angle (EA) * | a0 | Intercept | 4.49 | 0.052 | 12.51% | 16.94% |
| a1 | OBD * | −0.174 | 0.015 | ||||
| γpt | 0.013 | 0.005 | |||||
| Equation (4) | Branch discoloration length (DL) * | a0 | Intercept | 3.846 | 0.129 | 17.64% | 26.17% |
| a1 | OT | 0.082 | 0.003 | ||||
| a2 | OBD * | 0.312 | 0.016 | ||||
| a3 | EA * | −0.165 | 0.026 | ||||
| δpt | 0.013 | 0.004 | |||||
| Equation (5) | Probability of wood discoloration (DSW) | a0 | Intercept | −3.645 | 0.282 | 57.18% | 81.54% |
| a1 | OT | 0.282 | 0.051 | ||||
| εptb | 0.012 | 0.004 |
Note: * The variable was in logarithmic form in the equation. OBD: occluded branch diameter; DL: branch discoloration length; IROT: mean stem radial increment during branch occlusion; DBSL: dead branch of stub length; EA: branch exsertion angle; OT: time of branch occlusion.
© 2019 by the authors. Licensee MDPI, Basel, Switzerland. This article is an open access article distributed under the terms and conditions of the Creative Commons Attribution (CC BY) license (http://creativecommons.org/licenses/by/4.0/).
Share and Cite
MDPI and ACS Style
Qin, G.; Hao, J.; Yang, J.; Li, R.; Yin, G. Branch Occlusion and Discoloration under the Natural Pruning of Mytilaria laosensis. Forests 2019, 10, 892. https://doi.org/10.3390/f10100892
AMA Style
Qin G, Hao J, Yang J, Li R, Yin G. Branch Occlusion and Discoloration under the Natural Pruning of Mytilaria laosensis. Forests. 2019; 10(10):892. https://doi.org/10.3390/f10100892
Chicago/Turabian StyleQin, Guoming, Jian Hao, Jinchang Yang, Rongsheng Li, and Guangtian Yin. 2019. "Branch Occlusion and Discoloration under the Natural Pruning of Mytilaria laosensis" Forests 10, no. 10: 892. https://doi.org/10.3390/f10100892
Note that from the first issue of 2016, this journal uses article numbers instead of page numbers. See further details here.