Article

Climate Change Impacts on the Potential Distribution and Range Shift of Dendroctonus ponderosae (Coleoptera: Scolytidae)

1
Key Laboratory of Beijing for the Control of Forest Pests, Beijing Forestry University, Beijing 100083, China
2
Department of Integrative Biology, University of Guelph, Ontario, N1G 2W1, Canada
3
Mentougou Forestry Station, Beijing 102300, China
*
Author to whom correspondence should be addressed.
Forests 2019, 10(10), 860; https://doi.org/10.3390/f10100860
Submission received: 7 August 2019 / Revised: 18 September 2019 / Accepted: 23 September 2019 / Published: 2 October 2019
(This article belongs to the Section Forest Ecology and Management)

Abstract

:
Dendroctonus ponderosae Hopkins (Coleoptera: Scolytidae) is one of the most important bark beetles in North America and causes considerable economic and ecological losses during outbreaks. The distribution of this pest species is likely to be altered by climate change, which may threaten currently unaffected areas. In this study, we used CLIMEX to project the potential global distribution of D. ponderosae according to both historical climate data (1987–2016) and future climate warming estimates (2021–2100) to evaluate the impact of climate change on this species. Regions with suitable climate for D. ponderosae are distributed in all continents except Antarctica under both historical and future climate conditions, and these are predicted to change continuously with climate change. Overall, climate suitability will increase in middle- and high-latitude regions and decrease in low-latitude regions, and regions most sensitive to climate change are located in the mid-latitude zone. Moreover, the shift directions and ranges of climate-suitable regions under future conditions will differ among continents, and the shift distances in the north–south direction are larger than these in the east–west direction for Africa, Asia, Europe, South America, and Oceania, indicating that shift direction is possibly mainly affected by temperature. These projected distributions may provide theoretical guidance for early-warning intervention and risk assessment.

1. Introduction

The increasing emission of greenhouse gases is already causing global climate change, particularly global warming. Based on representative concentration pathway (RCP) 4.5, globally averaged combined land and ocean surface temperatures warmed by 0.85 °C (0.65–1.06 °C) between 1880 and 2012, and global mean surface temperature by the end of the 21st century (2081–2100) is likely to be 1.1–2.6 °C higher than the 1986–2005 period [1]. As poikilotherms, insects are highly likely to be affected by global climate change, resulting in disruption of their life history and distribution boundaries, which could increase the risk of invasion of new regions, threatening unexpected losses across the world [2,3].
The mountain pine beetle, Dendroctonus ponderosae Hopkins (Coleoptera: Curculionoidea: Scolytidae), a native bark beetle of western North America, is currently widely distributed in three major countries of North America, including the USA, Canada, and Mexico, located in tropical and temperate zones [4,5]. The epic outbreaks of this pest species have caused the mortality of hundreds of millions of trees over large areas, leading to timber loss, increase to fire, habitat loss, alterations to carbon cycling processes from carbon sinks to carbon sources, and exacerbation of global warming [6,7,8]. Thus the pest was added into European and Mediterranean Plant Protection Organization (EPPO) A1 forest pest list since 1990 [4,9,10] and was regarded as the largest forest insect blight ever seen in North America, while the range expansion of the pest has aroused the attention worldwide [11]. D. ponderosae can successfully infest and kill almost all of the native pines within its range, such as lodgepole pine (Pinus contorta Dougl. ex Loud var. latifolia Engelm), ponderosa pine (P. ponderosae Dougl. ex Laws.), whitebark pine (P. albicaulis Engelm.) and so on [4,5,12]. Some exotic pines may also be attacked, it has been recorded that Eurasian pine species (P. sylvestris L.) could be among the susceptible host species of D. ponderosae [13,14], although having better resistance than native pine species [14]. Furthermore, D. ponderosa is also capable of attacking some Picea species [13]. The population and distribution of D. ponderosae are greatly affected by climate factors; mild winter temperatures promote survival during overwintering, while anomalous cold events lead to increased brood mortality within infected trees. Mild summer temperatures also appear beneficial to D. ponderosae survival, while extremely warm events can result in increased brood mortality and decreased beetle activity [4]. Additionally, precipitation indirectly affects pests by affecting hosts, while extreme moisture stress leads to reduced resin flow and limits the host’s capacity to resist attack [15,16]. Current management measures mainly include trapping with synthetic aggregated pheromones, the mass trapping of beetles, and the application of a registered insecticide [5], but it is more effective and practicable to take preventive measures such as maintaining pine forests appropriately before outbreaks occur. Thus, predicting the potential distribution of D. ponderosae is of great significance and may provide theoretical guidance for early-warning intervention and risk assessment.
Species distribution models (SDMs) relate species distribution data with information on environmental characteristics, and they can be used to predict the distribution of species across a landscape [17]. The development of SDMs originates from early studies on the relationships between plant communities and geographical/environmental gradients. With the development of computer technology and geographic information systems (GIS), the application of SDMs has been greatly enhanced, and a large number of SDMs and software have been reported, including CLIMEX, DOMAIN, GARP, and Maxent [18,19].
Among them, CLIMEX is widely used to project the potential distributions of plants [20,21,22], animals [23,24,25], and microorganism species [26,27] under climate change condition. CLIMEX was first developed by the Commonwealth Scientific and Industrial Research Organization (CSIRO), and model performance has since been improved. Unlike most models that focus on describing the relationship between the occurrence of species with respect to static environment covariates, CLIMEX describes how species respond to climate variables at appropriate temporal scales (daily or weekly) [28]. Therefore, CLIMEX considers both the influence of environmental factors and species-specific factors on the potential distribution. Previous research has mainly explored the range expansion of D. ponderosae in North America. For example, Carroll et al. (2006) [29] studied range changes following climate change in Canada using the Sanfranyik model, which considered the minimum demands for the survival of beetles and host trees under historical and future climate conditions based on quantitative criteria for temperature and precipitation. Sanfranyik et al. (2010) [9] studied the effects of climate and weather on brood development and survival, and on key aspects of the interaction of D. ponderosae with its hosts and associated organisms using climate suitability models (multi-models consisting of the Sanfranyik model, the Logan model, and the Régnière and Bentz model) in North America. However, studies on the potential distribution of D. ponderosae on a global scale have not been reported. Therefore, it is necessary to identify the potential habitats for D. ponderosae under climate change condition from the perspective of global large scale to help decrease the significant threat from the pest.
In the present study, we identified the potential global distribution of D. ponderosae and its hosts using CLIMEX 4.0.0 based on historical (1987–2016) and future (2021–2100) climate data (based on the RCP 4.5 multi-model assembly). Then we explored the shift paths of mean centers in each continent for the next 10 decades to capture the location shifts of habitats more accurately. The results may assist the forecasting of changes in climate-suitable regions and provide a theoretical reference for decision-makers to determine effective quarantine, prevention, and control measures to reduce economic and ecological losses caused by outbreaks of this forestry pest.

2. Materials and Methods

2.1. Research Model and Software

2.1.1. CLIMEX Model

CLIMEX 4.0.0 (Hearne Scientific Software, Melbourne, Australia) is a dynamic simulation model that can be used to estimate the potential distribution of plants, animals, and diseases [28]. In this study, the ‘Compare the Location (one species)’ function was used to generate the ecoclimatic index (EI), which ranges from 1 to 100 and describes the favorability of the climate at a given location for a particular species. The EI value is determined by the annual growth index (GIA), the stress index (SI), the stress interaction index (SX), the obligate diapause index (DI), and the formula used to calculate EI was as follows: EI = GIA × SI × SX, where GIA was mainly determined from the temperature index (TI) and moisture index (MI), and SI = (1 – CS/100) × (1 – HS/100) × (1 – DS/100) × (1 – WS/100), where CS is cold stress, HS is heat stress, DS is dry stress, and WS is wet stress. A higher EI value indicates more favorable climate conditions for the long-term survival of a species, and a value of 100 represents constant and ideal conditions, such as those in an equatorial climate [28].
The SI in this study was established using a semi-automatic parameter fitting procedure within the software and manual adjustment. Based on a genetic algorithm (GA), the semi-automatic parameter fitting procedure in CLIMEX helps users to fit stress parameters by defining the area of the geographical distribution of a species where stresses are the lowest. This approach requires users to create a reference file based on known distribution and then set reasonable ranges for the parameters to be included in the fitting. An initial set of species parameter values is also needed to initiate the fitting process, which can be derived from a species with a similar distribution, or from one of the species templates supplied with CLIMEX [28].

2.1.2. ArcGIS Software

The Spatial Analyst Module of ArcMap 10.1, developed by the US Environment Systems Research Institute (ESRI) (RedLands, CA, USA), was used to analyze the projected results from CLIMEX. Inverse distance-weighted interpolation (IDW), mean center, and thematic mapping functions were used to create maps of potential global distributions under historical and future climate conditions. ArcGIS was also used to calculate the areas on each continent assigned to each of the four EI categories for pest species [30].

2.2. Data Collection

2.2.1. Climate Data

We followed the method of Zou et al. (2019) [31] to process and obtain historical and future climate data. We used the historical climate data (1987–2016) reported in Zou et al. (2019) [31] as our historical climate data, and for future climate data we selected the same scenario and Global Climate Models (GCMs) as described in this previous study, but divided climate data into different time periods (2021–2100, 2021–2030, 2031–2040, 2041–2050, 2051–2060, 2061–2070, 2071–2080, 2081–2090, and 2091–2100) in order to capture dynamic changes in the potential distribution of D. ponderosae under different climate scenarios. Specific details of the climate data can be found in Zou et al. (2019) [31].

2.2.2. Known Distribution of D. ponderosae and Host Plants

We obtained the current global distribution of D. ponderosae mainly from existing literature regarding this pest [30,32,33,34,35], the European and Mediterranean Plant Protection Organization (EPPO) [36], and the Global Biodiversity Information Facility (GBIF) database [37]. The known distribution map covers three countries (Canada, the USA, and Mexico). In Canada, D. ponderosae is mainly distributed in the southern provinces including British Columbia, Alberta, and Saskatchewan. In the USA, the species is mainly located in the western states including Washington, Oregon, California, Idaho, Nevada, Utah, and Wyoming. The distribution of D. ponderosae in Mexico covers the entire country.
Various Pinus spp. are host plants of D. ponderosae, and all pine species in western North America are believed to be suitable hosts for this beetle, including lodgepole pine (Pinus contorta Dougl. ex Loud var. latifolia Engelm), ponderosa pine (P. ponderosa Dougl. ex Laws.), western white pine (P. monticola Douglas ex D. Don), eastern white pine (P. strobus L.), and some exotic pines [4,5,12,35]. Therefore, we treated all species of Pinus as possible host plants, for which the distribution is worldwide, including most areas in North America, Europe, Asia, southern areas of South America and Africa, and Oceania. The actual distribution records were obtained from the Global Biodiversity Information Facility (GBIF) database [38] and shown with green dots in Figure 1.

2.3. Research Methods

2.3.1. Parameter Fitting

Parameters for D. ponderosae

CLIMEX indices are grouped into stress-related parameters and growth-related parameters. Generally, the parameters are determined by referring to the biological characteristics of the pests and the templates of the software. The combined use of manual adjustment of parameters and semi-automatic parameter fitting procedure may avoid the error of subjectivity [28].
Semi-automatic parameter fitting involved a number of steps. First, we created the reference file according to the known distribution of D. ponderosae. We then set an initial set of parameter values and accurate ranges that could be fitted by the semi-automatic parameter fitting procedure (see Appendix A, Table A1). Moreover, default GA operating characteristics were employed, with a parameter set population of 100, a crossover rate of 0.75, and a mutation rate of 0.1, and the model was applied for 250 generations. Eventually, the software derived the best fitting parameters with a fitness value of 55.55, as listed in Table A1 in Appendix A.
Manual adjustment of stress-related parameters was based on the results of semi-automatic parameter fitting, and we adopted all stress-related parameters except cold stress accumulation rate (THCS), heat stress threshold (TTHS), and dry stress accumulation rate (HDS). We adjusted THCS to −0.1 week−1 to fit the northern boundary of the known distribution, and adjusted THHS to 42 °C to fit the tropical desert area known to be suitable for D. ponderosae in northern Mexico, with reference to the reports of Patterson (1930) and Sanfranyik et al. (1999) [39,40]. We then adjusted HDS to −0.005 week−1 with reference to typical semi-arid conditions.
Manual adjustment of temperature indices was performed by setting the minimum development temperature threshold (DV0) to 5 °C, in line with results from Reid et al. (1970) who stated that the lowest temperature for the development of D. ponderosae is 5 °C [41]. The lower optimum temperature (DV1) and the upper optimum temperature (DV2) were set to 18 and 25 °C, respectively. Because Bentz et al. (1991) found that the optimum developmental temperatures for all life stages of D. ponderosae are between 23 and 25 °C, and the optimum temperature for egg hatching is between 20 and 25.6 °C [42], we adjusted the lower temperature to 18 °C to fit the distribution in areas bordering southern Canada and Mexico. According to experimental results, D. ponderosae becomes negatively phototactic at temperatures above 35 °C [43], and flight ability is severely restricted above 38 °C [44], hence we set the maximum developmental temperature threshold (DV3) to 38 °C. The annual heat sum for population restriction (PDD) was set at 833 degree-days because some studies reported that D. ponderosae requires more than 833 degree-days to complete the life cycle within a single year (i.e., to be univoltine) [32,45,46,47].
Manual adjustment of moisture indices was performed according to Creeden et al. (2014) since we know that outbreaks of D. ponderosae are highly correlated with a dry climate [48]. Additionally, D. ponderosae is distributed in tropical desert areas (e.g., California and New Mexico), hence moisture-related indices were set low; the lower soil moisture threshold (SM0) was 0.05, the lower optimal soil moisture threshold (SM1) was 0.1, and the upper optimal soil moisture threshold (SM2) was 0.2. Furthermore, the upper soil moisture threshold (SM3) was set to 1.5, allowing D. ponderosae to colonize the southwestern area of British Columbia. The final parameters are listed in Table A2 in the Appendix A.

Parameters for Host Plants

Pinus spp. are among the most widely distributed plant species in the world, owing to their wide niche range. It is reported that pines can tolerate low temperatures of −60 °C and high temperatures of 50 °C, and they lack a strict demand for soil, while most species prefer a well-drained soil-flourishing in sandy conditions [49]. Additionally, the leaves of pines have the structural characteristics of xerophytes, allowing them to adapt to long periods of drought and cold. Kishchenko (2004) [50] investigated the effects of climatic factors on the growth of pines and found that air temperature and the average above-zero temperature for shoot growth varies greatly across pine species, hence it is essential to set wide parameter ranges when considering trends in whole Pinus spp. The templates for, for semi-arid zones and for temperate zones, were selected to be the initial references for parameters, but the temperature indexes and moisture indexes were adjusted to match their wide niche range and the known distribution. Besides, it is known that the cold resistance of content in Chinese red pine (P. tabuliformis) is high, thus we set the cold stress parameters referring to the template of P. tabuliformis and extended the range to coordinate some species in colder regions such as Eurasian pine (P. sylvestris) [51]. Furthermore, most pines are photophilic and require sufficient daylength to grow, hence we introduced the light index (LI) parameter and set them to 10 and 15, respectively, referring to the parameters for P. tabuliformis. The final parameters for pines are shown in Table A2 in Appendix A and the predicted results were in good consistency with the known distribution.

Classification of Ecoclimatic Index (EI) Values

The EI values give an overall measure of the suitability of a pest to given locations, and they are generally classified into groups to describe the favorability more specifically, in which the favorability actually levels the continuous model’s predictions of how environmental characteristics are appropriate in study areas, then determines which actually favor the species presence [52]. The classification standard should be defined in accordance with actual occurrence severities in different regions for actual species. For D. ponderosae, it was reported to have seriously devastated the pine forests in British Columbia and Alberta of Canada, and in western American areas [53,54], where the EI values range from 20 to 48, thus it is reasonable to set the cutoff value to 20 for very favorable regions. As the records for occurrence areas with low level are rare for classification, we referred to Sutherst (2003) [55], who indicated that EI <10 shows that a location is marginal for a given species, while EI is equal to 0 indicating that the location is not favorable for the long-term survival, then we set the cutoff values dividing favorable regions and marginal regions to 10, and the cutoff dividing marginal regions and unfavorable regions to 0, respectively. Finally, EI values were grouped into four classes: unfavorable (EI = 0), marginal (0 < EI ≤ 10), favorable (10 < EI ≤ 20), and very favorable (EI ≥ 20).

2.3.2. Parameter Verification

The final parameters were verified to obtain reasonable prediction results. Firstly, the modeled potential global distribution under historical climate condition matched the known distributions very well, all occurrence records of D. ponderosae worldwide were within the suitable range in the model. Then, the condition of temperature and humidity in the predicted distribution were similar to the climate of western North America, the native range of the species. In addition, the environmental condition of climate-unsuitable regions presented significant disadvantages to D. ponderosae. The high temperature in southern South America and southern Africa, and the low temperature in northern North America and northern Asia both make it hard for D. ponderosae to survive. The reason for the unsuitable regions in the coastal zone is the excessive wet pressure, for D. ponderosae prefers relatively dry conditions [48]. Furthermore, the accumulated temperatures in the climate-suitable regions all meet the development demand of D. ponderosae, which is reported to complete life cycle in one to two years [56].

2.3.3. Analysis of Results

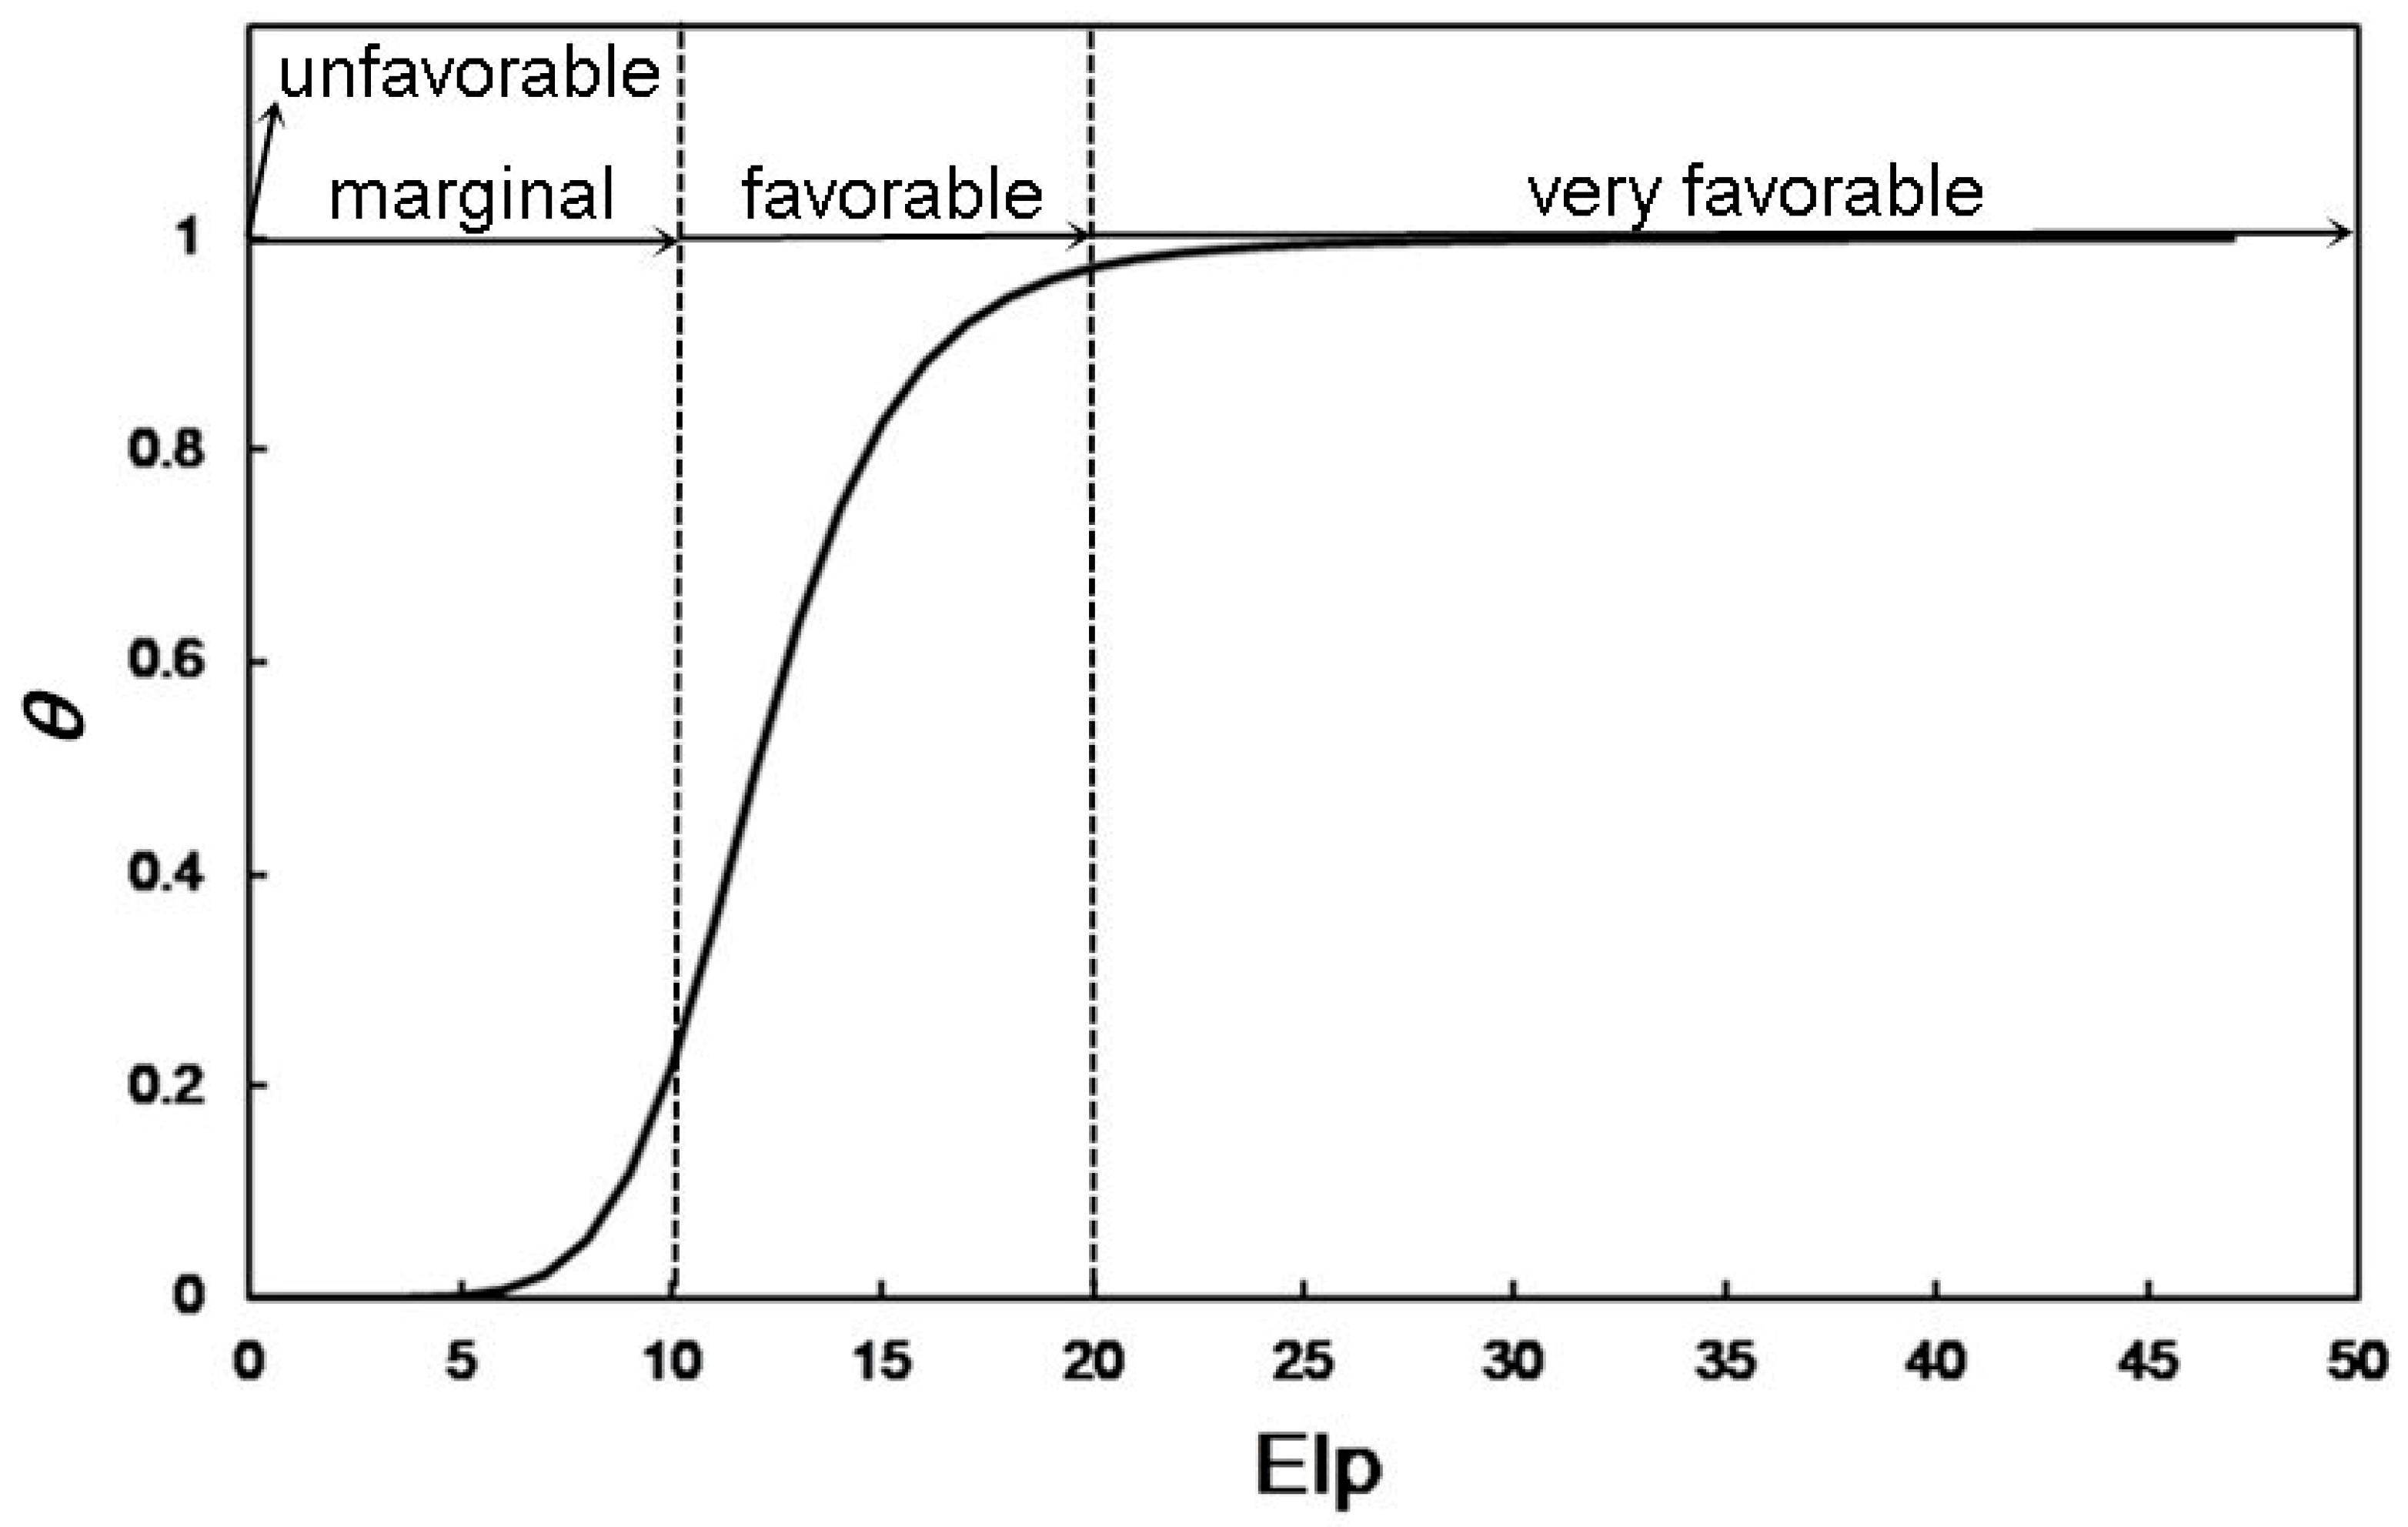
Since D. ponderosae feed only on pines, it is essential to consider the distribution of pines when predicting that of the insect. Therefore, we applied the method of Berzitis et al. (2014) [57] and used EI values for pines ( E I P ) to calculate an index of host plant availability (θ), which was then multiplied by the original EI value for D. ponderosae ( E I D ) to obtain a new measure of suitability for D. ponderosae ( E I D ), incorporating both climate and host plant availability. The θ value was calculated based on the sigmoidal function.
θ = ( E I p h ) q ( 1 +   E I p h ) q ,
in which q indicates how steeply the curve rises, and h determines the value of E I P at which h equals 0.5. The value of q and h were set at 7 and 12, respectively, to ensure a low value of θ when an area is unsuitable for pine growth ( E I D < 10) and a high value (up to 1) of θ when an area is favorable or highly favorable for pine growth ( E I D ≥ 10; Figure 2). Using this approach, we acquired EI values for D. ponderosae ( E I D ) that superimposed the distribution of host plants under corresponding historical and future climate conditions.
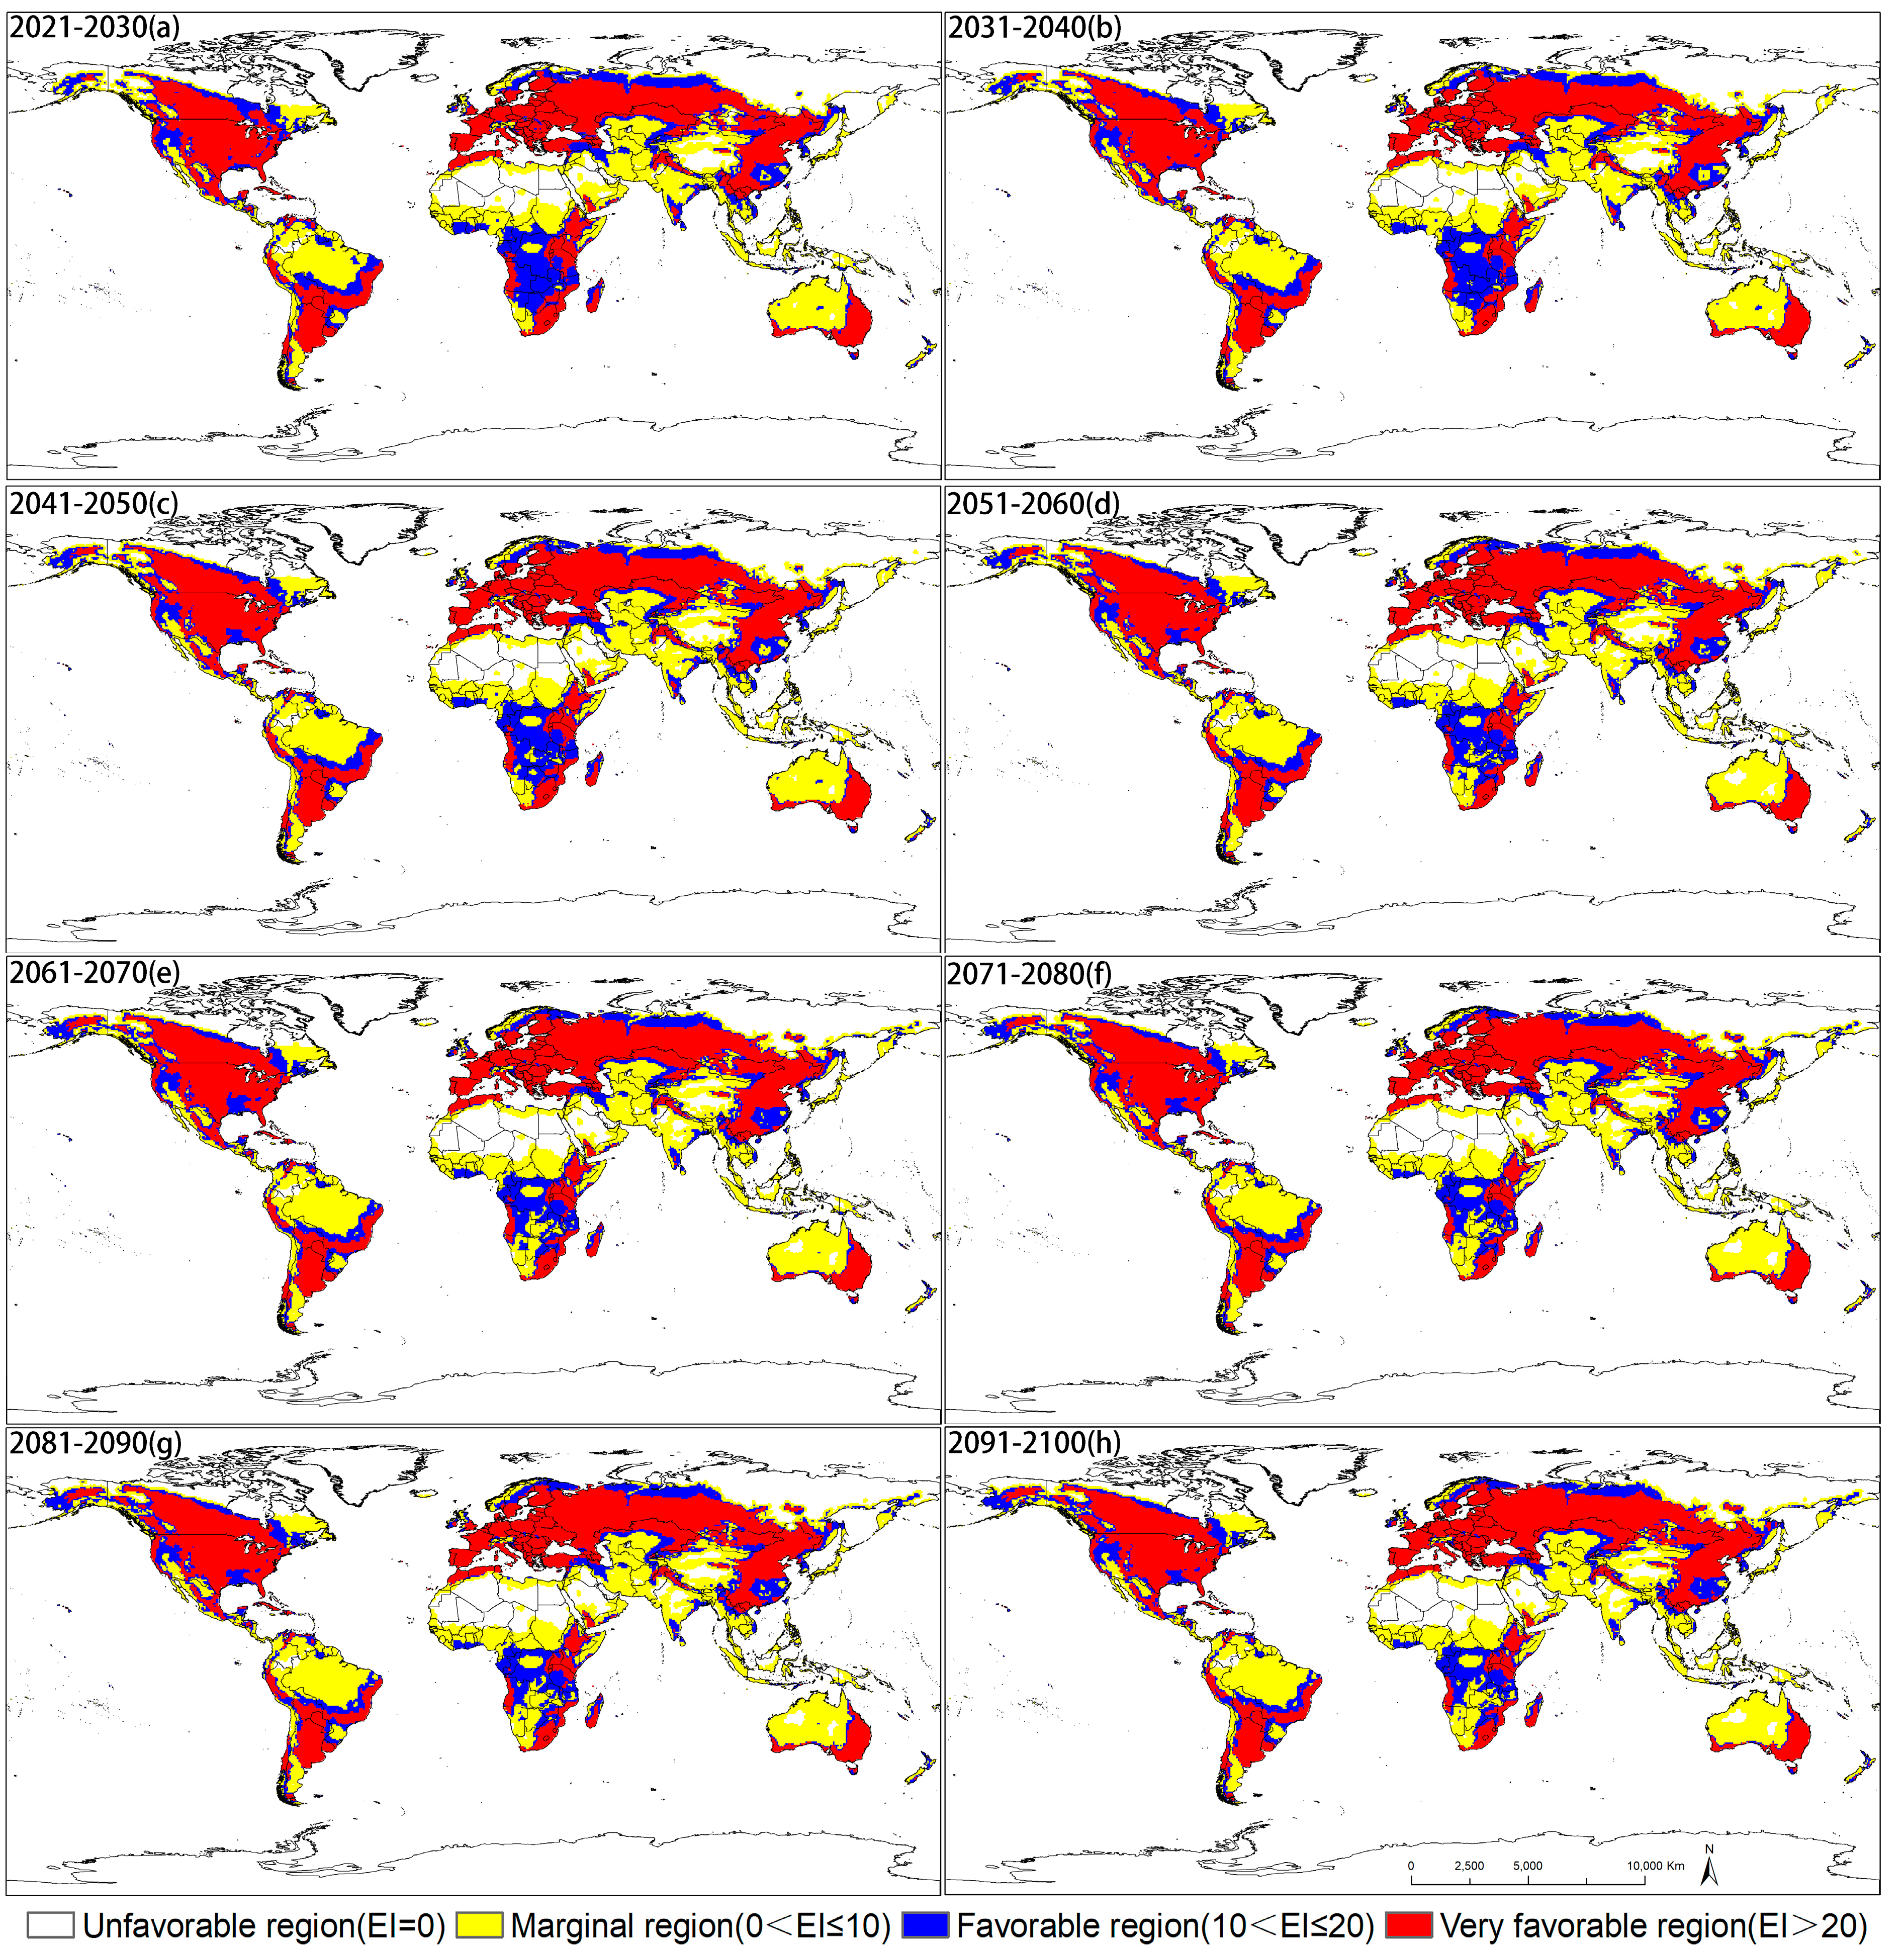
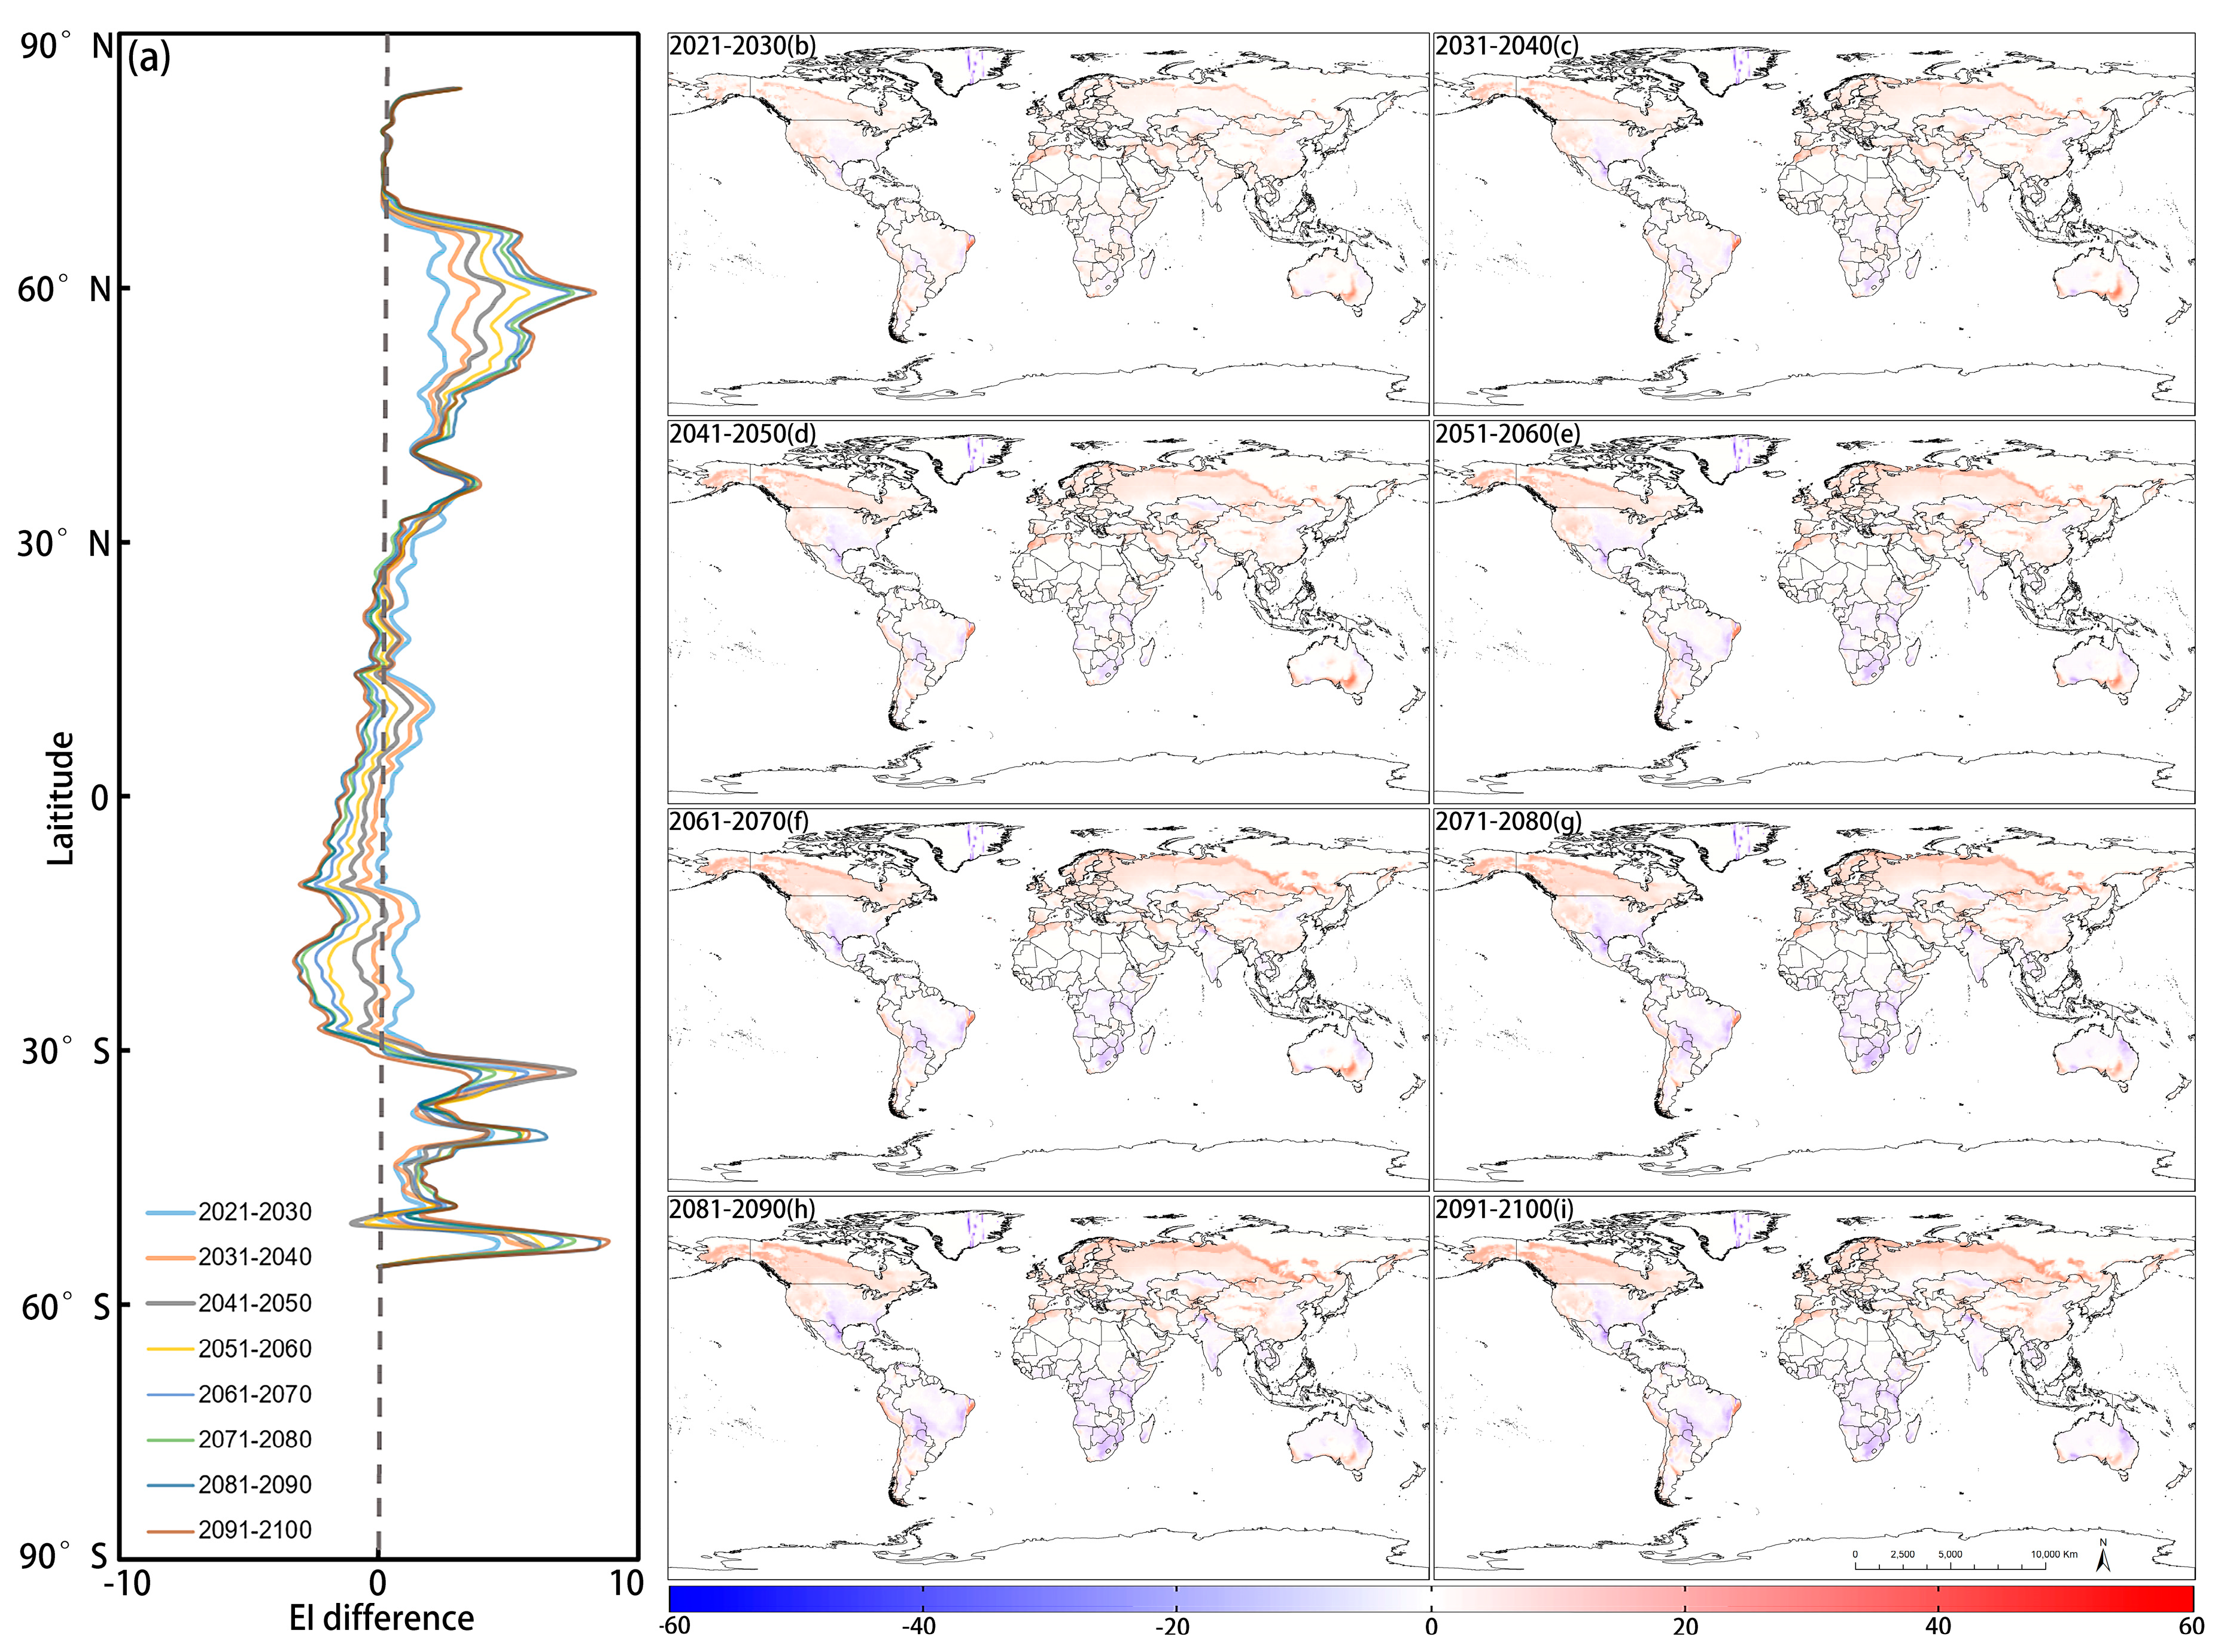
After superimposition of EI values onto host plants, EI values for D. ponderosae were imported into ArcGIS software, and the distribution maps of insects under historical (1987–2016) and future (each decade from 2021 to 2100) climatic conditions were obtained using the inverse distance weighted (IDW) function (Figure 3 and Figure 4), and we analyzed the area proportions of different climate-suitable regions in each decade (Figure 5). Additionally, we compared differences between each decade using historical data and drew maps (Figure 6) from which we could assess the impacts of climate change on the potential distribution. We then applied the methods proposed by Ge et al. (2019) [58] and obtained curves showing EI differences varying by latitude (Figure 6).
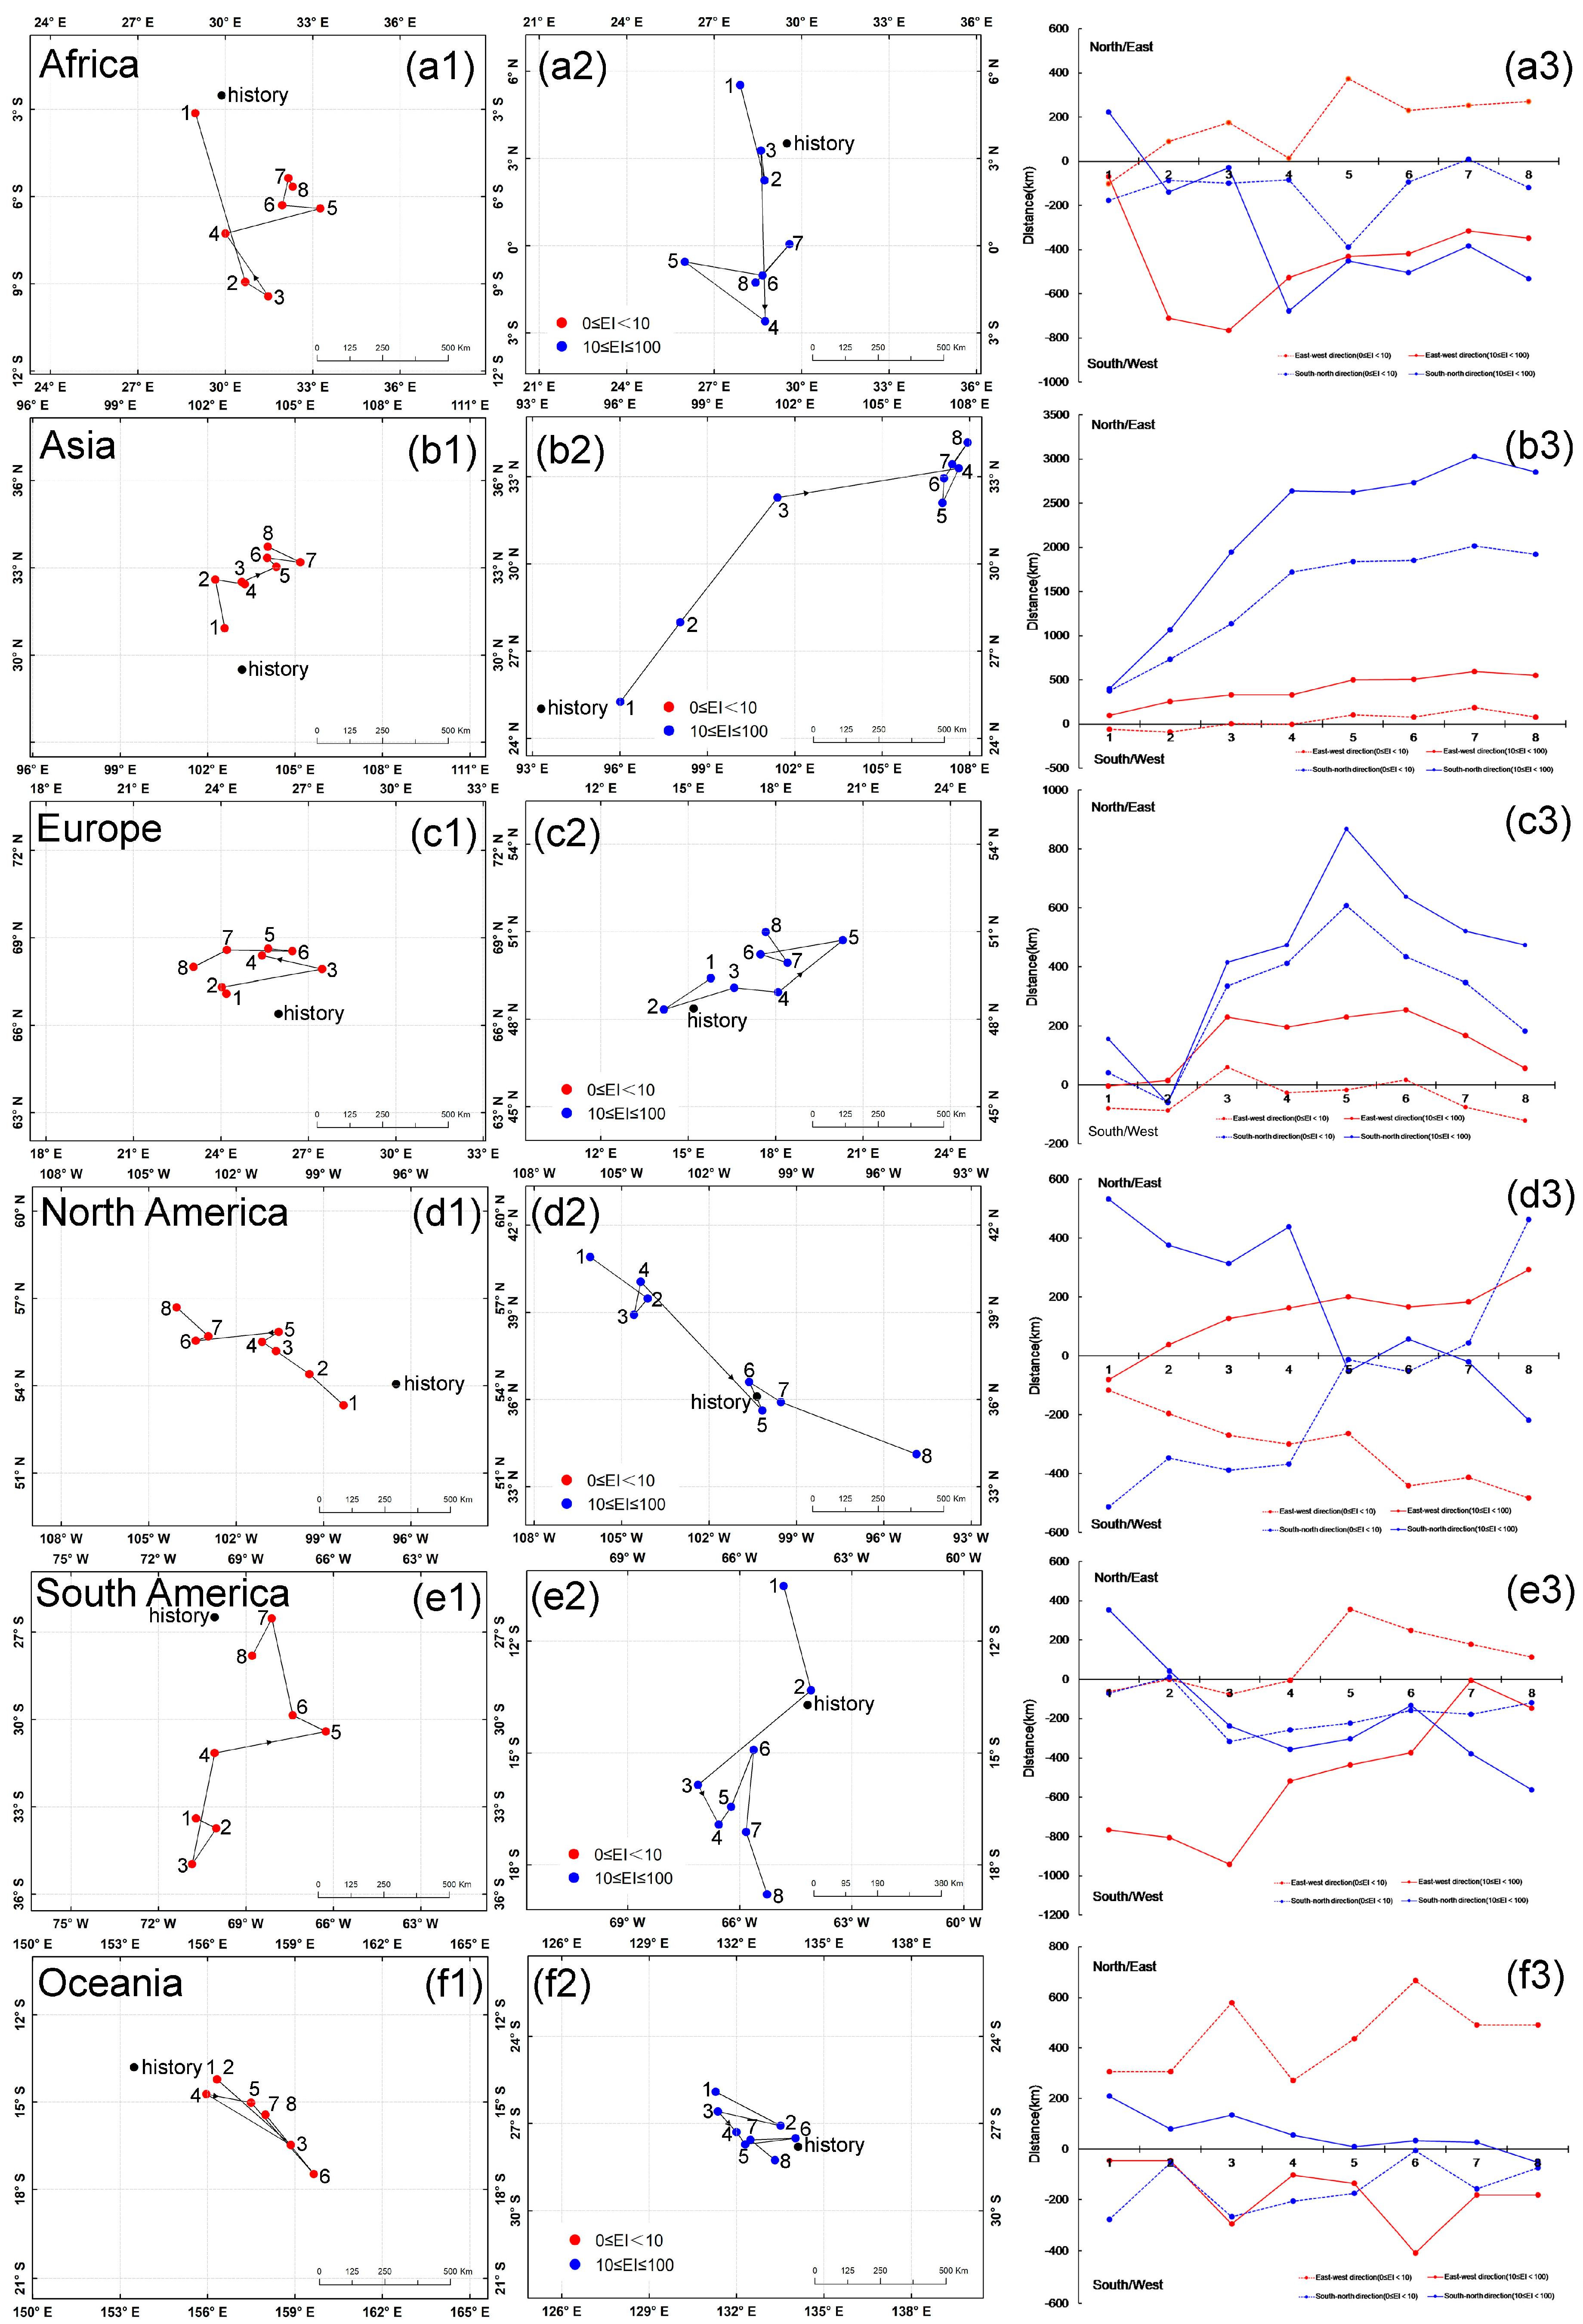
To capture the location shifts of habitats for D. ponderosae more accurately, we divided each continent into separate polygons based on 0 ≤ EI < 10 (unsuitable regions) and 10 ≤ EI ≤ 100 (suitable regions). We then determined the central point in each polygon using the ‘Mean Center’ function of ArcGIS software, the shift of which represents the corresponding habitat shift. In addition to shifts paths, we measured the relative shift distances in two cardinal directions (east–west and north–south) between ‘future’ points and historical central points, as shown in Figure 7.

3. Results

3.1. Potential Distribution of D. ponderosae under Historical Climate Conditions

The projected potential distribution of D. ponderosae under historical climate conditions (1987–2016) and the known global occurrence records of D. ponderosae are shown in Figure 3. The predicted potential distribution covers all currently known distribution areas and coincides with the severity of occurrence, confirming that our model fits the actual occurrence records with a high degree of accuracy.
The percentages of very favorable regions, favorable regions, and marginal regions accounting for the global land area are projected to be 27.96%, 16.80%, and 28.64%, respectively. The land between 67° N and 55° S is predicted to be climatically suitable for D. ponderosae, except for northern Africa, central and western Oceania, and western China, which are marginal or unfavorable for D. ponderosae under historical climate conditions.

3.2. Potential Distribution of D. ponderosae under Future Climate Conditions

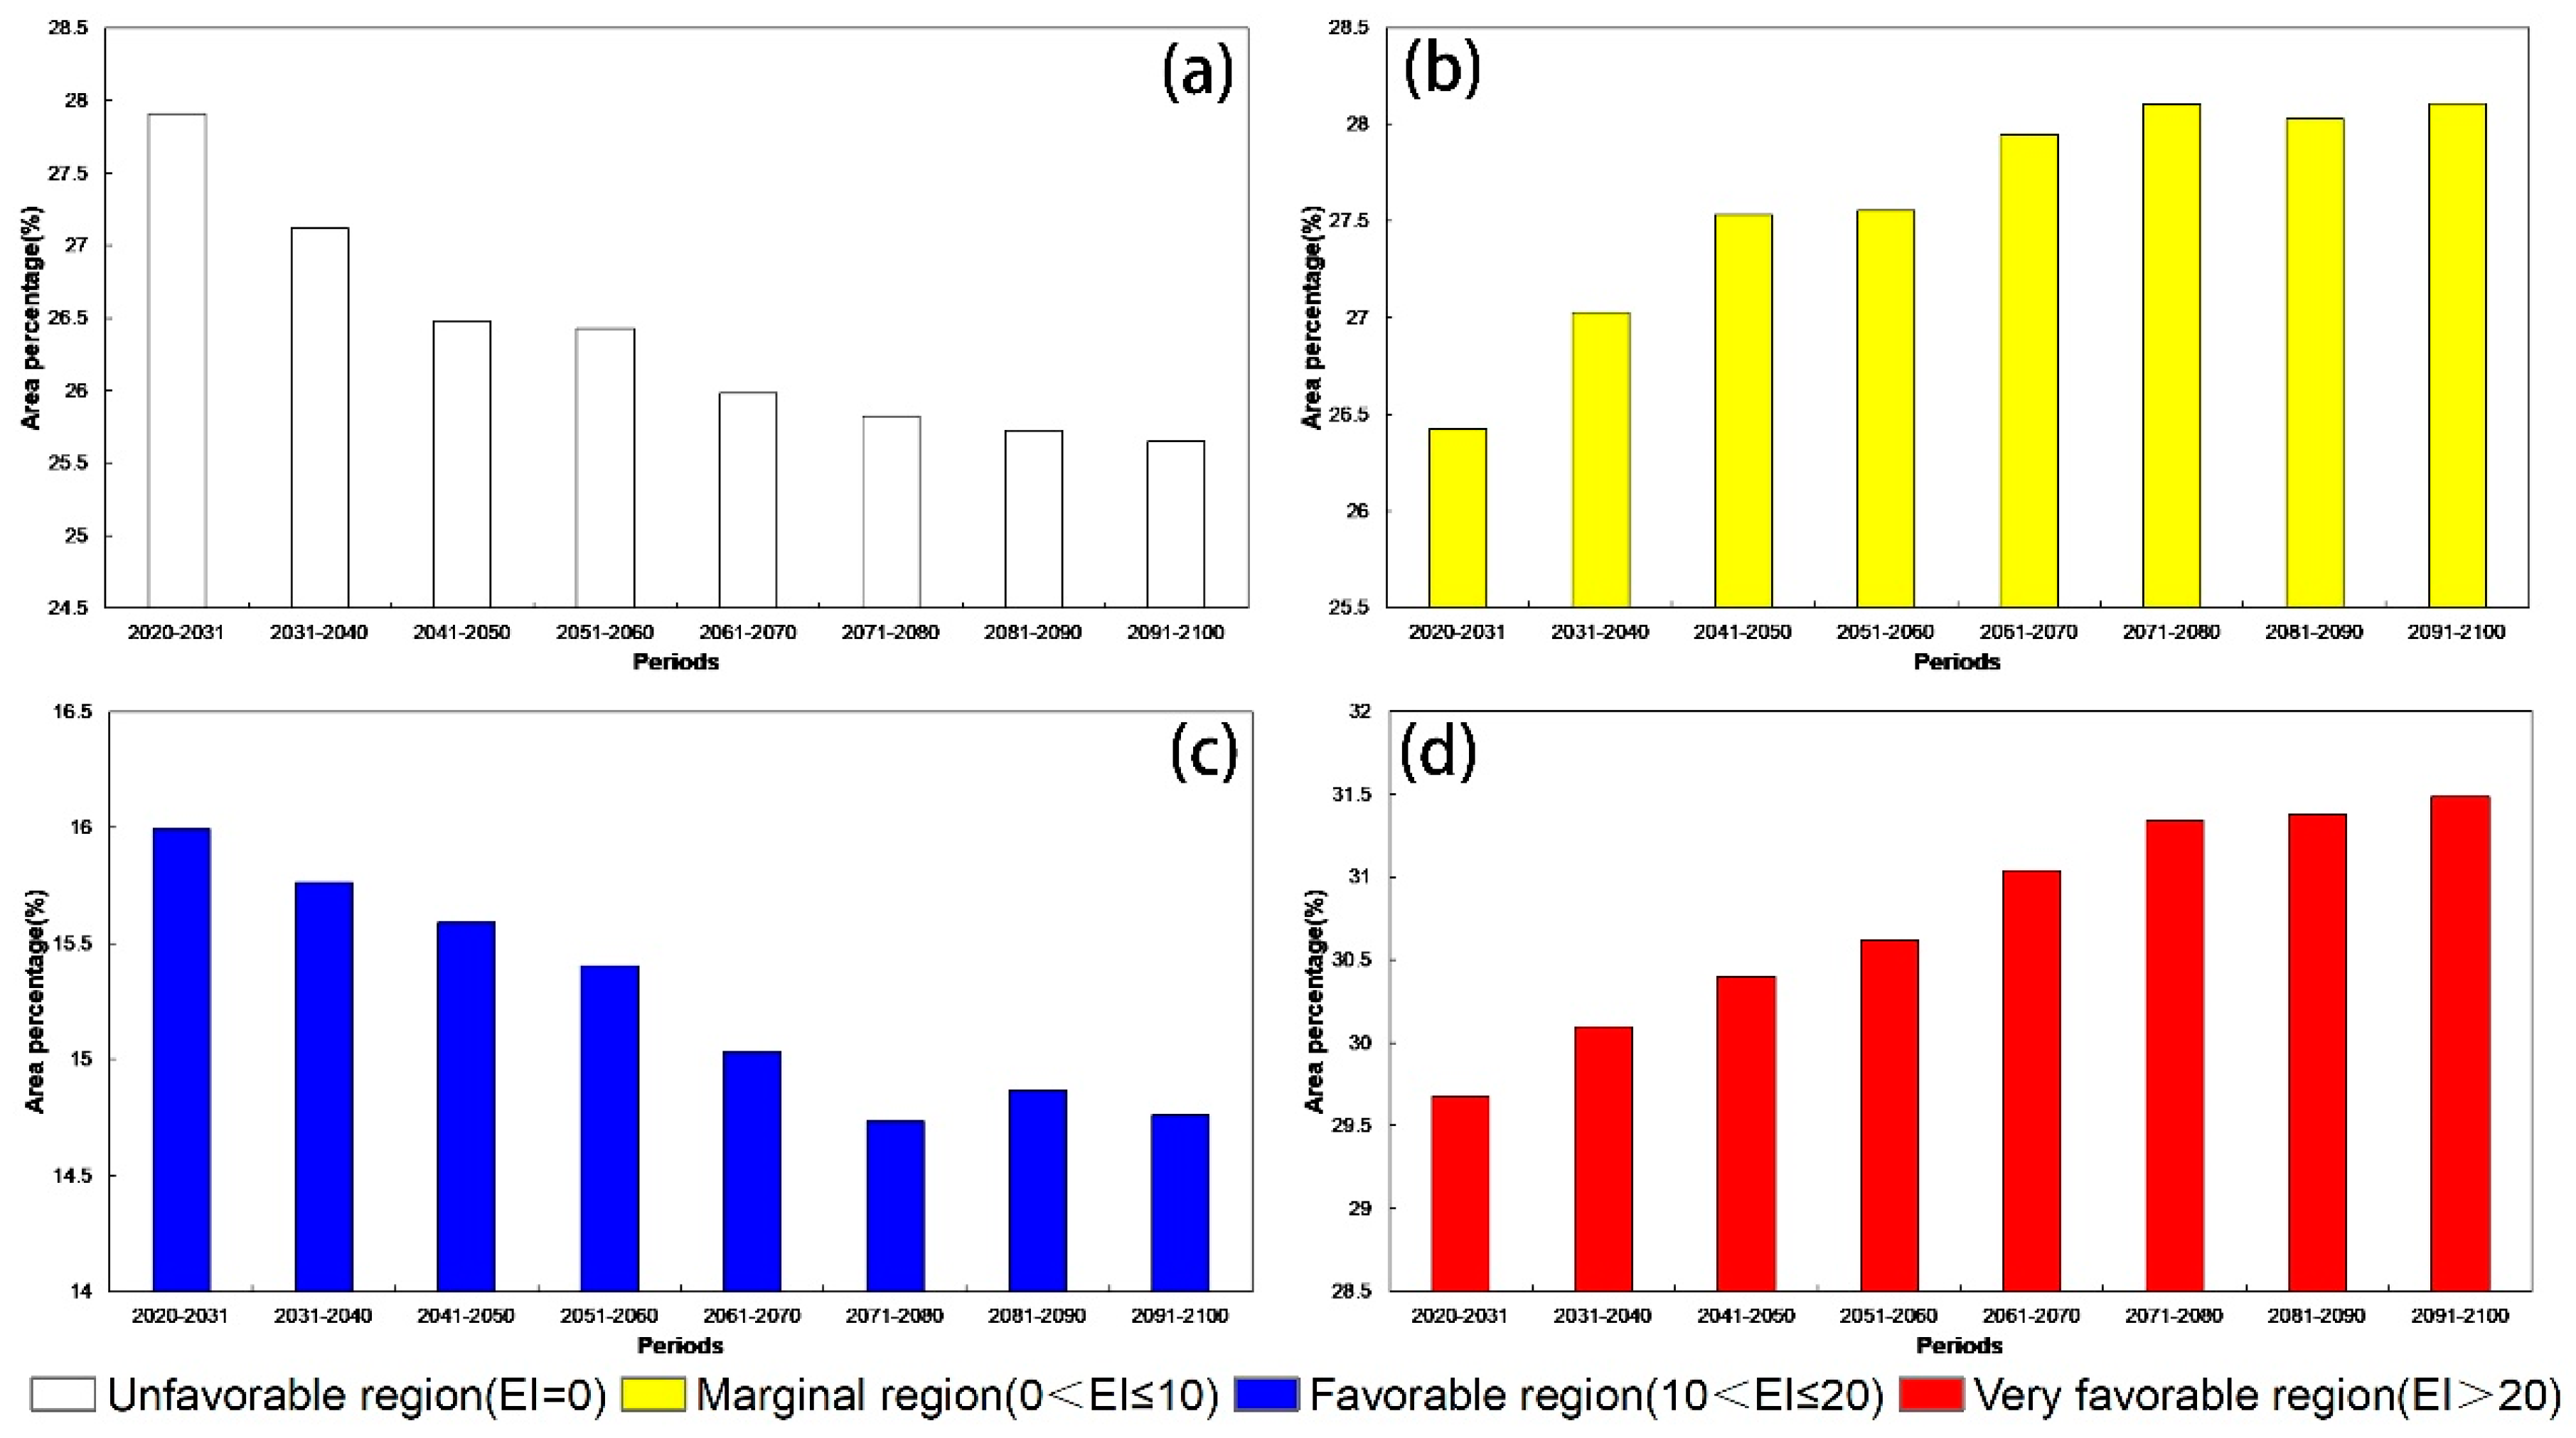
The projected potential future distributions of D. ponderosae in each decade (2021–2100) are shown in Figure 4, overlaid onto hosts distributions. The area proportions of different climate-suitable regions in each decade are shown in Figure 5. In general, the potential future distributions of D. ponderosae expand considerably following global warming, with extensive northward expansion in habitats in the northern hemisphere, while tropical and subtropical habitats tend to shrink. Overall, the potential future distribution is predicted to continue increasing from 2021 to 2100, mainly due to the areas increase in favorable and marginal regions over the decades, which are predicted to increase 1.87% and 2.14%, respectively. However, the area covered by favorable regions will likely decrease by 1.18% in total.
Changes in climatic suitability are shown in Figure 6. EI differences in mid-latitude regions (30–60° S and 30–60° N) are positive and peak at ~60° N, suggesting that climate change will have positive impacts on D. ponderosae, and the impacts will be greatest around 60° N. Additionally, differences in EI between each decade in historical data tend to increase over time, suggesting that the impact of climate change on D. ponderosae suitability may also increase over time. Differences in EI for each grid between different decades and historical climate conditions (Figure 6b–i) show an apparent deepening trend with the progression of time, and most regions in the northern hemisphere become redder, suggesting that habitats become more climate-suitable for D. ponderosae, while most regions in the southern hemisphere become bluer, indicating a decline in climate suitability for D. ponderosae in these regions. In Africa, the suitability of southern regions decreases in a southerly direction, and northern areas in Algeria and Morocco become more suitable in future, leaving the large area in-between mostly unchanged. In Asia, most habitats tend to become more suitable for D. ponderosae, especially in Russia and western China, where changes are greatest. By contrast, the suitability of habitats in northeastern Kazakhstan, India, and coastal states of southern Asia tend to decrease. In Europe, habitats broadly become more suitable, especially in the north. In North America, changes in Canada, Alaska, and western areas are positive, while negative changes are predicted for central and southern regions. In South America, most areas tend to become more suitable, except in the east and west near the sea. In Oceania, positive changes occur in southeastern habitats, and negative changes occur in northeastern and southwestern habitats, while other areas remain unchanged. Overall, the climate suitability of temperate habitats tends to increase, while that of tropical habitats tends to decrease.

3.3. Central Point Shifts in Potential Distributions under Future Climate Conditions

Shifts in the central points of climate-unsuitable regions (0 ≤ EI < 10, red points) and climate-suitable regions (10 ≤ EI ≤ 100, blue points) over future decades (2021–2100) in each continent are shown in Figure 7, and the differences of directions and gradients of shifts among all continents are obvious. Regarding unsuitable regions (0 ≤ EI < 10), the directions of central point shifts are relatively stable in Asia (Figure 7b1), North America (Figure 7d1), and South America (Figure 7e1), and move toward the northeast in Asia, the northwest in North America, and the northeast in South America. By contrast, the mean points in Africa (Figure 7a1), Europe (Figure 7c1), and Oceania (Figure 7f1) shift back and forth over small ranges and display no obvious regular trend. Analogously, in suitable regions (10 ≤ EI ≤ 100), relatively regular shifts occur in Africa (Figure 7a2), Asia (Figure 7b2), North America (Figure 7d2), and South America (Figure 7e2), and movement is toward the south in Africa, the northeast in Asia, the southeast in North America, and the south in South America. Regarding Europe (Figure 7c2) and Oceania (Figure 7f2), the central points undergo reciprocal shifts around historical points but not in any particular directions. From these results, we can conclude that the shift directions of central points in Asia, North America, and South America are highly correlated with climate change, while those in other continents are changeable and unpredictable.
Figure 7 (a3–f3) shows the relative shift distances of central points in two directions (north–south and east–west) for each of the eight future decades compared with the historical central point (1987–2016). From the curves, we see that the largest range of central point shifts is in Asia (Figure 7b3), followed by North America (Figure 7d3), South America (Figure 7e3), and Africa (Figure 7a3), while the smallest range of shifts occurs in Oceania (Figure 7f3), reflecting differences in sensitivity to climate change in different continents. In addition, the shift distance of suitable regions (10 ≤ EI ≤ 100) in all continents is larger than that of unsuitable regions (0 ≤ EI < 10). Except for North America, shift distances of suitable regions in the north–south direction are consistently larger than those in the east–west direction (the shift distance in the north–south direction in North America is slightly smaller).

4. Discussion

Our predictions indicated that suitable regions in Canada were mainly distributed in the central and southern regions of the country, which were consistent with previous research by Carroll et al. (2006) and Sanfranyik et al. (2010) [9,29]. However, the distribution range for climate-suitable regions in our study appears to be wider, for we predicted the northern and western border to be further north and west, especially for very favorable regions, possibly due to differences in models and climate data used for simulation. Regarding applied SDMs, both previous studies employed the Sanfranyik model, which only considers the minimum requirements for temperature and precipitation to support D. ponderosae survival, neglecting the adverse effects of high temperatures and excessive precipitation. Additionally, the climate data we used to simulate future conditions were extracted from multi-model ensemble mean climate datasets based on CMIP5 (available at http://pcmdi9.llnl.gov/search/esgf-llnl), while the climate data in the previous studies were based on the CGCM1 general circulation model [59]. Thus, differences in the source of meteorological data may also contribute to differences in the results.
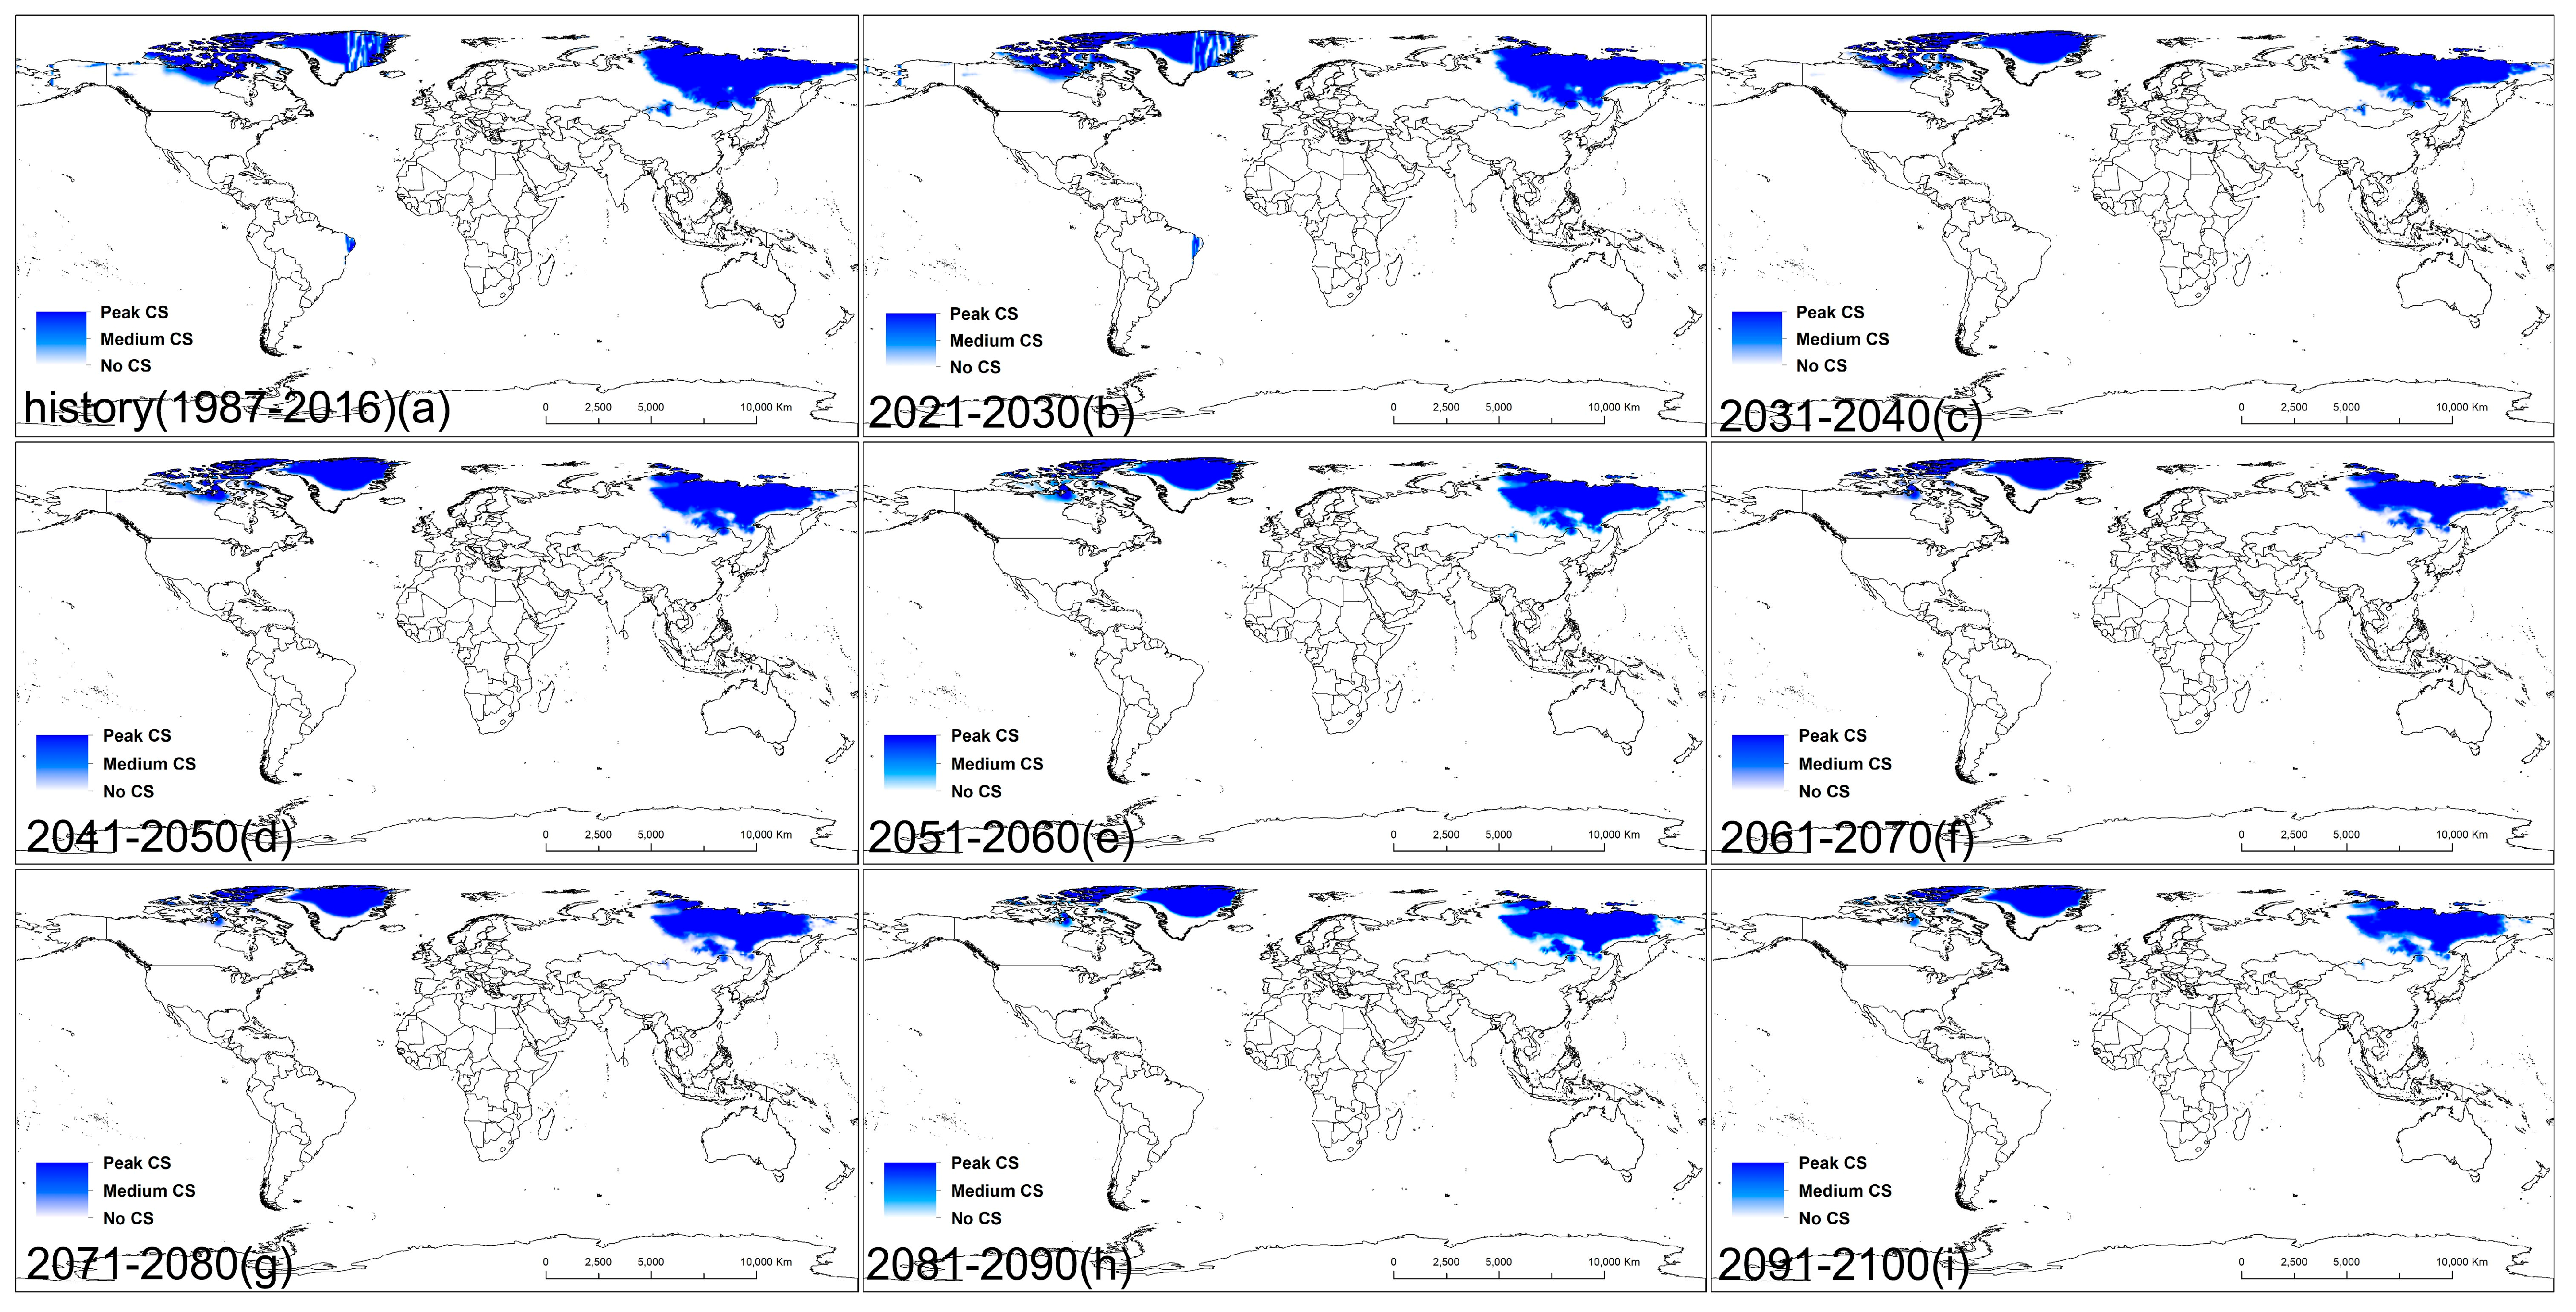
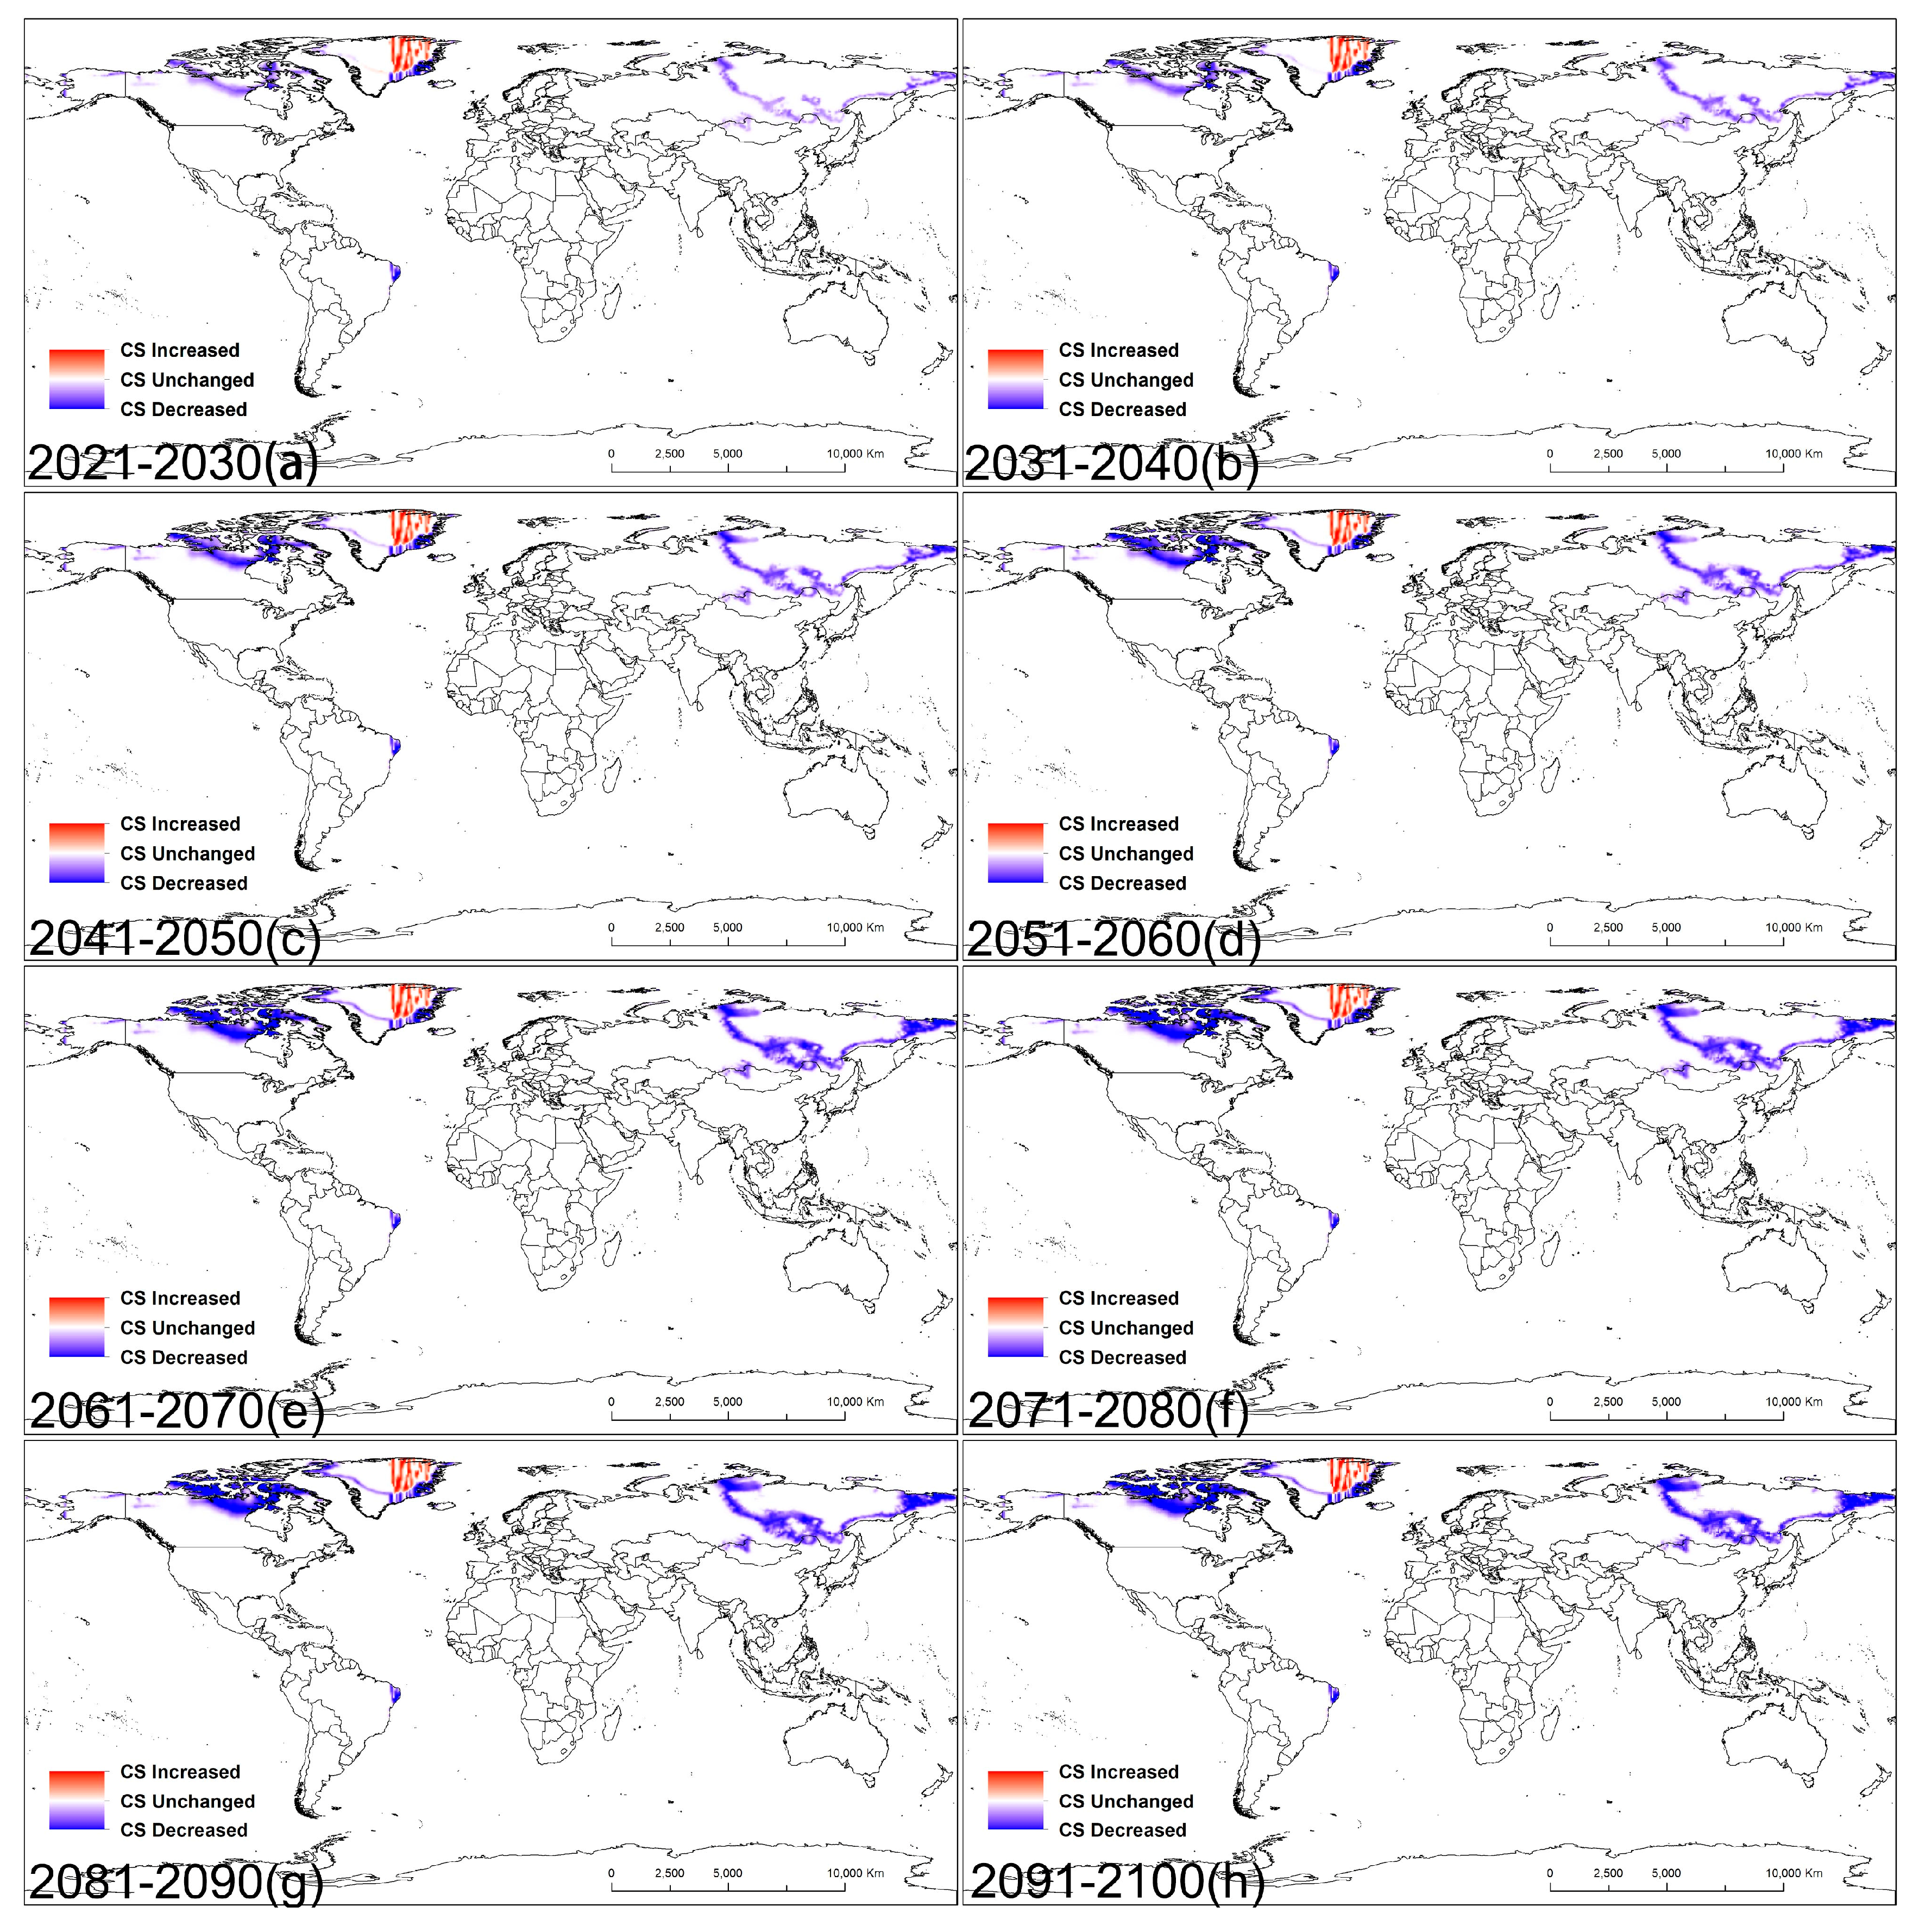
As a cold-intolerant pest [60], cold temperatures in winter are key constrains limiting the distribution of D. ponderosae, and overwintering success is critical for sustained pest outbreaks [61,62,63]. In our study, cold stress (CS) mainly occurred in northern North America (Northwest Territories and Nunavut in Canada), Greenland, and northeastern Asia (Mongolia and Russia). Accompanying climate change, the boundary for CS moves northward, with latitude increasing by 3°–8° in different regions, and the area for CS remains contraction constantly, especially in Canada and Russia (see Appendix B, Figure A1). With reduced CS limitations in the future, D. ponderosae will be more likely to cause outbreaks in severe cold regions and expand its range into higher latitudes (see Appendix B, Figure A2). We should therefore pay attention to the potential threat of climate change to ecological security in severe cold regions.
Our investigation of the distribution shift paths of D. ponderosae considered both unsuitable and suitable regions in each continent as homogeneous polygons to generate central points, ignoring differences in EI among the same polygons. The shift direction varied between continents, providing guidance for more accurate outbreak prediction of this pest. Shift distances were largest in Asia and smallest in Oceania, possibly due to the areas covered by these continents, since larger spans in latitude and longitude are more likely to be affected by changes of temperature and moisture. Moreover, the distance in the north–south direction was almost always larger than that in the east–west direction, indicating that temperature plays a major role in the distribution and expansion of D. ponderosae, consistent with the results of Carroll et al. (2006) [29] mentioned above. In further studies, we will consider assigning the corresponding weighting to different regions of the distribution according to EI values to generate heterogeneous polygons that better reflect suitability and to obtain more precise central points to allow complex image processing and calculations, although this approach may yield unexpected errors.
Our study provides theoretical guidance for early-warning intervention and risk assessment. The project results indicate that under both historical and future climate conditions, climate-suitable areas were not only distributed in North America but spread across all continents (except Antarctica), including northern South America, most areas of Europe, northwest and southeast Asia, southeast Africa, and southeast Oceania (Figure 3), where outbreaks of D. ponderosae have not yet been recorded. This may alert governments and agencies in these regions to the high risk of D. ponderosae invasion, and encourage strengthening quarantine and defense measures to prevent the spread of the pest in the international trade. Despite the fact that the project results declared the decreasing trend of climate suitability in large regions of North America, the risk of a massive outbreak of the pest still exists in the near future, and efforts for controlling and prevention should be further strengthened. Moreover, the predicted results under future climate conditions show that the potential distribution may change with climate change (Figure 4), with favorable regions expanding in range toward higher latitude, especially in the northern hemisphere. Therefore, relevant defense measures and responses to the possible harm caused by D. ponderosae invasion should be taken in advance.
SDMs are based on the assumption that species are at equilibrium with their environments, but it may involve species with unrepresentative records of new conditions and prediction to novel environments when using in non-equilibrium settings (e.g., invasions and climate change). Several problems with SDMs have been identified, including different (combinations of) environmental factors that may limit distributions or biotic interactions that may change substantially in the new context. Besides, genetic variability, phenotypic plasticity, and evolutionary changes may also alter the results [64,65,66]. Nevertheless, the use of correlative models currently remains one of few practical approaches for predicting or hindcasting distributions [17]. The CLIMEX model used in the present study aims to capture the core features of species climatic requirements from minimal observations, and results are known to be relatively accurate and applied widely to explore the distribution of plants, animals, and microorganisms, especially in the absence of sufficient experimental data [28]. However, the model may have some restrictions because it only uses a single set of parameters for all regions and ignores any other non-climatic constraints that may alter the distribution, such as topography, predators, and human activities. For D. ponderosae, its developmental rate in southern populations (i.e., warmer habitats) was slower than that in more northern populations (i.e., cooler habitats), which may be an evolutionary adaptation to ensure seasonality, and it may lead to a significant underestimation in potential range expansion of the northern limits of this beetle because the actual rate of range expansion may be greater than predicted [67]. Furthermore, the insufficient occurrence data and incorrect parameter selection may also lead to some problems of the model [68]. When considering the effects of host trees, we identified all Pinus species as possible hosts of D. ponderosae conservatively, but actually they presented the difference in resistance of being attack to D. ponderosae. It is reported that Great Basin bristlecone and foxtail pines have relatively high levels of constitutive defenses which make them less vulnerable to climate-driven D. ponderosae range expansion relative to other high elevation pines [69,70]. Additionally, the defense of pines in recently invaded areas are predicted to be lower than in areas with longer-term D. ponderosae presence, for lacking targeted defense traits [71]. Therefore, it may be of great value to explore temporal and spatial changes in parameters and insect responses to different hosts to improve the accuracy of projections.

5. Conclusions

Climate change can significantly affect the potential distribution of D. ponderosae, and the impacts on the suitability of the pest will vary with latitude. With climate change, the suitability will increase in middle and high latitude regions and decrease in the low latitude regions, while the most sensitive regions to climate change located in the mid-latitude zone. Moreover, the shift directions and ranges of climate suitable regions under future condition will differ among continents, which is likely mainly affected by temperature. The projections of potential distribution can provide theoretical guidance for early-warning techniques and risk assessment, thus reducing the economic and ecological loss caused by the pest.

Author Contributions

Conceptualization, X.G. and S.Z.; data curation, Y.Z. (Yuting Zhou), Y.Z. (Ya Zou), S.G., and T.W.; formal analysis, Y.Z. (Yuting Zhou), Y.Z. (Ya Zou), and S.G.; funding acquisition, S.Z.; investigation, Y.Z. (Yuting Zhou); methodology, Y.Z. (Yuting Zhou), X.G., and S.Z.; project administration, X.G. and S.Z.; resources, T.W.; software, Y.Z. (Yuting Zhou); supervision, X.G. and S.Z.; validation, Y.Z. (Ya Zou) and S.G.; writing—original draft, Y.Z. (Yuting Zhou) and X.G.; writing—review and editing, X.G. and S.Z.

Funding

This research was funded by “the Fundamental Research Funds for the Central Universities” (No. 2016ZCQ07).

Conflicts of Interest

The authors declare no conflict of interest.

Appendix A

The appendix tables (Table A1 and Table A2) contain the detailed parameters ranges and values for Dendroctonus ponderosae and Pinus spp. used in CLIMEX software.
Table A1. Ranges and initial values for parameters included in the semi-automatic parameter fitting procedure.
Stress ParametersRangesInitial Parameter ValuesReasons and References
Cold stress threshold (TTCS; °C)−25 to −40−40Temperatures below −25 °C in the fall or −40 °C in the winter can kill the beetles [72]
Cold stress accumulation rate (THCS; week−1)−1 to −0.000001−0.01Based on temperate template
Heat stress threshold (TTHS; °C)39 to −4440.5Bark temperature above 43.33 °C may lead to death after an exposure of sufficient length, and the bark temperature of logs exposed to sunlight were about 4.44 °C higher than the surrounding air temperature [40].
Heat stress accumulation rate (THHS; week−1)0.000001 to 10.005Based on temperate template
Dry stress threshold (SMDS)0.000001 to −0.010.001Forest become susceptible to fatal attack by D. ponderosae during drought periods, so we referred to semi-arid template [73].
Dry stress accumulation rate (HDS; week−1)−1 to −0.000001−0.005Based on temperate template
Wet stress threshold (SMWS)1.5 to 32.5Based on temperate and desert templates for D. ponderosae primarily inhabiting temperate and tropical climatic conditions and surviving in a tropical desert climate
Wet stress accumulation rate (HWS; week−1)0.000001 to 0.010.002
Table A2. CLIMEX parameter values for Dendroctonus ponderosae and Pinus spp.
CLIMEX ParametersDendroctonus PonderosaePinus spp.
Semi-Automatic Parameter Fitting Procedure ResultsManual Adjusted Parameter ResultsFinal Parameters
Minimum development temperature threshold (DV0; °C) 550
Lower optimum temperature (DV1; °C) 181810
Upper optimum temperature (DV2;°C) 252530
Maximum development temperature threshold (DV3; °C) 383845
Effective accumulated temperature (PDD; DD) 8338330
Lower moisture threshold (SM0) 0.050.050.05
Upper optimal soil moisture threshold (SM1) 0.10.10.1
Upper optima soil moisture threshold (SM2) 0.20.20.8
Limiting high soil moisture threshold (SM3) 1.51.52
Cold stress threshold (TTCS; °C)−30.729 −30.729−50
Cold stress accumulation rate (THCS; week−1)−0.000001−0.1−0.1−0.1
Heat stress threshold (TTHS; °C)38424250
Heat stress accumulation rate (THHS; week−1)0.795 0.7950.1
Dry stress threshold (SMDS)0.00993 0.009930.01
Dry stress accumulation rate (HDS; week−1)−0.962−0.005−0.005−0.005
Wet stress threshold (SMWS)1.5 1.52.5
Wet stress accumulation rate (HWS; week−1)0.00829 0.008290.1
Daylength at growth rate of zero (LT1) 10
Daylength at maximum growth rate (LT0) 15

Appendix B

The appendix figures (Figure A1 and Figure A2) expressed the distribution and changes of cold stress (CS) with time progress.
Figure A1. Distribution of cold stress (CS) for D. ponderosae under historical (1987–2016) and future (2021–2100) climate conditions. (a) Historical and (bi) future data. The intensity of the blue color indicates the degree of CS (deep blue represents peak CS, white represents no CS).
Forests 10 00860 g0a1
Figure A2. Climate change impacts on cold stress (CS) in D. ponderosae under the RCP4.5 scenario. (ah) Global changes in CS in future decades (2021–2030, 2031–2040, 2041–2050, 2051–2060, 2061–2070, 2071–2080, 2081–2090, and 2091–2100) compared with historical conditions (1987–2016). The intensity of the color in different regions reflects the sensitivity to climate change (red, white and blue represents CS increased, unchanged and decreased, respectively).
Forests 10 00860 g0a2

References

  1. Pachauri, K.; Meyer, A. Climate Change 2014 Synthesis Report. Environ. Policy Collect. 2014, 27, 408. [Google Scholar]
  2. Chen, Y.; Ma, C. Effect of global warming on insect: A literature review. Acta Ecol. Sin. 2010, 30, 2159–2172. [Google Scholar]
  3. Logan, J.A.; Régnière, J.; Powell, J.A. Assessing the impacts of global warming on forest pest dynamics. Front. Ecol. Environ. 2003, 1, 130–137. [Google Scholar] [CrossRef]
  4. Amman, G.D.; Cole, W.E. Mountain pine beetle dynamics in lodgepole pine forests. Part II: Population dynamics. In General Technical Report, Intermountain Forest and Range Experiment Station, USDA Forest Service; (INT-145); USDA Forest Service: Washington, DC, USA, 1983. [Google Scholar]
  5. Unger, L.S. Mountain Pine Beetle; Pacific Forestry Centre: Victoria, BC, Canada, 1993; Volume 76. [Google Scholar]
  6. Coops, N.C.; Waring, R.H.; Wulder, M.A.; White, J.C. Prediction and assessment of bark beetle-induced mortality of lodgepole pine using estimates of stand vigor derived from remotely sensed data. Remote Sens. Environ. 2009, 113, 1058–1066. [Google Scholar] [CrossRef]
  7. Jenkins, M.J.; Hebertson, E.; Page, W.; Jorgensen, C.A. Bark beetles, fuels, fires and implications for forest management in the Intermountain West. For. Ecol. Manag. 2008, 254, 16–34. [Google Scholar] [CrossRef]
  8. Pedersen, L. How Serious Is the Mountain Pine Beetle Problem? From a Timber Supply Perspective; Pacific Forestry Centre: Victoria, BC, Canada, 2003; pp. 10–18. [Google Scholar]
  9. Safranyik, L.; Carroll, A.L.; Régnière, J.; Langor, D.W.; Riel, W.G.; Shore, T.L.; Peter, B.; Cooke, B.J.; Nealis, V.G.; Taylor, S.W. Potential for range expansion of mountain pine beetle into the boreal forest of North America. Can. Entomol. 2010, 142, 415–442. [Google Scholar] [CrossRef]
  10. Yamaoka, Y. A1 Forest Pests. In Proceedings of the 5th International Congress of Plant Pathology, Kyoto, Japan, 20–27 August 1988. [Google Scholar]
  11. Charles, P. In the Rockies, Pines Die and Bears Feel It. Available online: https://www.nytimes.com/2007/01/30/science/30bear.html?ref=science (accessed on 1 June 2008).
  12. Furniss, M.M.; Schenk, J.A. Sustained natural infestations by the mountain pine beetle in seven new Pinus and Picea hosts. J. Econ. Entomol. 1969, 62, 2. [Google Scholar] [CrossRef]
  13. Cook, S.P.; Martinez, A. Insects emerging from novel species of host trees attacked by mountain pine beetle, Dendroctonus ponderosae Hopkins, 1902 (Coleoptera: Curculionidae: Scolytinae), in the University of Idaho Arboretum. Pan Pac. Entomol. 2018, 94, 75–84. [Google Scholar] [CrossRef]
  14. Rosenberger, D.W.; Venette, R.C.; Aukema, B.H. Susceptibility of Eurasian Scots pine, Pinus sylvestris L. to the aggressive North American mountain pine beetle, Dendroctonus ponderosae Hopkins. For. Ecol. Manag. 2019, 445, 20–25. [Google Scholar] [CrossRef]
  15. Kipfmueller, K.F.; Swetnam, T.W.; Morgan, P. Climate and mountain pine beetle-induced tree mortality in the Selway-Bitterroot Wilderness Area; Final Report to the U.S. Department of Agriculture, Forest Service, Research Joint Venture Agreement #RMRS-99611-RJVA; Rocky Mountain Research Station: Fort Collins, CO, USA, 2002.
  16. Thomson, A.J.; Shrimpton, D.M. Weather associated with the start of mountain pine beetle outbreaks. Can. J. For. Res. 1984, 14, 255–258. [Google Scholar] [CrossRef]
  17. Elith, J.; Leathwick, J.R. Species distribution models: Ecological explanation and prediction across space and time. Annu. Rev. Ecol. Evol. Syst. 2009, 40, 677–697. [Google Scholar] [CrossRef]
  18. Li, G.; Liu, C.; Liu, Y.; Yang, J.; Zhang, X.; Guo, K. Advances in theotetical issues of species distribution models. Acta Ecol. Sin. 2013, 33, 4827–4835. [Google Scholar]
  19. Xu, Z.; Peng, H.; Peng, S. The development and evaluation of species distribution models. Acta Ecol. Sin. 2015, 35, 557–567. [Google Scholar]
  20. Shabani, F.; Kumar, L.; Taylor, S. Climate change impacts on the future distribution of date palms: A modeling exercise using CLIMEX. PLoS ONE 2012, 7, e48021. [Google Scholar] [CrossRef] [PubMed]
  21. Pattison, R.R.; Mack, R.N. Potential distribution of the invasive tree Triadica sebifera (Euphorbiaceae) in the United States: Evaluating climex predictions with field trials. Glob. Chang. Biol. 2010, 14, 813–826. [Google Scholar] [CrossRef]
  22. Taylor, S.; Kumar, L. Potential distribution of an invasive species under climate change scenarios using CLIMEX and soil drainage: A case study of Lantana camara L. in Queensland, Australia. J. Environ. Manag. 2013, 114, 414–422. [Google Scholar] [CrossRef] [PubMed]
  23. Ge, X.; Zong, S.; He, S.; Liu, Y.; Kong, X. Areas of C hina predicted to have a suitable climate for A noplophora chinensis under a climate-warming scenario. Entomol. Exp. Appl. 2014, 153, 256–265. [Google Scholar] [CrossRef]
  24. Khormi, H.M.; Kumar, L. Climate change and the potential global distribution of Aedes aegypti: Spatial modelling using GIS and CLIMEX. Geospat. Health 2014, 8, 405. [Google Scholar] [CrossRef] [PubMed]
  25. Ge, X.; Jiang, C.; Chen, L.; Qiu, S.; Zhao, Y.; Wang, T.; Zong, S. Predicting the potential distribution in China of Euwallacea fornicates (Eichhoff) under current and future climate conditions. Sci. Rep. 2017, 7, 5772. [Google Scholar] [CrossRef]
  26. Brasier, C.M.; Scott, J.K. European oak declines and global warming: A theoretical assessment with special reference to the activity of Phytophthora cinnamomi. EPPO Bull. 1994, 24, 221–232. [Google Scholar] [CrossRef]
  27. Yonow, T.; Hattingh, V.; de Villiers, M. CLIMEX modelling of the potential global distribution of the citrus black spot disease caused by Guignardia citricarpa and the risk posed to Europe. Crop Prot. 2013, 44, 18–28. [Google Scholar] [CrossRef]
  28. Kriticos, D.J.; Maywald, G.F.; Yonow, T.; Zurcher, E.J.; Herrmann, N.I.; Sutherst, R. Exploring the effects of climate on plants, animals and diseases. CLIMEX Version 2015, 4, 184. [Google Scholar]
  29. Carroll, A.L.; Regniere, J.; Logan, J.A.; Taylor, S.W.; Bentz, B.J.; Powell, J.A. Impacts of Climate Change on Range Expansion by the Mountain Pine Beetle. Crit. Care Med. 2006, 33, 1185. [Google Scholar]
  30. Scott, L.M.; Janikas, M.V. Spatial Statistics in ArcGIS; Springer: Berlin/Heidelberg, Germany, 2010. [Google Scholar]
  31. Zou, Y.; Ge, X.; Guo, S.; Zhou, Y.; Wang, T.; Zong, S. Impacts of climate change and host plant availability on the global distribution of Brontispa longissima (Coleoptera: Chrysomelidae). Pest Manag. Sci. 2019. [Google Scholar] [CrossRef] [PubMed]
  32. Carroll, A.L.; Taylor, S.W.; Régnière, J.; Safranyik, L. Effect of climate change on range expansion by the mountain pine beetle in British Columbia. In Proceedings of the Mountain Pine Beetle Symposium: Challenges and Solutions, Kelowna, BC, Canada, 30–31 October 2003; Shore, T.L., Brooks, J.E., Stone, J.E., Eds.; Natural Resources Canada, Infromation Report BC-X-399: Victoria, BC, USA; pp. 223–232. [Google Scholar]
  33. McFarlane, B.L.; Stumpf-Allen, R.C.G.; Watson, D.O. Public perceptions of natural disturbance in Canada’s national parks: The case of the mountain pine beetle (Dendroctonus ponderosae Hopkins). Biol. Conserv. 2006, 130, 340–348. [Google Scholar] [CrossRef]
  34. Mock, K.E.; Bentz, B.J.; O’neill, E.M.; Chong, J.P.; Orwin, J.; Pfrender, M.E. Landscape-scale genetic variation in a forest outbreak species, the mountain pine beetle (Dendroctonus ponderosae). Mol. Ecol. 2007, 16, 553–568. [Google Scholar] [CrossRef] [PubMed]
  35. Safranyik, L.; Carroll, A.L. The biology and epidemiology of the mountain pine beetle in lodgepole pine forests. In The Mountain Pine Beetle: A Synthesis of Biology, Management, and Impacts on Lodgepole Pine; Forestry Centre: Victoria, BC, Canada, 2006; pp. 3–66. [Google Scholar]
  36. EPPO Global Data Base Dendroctonus ponderosae Hopkins. Available online: https://gd.eppo.int/taxon/DENCPO/distribution (accessed on 15 April 2018).
  37. GBIF Distribution Maps of Dendroctonus ponderosae Hopkins. Available online: https://www.gbif.org/occurrence/search?taxon_key=1228026 (accessed on 15 April 2018).
  38. GBIF the Global Distribution of Pinus L. Available online: https://www.gbif.org/occurrence/search?taxon_key=2684241&taxon_key=1228026 (accessed on 1 May 2018).
  39. Safranyik, L.; Barclay, H.; Thomson, A.; Riel, W. A Population Dynamics Model for the Mountain Pine Beetle, Dendroctonus ponderosae Hopk. (Coleoptera: Scolytidae); Pacific Forestry Centre: Victoria, BC, Canada, 1999. [Google Scholar]
  40. Patterson, J.E. Control of the Mountain Pine Beetle in Lodgepole pine by the Use of Solar Heat; No. 1488-2016-123579; United States Department of Agriculture: Washington, DC, USA, 1930.
  41. Reid, R.W.; Gates, H. Effect of temperature and resin on hatch of eggs of the mountain pine beetle (Dendroctonus ponderosae). Can. Entomol. 1970, 102, 617–622. [Google Scholar] [CrossRef]
  42. Bentz, B.J.; Logan, J.A.; Amman, G.D. Temperature-dependent development of the mountain pine beetle (Coleoptera: Scolytidae) and simulation of its phenology. Can. Entomol. 1991, 123, 1083–1094. [Google Scholar] [CrossRef]
  43. Shepherd, R. Factors influencing the orientation and rates of activity of Dendroctonus ponderosae Hopkins (Coleoptera: Scolytidae). Can. Entomol. 1966, 98, 507–518. [Google Scholar] [CrossRef]
  44. McCambridge, W.F. Temperature limits of flight of the mountain pine beetle, Dendroctonus ponderosae. Ann. Entomol. Soc. Am. 1971, 64, 534–535. [Google Scholar] [CrossRef]
  45. Aukema, B.H.; Carroll, A.L.; Zheng, Y.; Zhu, J.; Raffa, K.F.; Dan Moore, R.; Stahl, K.; Taylor, S.W. Movement of outbreak populations of mountain pine beetle: Influences of spatiotemporal patterns and climate. Ecography 2008, 31, 348–358. [Google Scholar] [CrossRef]
  46. Reid, R.W. Biology of the mountain pine beetle, Dendroctonus monticolae Hopkins, in the east Kootenay region of British Columbia I. Life cycle, brood development, and flight periods. Can. Entomol. 1962, 94, 531–538. [Google Scholar] [CrossRef]
  47. Safranyik, L.; Shrimpton, D.M.; Whitney, H.S. An interpretation of the interaction between lodgepole pine, the mountain pine beetle and its associated blue stain fungi in western Canada. Manag. Lodg. Pine Ecosyst. 1975, 1, 406–428. [Google Scholar]
  48. Creeden, E.P.; Hicke, J.A.; Buotte, P.C. Climate, weather, and recent mountain pine beetle outbreaks in the western United States. For. Ecol. Manag. 2014, 312, 239–251. [Google Scholar] [CrossRef]
  49. Zhou, Y.; Gong, Y.; Fan, J. Comparison on Cold Resistance of 4 Pine Conifers. J. Northwest For. Univ. 2011, 26, 69–71. [Google Scholar]
  50. Kishchenko, I.T. Effect of climatic factors on the growth of representatives of the genus Pinus (Pinaceae) under conditions of introduction. Russ. J. Ecol. 2004, 35, 214–219. [Google Scholar] [CrossRef]
  51. Gong, Y.H.; Fan, J.F.; Zhou, Y.X.; Sun, Q.; Yang, J.F. Research on the cold resistance of Pinus nigra var.austriaca and Pseudotsuga menziesii var.glauca. J. Northwest Sci. Tech. Univ. Agric. For. 2006, 34, 105–109. [Google Scholar]
  52. Acevedo, P.; Real, R. Favourability: Concept, distinctive characteristics and potential usefulness. Naturwissenschaften 2012, 99, 515–522. [Google Scholar] [CrossRef]
  53. Farfán, L. Comparative Population Genetic Analysis of Fungal Associates of the Mountain Pine Beetle (Dendroctonus ponderosae); University of British Columbia: Vancouver, BC, Canada, 2014. [Google Scholar]
  54. De la Giroday, H.M.C.; Carroll, A.L.; Aukema, B.H. Breach of the northern Rocky Mountain geoclimatic barrier: Initiation of range expansion by the mountain pine beetle. J. Biogeogr. 2012, 39, 1112–1123. [Google Scholar] [CrossRef]
  55. Sutherst, R.W. Prediction of species geographical ranges. J. Biogeogr. 2003, 30, 805–816. [Google Scholar] [CrossRef] [Green Version]
  56. Bentz, B.; Vandygriff, J.; Jensen, C.; Coleman, T.; Maloney, P.; Smith, S.; Grady, A.; Schen-Langenheim, G. Mountain pine beetle voltinism and life history characteristics across latitudinal and elevational gradients in the western United States. For. Sci. 2013, 60, 434–449. [Google Scholar] [CrossRef]
  57. Berzitis, E.A.; Minigan, J.N.; Hallett, R.H.; Newman, J.A. Climate and host plant availability impact the future distribution of the bean leaf beetle (Cerotoma trifurcata). Glob. Chang. Biol. 2014, 20, 2778–2792. [Google Scholar] [CrossRef] [PubMed]
  58. Ge, X.; He, S.; Zhu, C.; Wang, T.; Xu, Z.; Zong, S. Projecting the current and future potential global distribution of Hyphantria cunea (Lepidoptera: Arctiidae) using CLIMEX. Pest Manag. Sci. 2019, 75, 160–169. [Google Scholar] [CrossRef] [PubMed]
  59. Flato, G.M.; Boer, G.J.; Lee, W.G.; McFarlane, N.A.; Ramsden, D.; Reader, M.C.; Weaver, A.J. The Canadian Centre for Climate Modelling and Analysis global coupled model and its climate. Clim. Dyn. 2000, 16, 451–467. [Google Scholar] [CrossRef]
  60. Bentz, B.J.; Mullins, D.E. Ecology of mountain pine beetle (Coleoptera: Scolytidae) cold hardening in the intermountain west. Environ. Entomol. 1999, 28, 577–587. [Google Scholar] [CrossRef]
  61. Régnière, J.; Bentz, B. Modeling cold tolerance in the mountain pine beetle, Dendroctonus ponderosae. J. Insect Physiol. 2007, 53, 559–572. [Google Scholar] [CrossRef] [PubMed]
  62. Rosenberger, D.W.; Aukema, B.H.; Venette, R.C. Cold tolerance of mountain pine beetle among novel eastern pines: A potential for trade-offs in an invaded range? For. Ecol. Manag. 2017, 400, 28–37. [Google Scholar] [CrossRef]
  63. Sambaraju, K.R.; Carroll, A.L.; Zhu, J.; Stahl, K.; Moore, R.D.; Aukema, B.H. Climate change could alter the distribution of mountain pine beetle outbreaks in western Canada. Ecography 2012, 35, 211–223. [Google Scholar] [CrossRef]
  64. Dormann, C.F. Promising the future? Global change projections of species distributions. Basic Appl. Ecol. 2007, 8, 387–397. [Google Scholar] [CrossRef]
  65. Midgley, G.F.; Hughes, G.O.; Thuiller, W.; Rebelo, A.G. Migration rate limitations on climate change-induced range shifts in Cape Proteaceae. Divers Distribut. Divers. Distrib. 2010, 12, 555–562. [Google Scholar] [CrossRef]
  66. Paulo, D.M.; Luis Mauricio, B. Spatial analysis improves species distribution modelling during range expansion. Biol. Lett. 2008, 4, 577–580. [Google Scholar] [Green Version]
  67. Bentz, B.J.; Logan, J.A.; Vandygriff, J.C. Latitudinal variation in Dendroctonus ponderosae (Coleoptera: Scolytidae) development time and adult size. Can. Entomol. 2001, 133, 375–387. [Google Scholar] [CrossRef]
  68. Trewin, B.J. Assessing the Risk of Establishment by the Dengue Vector, Aedes Aegypti (L.)(Diptera: Culicidae), Through Rainwater Tanks in Queensland: Back to the Future; University of Queensland: Queensland, Australia, 2018. [Google Scholar]
  69. Bentz, B.J.; Hood, S.M.; Hansen, E.M.; Vandygriff, J.C.; Mock, K.E. Defense traits in the long-lived Great Basin bristlecone pine and resistance to the native herbivore mountain pine beetle. New Phytol 2017, 213, 611–624. [Google Scholar] [CrossRef] [PubMed]
  70. Eidson, E.L.; Mock, K.E.; Bentz, B.J. Mountain pine beetle host selection behavior confirms high resistance in Great Basin bristlecone pine. For. Ecol. Manag. 2017, 402, 12–20. [Google Scholar] [CrossRef]
  71. Desurmont, G.A.; Donoghue, M.J.; Clement, W.L.; Agrawal, A.A. Evolutionary history predicts plant defense against an invasive pest. Proc. Natl. Acad. Sci. USA 2011, 108, 7070–7074. [Google Scholar] [CrossRef] [PubMed] [Green Version]
  72. Dordel, J.; Feller, M.C.; Simard, S.W. Effects of mountain pine beetle (Dendroctonus ponderosae Hopkins) infestations on forest stand structure in the southern Canadian Rocky Mountains. For. Ecol. Manag. 2008, 255, 3563–3570. [Google Scholar] [CrossRef]
  73. Beal, J.A. Relation Between Tree Growth and Outbreaks of the Black Hills Beetle. J. For. 1943, 41, 359–366. [Google Scholar]
Figure 1. The known distribution of Pinus spp. based on published records. Green dots represent the known distribution records from the Global Biodiversity Information Facility (GBIF) database.
Forests 10 00860 g001
Figure 2. The sigmoidal curve of ecoclimatic index (EI) values of host plants (Pinus spp.) used to simulate host plant availability (θ). A value of 0 for θ indicates an area unfavorable for host plant growth ( E I P = 0); a low θ value indicates a region providing marginal support for host plant growth ( E I P ≤ 10); a high value of θ indicates an area favorable or very favorable for host plant growth ( E I P > 10).
Forests 10 00860 g002
Figure 3. Predicted potential global distribution under historical climate conditions and the known global occurrence records of D. ponderosae. The unfavorable, marginal, favorable, and very favorable regions were painted in white, yellow, blue, and red, respectively. The known distribution based on published records were filled with black dots and mesh polygons.
Forests 10 00860 g003
Figure 4. Predicted potential global distribution of D. ponderosae under future climate conditions. (ah) Predicted potential global distribution of D. ponderosae for 2021–2030, 2031–2040, 2041–2050, 2051–2060, 2061–2070, 2071–2080, 2081–2090, and 2091–2100. The unfavorable, marginal, favorable, and very favorable regions were painted in white, yellow, blue, and red, respectively.
Forests 10 00860 g004
Figure 5. The proportion of climate-suitable global areas in future decades (2021–2030, 2031–2040, 2041–2050, 2051–2060, 2061–2070, 2071–2080, 2081–2090, and 2091–2100). (ad) represents proportion of changes in unfavorable, marginal, favorable, and very favorable regions, respectively.
Forests 10 00860 g005
Figure 6. Climate change impacts the potential distribution of D. ponderosae under the representative concentration pathway (RCP) 4.5 scenario. (a) Changes in EI values with latitude. (bi) Global changes in suitability ecoclimatic index (EI) in future decades (2021–2030, 2031–2040, 2041–2050, 2051–2060, 2061–2070, 2071–2080, 2081–2090, and 2091–2100) compared with historical conditions (1987–2016). The intensity of colors in different regions reflects the sensitivity to climate change.
Forests 10 00860 g006
Figure 7. Shift paths and relative shift distances in central points for climate-unsuitable (0 ≤ EI < 10, red points) and climate-suitable (10 ≤ EI < 100, blue points) regions in future decades (2021–2100) in different continents (except Antarctica). Black points in Figure 7a1–f1 and a2–f2 represent the central points of historical distributions, and the numbers in Figure 7a1–f1 and a2–f2 represent different periods from 2021 to 2100. Figure 7a3–f3 reflects the relative shift distance of central points in two directions (north–south and east–west) in future decades compared with historical central points (1987–2016). Positive values denote points lying in the north/east of historical positions, and negative values denote the south/west direction. Positive and negative slopes reflect the shift directions of central points, representing northward/eastward and southward/westward, respectively.
Forests 10 00860 g007