Article

Comparing Negative Impacts of Prunus serotina, Quercus rubra and Robinia pseudoacacia on Native Forest Ecosystems

1
Department of Earth and Environmental Sciences, University of Milano-Bicocca, Piazza della Scienza 1, 20126 Milano, Italy
2
Department of Earth and Environmental Science, University of Pavia, Via Ferrata 9, 27100 Pavia, Italy
*
Author to whom correspondence should be addressed.
Forests 2019, 10(10), 842; https://doi.org/10.3390/f10100842
Submission received: 12 August 2019 / Revised: 9 September 2019 / Accepted: 23 September 2019 / Published: 26 September 2019
(This article belongs to the Section Forest Ecology and Management)

Abstract

:
The introduction of invasive alien plant species (IAPS) can modify plant-soil feedback, resulting in an alteration of the abiotic and biotic characteristics of ecosystems. Prunus serotina, Quercus rubra and Robinia pseudoacacia are IAPS of European temperate forests, where they can become dominant and suppress the native biodiversity. Assuming that the establishment of these invasive species may alter native forest ecosystems, this study comparatively assessed their impact on ecosystems. This study further investigated plant communities in 12 forest stands, dominated by the three IAPS and native trees, Quercus robur and Carpinus betulus (three plots per forest type), in Northern Italy, and collected soil samples. The relationships between the invasion of the three IAPS and modifications of humus forms, soil chemical properties, soil biological quality, bacterial activity and plant community structure and diversity (α-, β-, and γ-diversity) were assessed using one-way ANOVA and redundancy analyses (RDA). Our comparative study demonstrated that invaded forests often had unique plant and/or soil properties, relative to native forests, and the degree of dissimilarity depended on the invasive species. Particularly, Q. rubra is related to major negative impacts on soil organic horizons and low/modified levels of microarthropod and plant biodiversity. R. pseudoacacia is associated with an altered base content of soil and, in turn, with positive feedback to the soil biological quality (QBS-ar) and plant diversity, but with a high cover compared with other alien plant species. P. serotina is associated with intermediate impacts and exhibits a plant species assemblage that is more similar to those of native forest stands. Our work suggests impact-based management decisions for the three investigated IAPS, since their effects on the diversity and composition of resident ecosystems are very different.

1. Introduction

The establishment of invasive alien plant species (IAPS) can significantly change the structure and function of ecosystems [1]. It is well known that many IAPS affect resident plant communities in terms of dynamics, dominance, diversity, and structure [2,3]. IAPS can also modify plant–soil feedback, which alters the abiotic and biotic characteristics of soil, such as pH, moisture, nutrient availability and faunal and microbial communities [4,5]. Particularly, soils colonized by alien species often show increased proportions of organic carbon, total nitrogen, phosphorus and biomass through litterfall, in comparison with those developed under the dominance of native species [6]. These factors may affect the microbial activity directly involved in litter decomposition [7]. Nonetheless, across pairs of invaded versus uninvaded sites, the perceived effect of IAPS on soil properties (e.g., an increase or decrease soil fertility) depended on the site’s baseline soil characteristics [8]. In any case, the alteration of a soil ecosystem may cause a decline in the diversity and fitness of resident biota [9], since the abiotic conditions of soil and species composition can reciprocally shape each other [10].
Prunus serotina Ehrh. (black cherry), Robinia pseudoacacia L. (black locust), and Quercus rubra L. (red oak) are invasive alien species of anthropogenic, semi-natural and natural habitats and were introduced across Europe over the last two centuries. They are listed in several black lists at the country level and are among the worst IAPS in Europe (i.e., P. serotina and R. pseudoacacia; [11], since they can rapidly colonize shrub and tree layers (mostly in mixed managed forests), favored by a high propagule pressure, seedling recruitment/survival, and/or vegetative reproduction [12,13]. These factors contribute to a progressive increase of their range [14,15,16,17], also occupying the niches of native trees.
Recent research on the impacts of P. serotina, R. pseudoacacia, and Q. rubra on ecosystems showed that these species can greatly alter litter dynamics and physical and chemical soil properties, such as pH, exchangeable cations and nutrient contents. For instance, compared to native forests, P. serotina stands are linked to lower pH values and base content (K, Ca, and Mg [18]. Q. rubra stands have strong impacts on topsoil, causing acidification, which affects the base and nutrient contents and increases soil exchangeable acidity [19]. In R. pseudoacacia stands, soil organic matter, phosphorus and total nitrogen contents have higher values [20]. Other studies demonstrated a significant, negative correlation between the abundance of P. serotina and Q. rubra and understory species richness [15,21]. According to [22], the impact of R. pseudoacacia on the biodiversity of invaded communities is unclear. Indeed, in several woodland types, it seems to have no effect on native species richness or cover [23]. On the other hand, other authors report that Robinia forms specific plant communities, with a different herb layer from that of forest dominated by native trees [22].
To date, a few investigations have highlighted that P. serotina, R. pseudoacacia, and Q. rubra can considerably modify the composition and structure of soil fauna (microarthropods), microbial communities, and plant communities. In fact, most of the research on the three IAPS assessed their impact on a single component of the ecosystem (e.g., a resident plant or arthropod community, or soil characteristics). Moreover, comparative studies assessing the impact of more than one IAPS on all these environmental characteristics are limited or have treated differences in functional traits, resource allocation and natural regeneration [24,25,26].
Based on such evidence, it was assumed that the long-term presence of P. serotina, R. pseudoacacia, and Q. rubra may induce significant modifications of the different components of forest ecosystems, such as soil characteristics and biotic communities (soil bacteria, soil fauna, and plant community). Then, it was hypothesized that such modifications may be quite different for the three species. To test this hypothesis and quantify the possible impacts of the three species on the resident forest ecosystem, native and invaded forest stands dominated by the three IAPS were compared. Native stands were dominated by Q. robur, typical of the Po plain area (Italy). Our specific objectives were:
(a).
To evaluate the possible differences in humus forms and subsequent variations in other soil physical and chemical properties among forest stands;
(b).
To determine if variations in biotic components occurred among forest stands, particularly ascertaining possible reductions in biodiversity levels and biological soil quality; and
(c).
To recognize the relationships among biotic and abiotic determinants across the different forest stands.

2. Materials and Methods

2.1. Study Area and Sites

The study was carried out in temperate deciduous woodland patches of the Po plain, in the Lombardy region (Italy; 45°32′ N, 8°51′ E; Supplementary Materials Figure S1).
The original land cover of the area is Padanian-Illyrian hardwood forest in transition to mesophytic Padanian mixed oak forest [27], dominated by deciduous oaks, Quercus spp., and hornbeam Carpinus betulus. Nowadays, the area is highly urbanized, with a residual ancient forest cover that is, in part, threatened by the invasion of neophyte alien species, such as P. serotina, Q. rubra and R. pseudoacacia.
Q. rubra, native to North America, was introduced in Europe between the XVII and XVIII centuries, as ornamental and timber species, while the first evidence of its cultivation in Italy dates back to 1812. P. serotina, native to central-eastern North America, was introduced in Italy and Lombardy in 1922 [28]. Both species have been studied for forestry purposes since 1922, with different results. Red oak has been used in tree plantations, artificially introduced into the native forest, after tree cutting and by planting or sowing. From there, it quickly spread as consequence of its ability to compete with shade-tolerant species and its rapid growth (faster than the common oak) and resistance to water stress and disease. The experimental fields of black cherry were instead rapidly abandoned due to the poor quality of the produced wood. From these plantations, the surviving individuals started an intensive invasion, spreading in the same way that the red oak did, but also randomly spreading with the help of birds.
R. pseudacacia, native to eastern North America, was introduced into Europe in 1601 and into Italy in 1662. The forestry interest in this species favored its spreading due to its suitability for the woodland coppice. As it provided good quality timber, with a high growth rate, the native species were progressively cut and displaced.
Over an area of approximately 250 km2, four forest types were investigated: (a) Q. robur and Carpinus betulus native forest (QF, Quercus forest), (b) P. serotina forest (PS), (c) Q. rubra forest (QR) and (d) R. pseudoacacia forest (RP). For each forest, 3 randomly selected plots (=sites) of 20 × 20 m were surveyed, with a total of 12 independent sites. Each forest type was defined when the dominant species had a canopy cover higher than 80%. The distance between the plots ranged from approximately 0.15 to 20.5 km. With regard to the forest stands invaded by alien species, all the forests are between 60 and 65 years old, except for one stand (i.e., plot) of the RP forest, which is 40 years old, as estimated by dendrocronologiacal analyses of collected increment cores using a Pressler borer. All the study sites belonged to the same pedological landscape unit [29], allowing the assumption that they had the same abiotic and biotic characteristics before the invasion. They are located within the fluvioglacial würmian plain of the Ticino river basin, with acidic pebbly-gravelly substrates [30].
According to the World Reference Base (WRB) classification [31], the soils mainly belong to the Cambisols reference group. They are desaturated in bases, often rich in fragments and have a subacid to acid reaction. The elevation of the study sites ranged from 192 to 209 m a.s.l.
The average annual precipitation and temperature at the Busto Arsizio meteorological station (close to the study area) were 1081 mm and 13.8 °C, respectively (ARPA Lombardia, mean for the period 2006–2016).

2.2. Soil Abiotic Characteristics

In each plot, a soil minipit was opened down to C horizon and described for the taxonomic classification [31]. The soil sampling was performed during the spring of 2016 at three georeferenced points located along the diagonal (28.28 m) of the plot. The soil samples were collected from 0–10 cm, 10–30 cm and 30–60 cm layers using a cylindrical core sampler (5.4 cm diameter), for the first two layers, and a gouge auger (2.5 cm diameter) for the deeper one.
The soil bulk density (BD) was determined for the first two layers using the samples, collected in the manner mentioned above and considering the volume of stones. For the third layer, the BD was determined by collecting the core samples from the soil mini-pit.
The soil samples were combined to form a composite sample of each layer, which represented the average soil characteristics of the plot. A total of 36 mineral soil samples were obtained. The list and abbreviations of all investigated parameters are shown in Table 1. The composite samples were air dried, sieved (2 mm mesh) and analyzed to determine the soil organic carbon (SOC) and total nitrogen (Ntot) content (Flash EA 1112 NCSoil, Thermo Fisher Scientific elemental analyzer, Pittsburgh, PA, USA), pH (soil to water ratio of 1:2.5), and particle-size distribution (by sieving and sedimentation; [32] and available P (Pav) [33,34]. CEC (extracted by barium chloride, pH 8.1), exchangeable cations (Ca, Mg, Na, and K) and BS were determined for the first layer only. Through the BD and stone volume, the SOC content was computed on an area basis (kg m−2) for mineral layers.
The humus form was described in the field and then classified, according to [35]. The organic horizons (OL, OF and OH) were sampled using a 30 × 30 cm frame, collecting 27 composite samples of biomass for each horizon, which where oven-dried at 70 °C for 48 h, weighed and ground using a planetary ball mill. The SOC and Ntot contents of organic layers were determined with a CN elemental analyzer.
To evaluate the level of accumulation of organic residues on the soil surface, the littering index (Littind), obtained by the ratio between SOCOrg and SOC of the first investigated layer, was calculated.
A quantitative assessment of forest humus forms was used to calculate the humus index (Humind) [36,37]. The humus forms were classified and scaled in order of increasing accumulation of organic matter in the O horizons and decreasing burrowing activity in the A horizon, and the order was as follows: 1: Eumull, 2: Mesomull, 3: Oligomull, 4: Dysmull, 5: Hemimoder, 6: Eumoder, and 7: Dysmoder. Eumull, Oligomull and Eumoder were not present in our study sites. In the text and figures, the average value and standard error are used for the comparison of the different forest types.

2.3. Soil Biotic Characteristics: Microbial Activity and Microarthropod Communities

At each sampling plot, three core soil samples (100 cm3) were collected in the 0–5 cm layer of the A horizon and were combined to form a composite sample and stored at 5–6 °C for microbial activity analyses. The potential soil respiration by titration [38,39] and bacteria count were determined (see Supplementary Materials Text S1).
Microarthropod samples were collected in May 2016, during a period of peak activity [40,41]. In each plot, after litter removal, three random soil samples were collected with a cylindrical corer (10.5 cm diameter), inserted at a depth of 10 cm. The samples were placed in black fabric bags, labeled, and processed in the laboratory on the day of collection to maximize organism survival and extraction. Soil fauna was extracted using Berlese-Tullgren funnels, following the standard QBS-ar methodology of [40], with an extraction duration of 10 days. Microarthropods were mainly determined on the order level. The community was characterized using: (a) Individual abundance, calculated as the mean of the three samples collected in each plot, for the more representative taxa (i.e., with at least 40 individuals); (b) richness within the plot, in terms of the number of euedaphic taxa, i.e., those well-adapted to the soil environment; and (c) the QBS-ar index, according to [40]. QBS-ar is an index based on the biological form approach and assesses the adaptation of organisms to an edaphic habitat through an index (eco-morphological index-EMI) that ranges from 1 to 20, with higher values assigned to microarthropod taxa that are better adapted to the soil environment. QBS-ar is then the sum of the EMI scores of microarthropod groups recorded in the sample, following the concept that the higher the number of groups that are well-adapted to the edaphic habitat, the higher the soil quality.

2.4. Plant Communities

A floristic survey was carried out in each 20 × 20 m plot. For each species (trees, grasses, forbs and moss layer), the percentage cover was visually estimated (expert-based, subdividing the whole plot into 4 sub-plots of 10 × 10 m to reduce the error). In order to determine if the three IAPS affect the native forest herb species (i.e., typical of the woodland habitat), the number of individuals of the forest herb species, Polygonatum multiflorum (L.) All., was recorded. This last species was chosen as an indicator species, since it was present in all forest types, and it is typical of the Central Europe oak or oak-hornbeam forests of the Carpinion betuli alliance, association Polygonato multiflori-Quercetum roboris Sartori 1980. The α-diversity was measured as the mean number of species registered in the plots and using the Shannon H’ diversity index for each woodland type. The β-diversity was described using two different metrics: (a) The Jaccard’s coefficient, a similarity measure based on co-occurrence of species between plots; and (b) the Whittaker index based on the ratio between α- and γ-diversity. The γ-diversity, according to Whittaker, was calculated as the total number of species recorded in each woodland type (Table 1). In each plot, the number and cover of alien species were recorded, excluding the studied dominant alien species in each kind of woodland.
The botanical nomenclature follows the “Portal to the Flora of Italy” (http://dryades.units.it/floritaly/).

2.5. Data Analysis

An ANOVA model was fitted to assess differences in the means of abiotic and biotic factors among four woodland types. When necessary, the data were log-transformed to normalization. In particular, the Duncan post-hoc test was performed to assess the pairwise differences at a significance level of p < 0.05.
In order to analyze the strength of the ANOVA design and reduce the risk of Type II error (retaining a null hypothesis, when it was false), a post-hoc power analysis was carried out with the Gpower software [42]. The analyses showed a power higher than the critical value of 0.8 (or a very similar value of 0.79 for both SOCorg and SOCol), which is sufficient to detect significant effect sizes.
The ecological determinants of the structure of the different woodland types were investigated by a redundancy analysis (RDA). The RDA allowed the comparison the different woodlands, in terms of plant and microarthropod communities (composition and abundance), and the identification of the gradient trajectories for the different biotic and abiotic factors. The Monte Carlo permutation test (based on 999 iterations) was performed in order to assess both the significance of the environmental variables and the ordination axes. The Spearman’s rho correlation analysis was performed to reduce the variables and noise in the variance components used for ordination. One of each pair of highly correlated/redundant variables (i.e., correlation coefficient ≥ 0.75) were removed from the analysis [43]. The inflation factor of the remnant variables was checked in order to detect for possible multicollinearity in the predictors. The outcomes are shown in a correlation matrix, the coefficient and significance of which are provided in Supplementary Materials Table S1.
The software employed for the RDA was CANOCO version 4.5. The univariate (ANOVA) and correlation analysis was performed in the R environment, version 3.3.1 [44]. The Levene test and Shapiro-Wilk test (car package in R; [45]) were conducted to test the homogeneity of the variance and normality assumption, respectively. The correlation plots were performed using the “corrplot” package in R [46].

3. Results

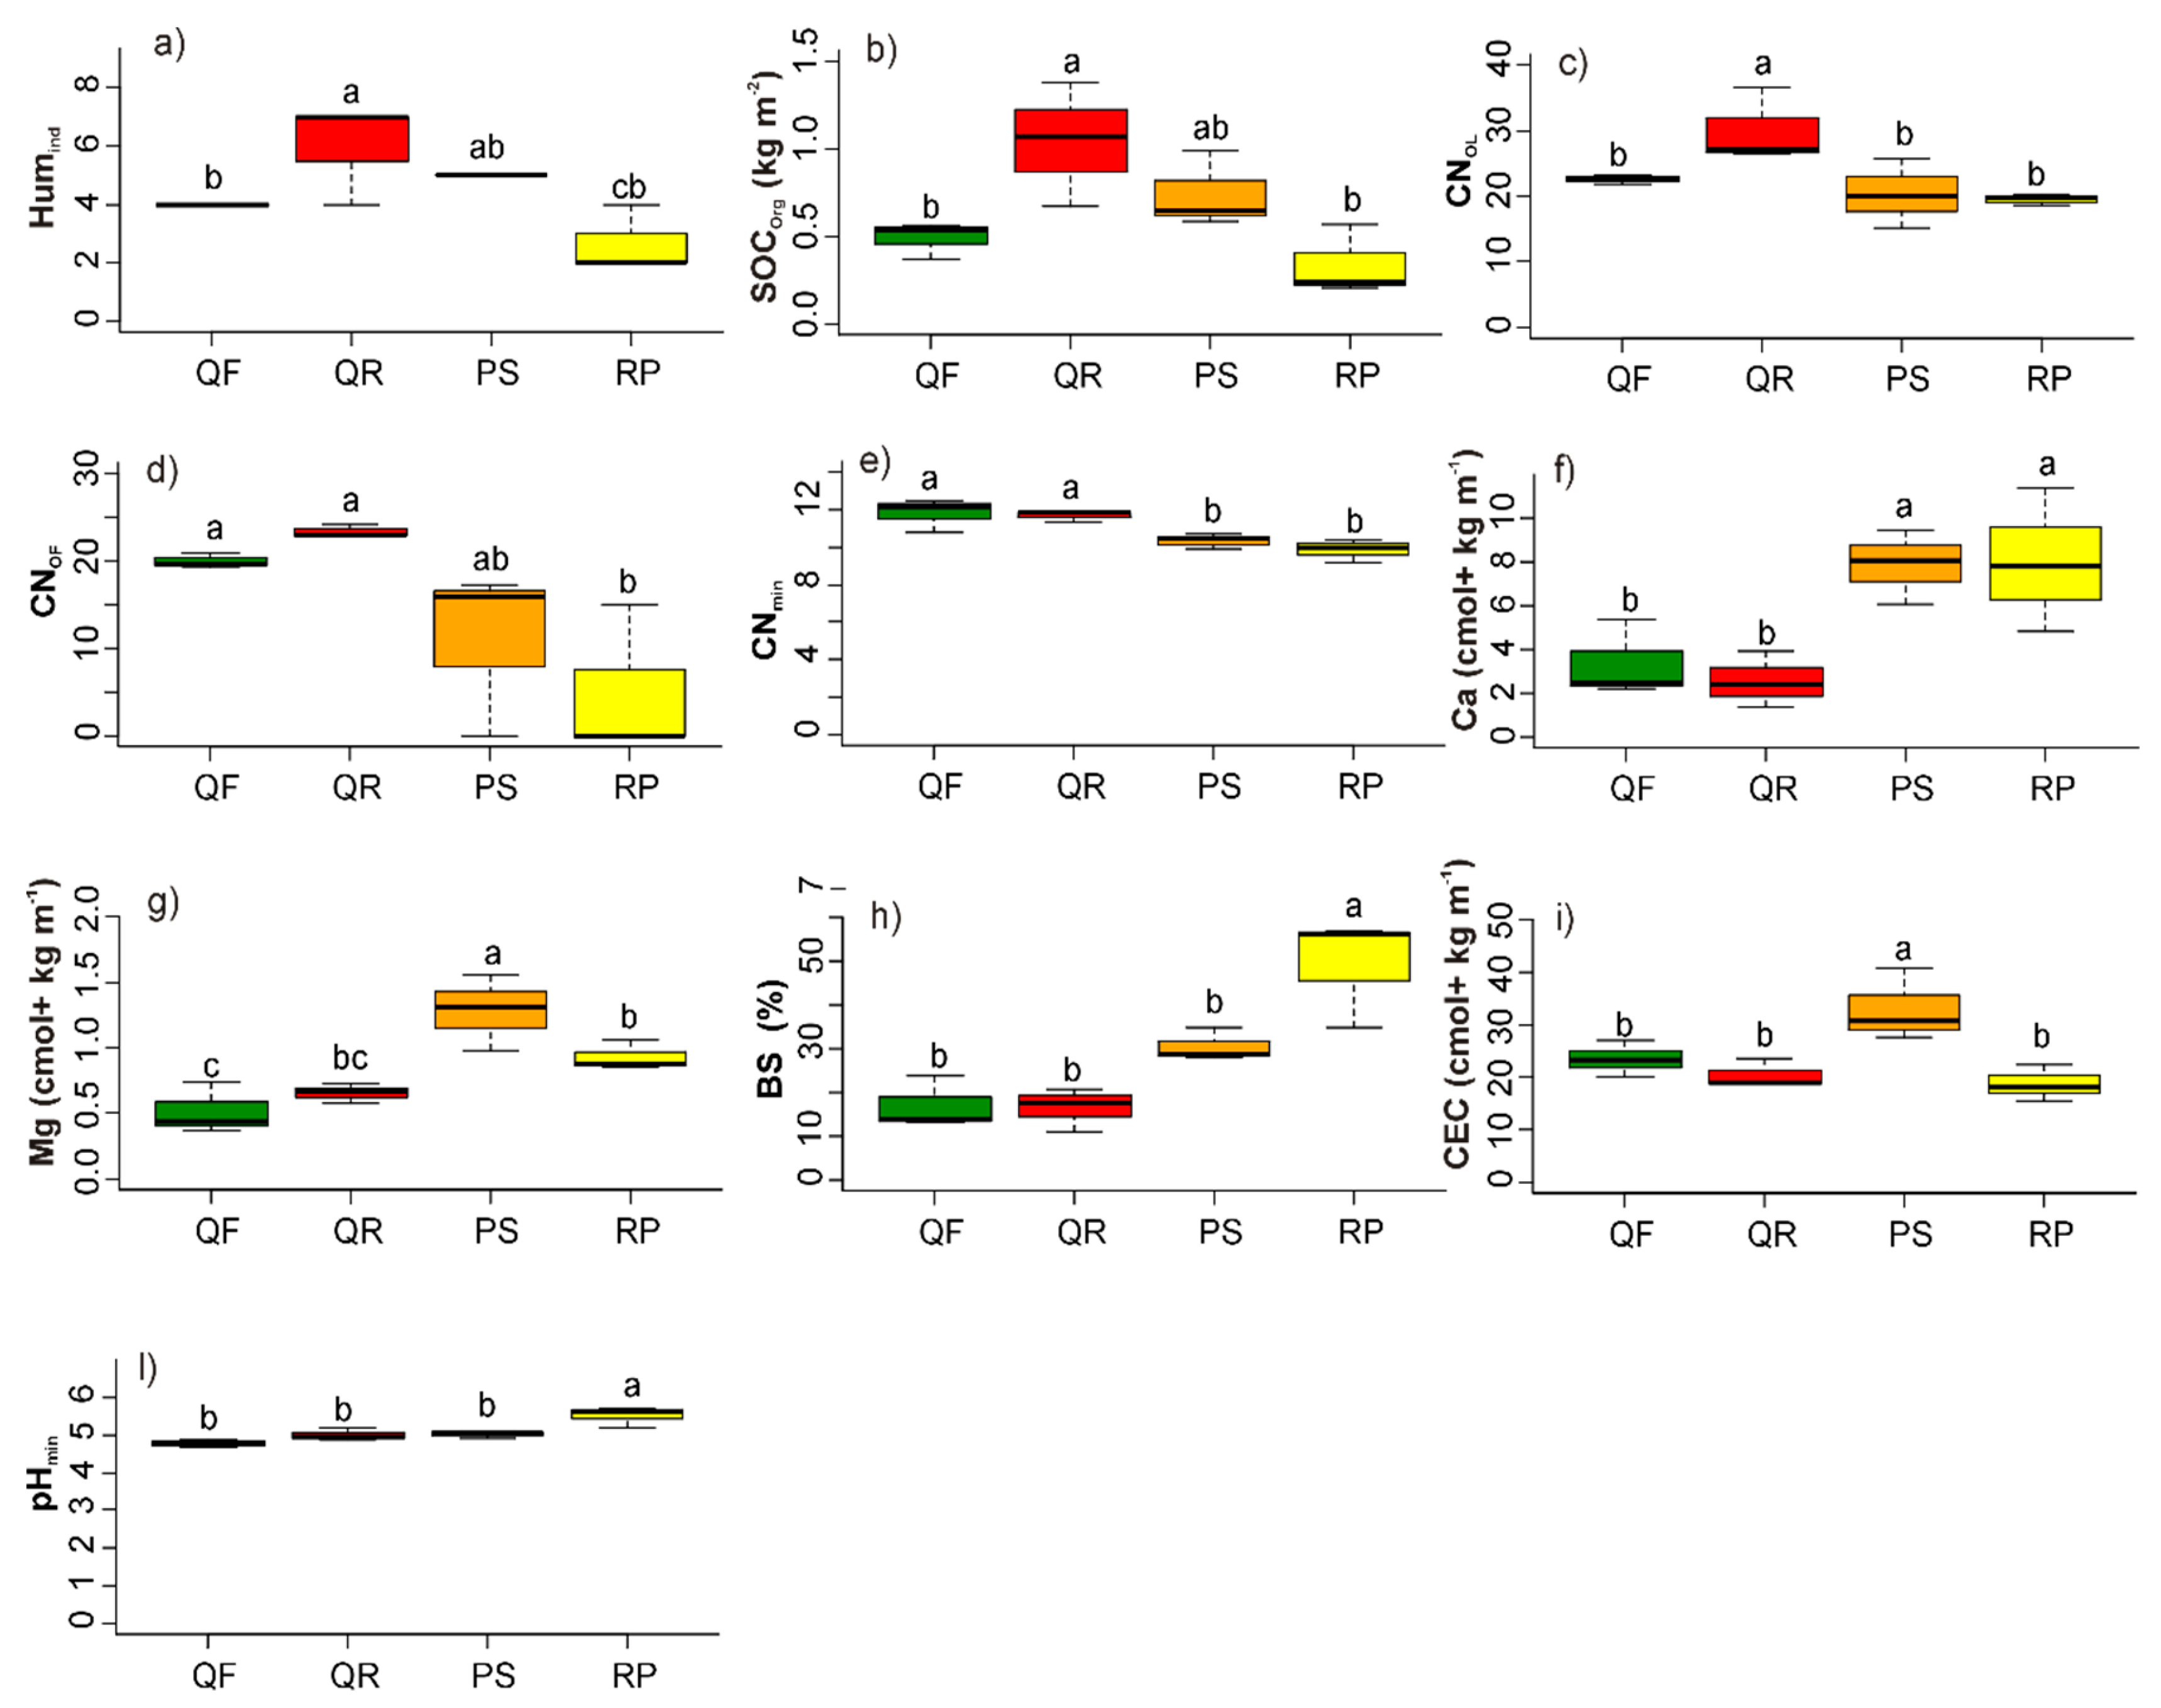
3.1. Soil Abiotic Characteristics
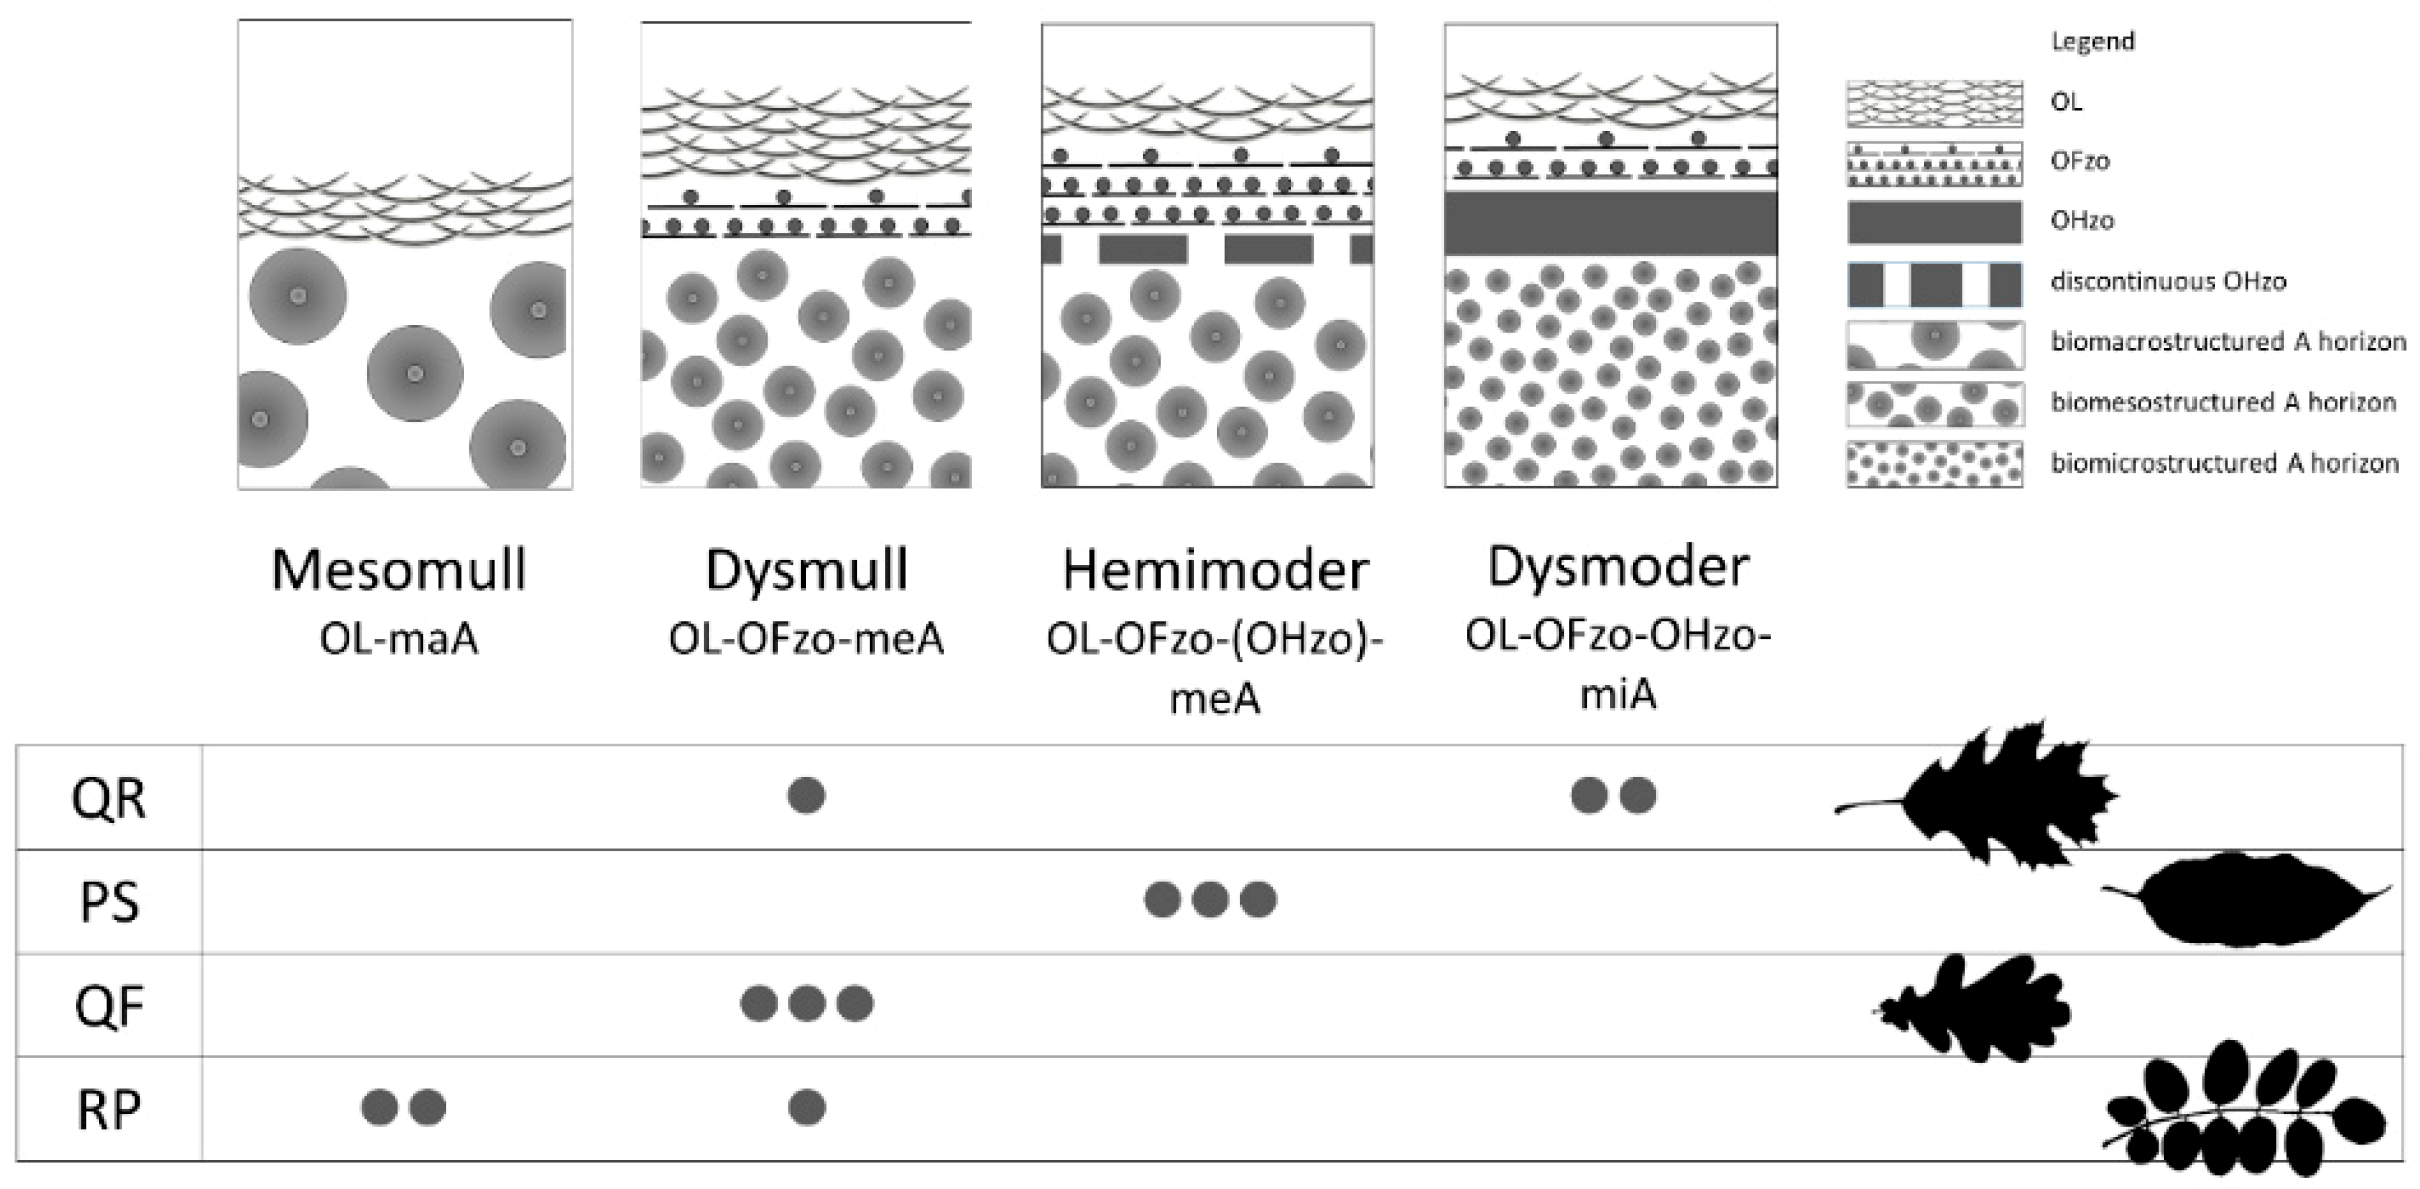
3.1.1. Humus Forms

The main humus forms found in the study plots were, in order of decreasing biological activity, Mull and Moder (Figure 1).
The QF and RP plots were characterized by Mull forms: Dysmull for QF, Mesomull and Dysmull for RP (Humind equal to 4.0 and 2.7 ± 0.7 for QF and RP, respectively; Figure 2a). Dysmoder was the main form found in the QR plots, except for one plot, where Dysmull was present (average Humind of 6.0 ± 1.0). PS plots were characterized by the Hemimoder form (Humind of 5).
The higher SOCOrg (Figure 2b) was found in the Moder forms of QR and PS. The average SOCOrg at QR was significantly higher than the average SOCOrg at QF and RP (F3,8 = 5.12; p = 0.025 and p = 0.009, respectively), while non-significant differences were found with PS. The lower SOCOrg was found in the RP plots, and it was comparable with values at the QF plots and significantly different from QR and PS (F3,8 = 5.12; p = 0.077).
The OH horizons were found only at QR and PS, characterized by an average SOCorg of 0.19 ± 0.15 kg m−2 and 0.41 ± 0.31 kg m−2 in PS and QR, respectively.
The differences between the woodlands also concerned the type of organic matter, as shown by the CN values (Figure 2c–d). In particular, at QR, the average CNOL was statistically higher (F3,8 = 4.48; p = 0.0399) than that of all the other woodland types. CN was lower in the OF horizon. The values at QF and QR were statistically higher than CNOF at RP (F3,8 = 5.017; p = 0.026 and 0.011, respectively), and the CNOF of QR was also marginally different from that at PS (F3,8 = 5.017; p = 0.055).

3.1.2. Mineral Soil

The soils almost always showed an A horizon of approximately 5 cm thick, followed by a AB or BA transition horizon up to 20–25 cm and often by a Bw up to 30–60 cm; below, a C horizon was present. From the taxonomic point of view (IUSS Working Group WRB, 2015), the first two horizons together reached the properties of an umbric diagnostic horizon, while the B horizon was often a cambic horizon.
The soils of investigated plots were Cambisols and Umbrisols. They are all moderately developed soils, with low BS except for RP stands, sandy loam soil texture, high rock fragment content and OC-rich topsoil.
Considering the whole investigated thickness, the soils showed a SOCmin with no statistical difference among woodland types. Approximately one third of SOC was in the first investigated layer (Supplementary Materials Figure S2b–d).
The main statistically significant differences (p < 0.05) in soil properties among woodland types concerned pHmin, CNmin, BS, CEC and Mg and Ca cation content (Figure 2). The pHmin was significantly lower at QF, QR and PS than at RP.
QF and QR showed similar CNmin values, higher than those at PS and RP (Figure 2e) F3,8 = 7.721, p < 0.05). All the forest types were characterized by very low BS (<35%) except for RP (35–50%) that showed higher values compared to the other forest stands (Figure 2h). The CEC showed medium values in all the forest types and higher values at PS (Figure 2i). In this woodland type, exchangeable Ca and Mg were higher than at QF and QR, but not significantly at RP for Ca (Figure 2f–g).
The exchangeable K content was similar for all the woodland types averaging to 0.2 ± 0.03 cmol(+) kg−1 (Supplementary Materials Figure S2g).

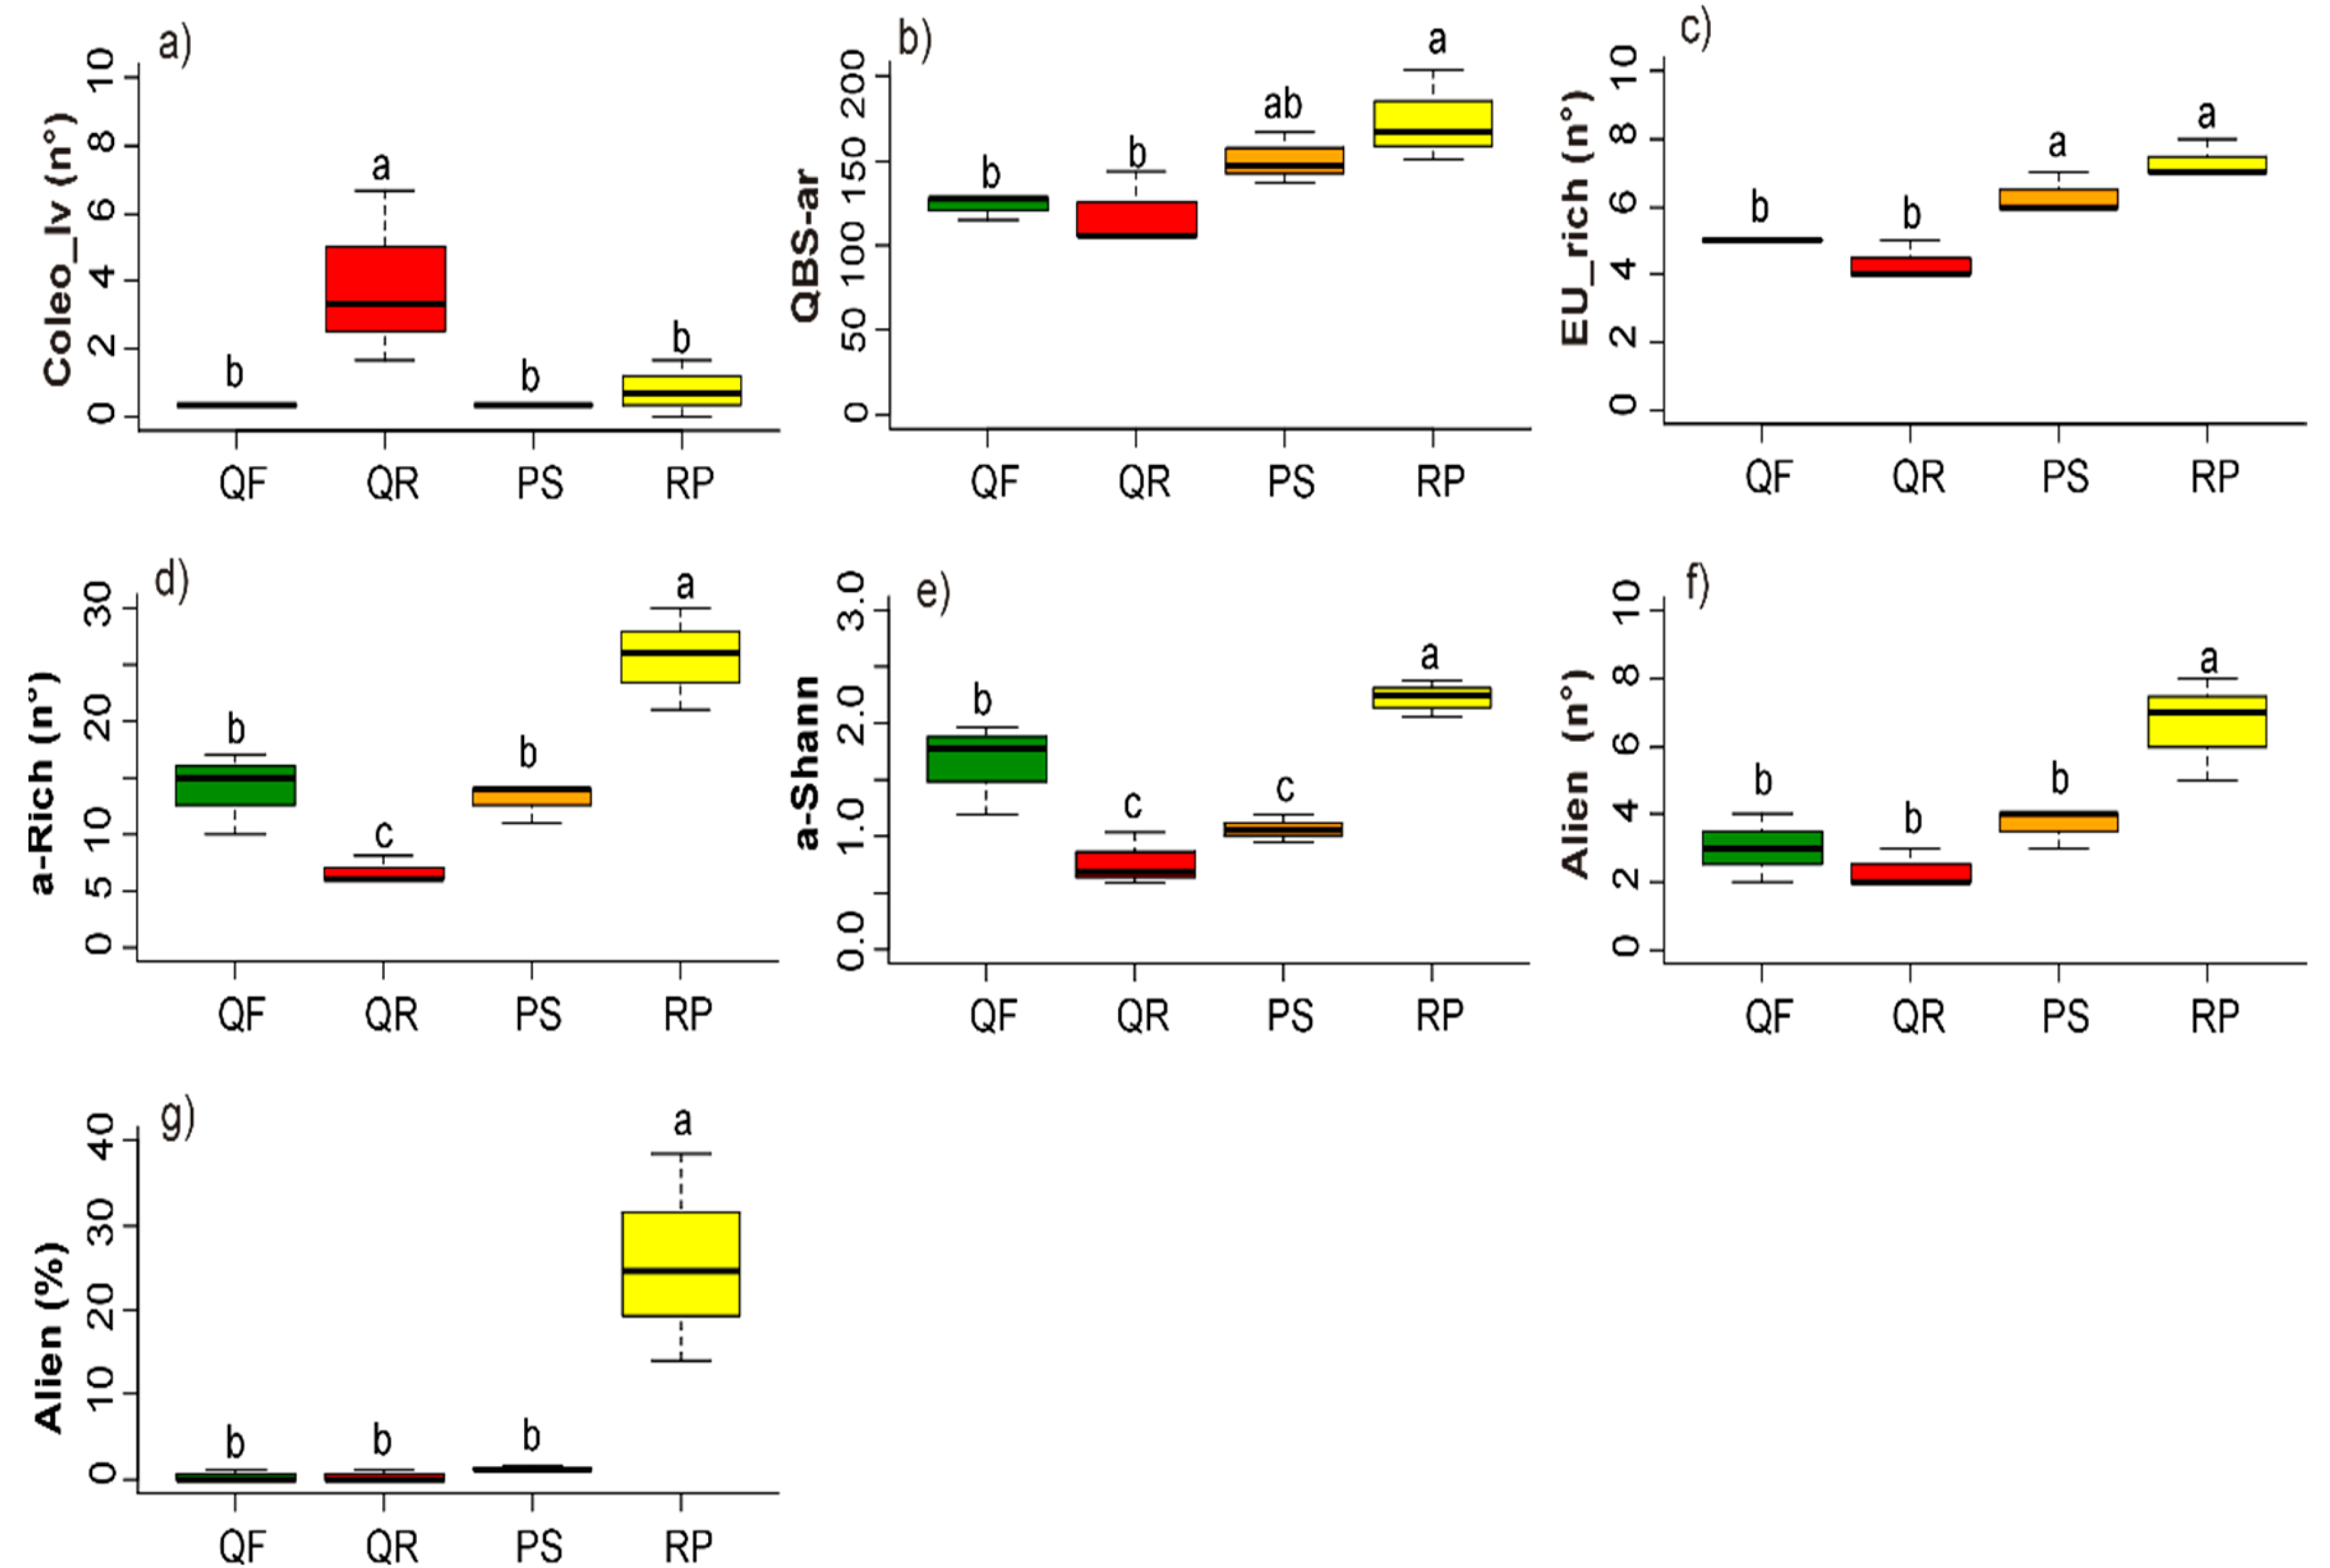
3.2. Soil Biotic Characteristics

From the microbiological point of view, no significant differences were found among the forest types for both the soil respiration and bacteria count (Supplementary Materials Figure S2).
With regard to microarthropod communities, more than 8100 organisms, belonging to 17 taxa, were extracted from the soil samples, collected in May 2016 (Supplementary Materials Table S2). The euedaphic arthropod diversity, expressed as the number of taxa that are well-adapted to the soil environment, was the highest in RP, with no difference with PS, and lower in QF and QR (F3,8 = 21.67; p < 0.001; Figure 3a–c). The mean number of Coleoptera larvae was the highest in QR (F3,8 = 4.921; p = 0.032). No differences were detected in Collembola, Pauropoda, Protura and Symphyla abundance. However, it should be noted that, for the euedaphic taxa of Protura and Symphyla, QR resulted in no individuals at all and in a mean that was considerably lower than the other woodland types (Supplementary Materials Table S2). The soil quality, evaluated by the QBS-ar index, was higher in RP, compared with the other forest types (F3,8 = 5.322; p = 0.026).

3.3. Plant Community

This study identified 82 species which were recorded within the plots and surveyed during May–July 2016. The plant diversity was different among the studied woodlands (Figure 3d–g). The highest values of α- (richness and Shannon) and γ- diversity were in RP, and the lowest were in QR (richness: F3,8 = 19.89; p < 0.001; Shannon: F3,8 = 19.29; p < 0.001; γ: absolute value). The number of alien species and the alien species cover were the highest in RP (F3,8 = 10.97; p < 0.01; F3,8 = 12.42; p < 0.001, respectively). No differences in the β-diversity, number of individuals of the indicator species, Polygonatum multiflorum, and the number and cover of the typical forest herb species were detected among the woodlands (Supplementary Materials Figure S2).

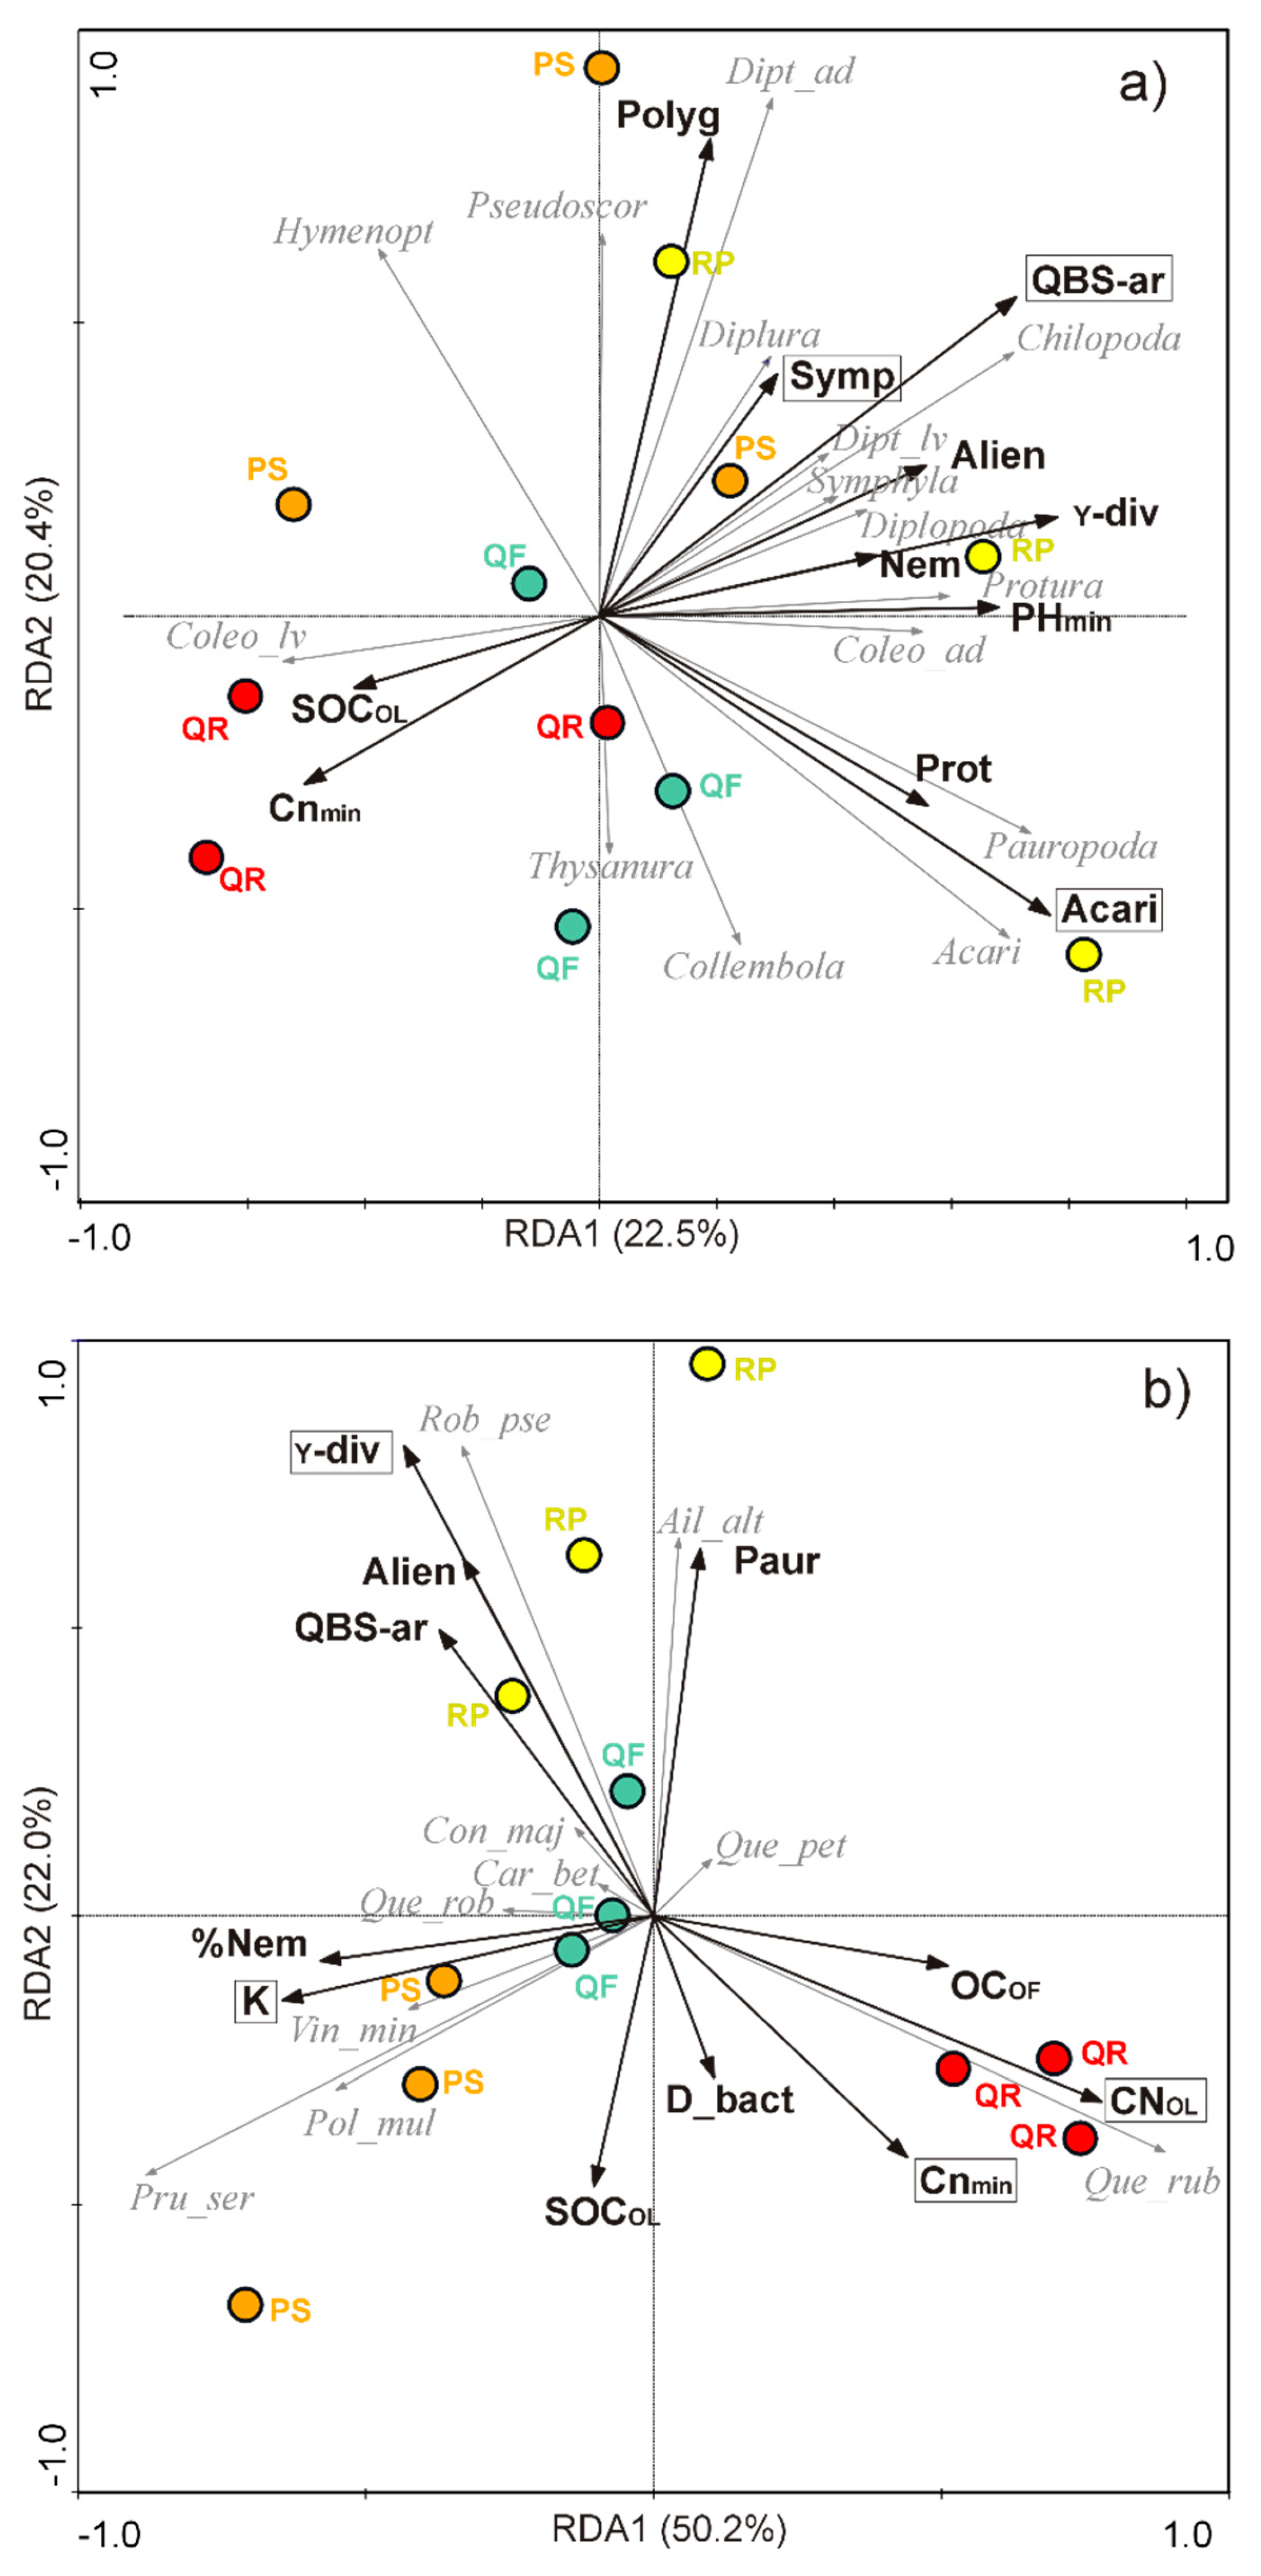
3.4. Relationships between Biotic Communities and Ecological Determinants

The RDA analyses (Figure 4a,b) indicated that several ecological determinants were associated with the different woodland types in relation to the biotic communities (microarthropods and plants). The RDA ordinations resulted in high eigenvalues and cumulative percentage variances in the species–environment data, which are indicative of the distinctive species assemblages across the different woodland types (Table 2). Particularly, the biplots of the first three axes accounted for 57.7% and 82.6% of this variance for the microarthropod and plant communities, respectively.
Concerning the microarthropod assemblage (Figure 4a, Table 2a), QBS-ar and the Acari abundance accounted for the highest level of variance (19% each) and greatly varied across forest types (QBS-ar: F = 2.62; p = 0.001; Acari: F = 2.41; p = 0.005). In addition, the Symphyla abundance explained significant amounts of variance (0.11%; F = 1.87; p = 0.050). The main gradient exhibited positive scores of the above-mentioned variables for the RP stands and negative scores for the QR stands.
Concerning the plant assemblage (Figure 4b, Table 2b), the woodland types varied in CNOL (F = 4.89; p = 0.001; 33% of explained variance) and CNmin (F = 2.38; p = 0.042). Both factors were positively associated with QR and negatively associated with RP stands. The concentration of K in the soil was significant (F = 2.95; p = 0.037) and was associated with PS stands. Among the biotic factors, the different woodlands greatly differed in the total number of plant species (γ-div: variance of 16%; F = 3.56; p = 0.001), and a positive association with RP stands was evident. Again, the main gradient exhibited positive and negative scores of the variables for the RP and QR stands, respectively.
A significant correlation between the selected variables was found in 46 out of 264 possible combinations, explaining the variation across the dataset (Figure 5; Supplementary Materials Table S1). Among the other variables, some strong correlations (correlation coefficient > 0.7; and significance ≤ 0.01) were identified between ecosystem components (Figure 5). For instance, CNmin was negatively correlated with Alien richness; CNmin and CNOL were negatively correlated with Eu_rich (Euedaphic arthropod taxa α-diversity); and QBS-ar was positively correlated with the pH value and negatively correlated with CNOL.

4. Discussion

This work examined how Q. rubra, P. serotina and R. pseudoacacia affected soil properties and ecosystem components of native forests dominated by the trees, Q. robur and C. betulus. The three IAPS are associated with a series of abiotic and biotic ecological alterations, affecting, in different ways and degree, the resident forest ecosystem.
While it is acknowledged that the sample size in this study is low, and to some extent, the data analysis could be affected by the effect of the individual sites, the authors underline that this sampling strategy considered only those forest sites falling in the same pedological landscape unit (i.e., with a particular geological origin, landform, topography, hydrography, historical land use and soil type; see: [47]). Thus, the studied sites shared very similar chemical-physical soil characteristics until vegetation replacement, which allowed the containment of the site effect and the investment of sampling efforts in comparing different ecosystem components in terms of a greater number of invaded forest types.

4.1. Soil Abiotic Characteristics: Humus Forms

The major changes in soil characteristics mainly involved the organic layers. The substitution of native forests by P. serotina and Q. rubra resulted in a shift toward a less active humus form, from Dysmull to Hemimoder and Dysmoder, respectively, as a consequence of organic matter that did not decompose as easily [48]. Conversely, RP produced litter that rapidly decomposed, resulting in the more active Mesomull form, compared to native forests. Leaf litter C:N and polyphenolic compounds, such as tannins, were linked to the rate of leaf litter decomposition [49,50]. The action of tannins, whose content in the leaves of red oak and black cherry is higher than in common oak [51], depends on the species. Further, [52] observed that the litter tannins of Q. rubra are important for lowering the rate of soil-nutrient cycling to a greater extent than the tannins of other species.
Litter quantity and quality influence the litter decomposition rate and the dynamics of nutrient mineralization and immobilization [53], which, in turn, may affect the microbial decomposer and detritivore communities [54] that are directly involved in litter decomposition. The observed sequences and CN values across organic horizons supported the different turnover of organic matter among woodlands, showing the capacity of the organic layers of QR stands to act as a carbon sink.

4.2. Soil Abiotic Factors: Mineral Soil Properties

The forest substitutions also impacted the mineral soil, although to a lesser extent than the organic layers. Forest types affected the soil organic matter quality, as shown by the lower soil CNmin in PS and RP (absolute lowest value), compared to QF and QR stands. Rice et al. (2004) demonstrated that due to an elevated organic matter mineralization rate (low C:N) in the topsoil, R. pseudoacacia stands had a higher nitrogen concentration than stands dominated by other species, such as pine and oak. The organic matter mineralization in R. pseudoacacia is also favored by lower levels of canopy cover and, consequently, a higher soil temperature compared to the conditions under a very dense canopy, for instance, those of QR. Previous studies demonstrated that P. serotina can modify N and C cycles, increasing carbon turnover via a fast decomposition of litter and humus formation, accelerating nutrient circulation at the ecosystem level in comparison to native forest stands [18,51,55]. In this study, such effects of PS stands were less evident, and they generally showed an intermediate behavior between QR and QF.
The impact on the chemical properties of the topsoil exhibited species-specific patterns so that increasing contents of exchangeable Ca, Mg and K, as well as higher CEC or BS values, were mostly associated with RP and PS. RP stands exhibited a higher level of Ca than QF stands, as already observed by [56]. Similarly, [57] reported that R. pseudoacacia soils had elevated Ca levels. In the PS stands, the Ca content in the soil was similar to that in the RP stands and was much higher than the content observed by [18]. The soils at the QF and QR sites had a similar exchangeable Ca cation content, likely indicating similar pedoclimatic conditions. This pattern is in accordance with previous studies [19,50].
The authors claim that the similarities and differences in soil nutrients across different studies have to be interpreted in consideration of the confounding factors that can be present in the soil exchange complex. For instance, since the availability of some plant nutrients is greatly affected by soil pH [58], the variation in soil pH may explain the differences between the nutrient/micronutrient content presented in this study and that detected by [18,50]. For such reasons, the variations in soil elements across sites, invaded and uninvaded by IAPS, should be assessed and interpreted with caution.

4.3. Biotic Factors: Microarthropod and Plant Communities

Concerning the biotic components of the ecosystem, our results highlighted that RP and QR exhibited (as a general rule) the highest and the smallest biodiversity values, respectively, while QF and PS showed intermediate values. On the whole, the dominance of Q. rubra in forest ecosystems was found to negatively impact the biotic components of native forests, such as Acari densities pH [59], micromycetes and ammonifying microorganisms [60], and plant communities pH [21,61]. In this study, Q. rubra stands were characterized by a low-quality litter layer (e.g., a high C:N ratio) and low cover of a few herbaceous species that have likely negatively influenced the microarthropod community, as shown by the low number of eudaphic taxa, such as Acari, Protura and Symphyla. Indeed, litter quality is considered one of the most important factors determining soil fauna assemblages [62]. Recalcitrant litter requires a peculiar decomposer system [63]. Moreover, the simplification of the vegetation structure and composition could affect groups of herbivores and predators [64].
In our results, the microarthropod soil biological quality index, QBS-ar, showed the highest values in RP forest soil (with no differences from that in PS). This result is in contrast with the findings of [56], who reported a higher QBS-ar value in native Quercus stands than in stands invaded by R. pseudoacacia. This discrepancy can be due to differences in: (1) The biogeographical and pedological characteristics of the two study areas (i.e., Mediteranean and Continental regions); (2) past forest management of the sampling sites (e.g., logging and coppicing); (3) dominant native trees that, in [56], consisted of different Quercus species (Q. cerris L. and Q. pubescens Willd.). It is known how the differences in environmental conditions across the sampling sites can influence the arthropods abundance [64]. Indeed, most studies reported the negative effects of invasive species on arthropod communities [65]. However, research on detritivores showed an increase, or the stability, of this functional group in forests invaded by alien trees [64], which is probably due to the higher quality and larger amount of the litter [62,66]. Similarly, our RP stands hosted a high number of euedaphic taxa that feed on plant material and detritus, fungi and bacteria, such as Acari, Collembola, Protura, Symphila and Pauropoda, which may not have been negatively influenced by the presence of the IAPS.
Our results concerning the soil fauna in the different woodland types are related to the litter quality. However, as responses of microarthropods groups to the soil factors complex are very variable and poorly understood [64,67], further investigations are certainly needed.
With regard to the total number of herb forest species (richness and Shannon), this study (RDA and ANOVA results) is, as a general rule, in accordance with previous findings. Specifically, Q. rubra has a negative effect on the number and cover of herbaceous species, which is related to the slow decomposition of the litter layer [61]. Similarly, P. serotina has an overall negative effect on the structure and composition of native plant communities [15]. However, in our results (of RDA) and in previous studies, it has also been associated with forest stands that are rich in native species [68] (i.e., C. majalis, P. multiflorum, V. minor, etc.). However, in this study, no difference in typical forest herb species were detected across different wood types, probably due to the ability of perennial species (with rhizomes and bulbs) to resist disturbance and soil modifications.
On the other hand, R. pseudacacia has been reported to have a positive effect on the cover of generalist (nitrophilous, ruderal and alien) and graminoid species, which seem to slow down forest succession and regeneration of native trees [68,69], and this is consistent with our results. Indeed, the number of native species noted under the R. pseudoacacia canopy may be even higher than in natural forests. However, the species composition may differ significantly from the species list of natural forest communities [70].
Across woodland types, no differences or trends were detected with regard to bacterial activity (abundance and soil respiration), which, generally, can vary among sites dominated by different IAPS [71]. Further analysis of the composition of bacteria communities may better explain these first observations.

5. Conclusions

The investigations regarding the impacts of IAPS on ecosystem components are often only based on a single invasive species. This comparative study of three alien species (P. serotina, Q. rubra, and R. pseudoacacia), listed among the worst IAPS, improves our understanding of the changes in ecological factors that accompany the establishment of alien species. These IAPS can impact forest ecosystems in terms of humus forms, carbon and nutrient cycles, and species composition and abundance (plant and microarthropod communities). Particularly, Q. rubra was associated with the major negative impacts on organic layers and exhibited low/modified levels of microarthropod and plant biodiversity. In the long term, the invasion of the studied species, especially P. serotina and Q. rubra, are expected to further weaken forest ecosystems, which are already under pressure due to global change and forest fragmentation. Particularly, many native species may be replaced or lost due to the invasion of these alien species. Indeed, across Europe, both species have been reported to have greatly replaced native forests.
Future research on the impact of IAPS on forest ecosystems in highly anthropized regions should include multiple stressors, such as forest management and the degree of anthropic pressure. This could be useful in implementing appropriate and targeted management strategies to combat IAPS.

Supplementary Materials

The following are available online at https://www.mdpi.com/1999-4907/10/10/842/s1.

Author Contributions

R.G., C.F., R.C., E.C., and S.C. conceived the idea and the sampling design. R.G., C.F., E.C. led the writing of the manuscript and of the statistical analyses. R.G., C.F., R.C., E.C., C.M., and G.B. participated in the field data collection for the different abiotic and biotic ecosystem components. All authors critically contributed to the paper and approved the final version for publication.

Funding

This research was partially funded by the LIFE financial instrument of the European Commission to Lombardy Region LIFE14 IPE IT 018GESTIRE2020-Nature Integrated Management in 2020.

Acknowledgments

We wish to thank M. Cuda, C. Agostinelli and D. Abu El Khair for their help during field and laboratory work.

Conflicts of Interest

The authors declare no conflict of interest.

References

  1. Ehrenfeld, J.G. Ecosystem consequences of biological invasions. Annu. Rev. Ecol. Evol. Syst. 2010, 41, 59–80. [Google Scholar] [CrossRef]
  2. Hejda, M.; Pyšek, P.; Jarošík, V. Impact of invasive plants on the species richness, diversity and composition of invaded communities. J. Ecol. 2009, 97, 393–403. [Google Scholar] [CrossRef]
  3. Mollot, G.; Pantel, J.H.; Romanuk, T.N. Chapter Two—The effects of invasive species on the decline in species richness: A global meta-analysis. Adv. Ecol. Res. 2017, 56, 61–83. [Google Scholar] [CrossRef]
  4. Elgersma, J.J.; Ehrenfeld, J.G. Linear and non-linear impacts of a non-native plant invasion on soil microbial community structure and function. Biol. Invasions 2011, 13, 757–768. [Google Scholar] [CrossRef]
  5. Suding, K.N.; Stanley Harpole, W.; Fukami, T.; Kulmatiski, A.; MacDougall, A.S.; Stein, C.; van der Putten, W.H. Consequences of plant–soil feedbacks in invasion. J. Ecol. 2013, 101, 298–308. [Google Scholar] [CrossRef]
  6. Vilá, M.; Espinar, J.L.; Hejda, M.; Hulme, P.E.; Jarošík, V.; Maron, J.L.; Pergl, J.; Schaffner, U.; Sun, Y.; Pyšek, P. Ecological impacts of invasive alien plants: A meta-analysis of their effects on species, communities and ecosystems. Ecol. Lett. 2011, 14, 702–708. [Google Scholar] [CrossRef]
  7. Mincheva, T.; Barni, E.; Varese, G.C.; Brusa, G.; Cerabolini, B.; Siniscalco, C. Litter quality, decomposition rates and saprotrophic mycoflora in Fallopia japonica (Houtt.) Ronse Decraene and in adjacent native grassland vegetation. Acta Oecol. 2014, 54, 29–35. [Google Scholar] [CrossRef]
  8. Dassonville, N.; Vanderhoeven, S.; Vanparys, V.; Hayez, M.; Gruber, W.; Meerts, P. Impacts of alien invasive plants on soil nutrients are correlated with initial site conditions in NW Europe. Oecologia 2008, 157, 131–140. [Google Scholar] [CrossRef]
  9. Panetta, F.D.; Gooden, B. Managing for biodiversity: Impact and action thresholds for invasive plants in natural ecosystems. NeoBiota 2017, 34, 53–66. [Google Scholar] [CrossRef]
  10. Callaway, R.M.; Bedmar, E.J.; Reinhart, K.O.; Silvan, C.G.; Klironomos, J. Effects of soil biota from different ranges on Robinia invasion: Acquiring mutualists and escaping pathogens. Ecology 2011, 92, 1027–1035. [Google Scholar] [CrossRef]
  11. Brundu, G.; Richardson, D.M. Planted forests and invasive alien trees in Europe: A Code for managing existing and future plantings to mitigate the risk of negative impacts from invasions. NeoBiota 2016, 30, 5–47. [Google Scholar] [CrossRef]
  12. Godefroid, S.; Phartyal, S.S.; Weyembergh, G.; Koedam, N. 2005. Ecological factors controlling the abundance of non-native invasive black cherry (Prunus serotina) in deciduous forest understory in Belgium. For. Ecol. Manag. 2005, 210, 91–105. [Google Scholar] [CrossRef]
  13. Kawaletz, H.; Mölder, I.; Zerbe, S.; Annighöfer, P.; Terwei, A.; Ammer, C. Exotic tree seedlings are much more competitive than natives but show underyielding when growing together. J. Plant Ecol. 2013, 6, 305–315. [Google Scholar] [CrossRef]
  14. Major, K.C.; Nosko, P.; Kuehne, C.; Campbell, D.; Bauhus, J. Regeneration dynamics of non-native northern red oak (Quercus rubra L.) populations as influenced by environmental factors: A case study in managed hardwood forests of southwestern Germany. For. Ecol. Manag. 2013, 291, 144–153. [Google Scholar] [CrossRef]
  15. Halarewicz, A.; Żołnierz, L. Changes in the understorey of mixed coniferous forest plant communities dominated by the American black cherry (Prunus serotina Ehrh.). For. Ecol. Manag. 2014, 313, 91–97. [Google Scholar] [CrossRef]
  16. Sádlo, J.; Vítková, M.; Pergl, J.; Pyšek, P. Towards site-specific management of invasive alien trees based on the assessment of their impacts: The case of Robinia pseudoacacia. NeoBiota 2017, 35, 1–34. [Google Scholar] [CrossRef]
  17. Woziwoda, B.; Krzyżanowska, A.; Dyderski, M.K.; Jagodziński, A.M.; Stefańska-Krzaczek, E. Propagule pressure, presence of roads, and microsite variability influence dispersal of introduced Quercus rubra in temperate Pinus sylvestris forest. For. Ecol. Manag. 2018, 428, 35–45. [Google Scholar] [CrossRef]
  18. Aerts, R.; Ewald, M.; Nicolas, M.; Piat, J.; Skowronek, S.; Lenoir, J.; Hattab, T.; Garzón-López, C.X.; Feilhauer, H.; Schmidtlein, S.; et al. Invasion by the alien tree Prunus serotina alters ecosystem functions in a temperate deciduous forest. Front. Plant Sci. 2017, 8, 179. [Google Scholar] [CrossRef]
  19. Miltner, S.; Kupka, I.; Třeštík, M. Effects of Northern red oak (Quercus rubra L.) and sessile oak (Quercus petraea (Mattusch.) Liebl.) on the forest soil chemical properties. For. J. 2016, 62, 169–172. [Google Scholar] [CrossRef]
  20. Medina-Villar, S.; Castro-Díez, P.; Alonso, A.; Cabra-Rivas, I.; Parker, I.M.; Pérez-Corona, E. Do the invasive trees, Ailanthus altissima and Robinia pseudoacacia, alter litterfall dynamics and soil properties of riparian ecosystems in Central Spain? Plant Soil 2015, 396, 311–324. [Google Scholar] [CrossRef]
  21. Woziwoda, B.; Kopeć, D.; Witkowski, J. The negative impact of intentionally introduced Quercus rubra L. on a forest community. Acta Soc. Bot. Pol. 2014, 83, 39–49. [Google Scholar] [CrossRef]
  22. Vítková, M.; Müllerová, J.; Sádlo, J.; Pergl, J.; Pyšek, P. Black locust (Robinia pseudoacacia) beloved and despised: A story of an invasive tree in Central Europe. For. Ecol. Manag. 2017, 384, 287–302. [Google Scholar] [CrossRef] [PubMed]
  23. Sitzia, T.; Campagnaro, T.; Dainese, M.; Cierjacks, A. Plant species diversity in alien black locust stands: A paired comparison with native stands across a north-Mediterranean range expansion. For. Ecol. Manag. 2012, 285, 85–91. [Google Scholar] [CrossRef]
  24. Dyderski, M.K.; Jagodziński, A.M. Drivers of invasive tree and shrub natural regeneration in temperate forests. Biol. Invasions 2018, 20, 2363–2379. [Google Scholar] [CrossRef] [Green Version]
  25. Dyderski, M.K.; Jagodziński, A.M. Low impact of disturbance on ecological success of invasive tree and shrub species in temperate forests. Plant Ecol. 2018, 219, 1369–1380. [Google Scholar] [CrossRef] [Green Version]
  26. Dyderski, M.K.; Jagodziński, A.M. Functional traits of acquisitive invasive woody species differ from conservative invasive and native species. NeoBiota 2019, 41, 91–113. [Google Scholar] [CrossRef]
  27. Blasi, C. (Ed.) La Vegetazione D’Italia Con Carta Delle Serie di Vegetazione in Scala 1:500000; Palombi & Partner S.r.L.: Roma, Italy, 2010. [Google Scholar]
  28. Ciancio, O.; Mercurio, R.; Nocentini, S. La sperimentazione di specie forestali esotiche in Italia, Risultati dopo un sessantennio. Ann. Ist. Sper. Selvic. 1982, 12–13, 105–713. [Google Scholar]
  29. ERSAF. Carta Dei Suoli Della Lombardia, Scala 1:250000; Regione Lombardia: Milano, Italy, 2004. [Google Scholar]
  30. D’Alessio, D.; Febelli, C. I Suoli Della Pianura Milanese Settentrionale; ERSAL: Milano, Italy, 1999; p. 147. [Google Scholar]
  31. IUSS Working Group WRB. World Reference Base for Soil Resources 2014, International Soil Classification System for Naming Soils and Creating Legends for Soil Maps, Update 2015; FAO: Roma, Italy, 2015. [Google Scholar]
  32. Burt, R. Soil Survey Laboratory Methods Manual, NSS Laboratory Soil Survey Investigations; Report. No. 42; US Department of Agriculture, Natural Resource Conservation Service: Washington, DC, USA, 2012. Available online: https://www.nrcs.usda.gov/ (accessed on 12 August 2019).
  33. Bray, R.H.; Kurtz, L.T. Determination of total organic and available forms of phosphorus in soils. Soil Sci. 1945, 59, 39–45. [Google Scholar] [CrossRef]
  34. Olsen, S.R.; Cole, C.V.; Watanabe, F.S.; Dean, L.A. Estimation of Available Phosphorus in Soils by Extraction with Sodium Bicarbonate; USDA: Washington, DC, USA, 1954.
  35. Zanella, A.; Ponge, J.F.; Jabiol, B.; Sartori, G.; Kolb, E.; Le Bayon, R.C.; Gobat, J.M.; Aubert, M.; De Waal, R.; Van Delft, B.; et al. Humusica 1, article 5: Terrestrial humus systems and forms—Keys of classification of humus systems and forms. Appl. Soil Ecol. 2018, 122, 75–86. [Google Scholar] [CrossRef]
  36. Ponge, J.F.; Chevalier, R.; Loussot, P. Humus index: An integrated tool for the assessment of forest floor and topsoil properties. Soil Sci. Soc. Am. J. 2002, 66, 1996–2001. [Google Scholar] [CrossRef]
  37. Korkina, I.N.; Vorobeichik, E.L. The humus index: A promising tool for environmental monitoring. Russ. J. Ecol. 2016, 47, 526–531. [Google Scholar] [CrossRef]
  38. Isermeyer, H. Eine einfache Methode zur Bestimmung der Bodenatmung und der Carbonate im Boden. Z. Pflanzenernähr. Düng. Bodenkd. 1952, 56, 26–38. [Google Scholar] [CrossRef]
  39. Jäggi, W. Die Bestimmung der CO2-Bildung als Maß der bodenbiologischen Aktivität. Schw. Landw. Forsch. 1976, 15, 371–380. [Google Scholar]
  40. Parisi, V.; Menta, C.; Gardi, C.; Jacomini, C.; Mozzanica, E. Microarthropod communities as a tool to assess soil quality and biodiversity: A new approach in Italy. Agric. Ecosyst. Environ. 2005, 105, 323–333. [Google Scholar] [CrossRef]
  41. Menta, C.; Contia, F.D.; Pinto, S.; Leoni, A.; Lozano-Fondón, C. Monitoring soil restoration in an open-pit mine in northern Italy. Appl. Soil Ecol. 2014, 83, 22–29. [Google Scholar] [CrossRef]
  42. Faul, F.; Erdfelder, E.; Lang, A.G.; Buchner, A. G*Power 3: A flexible statistical power analysis program for the social, behavioral, and biomedical sciences. Behav. Res. Methods 2007, 39, 175–191. [Google Scholar] [CrossRef] [PubMed]
  43. Perez-Riverol, Y.; Kuhn, M.; Vizcaíno, J.A.; Hitz, M.P.; Audain, E. Accurate and fast feature selection workflow for high-dimensional omics data. PLoS ONE 2017, 12, e0189875. [Google Scholar] [CrossRef]
  44. R Core Team. R: A Language and Environment for Statistical Computing. R Foundation for Statistical Computing; R Core Team: Vienna, Austria, 2016. Available online: https://www.R-project.org/ (accessed on 12 August 2019).
  45. Fox, J.; Friendly, M.; Weisberg, S. Hypothesis tests for multivariate linear models using the car package. R J. 2013, 5, 39–52. [Google Scholar] [CrossRef]
  46. Wei, T.; Simko, V. R Package “Corrplot”: Visualization of a Correlation Matrix (Version 0.84). Available online: https://github.com/taiyun/corrplot/ (accessed on 28 August 2019).
  47. Zink, J.A. The Pedologic Landscape: Organization of the Soil Material. In Geopedology; Zinck, J.A., Metternicht, G., Bocco, G., Del Valle, H.F., Eds.; Springer: Cham, Switzerland, 2016. [Google Scholar]
  48. Jonczak, J.; Parzych, A.; Sobisz, Z. Decomposition of four tree species leaf litters in headwater riparian forest. Balt. For. 2015, 21, 133–143. [Google Scholar]
  49. Steffen, K.T.; Cajthaml, T.; Snajdr, J.; Baldrian, P. Differential degradation of oak (Quercus petraea) leaf litter by litter-decomposing basidiomycetes. Res. Microbiol. 2007, 158, 447–455. [Google Scholar] [CrossRef]
  50. Bonifacio, E.; Petrillo, M.; Petrella, F.; Tambone, F.; Celi, L. Alien red oak affects soil organic matter cycling and nutrient availability in low-fertility well-developed soils. Plant Soil 2015, 395, 215–229. [Google Scholar] [CrossRef]
  51. Lorenz, K.; Preston, C.M.; Krumrei, S.; Feger, K.H. Decomposition of needle/leaf litter from Scots pine, black cherry, common oak and European beech at a conurbation forest site. Eur. J. For. Res. 2004, 123, 177–188. [Google Scholar] [CrossRef]
  52. Talbot, J.M.; Finzi, A.C. Differential effects of sugar maple, red oak, and hemlock tannins on carbon and nitrogen cycling in temperate forest soils. Oecologia 2008, 155, 583–592. [Google Scholar] [CrossRef] [PubMed]
  53. Regina, S.I.; Tarazona, T. Nutrient cycling in a natural beech forest and adjacent planted pine in northern Spain. Forestry 2001, 74, 11–28. [Google Scholar] [CrossRef]
  54. Graça, M.A.S.; Poquet, J.M. Do climate and soil influence phenotypic variability in leaf litter, microbial decomposition and shredder consumption? Oecologia 2014, 174, 1021–1032. [Google Scholar] [CrossRef] [PubMed]
  55. Aragón, R.; Montti, L.; Ayup, M.M.; Fernández, R. Exotic species as modifiers of ecosystem processes: Litter decomposition in native and invaded secondary forests of NW Argentina. Acta Oecol. 2014, 54, 21–28. [Google Scholar] [CrossRef]
  56. Lazzaro, L.; Mazza, G.; d’Errico, G.; Fabiani, A.; Giuliani, C.; Inghilesi, A.F.; Lagomarsino, A.; Lastrucci, L.; Pastorelli, R.; Roversi, P.F.; et al. How ecosystems change following invasion by Robinia pseudoacacia: Insights from soil chemical properties and soil microbial, nematode, microarthropod and plant communities. Sci. Total Environ. 2018, 622, 1509–1518. [Google Scholar] [CrossRef] [PubMed]
  57. Rice, S.K.; Westerman, B.; Federici, R. Impacts of the exotic, nitrogen-fixing black locust (Robinia pseudoacacia) on nitrogen-cycling in a pine–oak ecosystem. Plant Ecol. 2004, 174, 97–107. [Google Scholar] [CrossRef]
  58. Barber, S.A. Soil Nutrient Bioavailability: A Mechanistic Approach; John Wiley and Sons: New York, NY, USA, 1995. [Google Scholar]
  59. Kohyt, J.; Skubała, P. Communities of mites (Acari) in litter and soil under the invasive red oak (Quercus rubra L.) and native pedunculate oak (Q. robur L.). Biol. Lett. 2013, 50, 111–124. [Google Scholar] [CrossRef]
  60. Riepšas, E.; Straigytė, L. Invasiveness and ecological effects of red oak (Quercus rubra L.) in Lithuanian Forests. Balt. For. 2008, 14, 122–130. [Google Scholar]
  61. Chmura, D. Impact of alien tree species Quercus rubra L. on understorey environment and flora: A study of the Silesian upland (Southern Poland). Pol. J. Ecol. 2013, 61, 431–442. [Google Scholar]
  62. Bedano, J.C.; Sacchi, L.; Natale, E.; Reinoso, H. Saltcedar (Tamarix ramosissima) Invasion Alters Decomposer Fauna and Plant Litter Decomposition in a Temperate Xerophytic Deciduous Forest. Adv. Ecol. 2014. [Google Scholar] [CrossRef]
  63. Gergócs, V.; Hufnagel, L. The effect of microarthropods on litter decomposition depends on litter quality. Eur. J. Soil Biol. 2016, 75, 24–30. [Google Scholar] [CrossRef]
  64. Litt, A.R.; Cord, E.E.; Fulbright, T.E.; Schuster, G.L. Effects of invasive plants on arthropods. Conserv. Biol. 2014, 28, 1532–1549. [Google Scholar] [CrossRef] [PubMed]
  65. Spafford, R.D.; Lortie, C.J.; Butterfield, B.J. A systematic review of arthropod community diversity in association with invasive plants. NeoBiota 2013, 16, 81–102. [Google Scholar] [CrossRef] [Green Version]
  66. Levin, L.A.; Neira, C.; Grosholz, E.D. Invasive cordgrass modified wetland trophic function. Ecology 2006, 87, 419–432. [Google Scholar] [CrossRef]
  67. Wolkovich, E.M.; Bolger, D.T.; Holway, D.A. Complex responses to invasive grass litter by ground arthropods in a Mediterranean scrub ecosystem. Oecologia 2009, 161, 697–708. [Google Scholar] [CrossRef] [Green Version]
  68. Terwei, A.; Zerbe, S.; Mölder, I.; Annigöhfer, P.; Kawaletz, H.; Ammer, C. Response of floodplain understorey species to environmental gradients and tree invasion: A functional trait perspective. Biol. Invasions 2016, 18, 2951–2973. [Google Scholar] [CrossRef]
  69. Slabejová, D.; Bacigál, T.; Hegedüšová, K.; Májeková, J.; Medvecka, J.P.; Mikulová, K.; Šibíková, M.; Škodová, I.; Zaliberová, M.; Jarolímek, I. Comparison of the understory vegetation of native forests and adjacent Robinia pseudoacacia plantations in the Carpathian-Pannonian region. For. Ecol. Manag. 2019, 439, 28–40. [Google Scholar] [CrossRef]
  70. Benesperi, R.; Giuliani, C.; Zanetti, S.; Gennai, M.; Mariotti-Lippi, M.; Guidi, T.; Nascimbene, J.; Foggi, B. Forest plant diversity is threatened by Robinia pseudoacacia L. (black-locust) invasion. Biodivers. Conserv. 2012, 21, 3555–3568. [Google Scholar] [CrossRef]
  71. Stefanowicz, A.M.; Stanek, M.; Nobis, M.; Zubek, S. Species-specific effects of plant invasions on activity, biomass, and composition of soil microbial communities. Biol. Fertil. Soils 2016, 52, 841–852. [Google Scholar] [CrossRef] [Green Version]
Figure 1. Comparison of the type of humus forms among the investigated forest types. Abbreviations: PS = Prunus serotina, QF = native Quercus forests, QR = Quercus rubra, RP = Robinia pseusoacacia. Dots represent the presence of the humus layer; a higher number of dots indicates a higher thickness of the layer; zo = zoogenic; noz = non zoogenic; maA = biomacrostructured; meA = biomesostructured; miA = biomicrostructured.
Forests 10 00842 g001
Figure 2. The means (±s.d.) of the abiotic factors (al) among native (QF) and alien (QR, PS, RP) woodland types (n = 3). The different letters above the error bar indicate statistically significant differences between forest types (post-hoc Duncan test following one-way ANOVA). Non-significant relations are reported in Supplementary Materials Figure S2. For abbreviations, see Table 1.
Forests 10 00842 g002
Figure 3. The means (±s.d.) of biotic factors (ag) among native (QF) and alien (QR, PS, RP) woodland types (n = 3). The different letters above the error bar indicate statistically significant differences between forest types (post-hoc Duncan test following one-way ANOVA). Non-significant relations are reported in Supplementary Materials Figure S2. For abbreviations, see Table 1.
Forests 10 00842 g003
Figure 4. RDA analysis of (a) microarthropod and (b) plant communities in relation to the considered environmental variables. Significant variables (at p < 0.05) are reported within rectangles. The percentages in the X and Y axes represent the variance they explain. For abbreviations of the variables, see Table 1. Other animal group abbreviations: Dipt_ad: adult of Diptera; Dipt_lv: larvae of Diptera; Coleo_ad: adult of Coleoptera; Coleo_lv: larvae of Coleoptera; Hymenopt: Hymenoptera; Pseudoscor: Pseudoscorpiones. Other plant species abbreviations, colored in grey (only the main trees and forest herb species), are reported: Ail_alt: Ailanthus altissima; Car_bet: Carpinus betulus; Con_maj: Convallaria majalis; Pol_mul: Polygonatum multiflorum; Pru_ser: Prunus serotina; Que_pet: Quercus petraea; Que_rob: Q. robur; Que _rub: Q. rubra; Rob_pse: Robinia pseudoacacia; Vin_min: Vinca minor.
Forests 10 00842 g004
Figure 5. Correlation graph, indicating positive and negative relationships between the main biotic and abiotic factors (those included in the RDA analysis), respectively. Blue and red colors (only in the web content of the article) indicate positive and negative relationships, respectively, according to the Spearman’s correlation coefficient, the absolute value of which is proportional to the dot dimension and to the color intensity. The Spearman’s correlation coefficients and significance levels are reported in Supplementary Materials Table S1. White stars indicate correlation coefficients > 0.7 and a significance level p ≤ 0.01. For abbreviations of the variables, see Table 1.
Forests 10 00842 g005
Table 1. Abiotic and biotic factors outlining the different components of the ecosystems.
Ecosystem ComponentFactorUnitAbbreviation
Humus formsDysmullpresence/absence/
Dysmoderpresence/absence/
Hemimoderpresence/absence/
Mesomullpresence/absence/
Properties of organic horizonsSoil organic carbon stock of OL organic horizonkg m−2SOCOL
Soil organic carbon stock of OF organic horizonkg m−2SOCOF
Soil organic carbon stock of OH organic horizonkg m−2SOCOH
Soil organic carbon stock of O C O L +   O C O F + O C O H kg m−2SOCOrg
C:N ratio of OL organic horizonratioCNOL
C:N ratio of OF organic horizonratioCNOF
C:N ratio of OH organic horizonratioCNOH
Properties of mineral layerBase saturation of the 0–10 cm mineral layer%BS
Cation exchange capacity of the 0–10 cm mineral layercmol(+) kg−1CEC
Exchangeable calcium of the 0–10 cm mineral layercmol(+) kg−1Ca
Exchangeable magnesium of the 0–10 cm mineral layercmol(+) kg−1Mg
Exchangeable sodium of the 0–10 cm mineral layercmol(+) kg−1Na
Exchangeable potassium of the 0–10 cm mineral layercmol(+) kg−1K
Potential RespirationmgCO2 g−1 24 h−1Resp
Soil organic carbon stock of the 0–60 cm mineral layerkg m−2SOCmin
C:N ratio of the 0–60 cm mineral layer ratioCNmin
Soil pH in water of the 0–60 cm mineral layer/pHmin
Available phosphorus of 0–60 cm mineral layermg kg−1Pav
Ratio of OCOrg and OC of the 0–10 cm mineral layerratioLittind
Humus index/Humind
Bacteria Bacteria richnessn/g of soilBact
Live bacteria richnessn/g of soilL_bact
Dead bacteria richnessn/g of soilD_bact
Microarthropod communityAcari abundancen/sampleAcari
Coleoptera larvae abundancen/sampleColeo_lv
Collembola abundancen/sampleColl
Pauropoda abundancen/samplePaur
Protura abundancen/sampleProt
Symphyla abundancen/sampleSymp
Biological Quality Soil indexindexQBS-ar
Euedaphic arthropod taxa α-diversityn/plotEu_rich
Plant communityPlant species richness expressed as number of plant species within the plotn/plantα-rich
Plant species diversity expressed as Shannon H’Indexα-Shann
Plant species diversity expressed as species turnover according Whittakerindexβ-Whit
Plant species diversity expressed as species turnover according the Jaccard indexindexβ-Jacc
Plant species diversity expressed as total number of species within a woodland typen/plotγ-div
Number of nemoral speciesn/plotNem
Cover of nemoral species%%Nem
Number of alien species n/plotAlien
Cover of aliens species%/plot%Alien
Number of individuals of the indicator species Polygonatum multiflorumn/plotPolyg
Table 2. Ordination parameters a redundancy analysis (RDA) for the first four constrained ordination axes for the microarthropod (a) and plant (b) communities. Marginal (Lambda1) and conditional (LambdaA) effect scores (variance partitioning) are reported. p level: *** < 0.001; ** p < 0.01; * p < 0.05; ns = not significant. In bold significant values.
(a) Microarthropod CommunityRDA AxesTotal Variance
Axis 1Axis 2Axis 3Axis 4
Eigenvalues:0.2250.2030.1480.1041.000
Cumulative percentage variance of species data and species-environment relation:22.542.957.768.1
Variable Lambda1LambdaAPF
QBS-ar 0.190.19***2.62
Acari 0.190.19**2.41
Symp 0.140.11*1.87
Polyg 0.170.09ns1.48
Nem 0.110.08ns1.45
Prot 0.140.08ns1.49
Alien 0.120.08ns1.69
γ-div 0.170.06ns1.73
pHtot 0.140.07ns2.56
CNtot 0.100.03ns1.99
OCOL 0.080.02ns0
(b) Plant Community
Axis 1Axis 2Axis 3Axis 4Total variance
Eigenvalues:0.5020.2200.1030.0861.000
Cumulative percentage variance of species data and species-environment relation:50.272.282.691.2
Variable Lambda1LambdaAPF
CNOL 0.330.33***4.89
γ-div 0.250.16***3.56
K 0.220.16*2.95
CNtot 0.190.09*2.38
%Nem 0.180.06ns1.93
D_bact 0.040.07ns2.33
QBS-ar 0.160.05ns2.69
Paur 0.110.03ns1.7
Alien 0.160.03ns2.31
OCOL 0.070.01ns1.62
OCOF 0.160.01ns0

