Assessing a Template Matching Approach for Tree Height and Position Extraction from Lidar-Derived Canopy Height Models of Pinus Pinaster Stands


Abstract
:1. Introduction
2. Materials and Methods
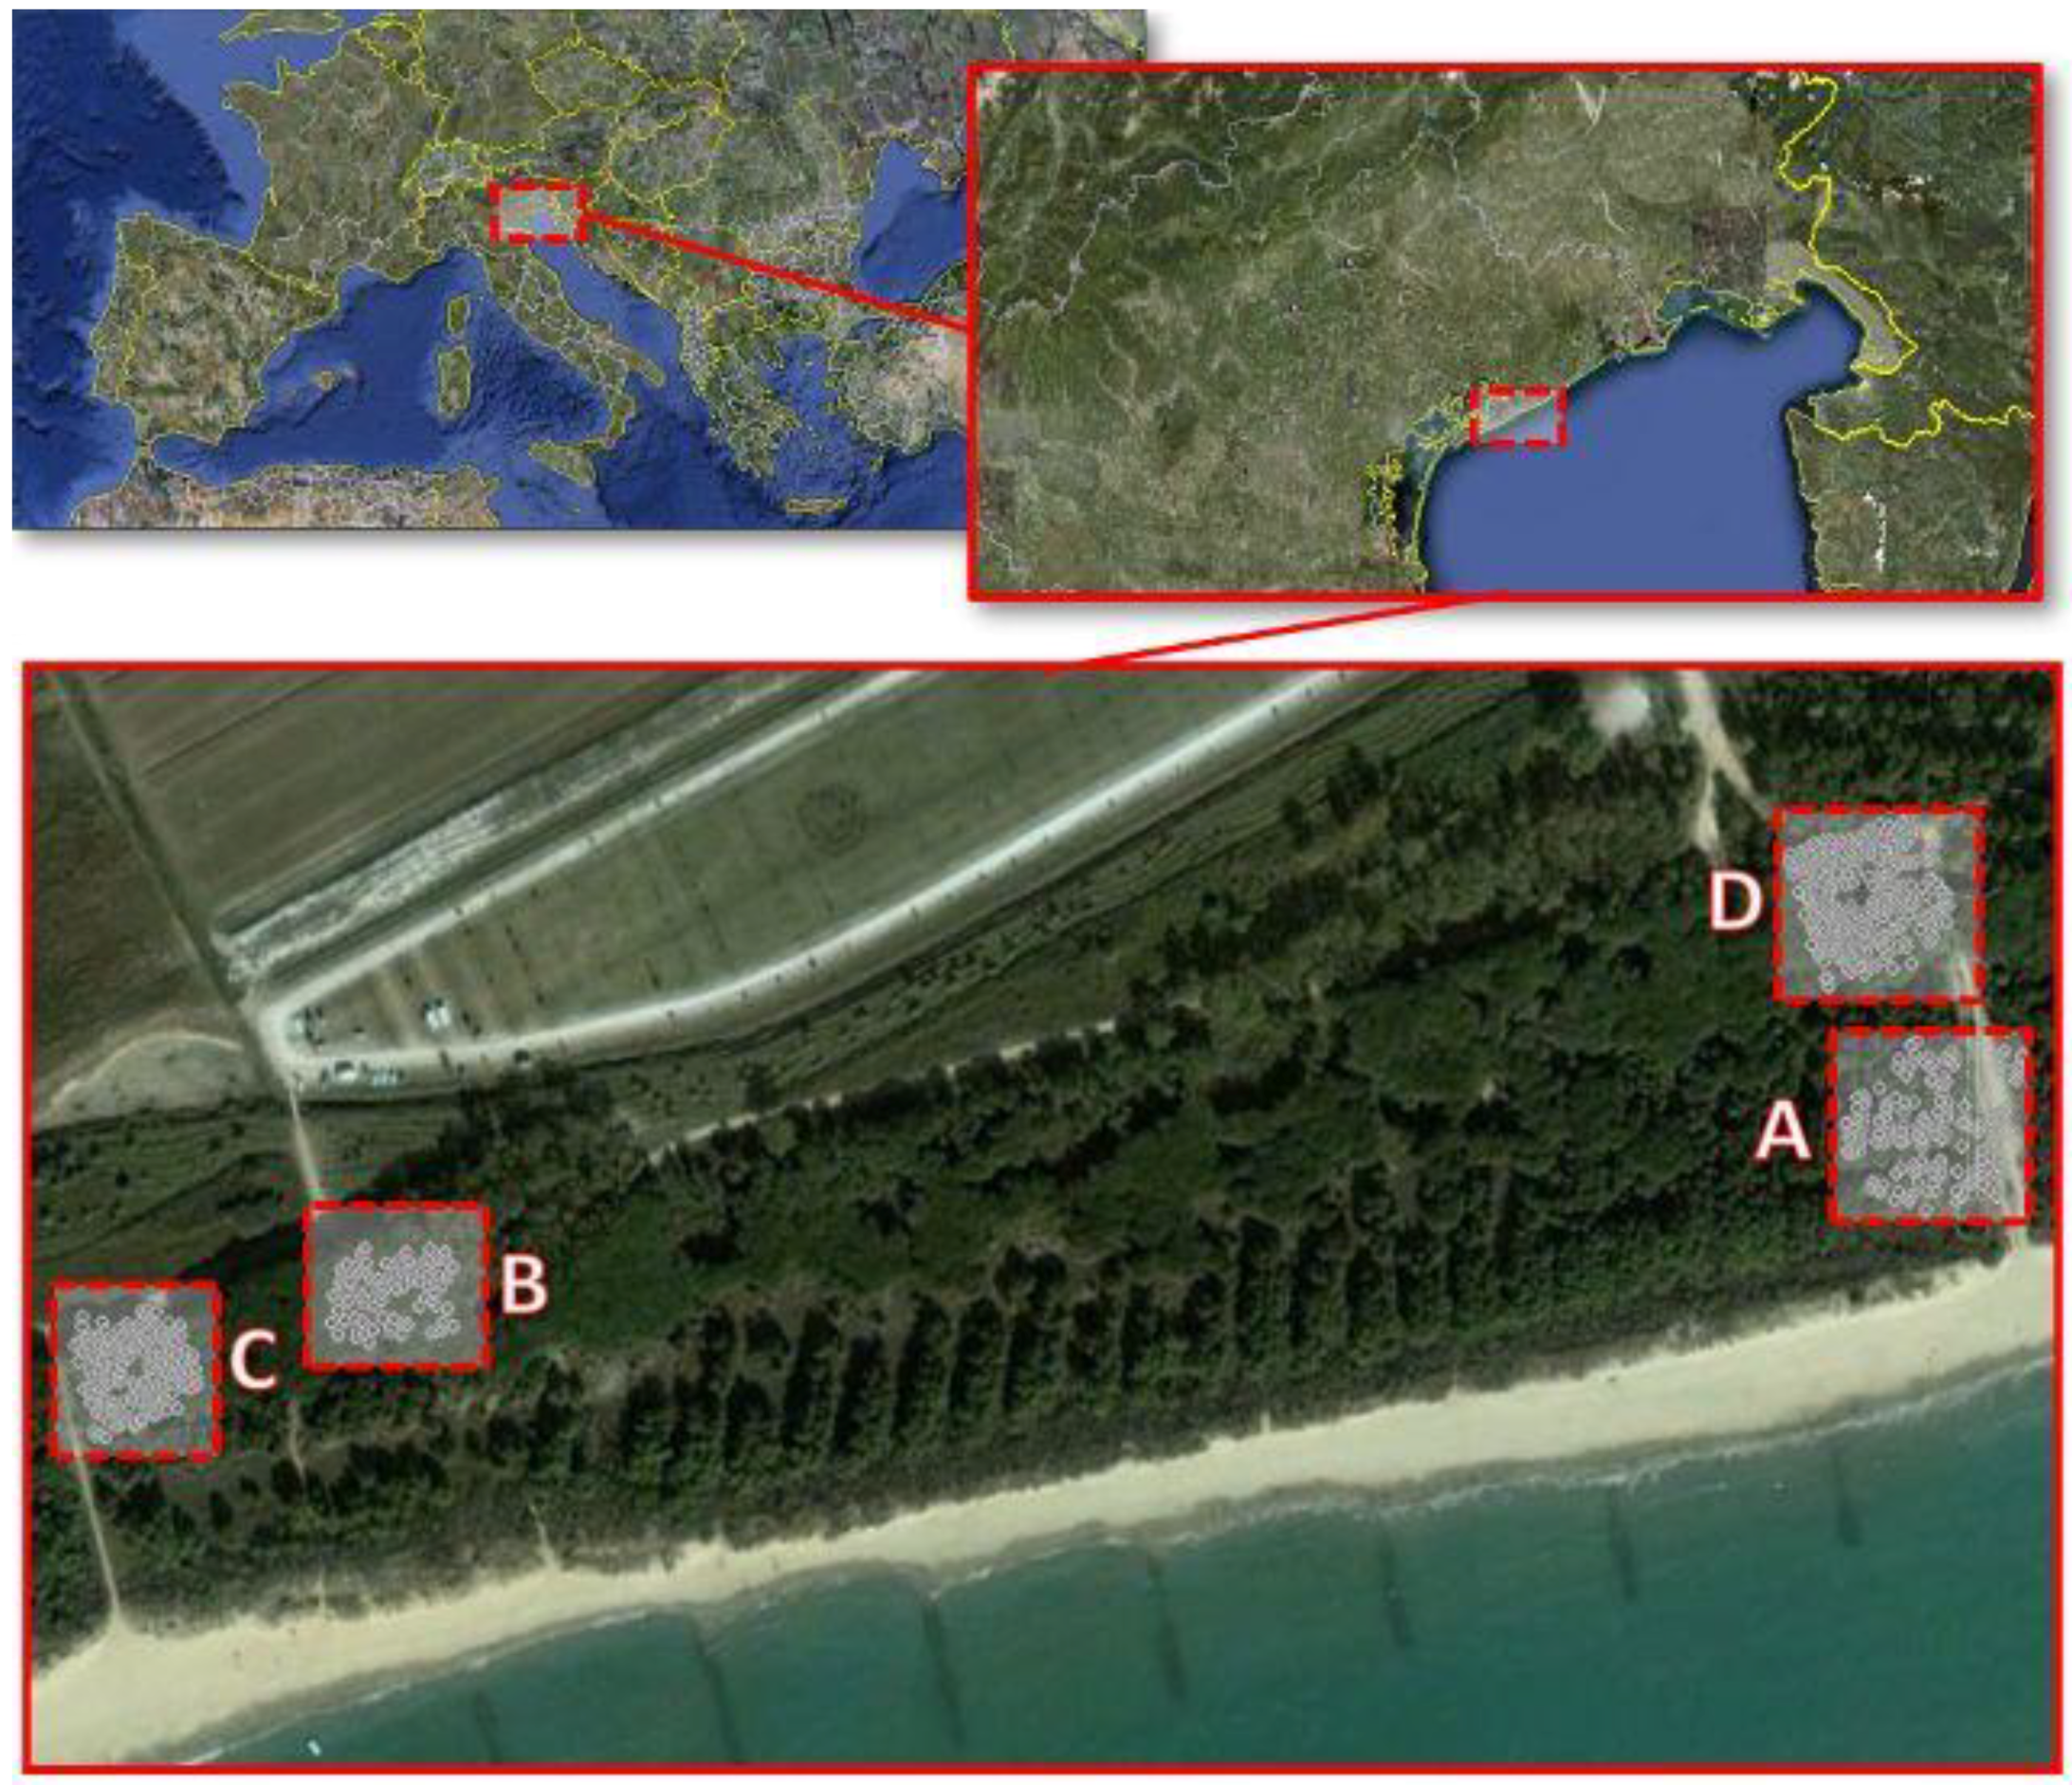
2.1. Study Area and Data Collection


| Plots | ||||
|---|---|---|---|---|
| A | B | C | D | |
| Area, ha | 0.1963 | 0.3847 | 0.25 | 0.25 |
| N (N ha−1) | 158 (805) | 95 (245) | 179 (716) | 117 (468) |
| Mean DBH (SD) | 0.25 m (0.054) | 0.29 m (0.05) | 0.28 m (0.064) | 0.28 m (0.08) |
| Mean tree height (SD) | 12.06 m (0.89) | 12.02 m (1.11) | 12.38 m (0.74) | 11.95 m (0.76) |
| Trees with height measured | 18 | 24 | 21 | 15 |
| Characteristic | Value |
|---|---|
| Date | 8 April 2008 |
| Average flight height | 800 m |
| Average density | 5 pts/m2 |
| Pulse frequency | 33 kHz |
| Sensor model | OPTECH ALTM 3033 |
| Scan angle | ±10° |
| Laser wavelength | 1,064 nm |
| Expected point accuracy (1 sigma) | Z = 0.15 m XY = 0.3 |
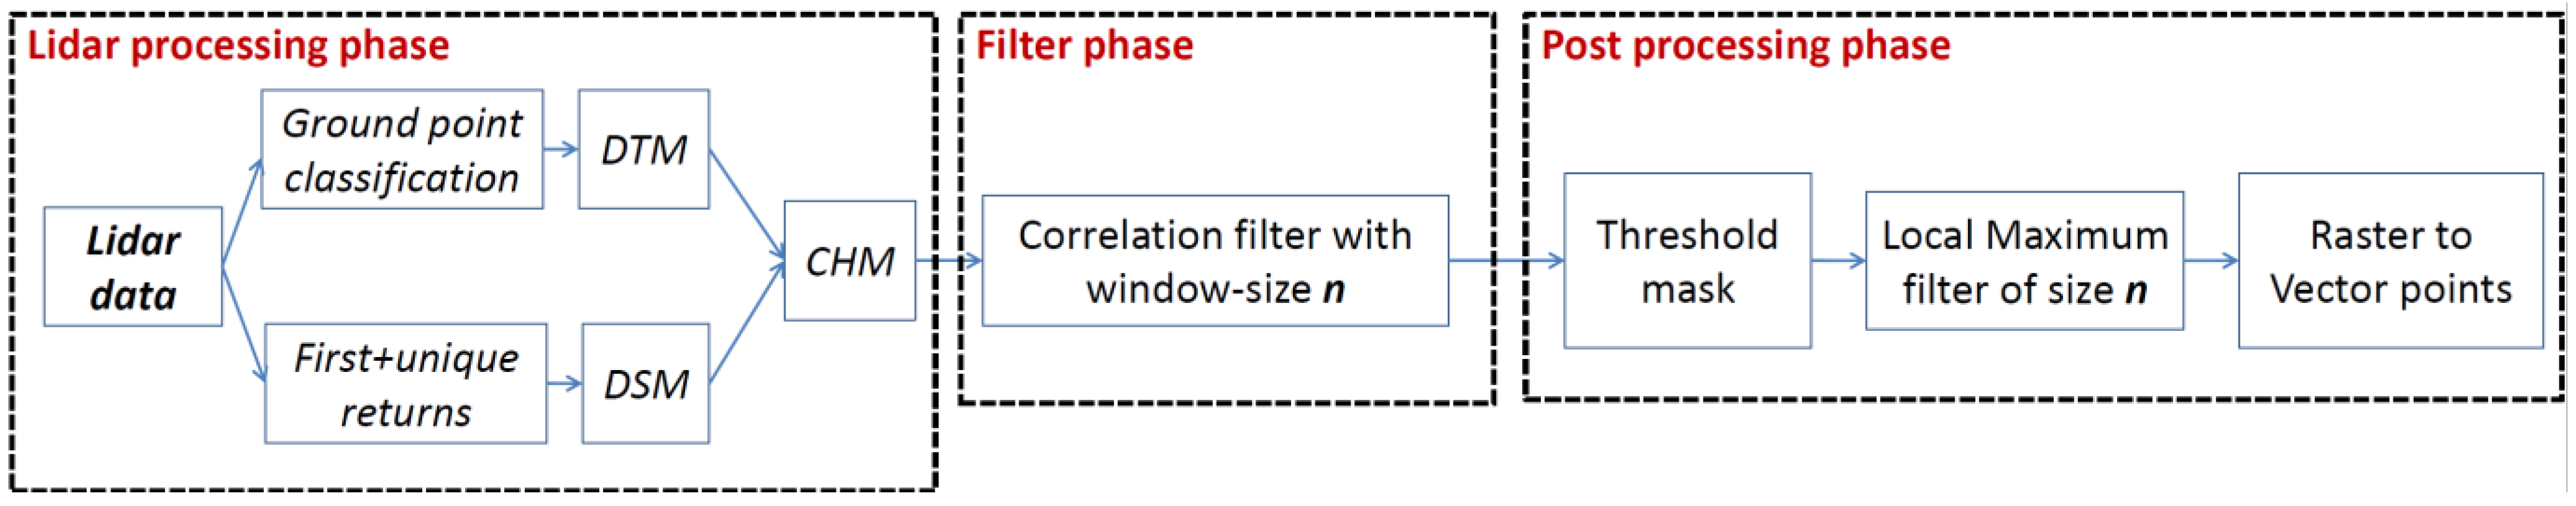
2.2. Lidar Processing and Software Used

2.2.1. Lidar Processing Phase
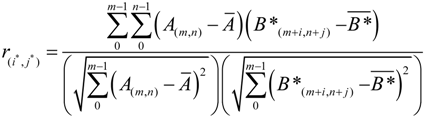
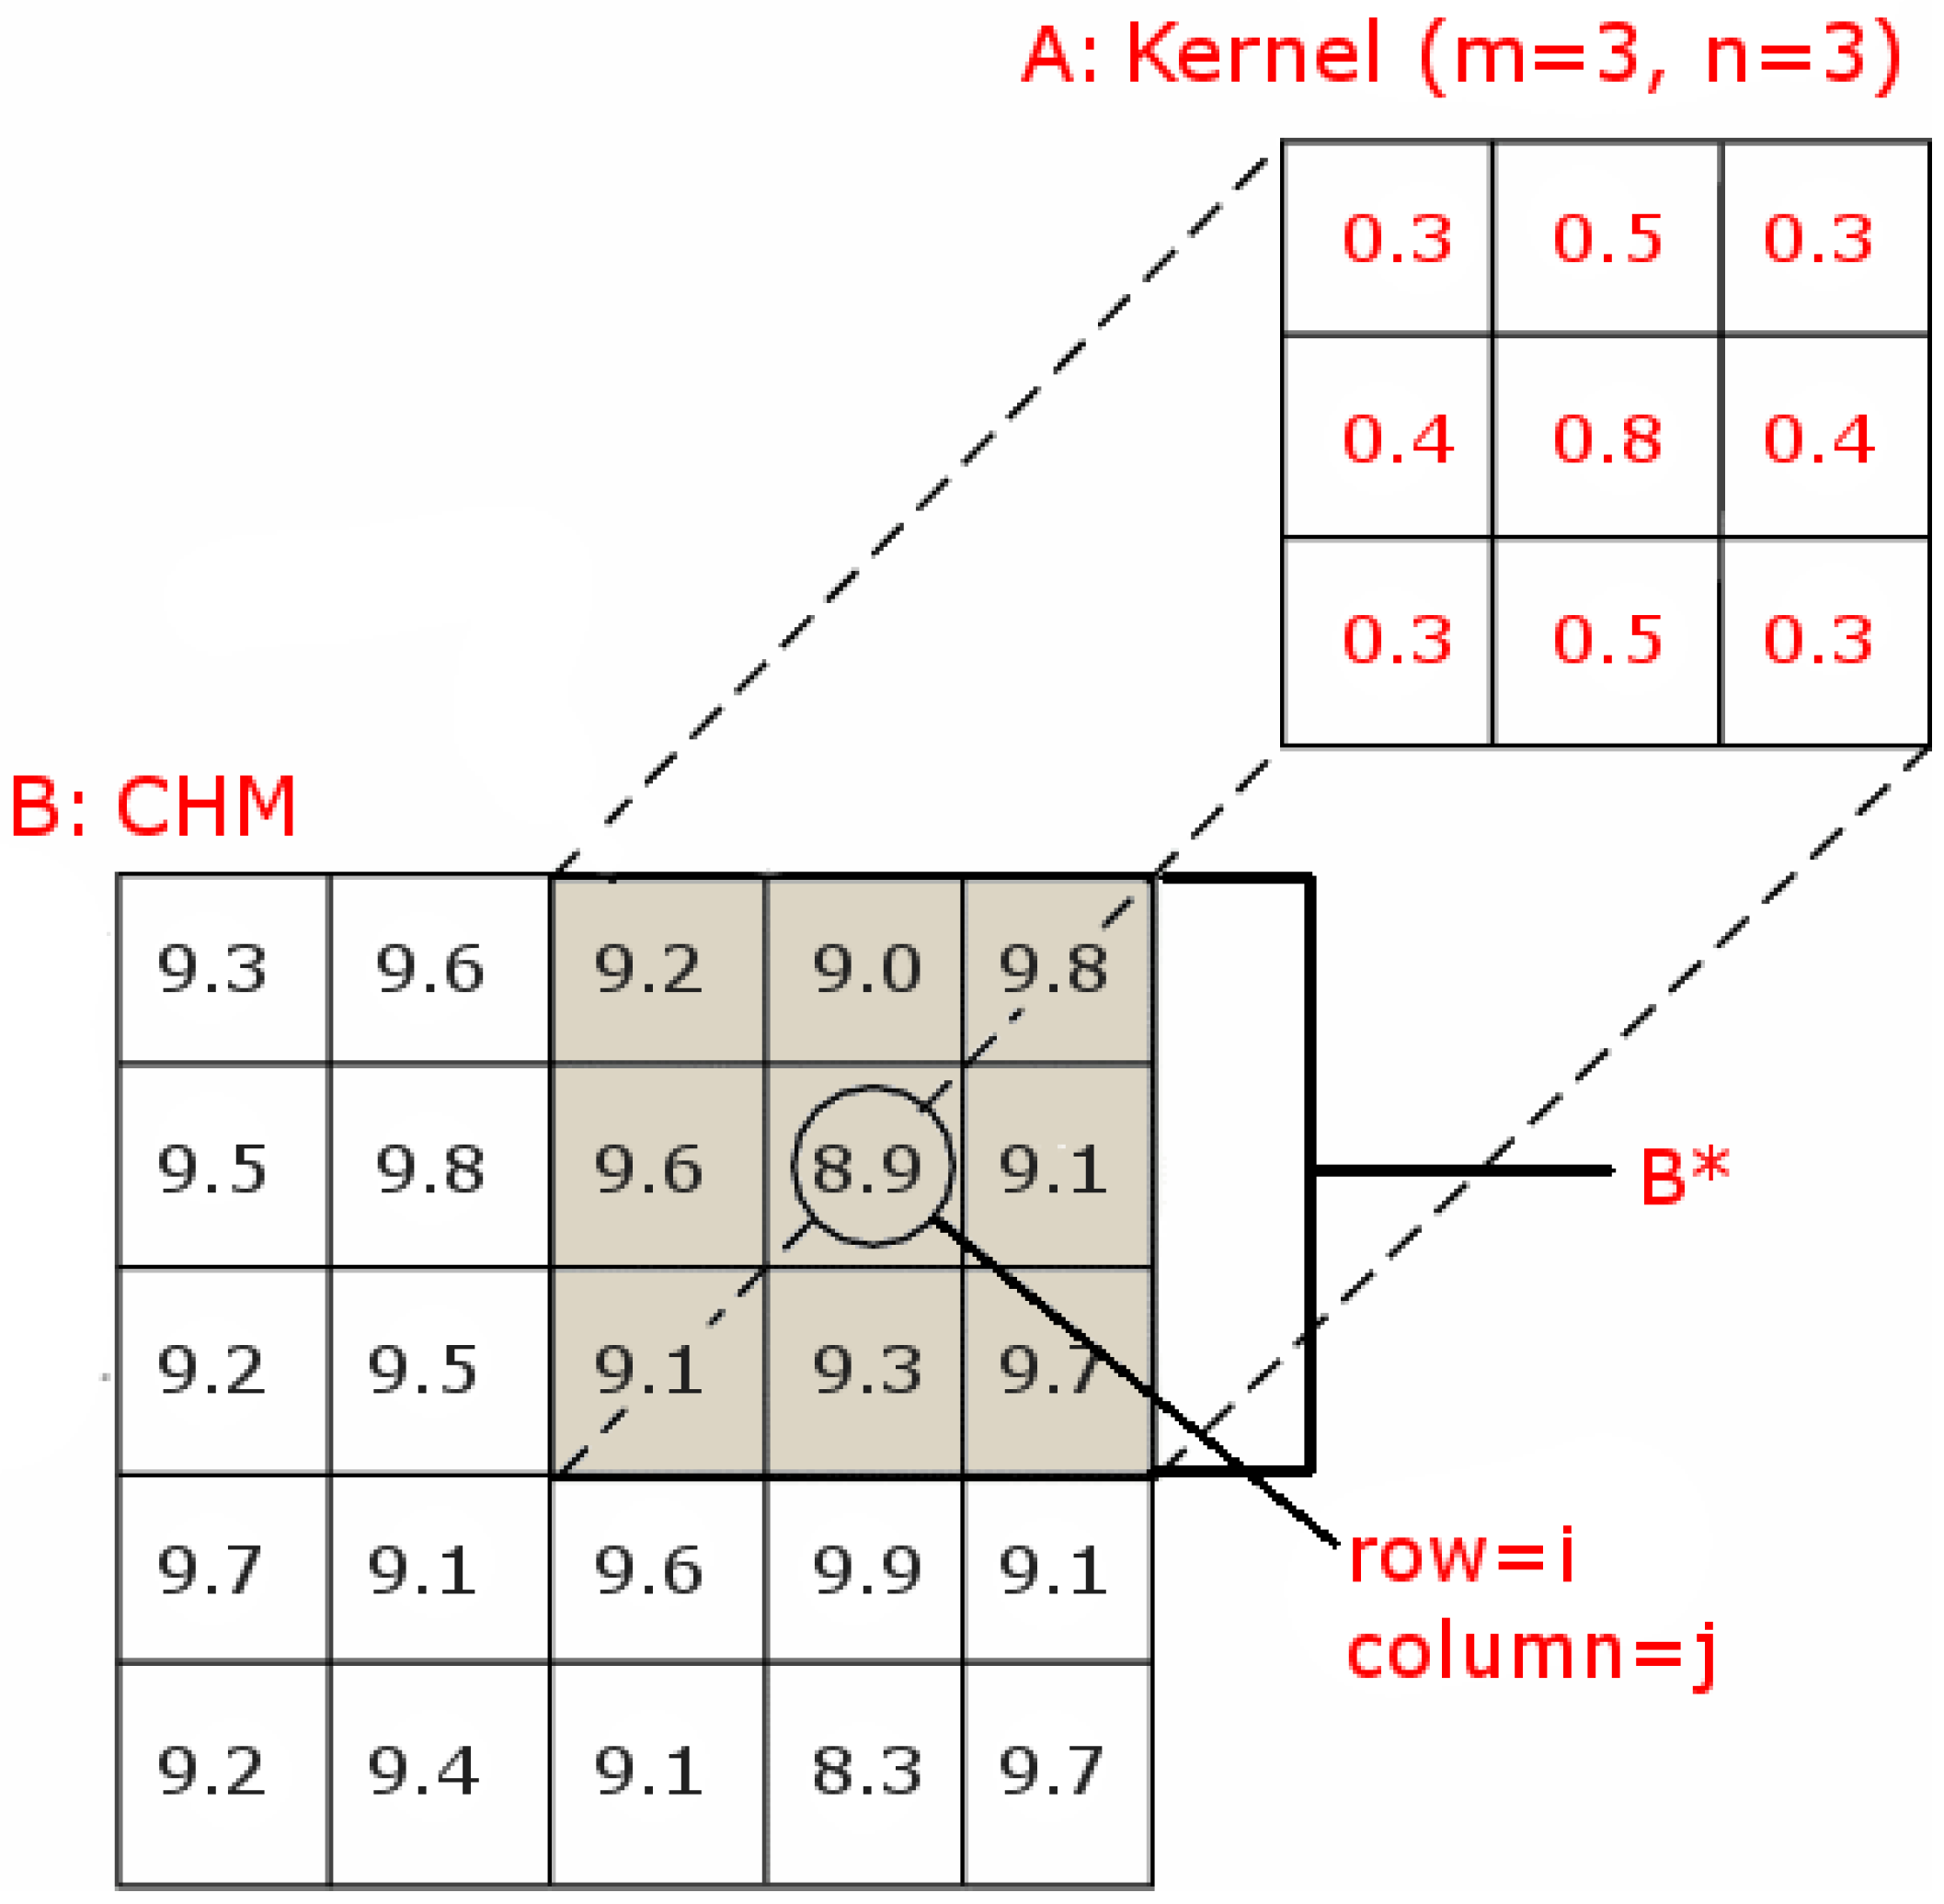
2.2.2. Filter Phase


2.2.3. Post Processing Phase
3. Results and Discussion
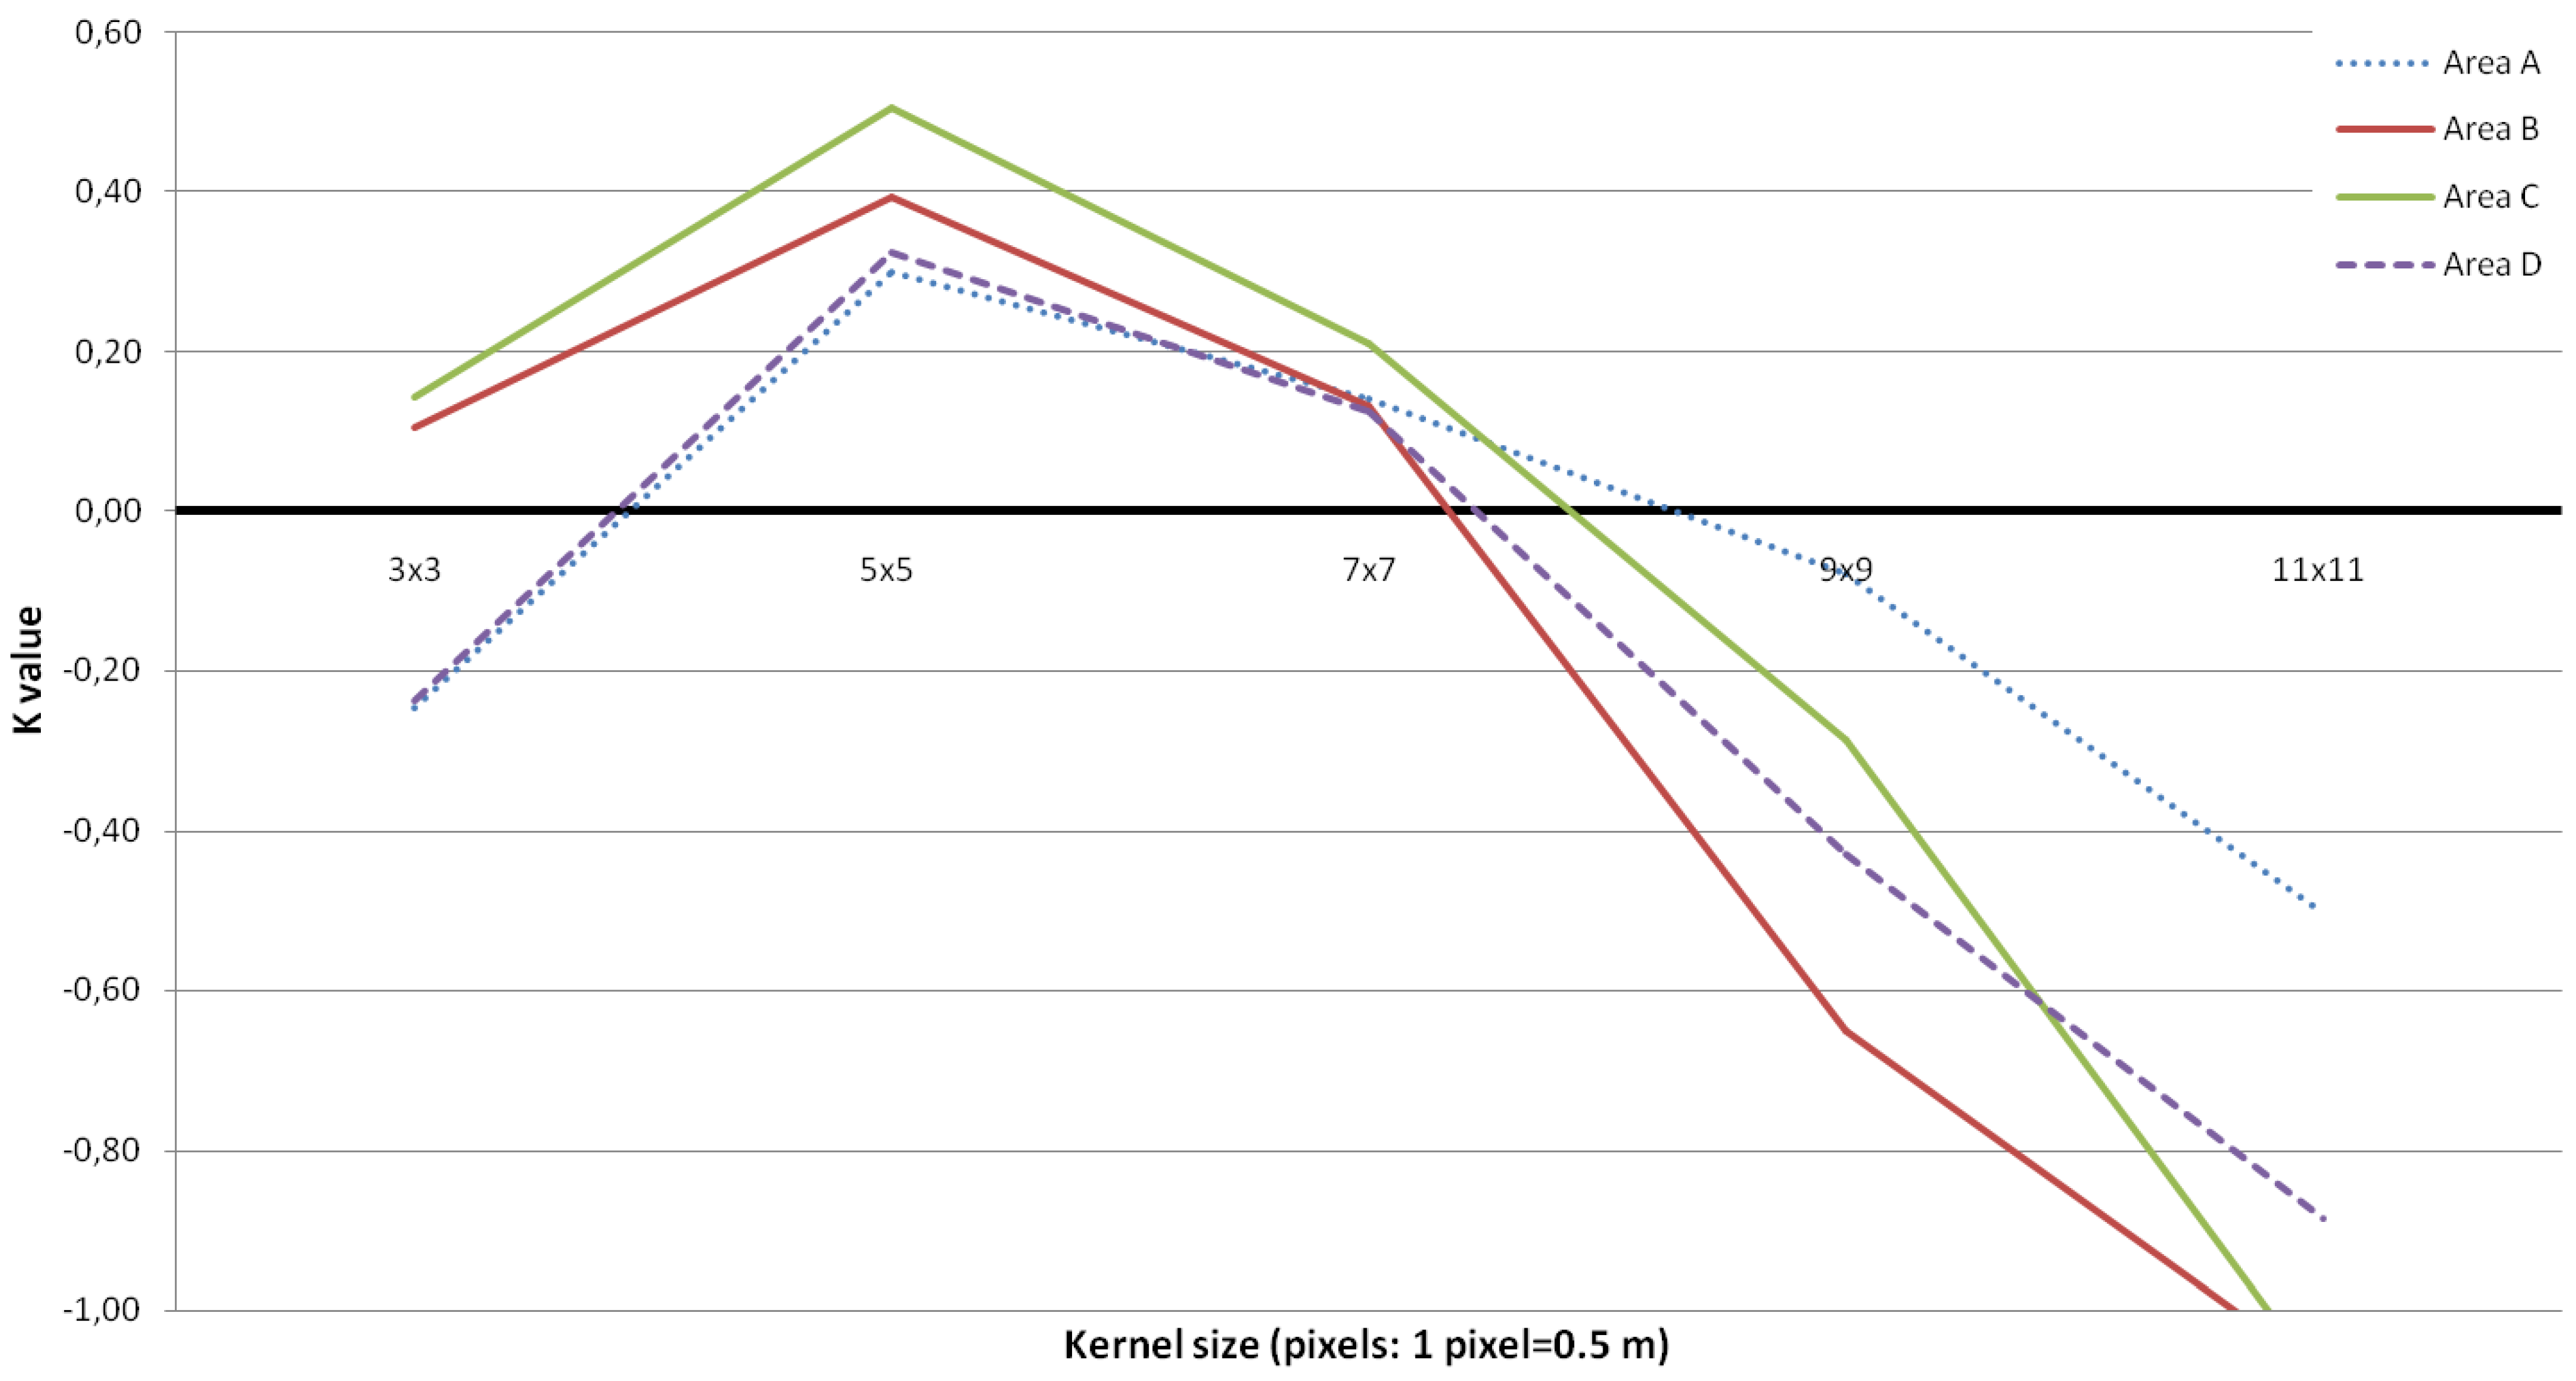
3.1. Tree Density and Position

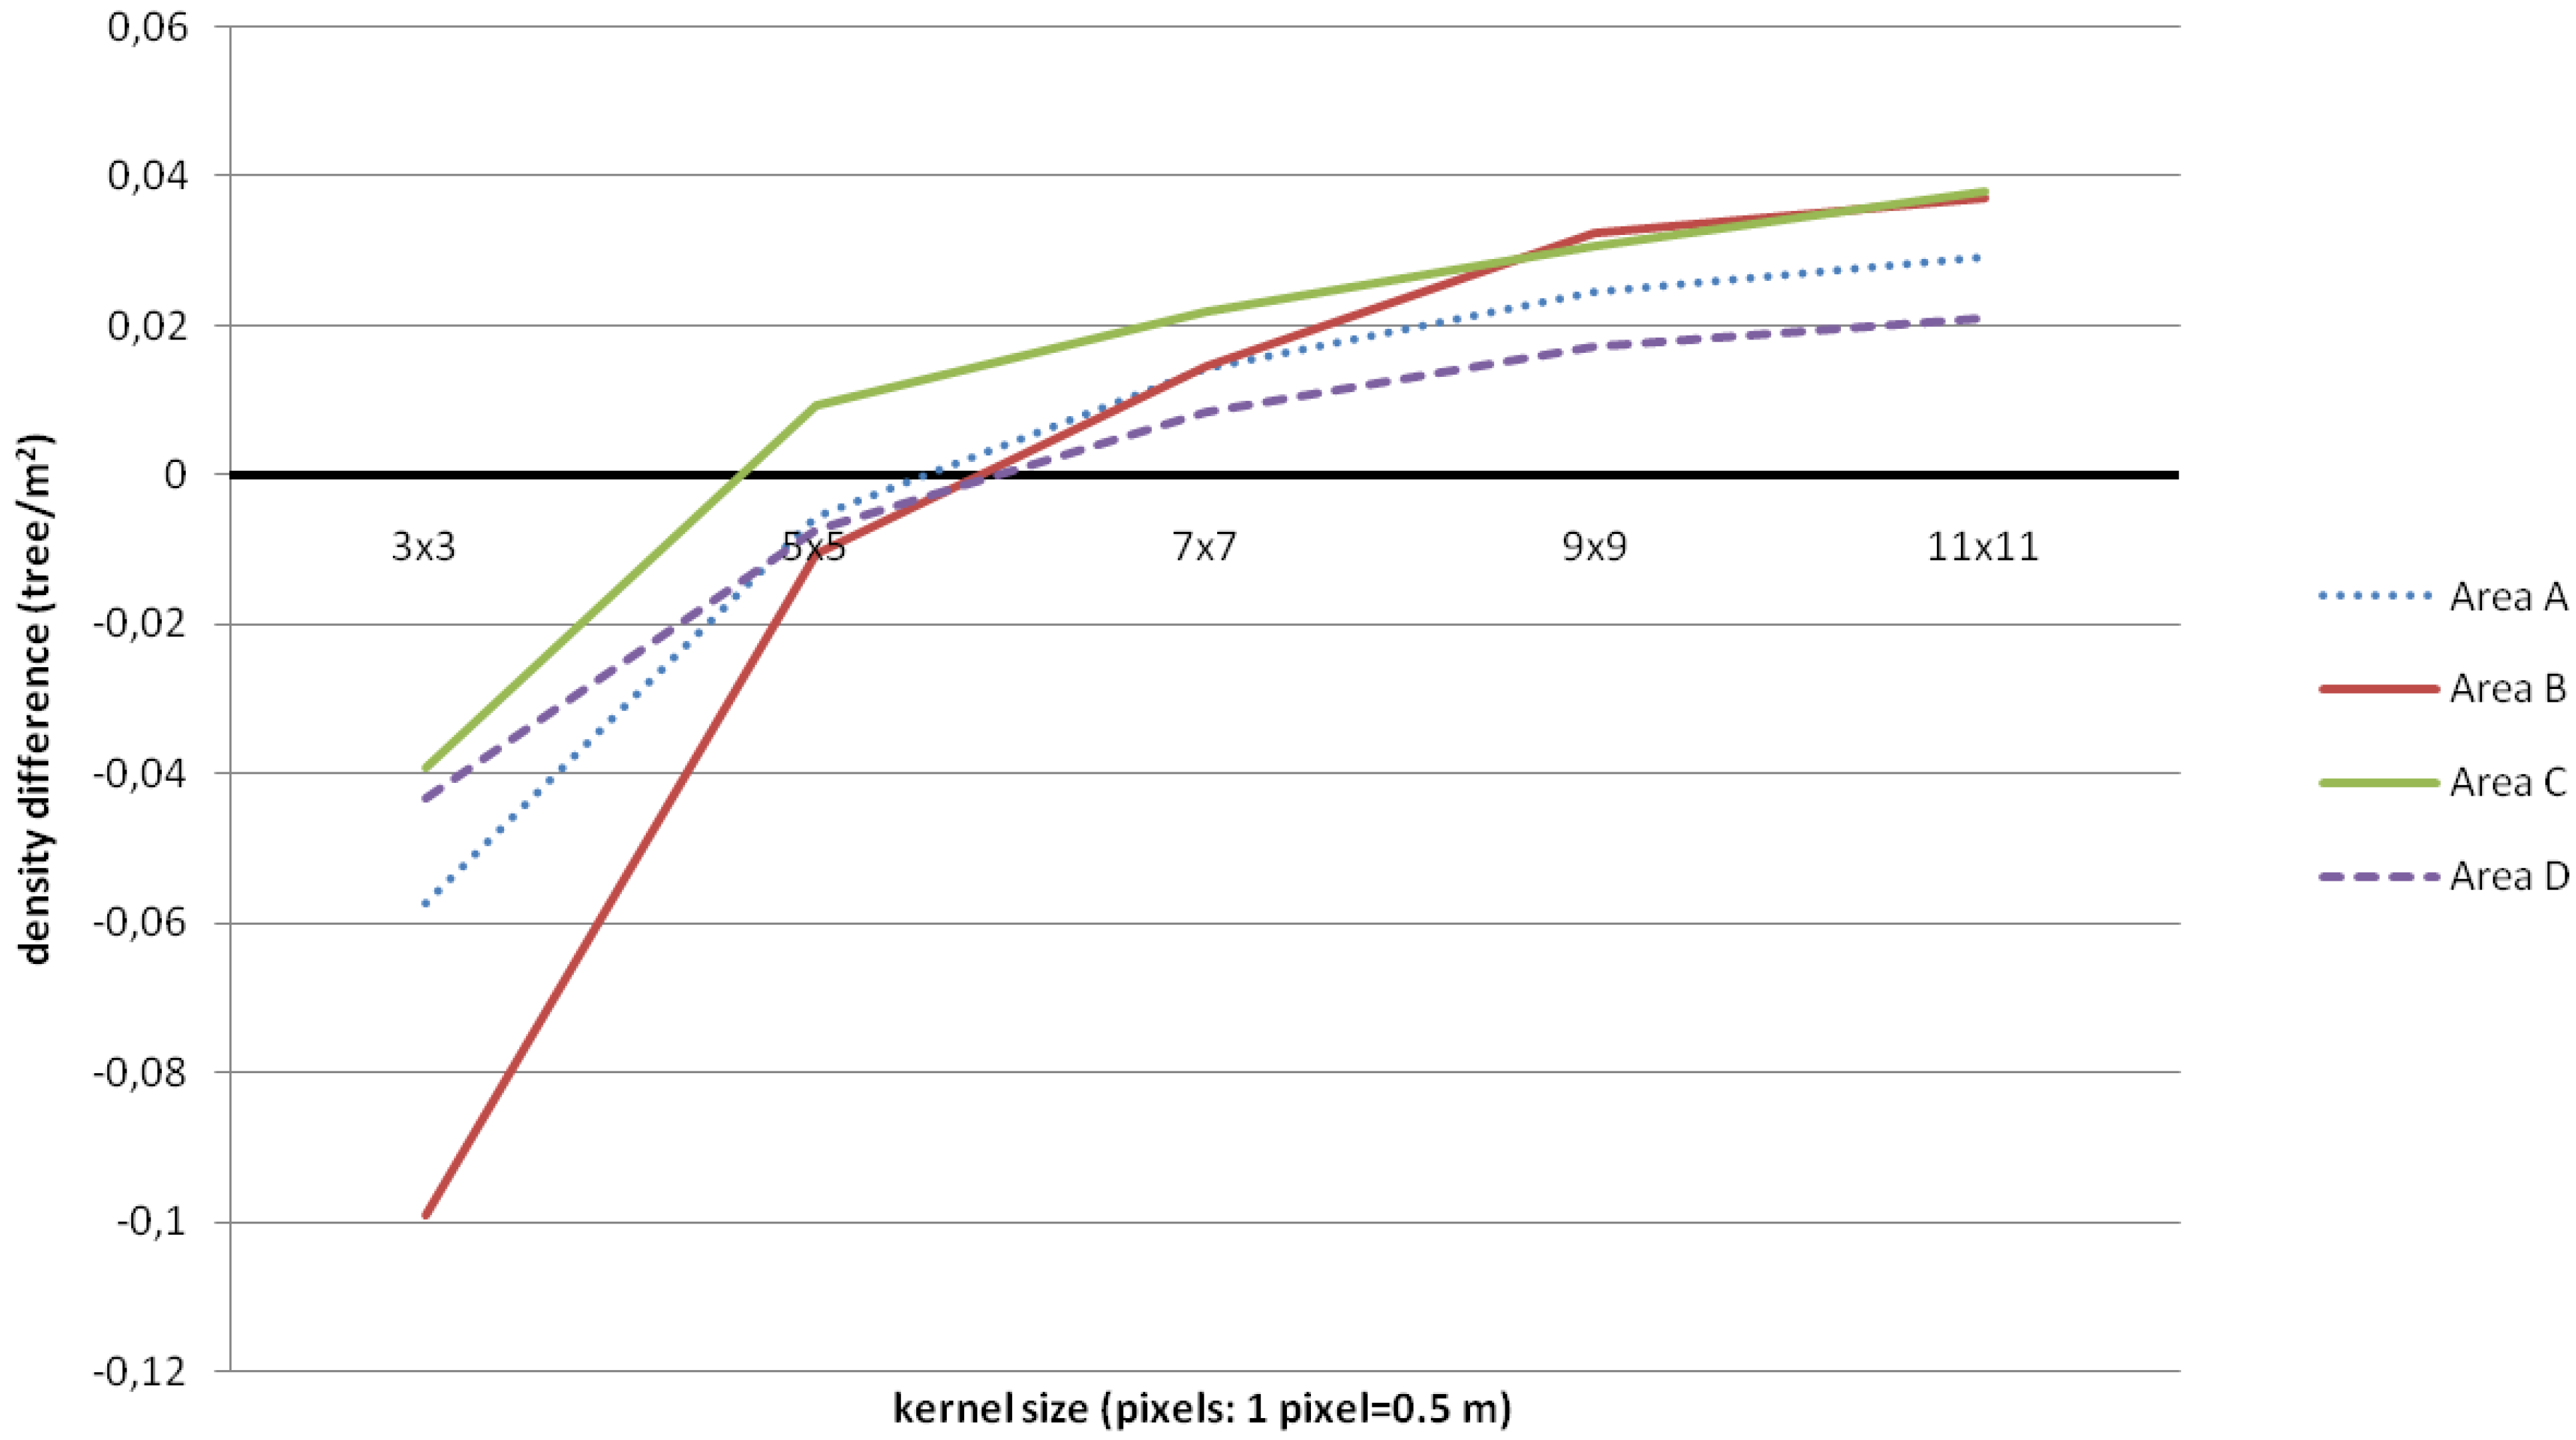
| Area A (NS = 158) | Area B (NS = 95) | |||||||||||
| KS | NI | NC | NO | Nm | K | % | NI | NC | NO | Nm | K | % |
| 3 × 3 | 396 | 278 | 40 | 118 | −0.25 | 74 | 212 | 125 | 8 | 87 | 0.11 | 84 |
| 5 × 5 | 189 | 86 | 55 | 103 | 0.30 | 65 | 91 | 31 | 75 | 60 | 0.39 | 68 |
| 7 × 7 | 115 | 45 | 88 | 70 | 0.14 | 44 | 54 | 14 | 55 | 40 | 0.13 | 45 |
| 9 × 9 | 74 | 20 | 104 | 54 | −0.08 | 34 | 28 | 6 | 73 | 22 | −0.65 | 30 |
| 11 × 11 | 53 | 14 | 119 | 39 | −0.50 | 24 | 22 | 4 | 77 | 18 | −1.08 | 19 |
| Area C (NS = 179) | Area D (NS = 117) | |||||||||||
| KS | NI | NC | NO | Nm | K | % | NI | NC | NO | Nm | K | % |
| 3 × 3 | 359 | 207 | 27 | 152 | 0.14 | 91 | 312 | 216 | 21 | 96 | −0.24 | 82 |
| 5 × 5 | 163 | 41 | 57 | 122 | 0.50 | 63 | 151 | 69 | 35 | 82 | 0.32 | 70 |
| 7 × 7 | 98 | 17 | 98 | 81 | 0.21 | 42 | 78 | 28 | 67 | 50 | 0.13 | 42 |
| 9 × 9 | 60 | 5 | 124 | 55 | −0.29 | 23 | 48 | 20 | 89 | 28 | −0.43 | 23 |
| 11 × 11 | 40 | 5 | 144 | 35 | −1.09 | 18 | 34 | 13 | 96 | 21 | −0.89 | 17 |

3.2. Tree Height Distribution
| PLOTS | ||||
|---|---|---|---|---|
| A | B | C | D | |
| N | 18 | 24 | 21 | 15 |
| MM (SD) | 12.06 m (0.89) | 12.02 m (1.11) | 12.38 m (0.74) | 11.95 m (0.76) |
| ML (SD) | 11.94 m (0.47) | 11.95 m (0.67) | 12.26 m (0.54) | 11.54 m (0.79) |
| ME | −0.12 | −0.063 | −0.123 | −0.41 |
| MAE | 0.54 | 0.504 | 0.422 | 0.70 |
| RMSE | 0.624 | 0.622 | 0.528 | 1.01 |
| % | 5.23 | 5.21 | 4.31 | 8.76 |
4. Conclusions
References
- Wiensa, J.; Sutter, R.; Anderson, M.; Blanchard, J.; Barnett, A.; Aguilar-Amuchasteguib, N.; Averyd, C.; Lained, S. Selecting and conserving lands for biodiversity: the role of remote sensing. Remote Sens. Environ. 2009, 113, 1370–1381. [Google Scholar] [CrossRef]
- Scanlan, I.; McElhinny, C.; Turner, P. A methodology for modelling Canopy structure: An exploratory analysis in the tall Wet Eucalypt forests of Southern Tasmania. Forests 2010, 1, 4–24. [Google Scholar] [CrossRef]
- Dubayah, R.; Blair, J. Lidar remote sensing for forestry applications. J. For. 2000, 98, 44–46. [Google Scholar]
- Falkowski, M.J.; Evans, J.S.; Martinuzzi, S.; Gessler, P.E.; Hudak, A.T. Characterizing forest succession with lidar data: An evaluation for the Inland Northwest, USA. Remote Sens. Environ. 2009, 113, 946–956. [Google Scholar]
- Tesfamichael, S.G.; Ahmed, F.; van Aardt, J.A.N.; Blakeway, F. A semi-variogram approach for estimating stems per hectare in Eucalyptus grandis plantations using discrete-return lidar height data. For. Ecol. Manage. 2009, 258, 1188–1199. [Google Scholar] [CrossRef]
- Korpela, I.; Dahlin, B.; Schäfer, H.; Bruun, E.; Haapaniemi, F.; Honkasalo, J.; Ilvesniemi, S.; Kuutti, V.; Linkosalmi, M.; Mustonen, J.; Salo, M.; Suomi, O.; Virtanen, H. Single-tree forest inventory using lidar and aerial images for 3d treetop positioning, species recognition, height and crown width estimation. Int. Arch. Photogram. Remote Sens. Spat. Inf. Sci. 2007, 36-3/W52, 227–234. [Google Scholar]
- Hyyppä, J.; Inkinen, M. Detecting and estimating attributes for single trees using laser scanner. Photogramm. J. Finl. 1999, 16, 27–42. [Google Scholar]
- Suarez, J.C.; Ontiveros, C.; Smith, S.; Snape, S. Use of airborne LiDAR and aerial photography in the estimation of individual tree heights in forestry. Comput. Geosci. 2005, 31, 253–262. [Google Scholar] [CrossRef]
- Popescu, S.C.; Wynne, R.H.; Nelson, R.F. Estimating plot-level tree heights with lidar: local filtering with a canopy-height based variable window size. Comput. Electron. Agric. 2002, 37, 71–95. [Google Scholar] [CrossRef]
- Popescu, S.C.; Wynne, R.H. Seeing the trees in the forest: using lidar and multispectral data fusion with local filtering and variable window size for estimating tree height. Photogram. Eng. Remote Sens. 2004, 70, 589–604. [Google Scholar] [CrossRef]
- Barilotti, A.; Sepic, F.; Abramo, E.; Crosilla, F. Improving the morphological analysis for tree extraction: a dynamic approach to lidar data. Int. Arch. Photogram. Remote Sens. Spat. Inf. Sci. 2007, 36-3/W52, 26–31. [Google Scholar]
- Popescu, S.C.; Wynne, R.H.; Scrivani, J.A. Fusion of small-footprint lidar and multispectral Data to estimate plot-level volume and biomass in deciduous and pine forests in virginia, USA. For. Sci. 2004, 50, 551–565. [Google Scholar]
- Hill, R.A.; Thomson, A.G. Mapping woodland species composition and structure using airborne spectral and LiDAR data. Int. J. Remote Sens. 2005, 26, 3763–3779. [Google Scholar] [CrossRef]
- Huang, H.; Gong, P.; Cheng, X.; Clinton, N.; Li, Z. Improving measurement of forest structural parameters by co-registering of high resolution aerial imagery and low density LiDAR data. Sensors 2009, 9, 1541–1558. [Google Scholar] [CrossRef] [PubMed]
- Hyde, P.; Dubayah, R.; Peterson, B.; Blair, J.B.; Hofton, M.; Hunsaker, C.; Knox, R.; Walker, W. Mapping forest structure for wildlife habitat analysis using waveform lidar: Validation of montane ecosystems. Remote Sens. Environ. 2005, 96, 427–437. [Google Scholar] [CrossRef]
- Magnussen, S.; Boudewyn, P. Derivations of stand heights from airborne laser scanner data with canopy-based quantile estimators. Can. J. For. Res. 1998, 28, 1016–1031. [Google Scholar] [CrossRef]
- Næsset , E. Accuracy of forest inventory using airborne laser scanning: evaluating the first Nordic full-scale operational project. Scan. J. For. Res. 2004, 19, 554–557. [Google Scholar]
- Barilotti, A.; Sepic, F.; Abramo, E. Automatic detection of dominated vegetation under canopy using Airborne Laser Scanning data. In Proceedings of the Silvilaser 2008: 8th International Conference on LiDAR Applications in Forest Assessment and Inventory; Edinburgh, UK, September 2008, Hill, R., Rossette, J., Suárez, J., Eds.; Bournemouth University: Edinburgh, UK, 2008; pp. 134–143. [Google Scholar]
- Maltamo, M.; Packalén, P.; Yu, X.; Eerikäinen, K.; Hyyppä, J.; Pitkänen, J. Identifying and quantifying structural characteristics of heterogeneous boreal forests using laser scanner data. For. Ecol. Manage. 2005, 216, 41–50. [Google Scholar] [CrossRef]
- Potetz, B.; Lee, T.S. Statistical correlations between two-dimensional images and three-dimensional structures in natural scenes. J. Opt. Soc. Am. A 2003, 20, 1292–1303. [Google Scholar] [CrossRef]
- Grudin, M.A. On internal representations in face recognition systems. Pattern Recognit. 2000, 33, 1161–1177. [Google Scholar] [CrossRef]
- Barilotti, A.; Sepic, F.; Abramo, E.; Crosilla, F. Improving the morphological analysis for tree extraction: a dynamic approach to lidar data. Int. Arch. Photogram. Remote Sens. Spat. Inf. Sci. 2007, 36-3/W52, 26–31. [Google Scholar]
- Blundell, B.S. Local gradient and local maximum analysis of lidar data for tree crown identification. In Proceedings of ASPRS 2008 Annual Conference, Portland, OR, USA, 28 April–2 May 2008.
- R Development Core Team. R: A Language and Environment for Statistical Computing; R Foundation for Statistical Computing: Vienna, Austria, 2007. [Google Scholar]
- Axelsson, P.E. Processing of laser scanner data—algorithms and applications. ISPRS J. Photogram. Remote Sens. 1999, 54, 138–147. [Google Scholar] [CrossRef]
- Matsugami, H.; Shimizu, Y.; Omasa, K. Detection of tree apexes from helicopter-borne scanning lidar data using local maximum filtering. Phyton 2005, 45, 501–505. [Google Scholar]
- Morsdorf, F.; Meiera, E.; Itten, K.I.; Dobbertin, M.; Allgower, B. LIDAR-based geometric reconstruction of boreal type forest stands at single tree level for forest and wildland fire management. Remote Sens. Environ. 2004, 92, 353–362. [Google Scholar]
- Cohen, J. A coefficient of agreement for nominal scales. Educ. Psychol. Meas. 1960, 20, 37–46. [Google Scholar]
- Fleiss, J.L. Statistical Methods for Rates and Proportions; John Wiley: New York, NY, USA, 1981; pp. 38–46. [Google Scholar]
- Tassone, V.C.; Wesseler, J.; Nescib, F.S. Diverging incentives for afforestation from carbon sequestration: an economic analysis of the EU afforestation program in the south of Italy. For. Policy Econ. 2004, 6, 567–578. [Google Scholar] [CrossRef]
- Nilsson, M. Estimation of tree heights and stand volume using an airborne lidar system. Remote Sens. Environ. 1996, 56, 1–7. [Google Scholar] [CrossRef]
- Clark, M.L.; Clark, D.B.; Roberts, D.A. Small-footprint lidar estimation of sub-canopy elevation and tree height in a tropical rain forest landscape. Remote Sens. Environ. 2004, 91, 68–89. [Google Scholar] [CrossRef]
- Brandtberg, T.; Warner, T.A.; Landenberger, R.E.; McGraw, J.B. Detection and analysis of individual leaf-off tree crowns in small footprint, high sampling density lidar data from the eastern deciduous forest in North America. Remote Sens. Environ. 2003, 85, 290–303. [Google Scholar] [CrossRef]
- Gaveau, D.L.A.; Hill, R.A. Quantifying canopy height underestimation by laser pulse penetration in small-footprint airborne laser scanning data. Can. J. Remote Sens. 2003, 29, 650–657. [Google Scholar] [CrossRef]
© 2010 by the authors; licensee MDPI, Basel, Switzerland. This article is an open access article distributed under the terms and conditions of the Creative Commons Attribution license (http://creativecommons.org/licenses/by/3.0/).
Share and Cite
Pirotti, F. Assessing a Template Matching Approach for Tree Height and Position Extraction from Lidar-Derived Canopy Height Models of Pinus Pinaster Stands. Forests 2010, 1, 194-208. https://doi.org/10.3390/f1040194
Pirotti F. Assessing a Template Matching Approach for Tree Height and Position Extraction from Lidar-Derived Canopy Height Models of Pinus Pinaster Stands. Forests. 2010; 1(4):194-208. https://doi.org/10.3390/f1040194
Chicago/Turabian StylePirotti, Francesco. 2010. "Assessing a Template Matching Approach for Tree Height and Position Extraction from Lidar-Derived Canopy Height Models of Pinus Pinaster Stands" Forests 1, no. 4: 194-208. https://doi.org/10.3390/f1040194
APA StylePirotti, F. (2010). Assessing a Template Matching Approach for Tree Height and Position Extraction from Lidar-Derived Canopy Height Models of Pinus Pinaster Stands. Forests, 1(4), 194-208. https://doi.org/10.3390/f1040194