
The Determinants of Equity Risk and Their Forecasting Implications: A Quantile Regression Perspective


Abstract
:1. Introduction
2. Realized Volatilities and Conditioning Variables
3. Modelling the Realized Range Conditional Quantiles
4. Density Forecast and Predictive Accuracy
5. Empirical Results
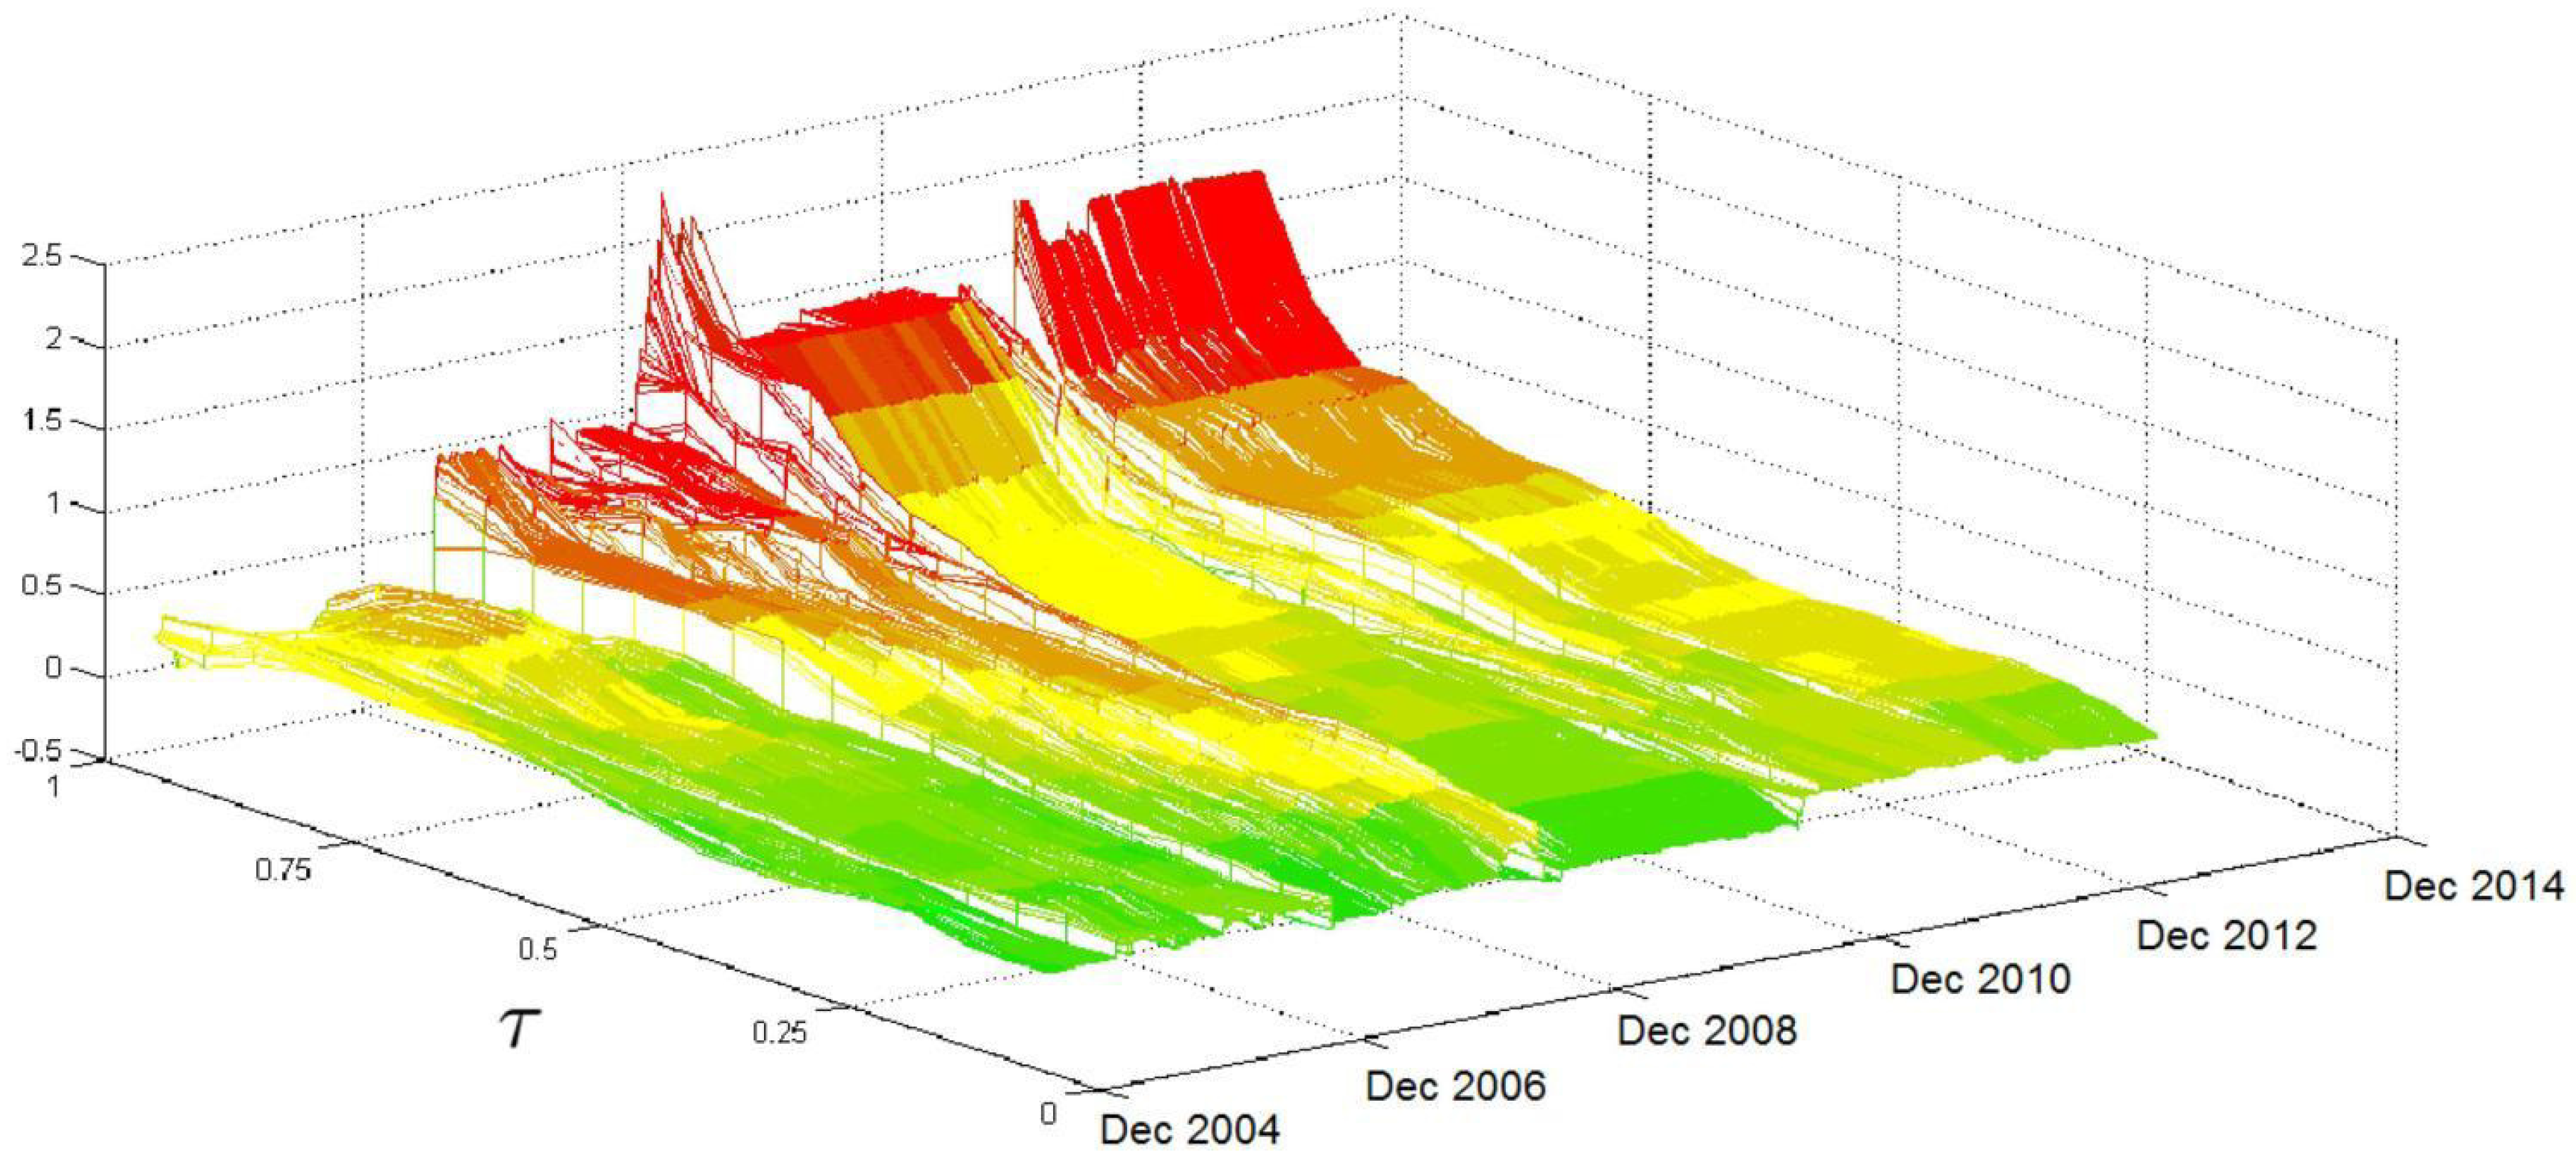
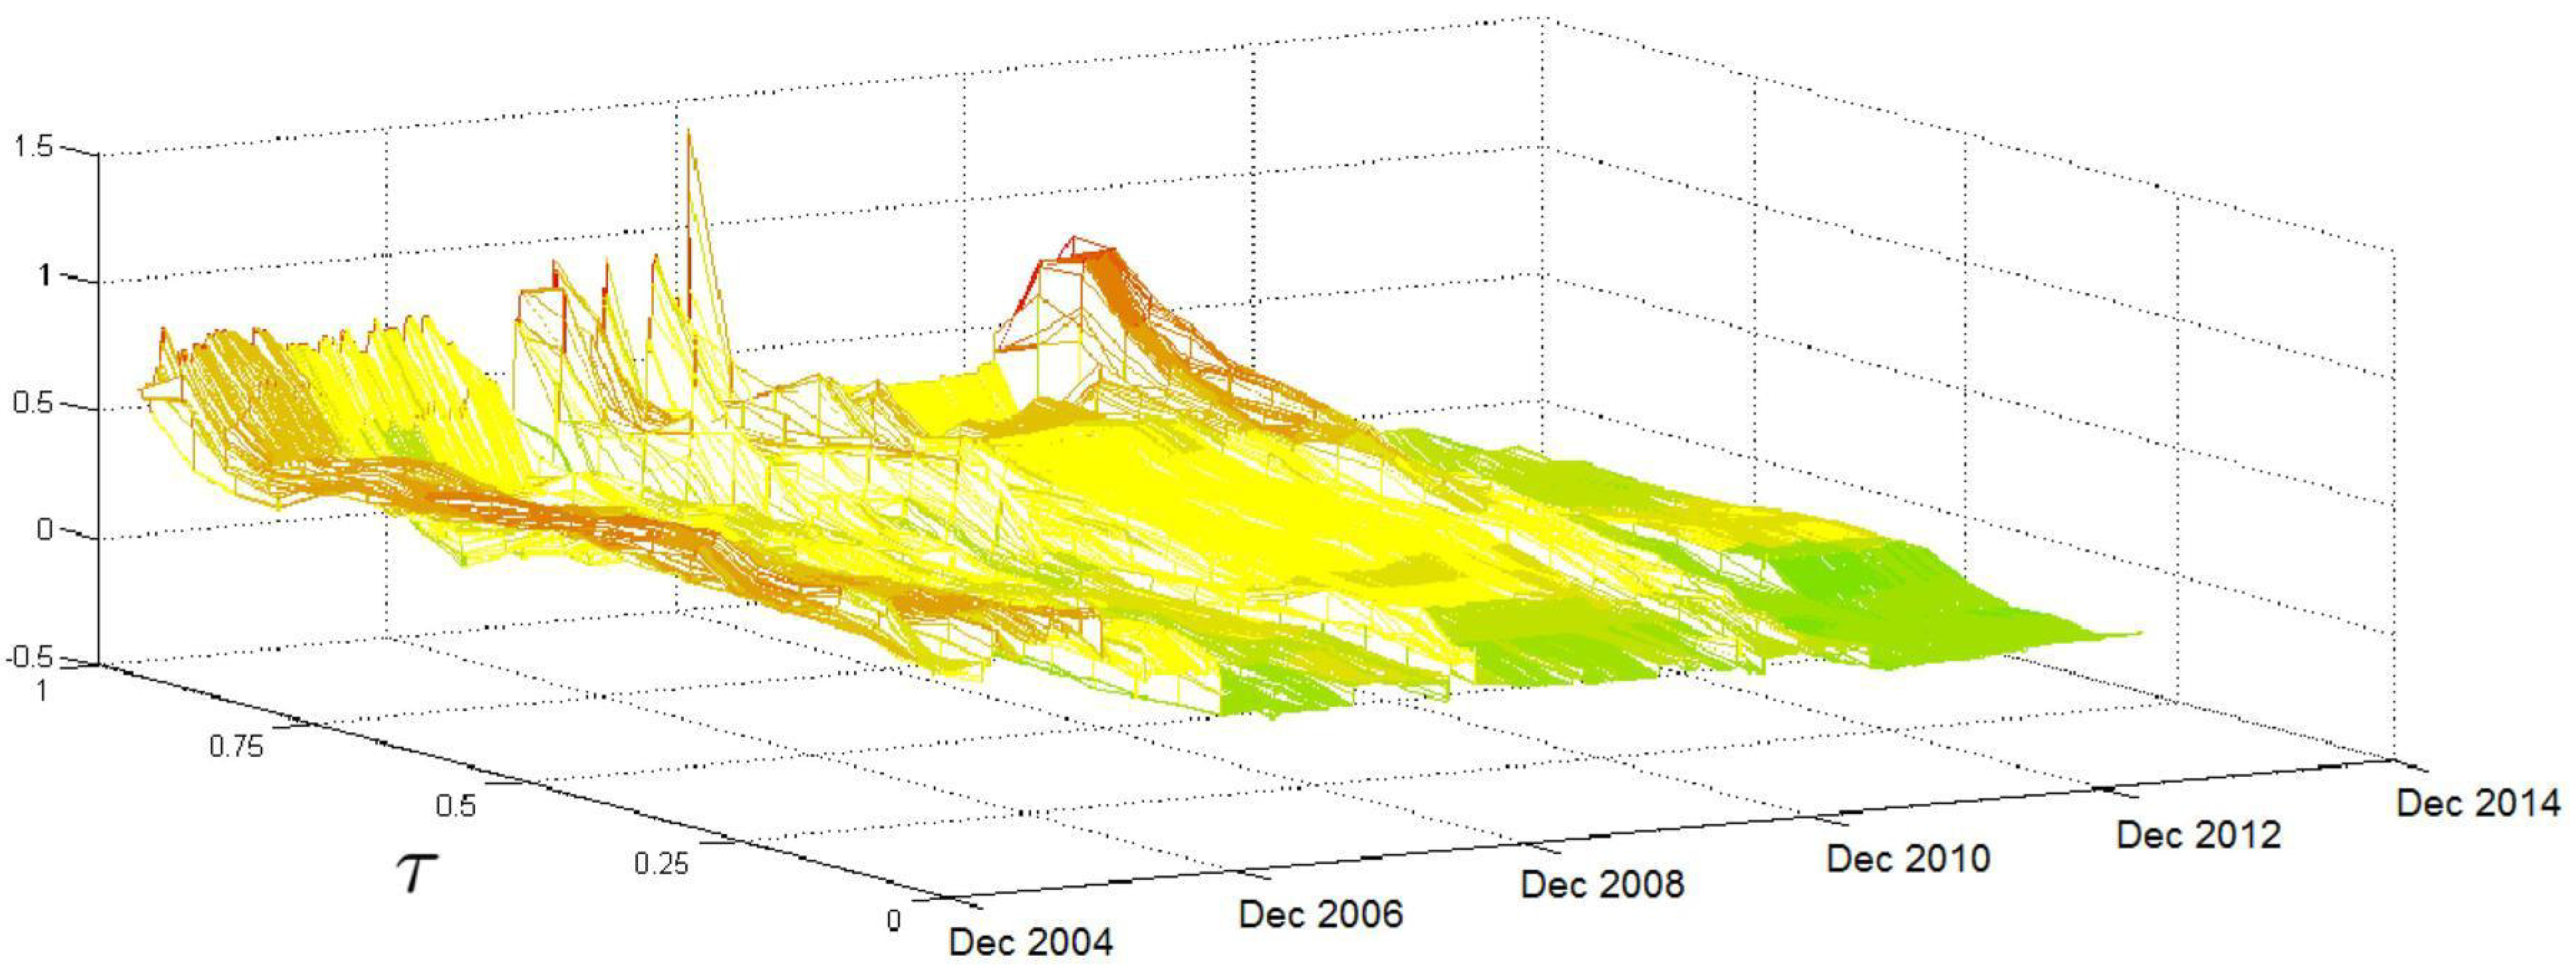
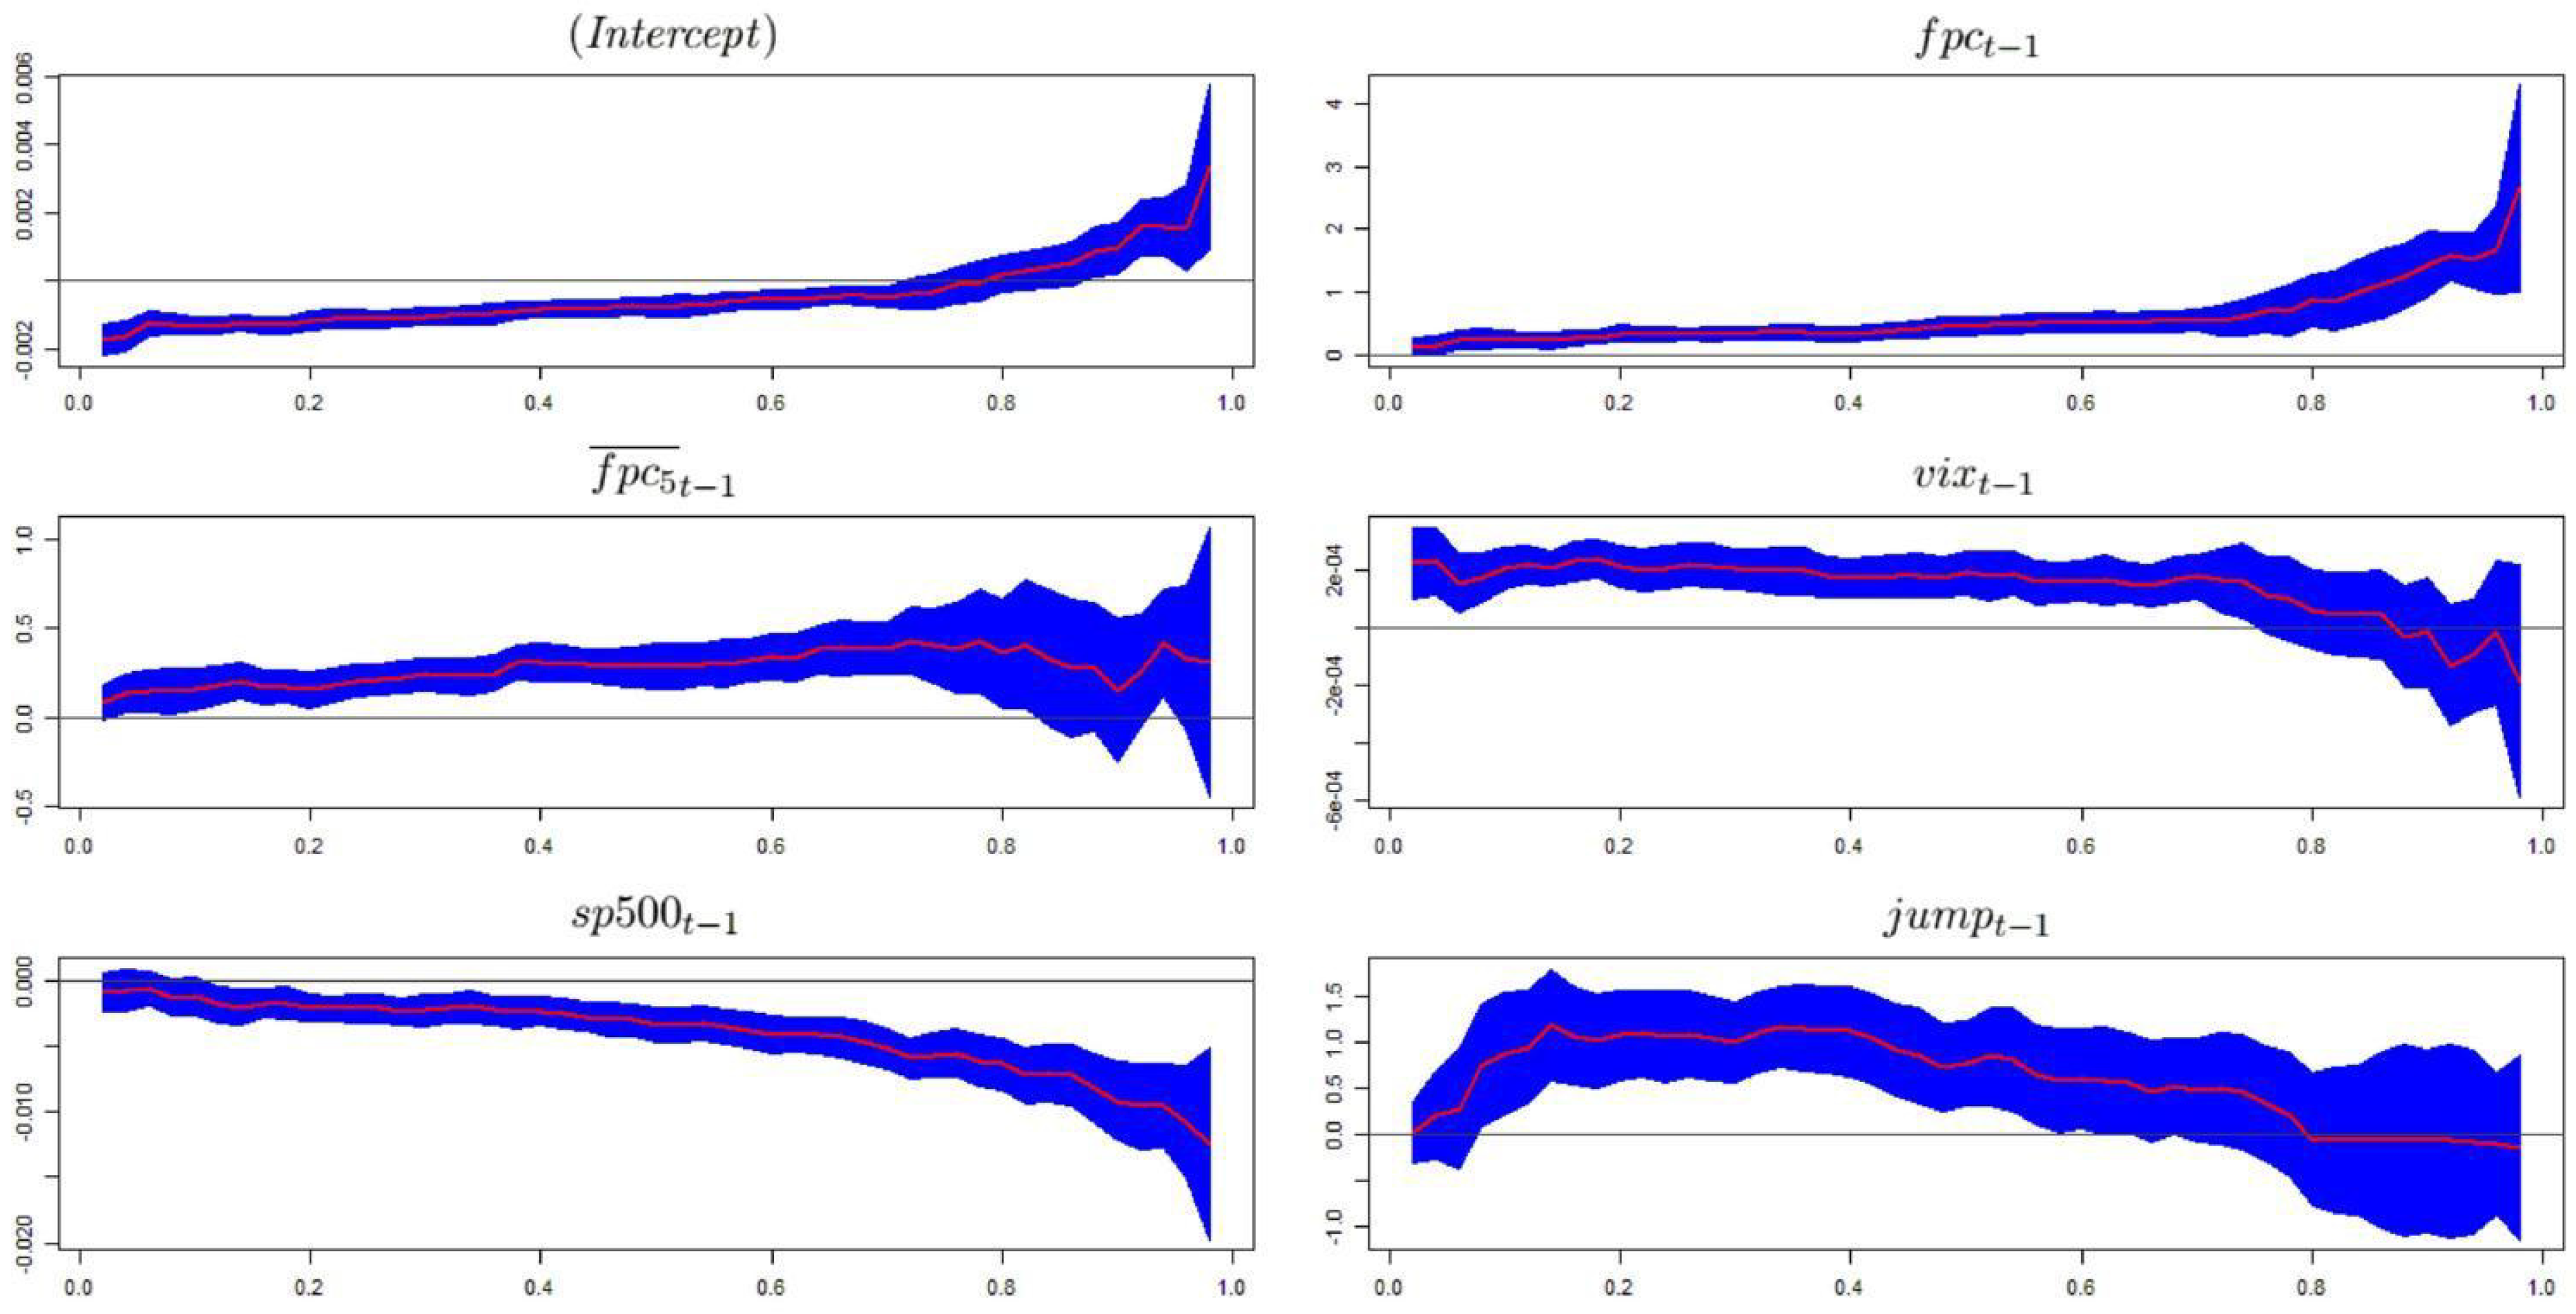
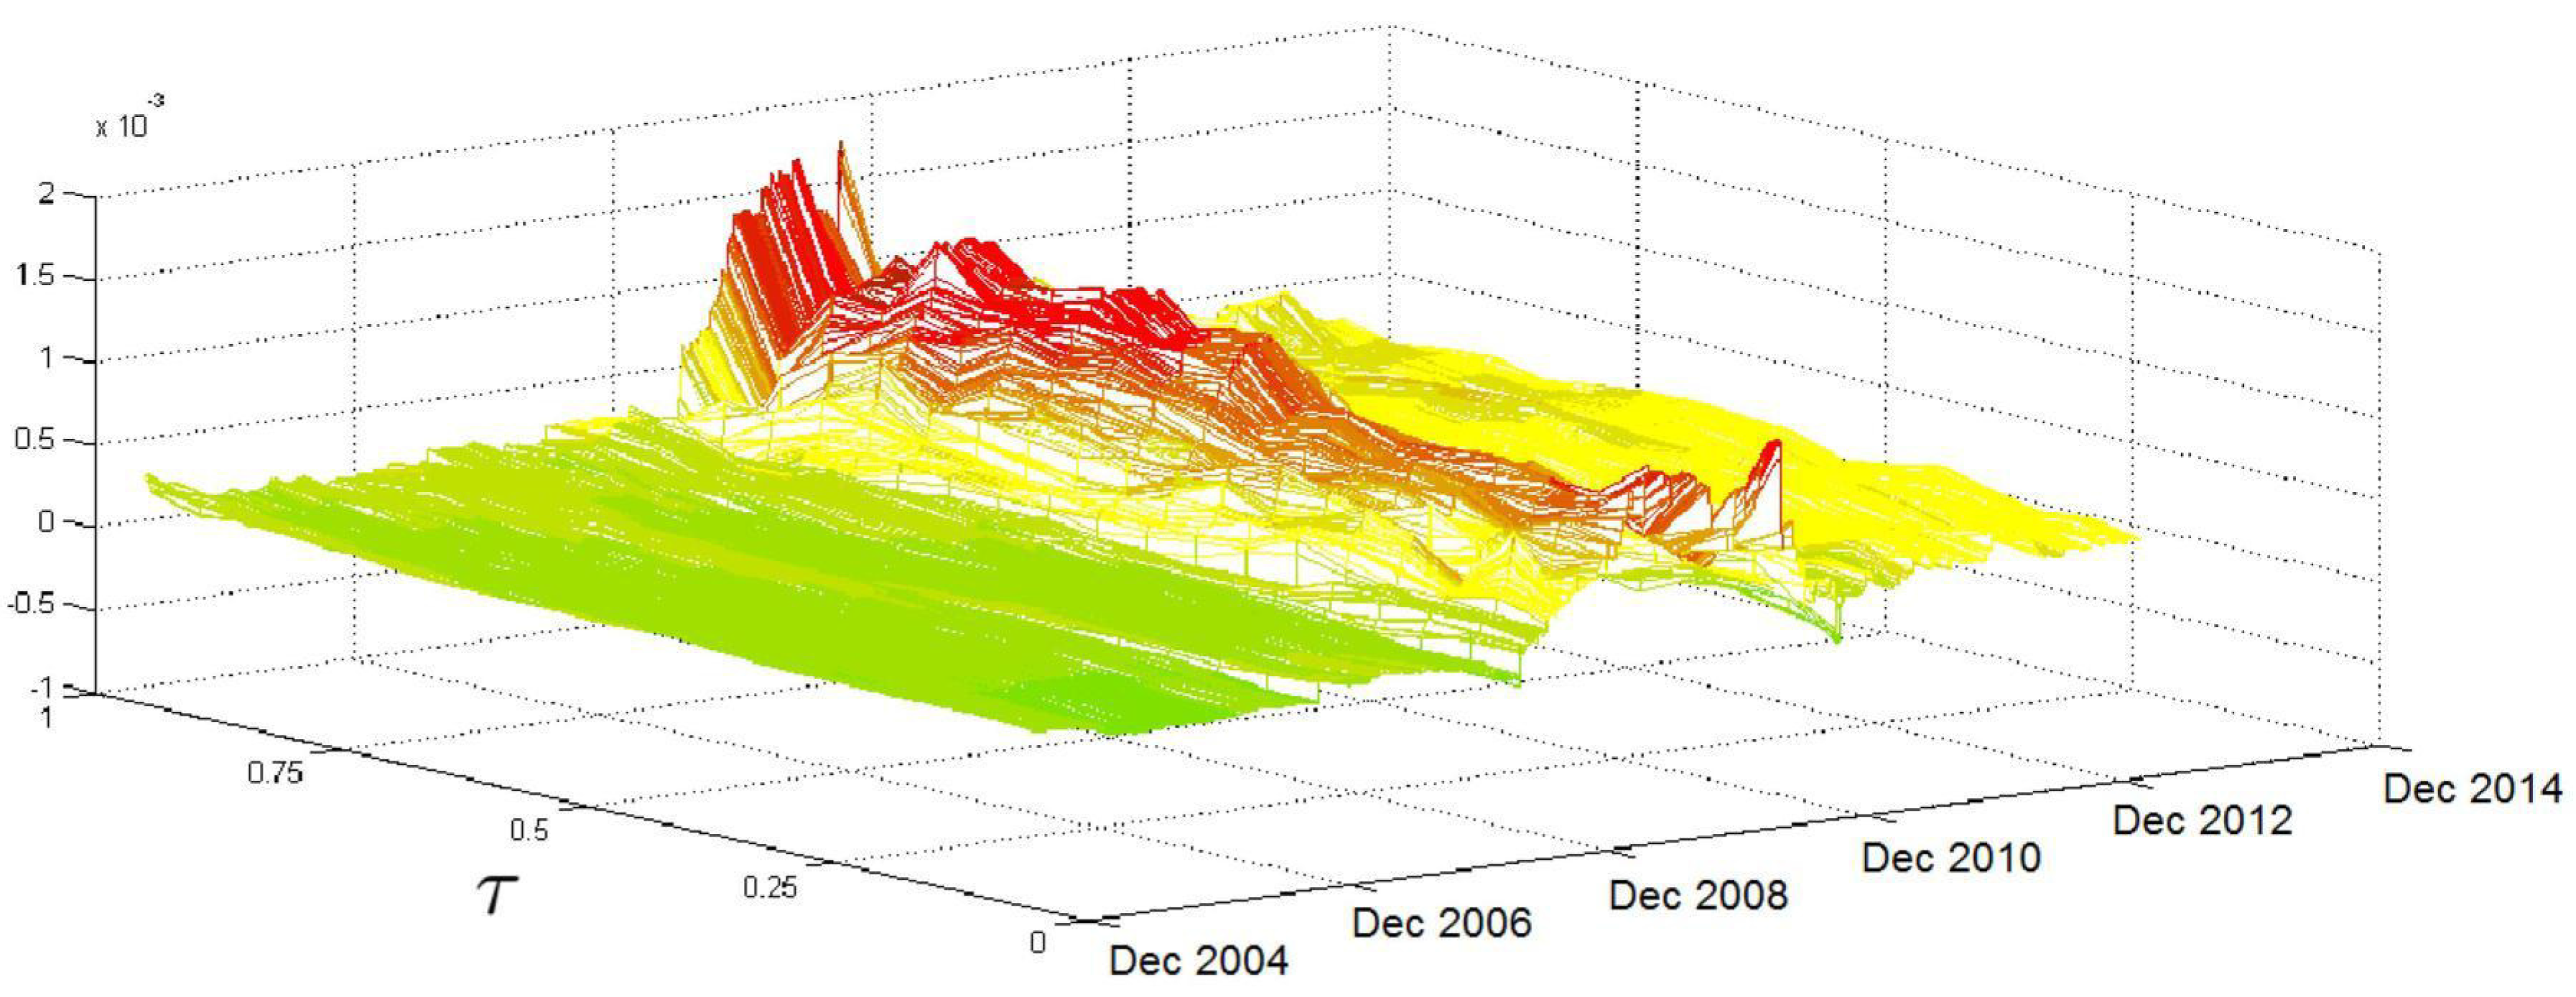
5.1. Full-Sample Analyses
5.2. Rolling Analysis
5.3. Evaluation of the Predictive Power
5.4. Single-Asset Results
6. Conclusions
Acknowledgments
Author Contributions
Conflicts of Interest
References
- F. Black, and M. Scholes. “The pricing of options and corporate liabilities.” J. Political Econ. 81 (1973): 637–654. [Google Scholar] [CrossRef]
- R.F. Engle. “Autoregressive conditional heteroscedasticity with estimates of the variance of United Kingdom inflations.” Econometrica 50 (1982): 987–1007. [Google Scholar] [CrossRef]
- T. Bollerslev. “Generalized autoregressive conditional heteroskedasticity.” J. Econom. 31 (1986): 307–327. [Google Scholar] [CrossRef]
- A. Melino, and S.M. Turnbull. “Pricing foreign currency options with stochastic volatility.” J. Econom. 45 (1990): 239–265. [Google Scholar] [CrossRef]
- S.J. Taylor. “Modeling stochastic volatility: a review and comparative study.” Math. Finance 4 (1994): 183–204. [Google Scholar] [CrossRef]
- A.C. Harvey, E. Ruiz, and N. Shephard. “Multivariate stochastic variance models.” Rev. Econ. Stud. 61 (1994): 247–264. [Google Scholar] [CrossRef]
- E. Jacquier, N. Polson, and P. Rossi. “Bayesian analysis of stochastic volatility models (with discussion).” J. Bus. Econ. Stat. 12 (1994): 371–417. [Google Scholar]
- R. Cont. “Empirical properties of asset returns: stylized facts and statistical issues.” Quant. Finance 1 (2001): 223–236. [Google Scholar] [CrossRef]
- F. Corsi. “A simple approximate long-memory model of realized volatility.” J. Financ. Econom. 7 (2009): 174–196. [Google Scholar] [CrossRef]
- T. Andersen, T. Bollerslev, F.X. Diebold, and P. Labys. “Modeling and Forecasting Realized Volatility.” Econometrica 71 (2003): 579–625. [Google Scholar] [CrossRef]
- M. Martens, and D. van Dijk. “Measuring volatility with the realized range.” J. Econom. 138 (2007): 181–207. [Google Scholar] [CrossRef]
- K. Christensen, M. Podolskij, and M. Vetter. “Bias-correcting the realized range-based variance in the presence of market microstructure noise.” Finance Stoch. 13 (2009): 239–268. [Google Scholar] [CrossRef]
- J. Hasbrouck. Empirical Market Microstructure. The Institutions, Economics, and Econometrics of Securities Trading. New York, NY, USA: Oxford University Press, 2006. [Google Scholar]
- M. O’Hara. Market Microstructure Theory. Cambridge, UK: Blackwell, 1998. [Google Scholar]
- R. Roll. “A simple model of the implicit bid-ask spread in an efficient market.” J. Finance 39 (1984): 1127–1139. [Google Scholar] [CrossRef]
- C. Christiansen, M. Schmeling, and A. Schrimpf. “A comprehensive look at financial volatility prediction by economic variables.” J. Appl. Econom. 27 (2012): 956–977. [Google Scholar] [CrossRef]
- B.S. Paye. “Déjà vol: Predictive regressions for aggregate stock market volatility using macroeconomic variables.” J. Financ. Econ. 106 (2012): 527–546. [Google Scholar] [CrossRef]
- M. Fernandes, M.C. Medeiros, and M. Scharth. Modeling and Predicting the Cboe Market Volatility Index. Textos para discussão, Escola de Economia de São Paulo, Getulio Vargas Foundation (Brazil) No. 342, 2009. [Google Scholar]
- M. Caporin, and G. Velo. Modeling and Forecasting Realized Range Volatility. Marco Fanno Working Paper No. 128-2011; Rochester, NY, USA: SSRN, 2011. [Google Scholar]
- M. Caporin, E. Rossi, and P.S. de Magistris. Conditional Jumps in Volatility and Their Economic Determinants. Rochester, NY, USA: SSRN, 2011. [Google Scholar]
- A. Opschoor, D.V. Dijk, and M.V. der Wel. “Predicting volatility and correlations with Financial Conditions Indexes.” J. Empir. Finance 29 (2014): 435–447. [Google Scholar] [CrossRef]
- R. Koenker, and G. Bassett. “Regression quantiles.” Econometrica 46 (1978): 33–50. [Google Scholar] [CrossRef]
- F. Engle, and S. Manganelli. “CAViaR: Conditional Autoregressive Value at Risk by Regression Quantiles.” J. Bus. Econ. Stat. 22 (2004): 367–381. [Google Scholar] [CrossRef]
- H. White, T.H. Kim, and S. Manganelli. Modeling Autoregressive Conditional Skewness and Kurtosis with Multi-Quantile CAViaR. Working Paper Series 0957; Frankfurt am Main, Germany: European Central Bank, 2008. [Google Scholar]
- H. White, T.H. Kim, and S. Manganelli. VAR for VaR: Measuring Systemic Risk Using Multivariate Regression Quantiles. MPRA Paper 35372; Munich, Germany: University Library of Munich, 2010. [Google Scholar]
- M.L. Li, and P. Miu. “A hybrid bankruptcy prediction model with dynamic loadings on accounting-ratio-based and market-based information: A binary quantile regression approach.” J. Empir. Finance 17 (2010): 818–833. [Google Scholar] [CrossRef]
- C. Castro, and S. Ferrari. “Measuring and testing for the systemically important financial institutions.” J. Empir. Finance 25 (2014): 1–14. [Google Scholar] [CrossRef]
- M. Caporin, L. Pelizzon, F. Ravazzolo, and R. Rigobon. Measuring Sovereign Contagion in Europe. NEBR Working paper No. 18741; Cambridge, MA, USA: National Bureau of Economic Research, 2014. [Google Scholar]
- F. Zikes, and J. Barunik. “Semiparametric Conditional Quantile Models for Financial Returns and Realized Volatility.” J. Financial Econom. 14 (2016): 185–226. [Google Scholar] [CrossRef]
- L.R. Glosten, R. Jagannathan, and D.E. Runkle. “On the relation between the expected value and the volatility of nominal excess return on stocks.” J. Finance 48 (1993): 1779–1801. [Google Scholar] [CrossRef]
- F. Corsi, S. Mittnik, C. Pigorsch, and U. Pigorsch. “The volatility of realized volatility.” Econom. Rev. 27 (2008): 46–78. [Google Scholar] [CrossRef]
- J. Berkowitz. “Testing density forecasts, with applications to risk management.” J. Bus. Econ. Stat. 19 (2001): 465–474. [Google Scholar] [CrossRef]
- G. Amisano, and R. Giacomini. “Comparing Density Forecasts via Weighted Likelihood Ratio Tests.” J. Bus. Econ. Stat. 25 (2007): 177–190. [Google Scholar] [CrossRef]
- F. Diebold, and R. Mariano. “Comparing Predictive Accuracy.” J. Bus. Econ. Stat. 20 (2002): 134–144. [Google Scholar] [CrossRef]
- J.E. Zhang, J. Shu, and M. Brenner. “The new market for volatility trading.” J. Futures Markets 30 (2010): 809–833. [Google Scholar] [CrossRef]
- S. Euan. Volatility Trading, 2nd ed. Hoboken, NJ, USA: John Wiley & Sons Inc., 2013. [Google Scholar]
- N. Shephard, and K.K. Sheppard. “Realising the future: Forecasting with high-frequency-based volatility (HEAVY) models.” J. Appl. Econom. 25 (2010): 197–231. [Google Scholar] [CrossRef]
- C.R. Nelson, and I.C. Plosser. “Trends and random walks in macroeconomic time series : Some evidence and implications.” J. Monet. Econ. 10 (1982): 139–162. [Google Scholar] [CrossRef]
- D. Dickey, and W.A. Fuller. “Likelihood Ratio Statistics for Autoregressive Time Series with a Unit Root.” Econometrica 49 (1981): 1057–1072. [Google Scholar] [CrossRef]
- P.C.B. Phillips, and P. Perron. “Testing for a Unit Root in Time Series Regression.” Biometrika 75 (1988): 335–346. [Google Scholar] [CrossRef]
- K. Christensen, and M. Podolskij. Range-Based Estimation of Quadratic Variation. Technical Reports 2006,37; Dortmund, Germany: Technische Universität Dortmund, Sonderforschungsbereich 475, 2006. [Google Scholar]
- K. Christensen, and M. Podolskij. “Realized range-based estimation of integrated variance.” J. Econom. 141 (2007): 323–349. [Google Scholar] [CrossRef]
- R. Koenker. “A note on L-estimators for linear models.” Stat. Probab. Lett. 2 (1984): 323–325. [Google Scholar] [CrossRef]
- H. Bondell, B. Reich, and H. Wang. “Non-crossing quantile regression curve estimation.” Biometrika 97 (2010): 825–838. [Google Scholar] [CrossRef] [PubMed]
- Y. Zhao. Real-Time Density Forecasts of Output and Inflation via Quantile Regression. Working Paper Series 1302; East Carolina University, 2013. [Google Scholar]
- V. Chernozhukov, I. Fernandez-Val, and A. Galichon. “Quantile and probability curves without crossing.” Econometrica 78 (2010): 1093–1125. [Google Scholar]
- W. Gaglianone, and L. Lima. “Constructing Density Forecasts from Quantile Regressions.” J. Money Credit Bank. 44 (2012): 1589–1607. [Google Scholar] [CrossRef]
- M. Rosenblatt. “Remarks on a multivariate transformation.” Ann. Math. Stat. 23 (1952): 470–472. [Google Scholar] [CrossRef]
- W.K. Newey, and K.D. West. “A Simple, Positive Semidefinite, Heteroskedasticity and Autocorrelation Consistent Covariance Matrix.” Econometrica 55 (1987): 703–708. [Google Scholar] [CrossRef]
- R. Koenker, and J.A.F. Machado. “Goodness of fit and related inference process for quantile regression.” J. Am. Stat. Assoc. 94 (1999): 1296–1310. [Google Scholar] [CrossRef]
- R. Koenker, and G. Bassett. “Tests of linear hypotheses and l1 estimation.” Econometrica 50 (1982): 1577–1583. [Google Scholar] [CrossRef]
- F. Corsi, D. Pirino, and R. Reno. “Threshold bipower variation and the impact of jumps on volatility forecasting.” J. Econom. 159 (2010): 276–288. [Google Scholar] [CrossRef]
- F. Black. “Studies of Stock Market Volatility Changes.” In Proceedings of the 1976 Meeting of the Business and Economic Statistics Section; Washington, DC, USA: American Statistical Association, 1976, pp. 177–181. [Google Scholar]
- R. Koenker, and G. Bassett. “Robust tests for heteroscedasticity based on regression quantiles.” Econometrica 50 (1982): 43–61. [Google Scholar] [CrossRef]


| Variable | Coefficient Value | p-Value |
|---|---|---|
| 0.24157 | 0.00548 | |
| 0.15385 | 0.03927 | |
| 0.00020 | 0.00001 | |
| 0.17431 | ||
| 0.87638 | 0.03242 | |
| 0.44580 | 0.00000 | |
| 0.28779 | 0.00013 | |
| 0.00019 | 0.00006 | |
| 0.00002 | ||
| 0.77113 | 0.01017 | |
| 1.44195 | 0.00000 | |
| 0.15027 | 0.52722 | |
| 0.87801 | ||
| 0.00000 | ||
| 0.90576 | ||
| τ | |||
|---|---|---|---|
| Unrestricted Model | Restricted Model | p-Value | |
| 0.1 | 0.3655 | 0.2940 | 0.0000 |
| 0.2 | 0.4439 | 0.3785 | 0.0000 |
| 0.3 | 0.5005 | 0.4422 | 0.0000 |
| 0.4 | 0.5427 | 0.4952 | 0.0000 |
| 0.5 | 0.5801 | 0.5396 | 0.0000 |
| 0.6 | 0.6142 | 0.5803 | 0.0000 |
| 0.7 | 0.6474 | 0.6223 | 0.0000 |
| 0.8 | 0.6865 | 0.6755 | 0.0007 |
| 0.9 | 0.7492 | 0.7467 | 0.9123 |
| Stocks | Intercept | |||||
|---|---|---|---|---|---|---|
| ATT | (11.24) | 4.589 (70.99) | 28.691 (0.12) | 0.002 (0.27) | 0.055 (0.09) | 3.515 (21.81) |
| BAC | (0.02) | 25.007 (0.00) | 14.869 (1.09) | 0.005 (0.01) | (18.18) | (99.31) |
| BOI | (0.09) | 15.852 (0.96) | 21.132 (0.01) | 0.004 (0.01) | (0.01) | 4.509 (37.15) |
| CAT | (0.00) | 10.649 (19.31) | 25.142 (0.00) | 0.006 (0.00) | (0.695) | (99.97) |
| CTG | (0.00) | 18.252 (3.74) | 12.645 (8.61) | 0.012 (0.00) | (8.24) | 95.128 (0.09) |
| FDX | (0.00) | 18.287 (0.46) | 23.422 (0.00) | 0.006 (0.00) | (0.34) | (11.99) |
| HON | (0.00) | 7.855 (36.51) | 26.336 (0.01) | 0.005 (0.00) | (0.05) | 1.054 (70.67) |
| HPQ | (1.75) | 16.799 (0.85) | 15.327 (0.33) | 0.003 (0.00) | (0.21) | (99.12) |
| IBM | (0.09) | 13.709 (19.22) | 22.922 (0.09) | 0.002 (0.01) | (0.39) | 23.369 (3.12) |
| JPM | (0.02) | 23.775 (2.59) | 14.460 (10.22) | 0.008 (0.01) | (13.31) | 2.273 (89.03) |
| MDZ | (0.00) | 8.280 (1.17) | 19.490 (0.00) | 0.002 (0.00) | (0.49) | (82.09) |
| PEP | (0.03) | (76.78) | 26.404 (0.00) | 0.003 (0.00) | (6.06) | 6.751 (32.14) |
| PRG | (0.08) | 1.883 (86.89) | 0.483 (91.48) | 0.003 (0.00) | (0.72) | 10.243 (49.12) |
| TWX | (1.15) | 13.005 (19.93) | 29.034 (0.00) | 0.003 (0.16) | (0.03) | 18.752 (0.85) |
| TXN | (19.32) | 9.522 (16.87) | 32.663 (0.00) | 0.002 (0.38) | (0.00) | 0.907 (82.14) |
| WFC | (0.00) | 20.878 (0.269) | 20.321 (0.02) | 0.005 (0.00) | (0.25) | (99.77) |
| ATT | (12.24) | 30.163 (0.67) | 52.921 (0.00) | 0.001 (4.07) | (0.00) | (91.67) |
| BAC | (0.19) | 38.505 (0.00) | 40.227 (0.00) | 0.005 (0.14) | (0.00) | 14.596 (66.46) |
| BOI | (0.01) | 36.842 (0.00) | 36.566 (0.00) | 0.005 (0.00) | (0.00) | 7.570 (35.86) |
| CAT | (0.00) | 40.863 (0.00) | 40.806 (0.00) | 0.005 (0.00) | (0.00) | (99.25) |
| CTG | (0.06) | 44.363 (0.00) | 25.602 (0.04) | 0.013 (0.05) | (0.41) | 71.026 (2.39) |
| FDX | (0.00) | 33.461 (0.00) | 44.110 (0.00) | 0.005 (0.00) | (0.00) | (11.64) |
| HON | (0.01) | 33.249 (0.02) | 42.692 (0.00) | 0.004 (0.00) | (0.00) | (34.55) |
| HPQ | (0.07) | 33.324 (0.00) | 39.040 (0.00) | 0.003 (0.00) | (0.00) | (69.97) |
| IBM | (0.14) | 33.790 (0.01) | 42.321 (0.00) | 0.002 (0.03) | (0.00) | 39.259 (15.63) |
| JPM | (0.01) | 50.524 (0.00) | 26.286 (0.00) | 0.007 (0.01) | (0.00) | (92.41) |
| MDZ | (0.00) | 30.852 (0.00) | 36.733 (0.00) | 0.003 (0.00) | (0.00) | (70.27) |
| PEP | (0.01) | 31.618 (3.74) | 39.554 (0.57) | 0.002 (0.00) | (0.00) | 3.569 (60.58) |
| PRG | (0.22) | 11.543 (65.76) | 21.804 (20.76) | 0.005 (0.13) | (0.55) | 120.000 (10.11) |
| TWX | (0.01) | 37.437 (0.00) | 39.468 (0.00) | 0.003 (0.00) | (0.00) | 18.763 (2.51) |
| TXN | (24.69) | 27.555 (0.00) | 49.860 (0.00) | 0.002 (0.63) | (0.00) | (91.84) |
| WFC | (0.59) | 37.207 (0.00) | 43.713 (0.00) | 0.005 (0.52) | (0.00) | (99.18) |
| ATT | (32.72) | 70.584 (0.00) | 69.582 (0.00) | 0.002 (14.33) | (0.00) | 0.282 (98.09) |
| BAC | (60.02) | 104.077 (0.00) | 48.227 (0.39) | 0.002 (60.64) | (0.02) | 156.280 (21.58) |
| BOI | (17.55) | 60.555 (0.01) | 79.933 (0.00) | 0.004 (14.54) | (0.00) | (97.86) |
| CAT | (40.02) | 79.303 (0.00) | 61.374 (0.00) | 0.003 (22.98) | (0.00) | (99.14) |
| CTG | (86.81) | 158.940 (0.11) | 19.051 (54.87) | 0.001 (83.97) | (0.02) | (15.63) |
| FDX | (16.06) | 57.441 (0.00) | 78.243 (0.00) | 0.004 (6.12) | (0.00) | (44.62) |
| HON | (9.87) | 69.621 (0.00) | 60.597 (0.00) | 0.005 (3.83) | (0.00) | (92.34) |
| HPQ | (12.83) | 72.014 (0.00) | 66.113 (0.00) | 0.004 (4.62) | (0.00) | (47.36) |
| IBM | (84.22) | 55.602 (2.08) | 101.283 (0.02) | 0.000 (89.26) | (0.00) | 41.659 (55.83) |
| JPM | (6.25) | 134.345 (0.00) | 17.516 (5.77) | 0.006 (6.81) | (0.00) | 155.650 (8.94) |
| MDZ | 0.000 (97.15) | 86.207 (0.00) | 53.696 (0.18) | 0.001 (50.69) | (0.00) | -3.639 (23.02) |
| PEP | 0.000 (91.96) | 36.885 (36.23) | 117.046 (2.80) | 0.000 (86.11) | (0.28) | (96.86) |
| PRG | (2.21) | 59.766 (16.98) | 47.298 (13.89) | 0.004 (1.35) | (0.01) | 152.132 (37.35) |
| TWX | (0.48) | 86.695 (0.00) | 52.144 (0.00) | 0.004 (0.42) | (0.00) | (94.69) |
| TXN | (0.22) | 56.407 (0.00) | 80.214 (0.00) | 0.007 (0.03) | (0.00) | 4.170 (60.83) |
| WFC | (57.68) | 94.470 (0.00) | 64.679 (0.00) | 0.002 (53.26) | (0.00) | (99.59) |
| Asset | ||
|---|---|---|
| ATT | 10.23 (0.0167) | 150.26 (0.0000) |
| BAC | 3.00 (0.3916) | 125.11 (0.0000) |
| BOI | 7.90 (0.04812) | 93.09 (0.0000) |
| CAT | 9.31 (0.0254) | 88.11 (0.0000) |
| CTG | 4.28 (0.2327) | 142.99 (0.0000) |
| FDX | 12.62 (0.0055) | 95.63 (0.0000) |
| HON | 5.95 (0.1140) | 115.59 (0.0000) |
| HPQ | 5.33 (0.1491) | 83.80 (0.0000) |
| IBM | 4.25 (0.2357) | 157.06 (0.0000) |
| JPM | 3.26 (0.3532) | 124.01 (0.0000) |
| MDZ | 5.49 (0.1392) | 159.86 (0.0000) |
| PEP | 9.97 (0.0188) | 164.45 (0.0000) |
| PRG | 2.25 (0.5222) | 130.88 (0.0000) |
| TWX | 11.09 (0.0112) | 99.10 (0.0000) |
| TXN | 1.90 (0.5934) | 79.09 (0.0000) |
| WFC | 7.04 (0.0706) | 143.04 (0.0000) |
| Asset | ||||
|---|---|---|---|---|
| ATT | 3.8957 (0.0001) | 4.3336 (0.0000) | 2.8878 (0.0039) | 4.6406 (0.0000) |
| BAC | 4.0325 (0.0001) | 4.3822 (0.0000) | 3.0110 (0.0026) | 5.4706 (0.0000) |
| BOI | 13.9648 (0.0000) | 9.3975 (0.0000) | 18.9700 (0.0000) | 9.4658 (0.0000) |
| CAT | 4.3298 (0.0000) | 4.5230 (0.0000) | 2.9384 (0.0033) | 5.1361 (0.0000) |
| CTG | 3.6318 (0.0003) | 3.7586 (0.0002) | 2.8238 (0.0047) | 4.1108 (0.0000) |
| FDX | 3.0102 (0.0026) | 2.9183 (0.0035) | 3.9842 (0.0001) | 2.0103 (0.0444) |
| HON | 2.9055 (0.0037) | 3.0381 (0.0024) | 2.4728 (0.0134) | 2.8784 (0.0040) |
| HPQ | 16.6222 (0.0000) | 7.4219 (0.0000) | 2.7958 (0.0052) | 5.3210 (0.0000) |
| IBM | (0.8251) | 0.3105 (0.7562) | (0.5461) | 0.5044 (0.6140) |
| JPM | 0.7630 (0.4455) | 0.6326 (0.5270) | 1.0247 (0.3055) | 0.4642 (0.6425) |
| MDZ | (0.6954) | (0.7004) | (0.7230) | (0.6759) |
| PEP | 1.0614 (0.2885) | 2.1311 (0.0331) | 0.0232 (0.9815) | 2.8849 (0.0039) |
| PRG | 3.2625 (0.0011) | 3.2615 (0.0011) | 3.3250 (0.0009) | 3.2064 (0.0013) |
| TWX | 0.4999 (0.6171) | 0.0756 (0.9397) | 1.7995 (0.0719) | 0.1434 (0.8860) |
| TXN | 3.1661 (0.0015) | 3.1672 (0.0015) | 2.4961 (0.0126) | 3.0988 (0.0019) |
| WFC | 3.0723 (0.0021) | 3.1620 (0.0016) | 2.4755 (0.0133) | 3.2976 (0.0010) |
| Asset | |||
|---|---|---|---|
| ATT | (0.0545) | (0.0029) | (0.0022) |
| BAC | (0.1016) | (0.0530) | (0.0664) |
| BOI | (0.0662) | (0.0011) | (0.0007) |
| CAT | (0.0238) | (0.0012) | (0.0041) |
| CTG | (0.0623) | (0.0469) | (0.0826) |
| FDX | (0.0442) | (0.0073) | (0.0018) |
| HON | (0.0587) | (0.0208) | (0.0011) |
| HPQ | (0.1548) | (0.0004) | (0.0094) |
| IBM | (0.0085) | (0.0000) | (0.0000) |
| JPM | (0.0456) | (0.0427) | (0.0172) |
| MDZ | (0.0046) | (0.0000) | (0.0000) |
| PEP | (0.0131) | (0.0000) | (0.0000) |
| PRG | (0.0009) | (0.0000) | (0.0000) |
| TWX | (0.1010) | (0.0055) | (0.0359) |
| TXN | (0.1518) | (0.0020) | (0.0417) |
| WFC | (0.0919) | (0.0828) | (0.0196) |
© 2016 by the authors; licensee MDPI, Basel, Switzerland. This article is an open access article distributed under the terms and conditions of the Creative Commons Attribution (CC-BY) license (http://creativecommons.org/licenses/by/4.0/).
Share and Cite
Bonaccolto, G.; Caporin, M. The Determinants of Equity Risk and Their Forecasting Implications: A Quantile Regression Perspective. J. Risk Financial Manag. 2016, 9, 8. https://doi.org/10.3390/jrfm9030008
Bonaccolto G, Caporin M. The Determinants of Equity Risk and Their Forecasting Implications: A Quantile Regression Perspective. Journal of Risk and Financial Management. 2016; 9(3):8. https://doi.org/10.3390/jrfm9030008
Chicago/Turabian StyleBonaccolto, Giovanni, and Massimiliano Caporin. 2016. "The Determinants of Equity Risk and Their Forecasting Implications: A Quantile Regression Perspective" Journal of Risk and Financial Management 9, no. 3: 8. https://doi.org/10.3390/jrfm9030008
APA StyleBonaccolto, G., & Caporin, M. (2016). The Determinants of Equity Risk and Their Forecasting Implications: A Quantile Regression Perspective. Journal of Risk and Financial Management, 9(3), 8. https://doi.org/10.3390/jrfm9030008