1. INTRODUCTION
China has made great progress in economic growth during the past decades and must continue to develop at a quick pace in the future. Construction, transportation, and port industry, in particular, play an important role in supporting the country’s economy. There has been a trend of reforming the port industry globally, especially pushing the revolution of privatization of public ports. The driving force of the reform is to increase efficiency in the industry. The purpose of this study is to reexamine in what circumstances Chinese ports perform effectively, and what the policy implications are to the policy makers.
Historically, the China ports were owned and operated by the government. Similar to most government entities, employees and managerial staff were less motivated which led to inefficient performance. In the past few decades, China has pushed the institutional reform of ownership structure in many industries. The port industry is unique in a way that it is a monopoly, preventing private companies from entering. Port authorities in China are government entities; however, corporatization and stock market offerings provide access to private capital funds.
This kind of competition may affect port efficiency. Competition can lead to optimal levels of operation and better prices. Long coastlines in China, along with a high concentration of regional ports, intensify the level of potential intra-port competition. If the port is operated by the government, supporting the trend of the nation’s economy and local development in the long run will be the first priority. But if a company, not the government, is in charge of the port, then profit maximization will be the objective for shareholders. Ports run most efficiently when they are owned by private companies that compete against each other.
This article aims to examine which of these key variables promote port efficiency
Going public (corporatization)
Competition of market share (concentration)
Institutional reform of private sector involvement (privatization)
To reach production efficiency and financial performance, we used econometric methods to analyze nine of China’s mega ports in Bohai Economic Rim.
2. LITERATURE REVIEW
Since the latest port reform in China in late 1970, particular attention has been given to the role of port governance, port management, efficiency, competition, and privatization in China. Using the data of 50 Asian container ports in the year of 1999, Tongzon and Heng (1999) found that private sector participation in the port industry improved operation efficiency. However, full port privatization was rare. They found that the best practice to gain competitive advantage was partial privatization at the rate of 67%. Cullinane and Song (2003) also noted that private sector involvement improved production efficiency of Korean container terminals. Similarly, Tongzon and Heng (2005) concluded that private sector participation in the Asian, European, and American container terminals improved port operation efficiency.
Even though we found some supportive literature for privatization, the effect of privatization on efficiency still remains unambiguous. Focused on performance of UK ports, Saundry and Turnbull (1997) noted that when compared to the publicly owned ports, financial performance of privatized ports did not meet the expectation. Potential profit earnings from privatization are at the expense of public shareholders. In addition, privatization constrains certain forms of competition, and entry barriers influence traffic volume and public interest negatively. Cullinane, et al. (2005) used a DEA model to test the connection between ownership structure of ports and port efficiency. However, no clear theoretical relationship was found.
That research shown above means the public sector still plays an important role in the ownership structure, which is consistent with the research of Baird (2002), ” although the influence of private sector actors in ports is growing, the role of public sector agencies also remains significant.” In the survey of International Association of Ports and Harbours (IAPH), Baird concluded that one-size-fit-all analysis of port investment and privatization was not common in practice. The public sector is critical, especially in seaport planning and investment.
2.1 Background
The Bohai Economic Rim is critical to China’s economy due to its unique location and natural resources.
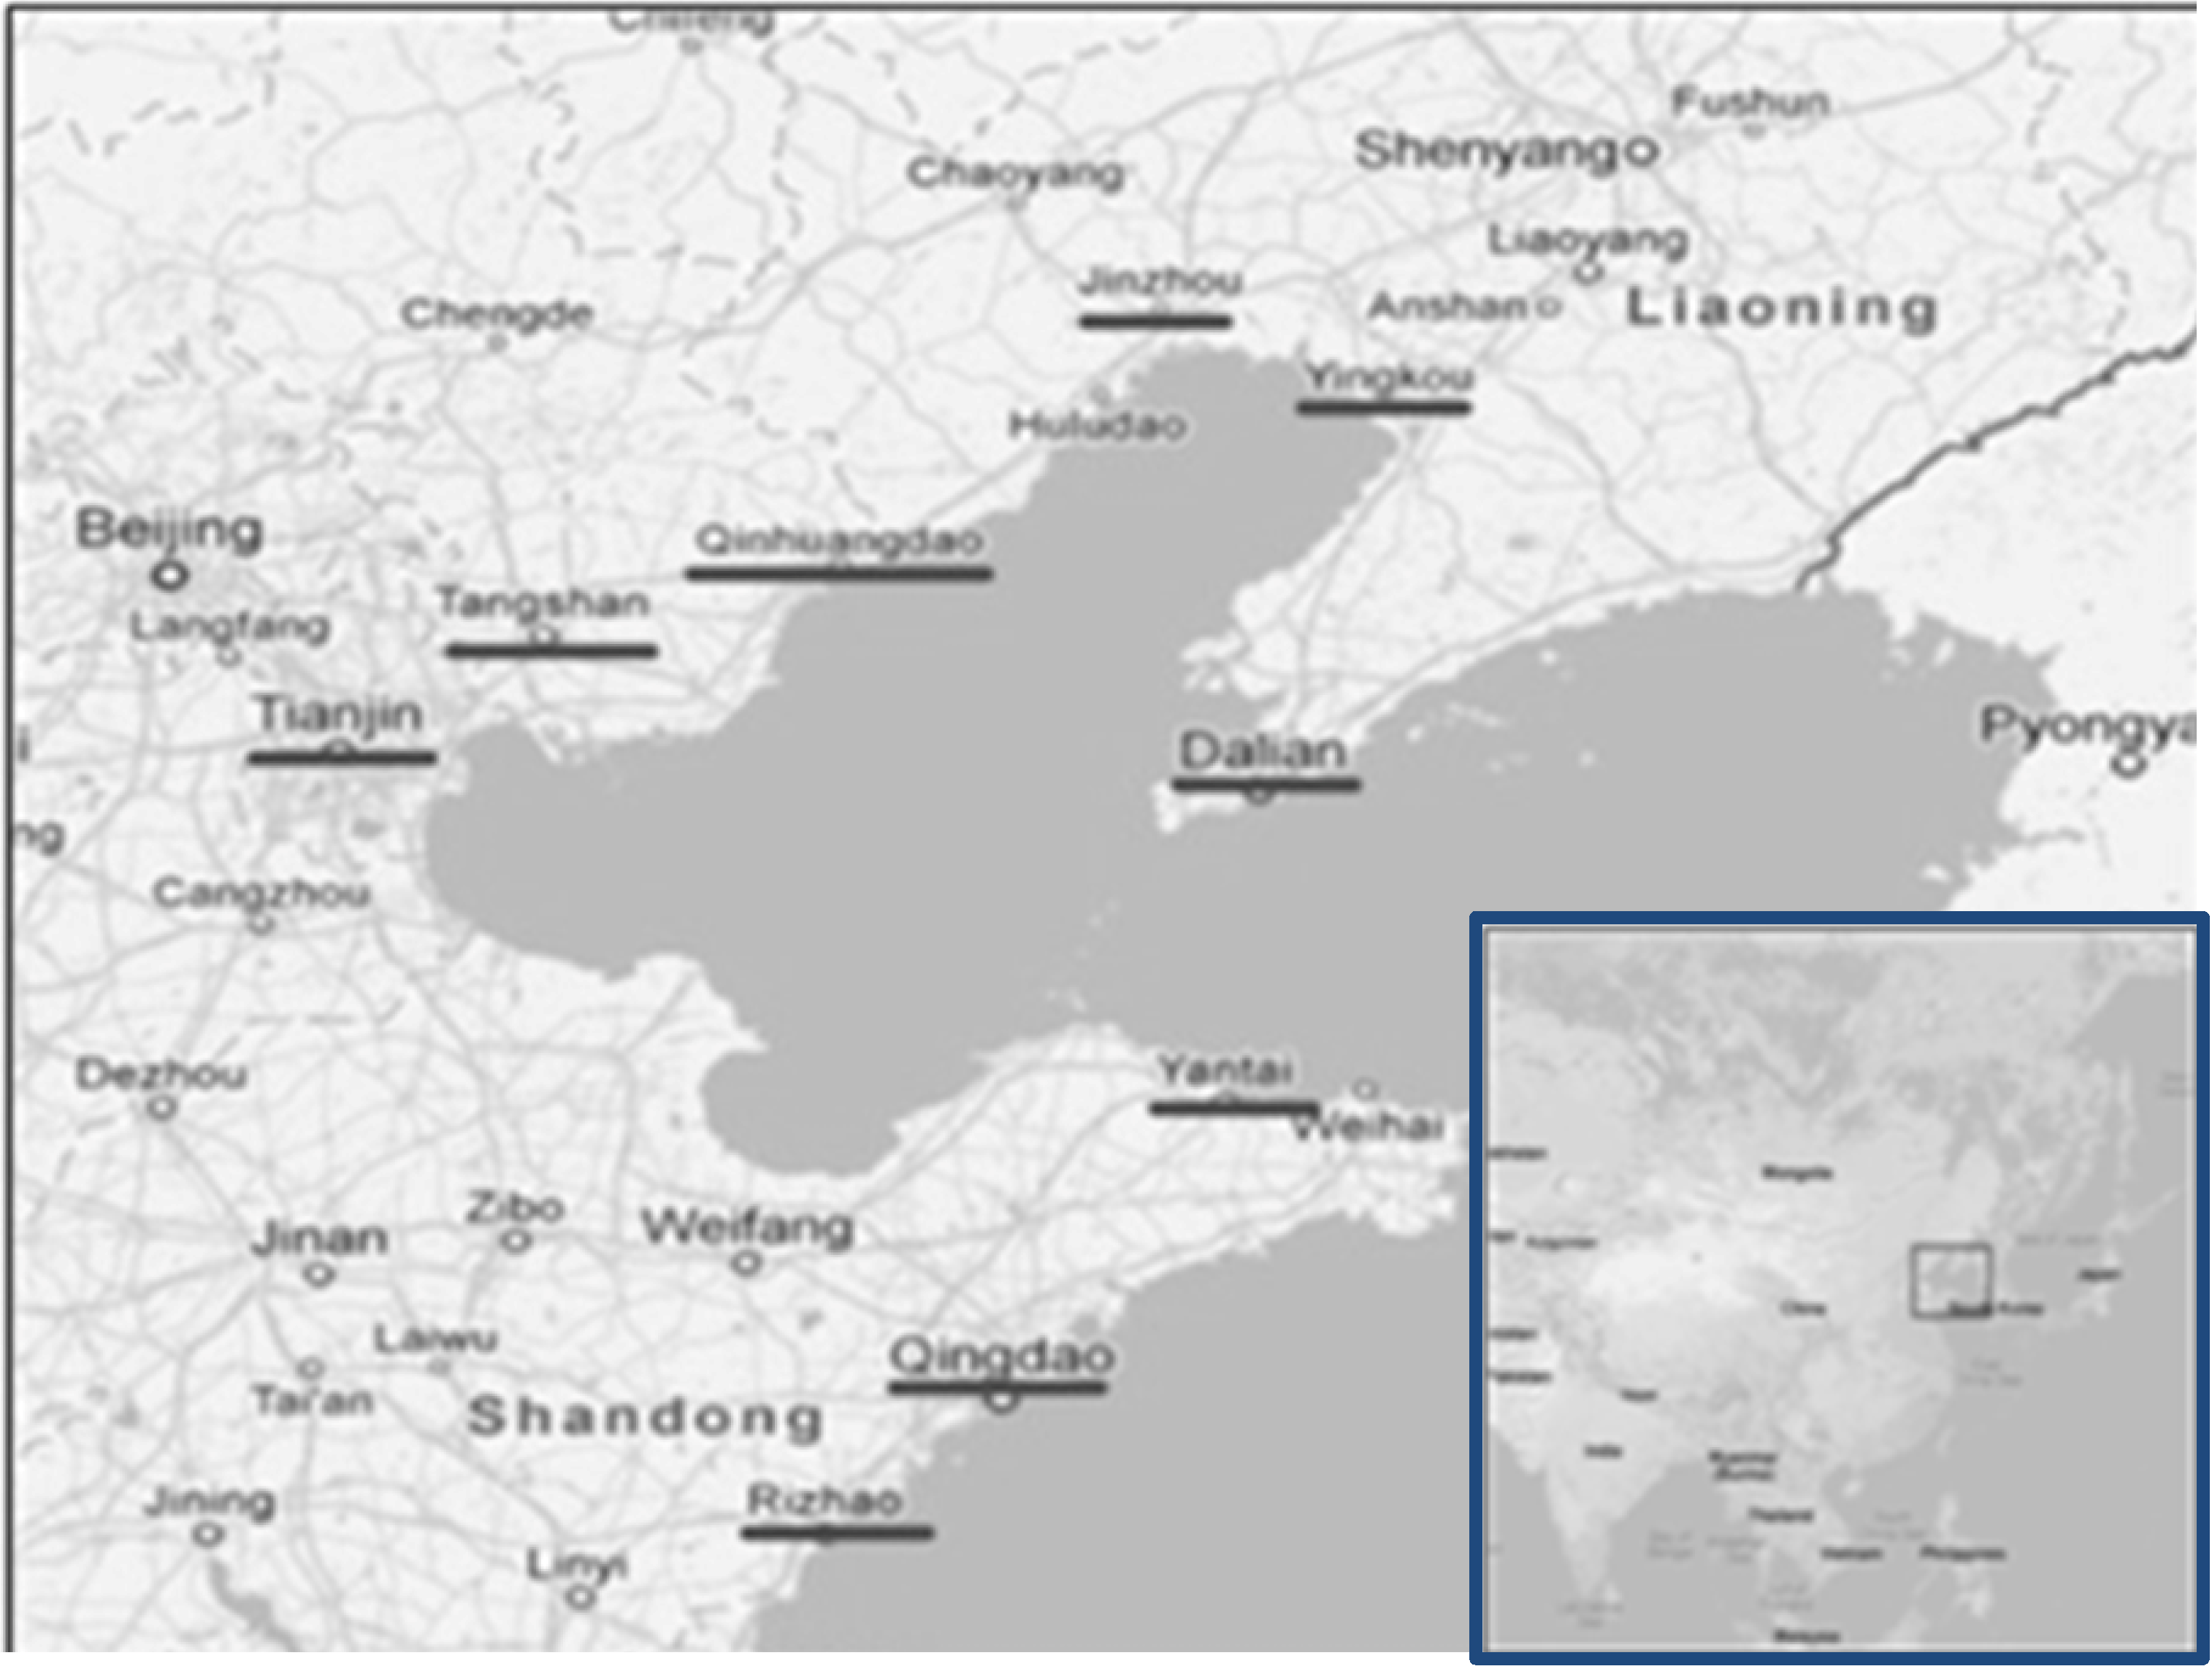
Figure 1 includes the nine selected ports in the Bahai Economic Rim --- Tianjin, Dalian, Tangshan, Rizhao, Yingkou, Jinzhou, Qinhuangdao, Yantai, and Qingdao. Ports in the region have the hinterland of the Northern and Northwestern China, including China’s capital and China’s main production area of coal and ore. Besides, the ports around the Bohai gulf are comparatively within short distance between each other. The distance between Rizhao Port and Qingdao Port is less than 80 miles. Even though close cooperation is encouraged by the Chinese government, intra-port competition is anticipated in the region.
Figure 1.
Bohai Economic Rim with Selected Nine Ports
Figure 1.
Bohai Economic Rim with Selected Nine Ports
Source: Google Maps
The size of the ports varies. Some ports are among the list of top ten Chinese mega ports. For example, the Qingdao Port and the Tianjin Port are among the top five container ports of China.
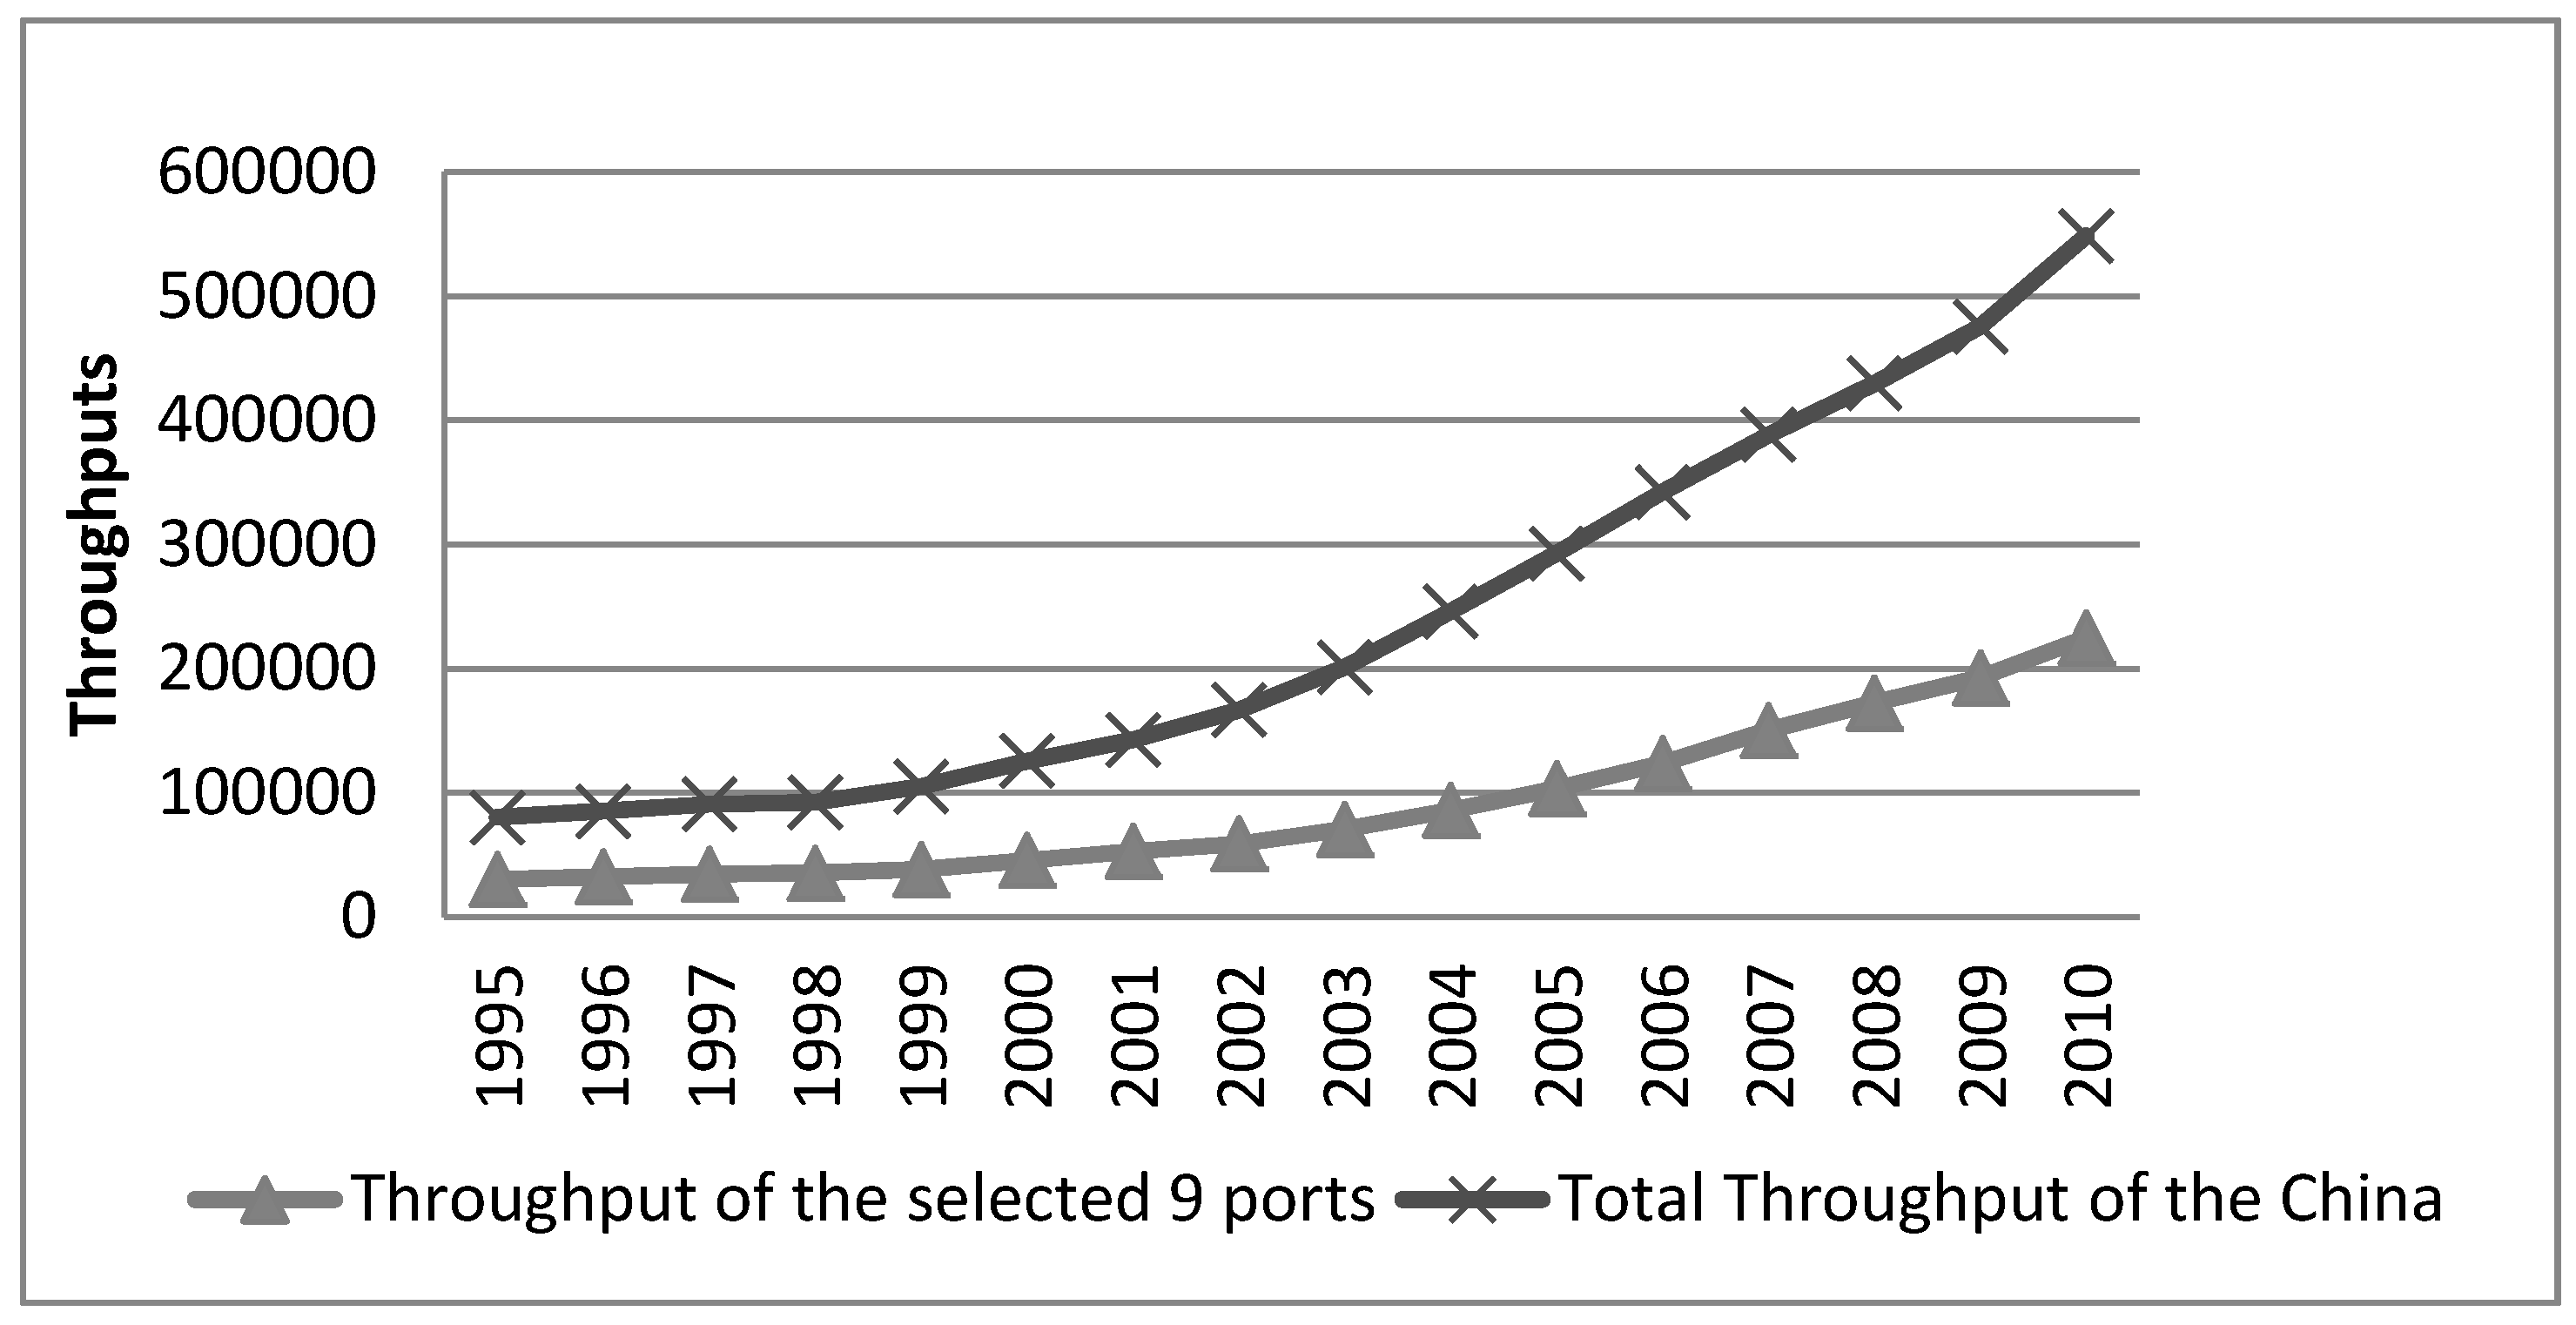
Figure 2 presents the relative throughputs in the Bohai Economic Rim within the nine selected ports compared to the overall China throughputs from 1995 to 2010. We observe an increase in throughputs in the study area, and that contributes to part of the overall economic production of maritime transportation in China. We foresee a fast growing demand of maritime services. Critical issues for decision makers in a port include how to maintain the growth of business in a relatively competitive market, whether port operates at its optimal scale given the resources and infrastructure available, and the key factors that lead to long-term sustainability in business development.
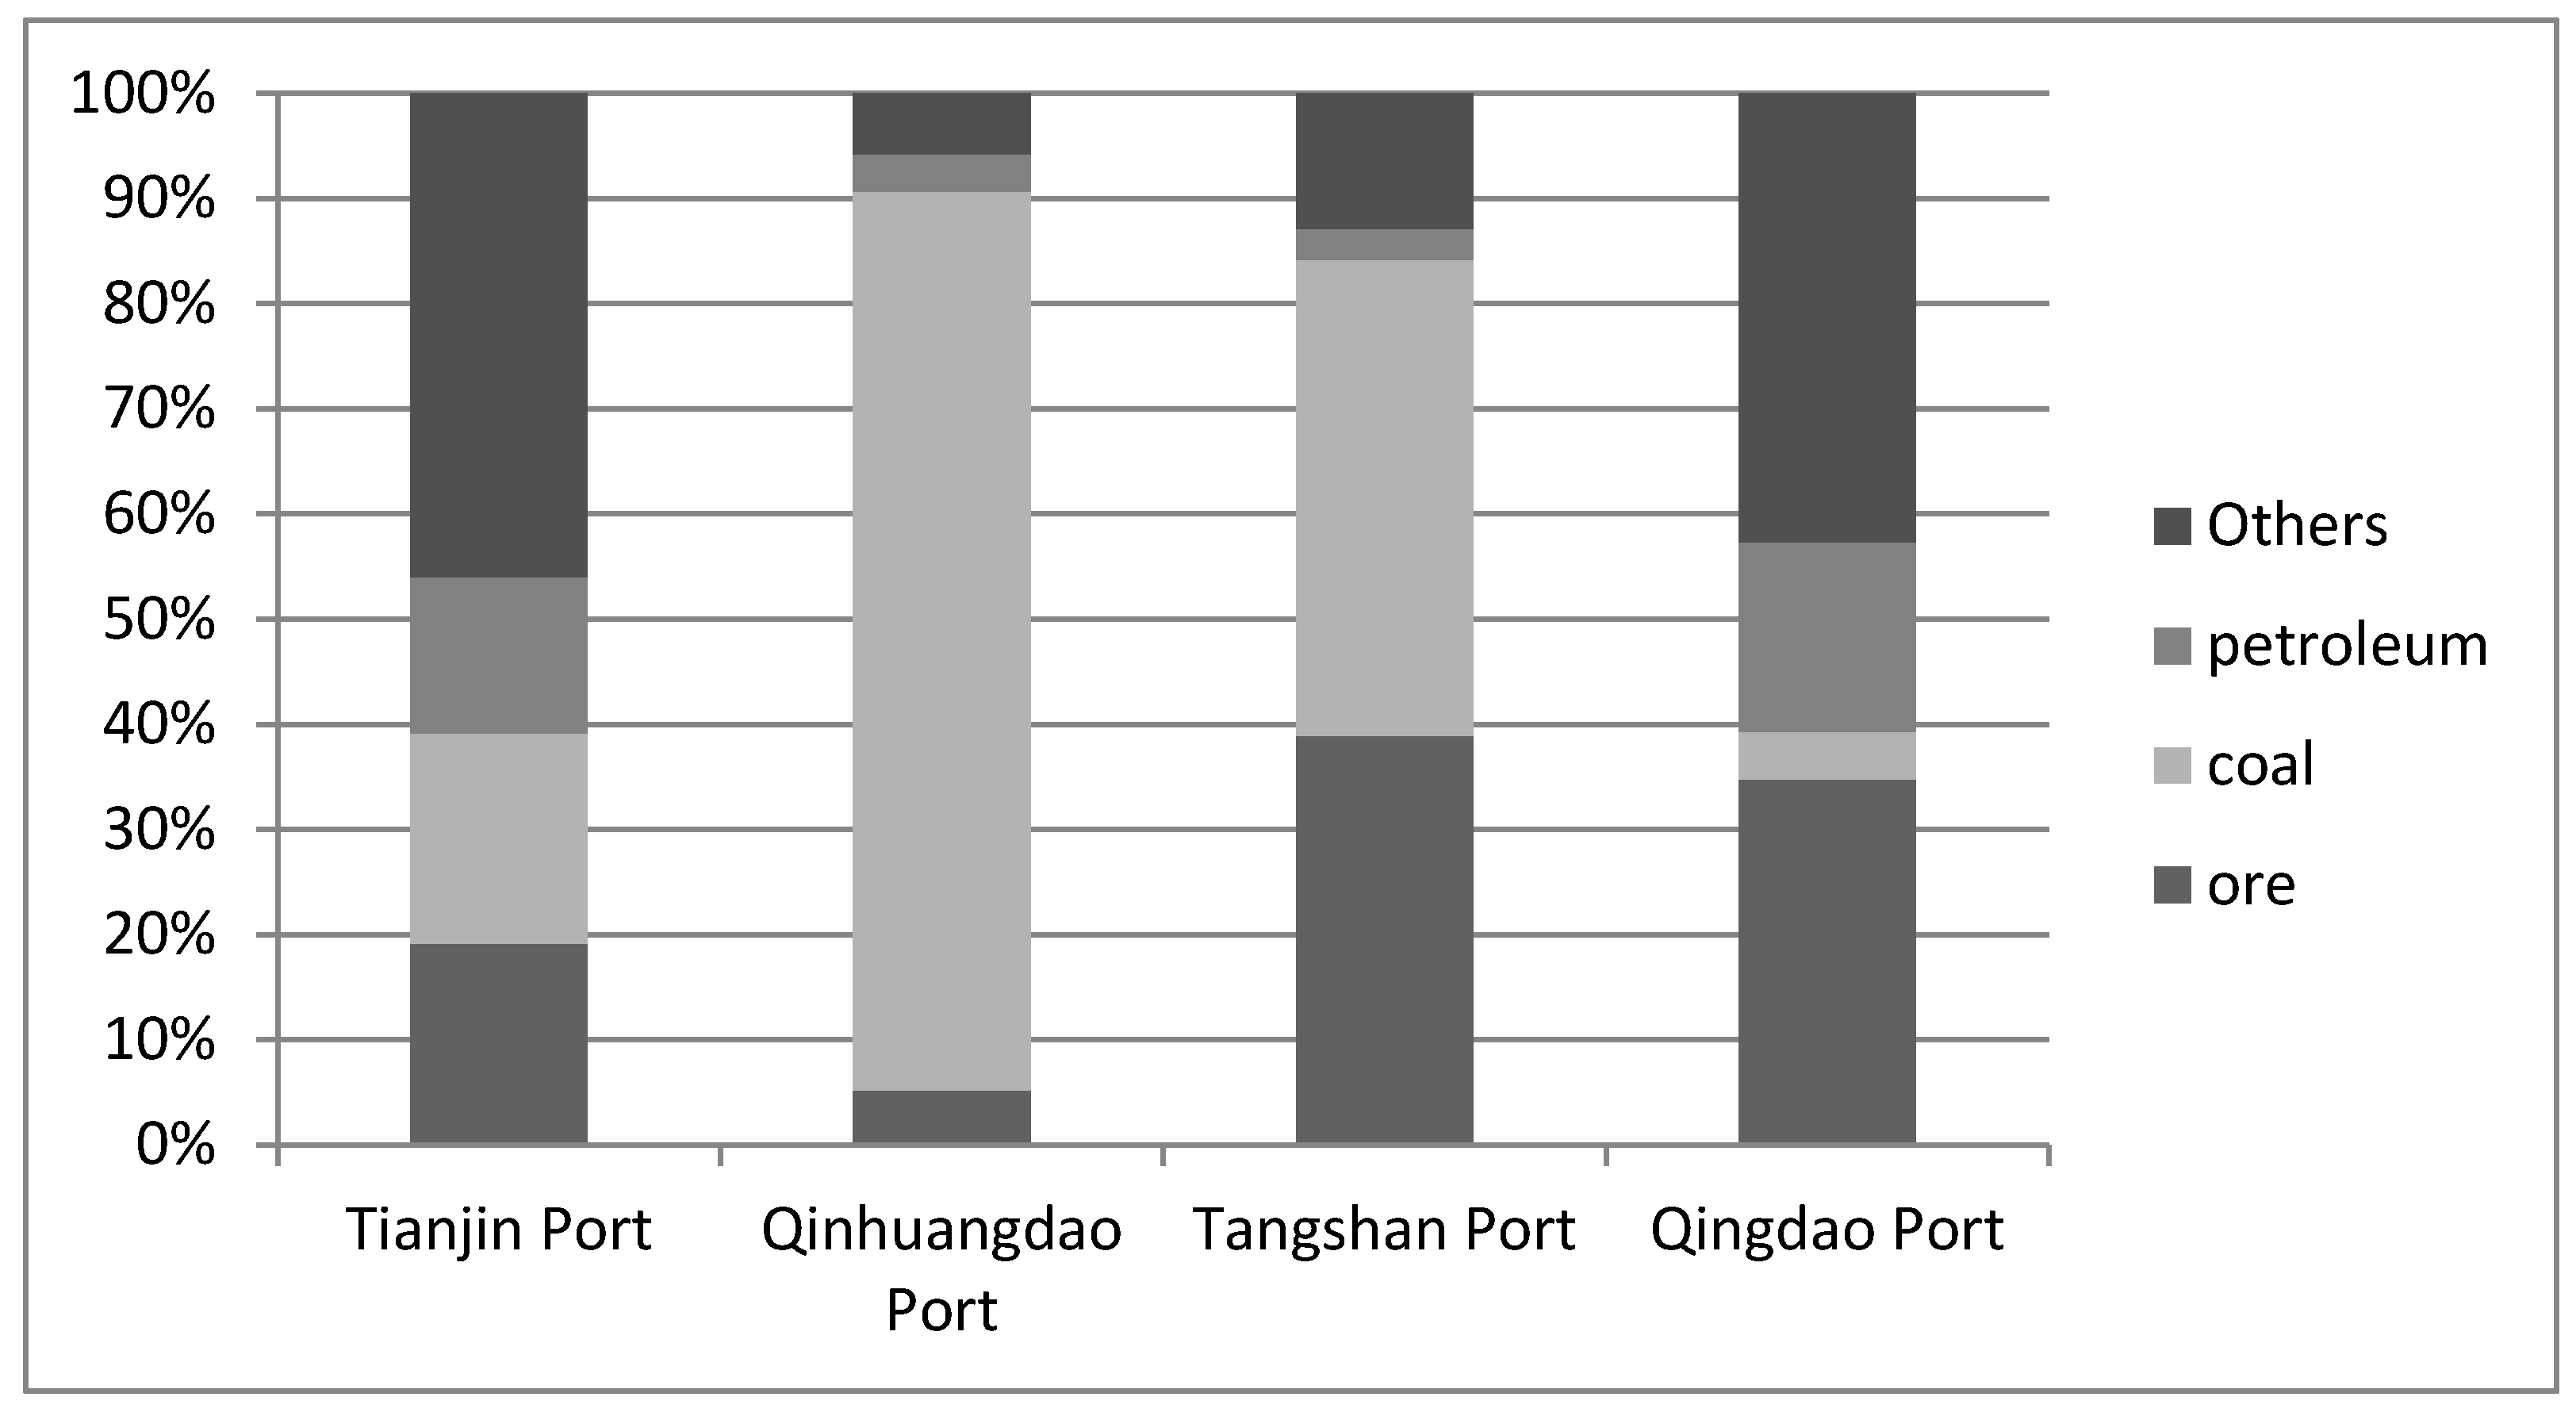
The Bohai gulf is the main outlet for China’s trade of coal. Most coal is exported through Qinghuangdao, Tangshan and Rizhao. While the above ports specialize in bulk shipping, the Dalian, Tianjin and Qingdao ports have a wide range of loading/ discharging business and transportation services, including container, tanker, and other commodities.
Figure 3 shows main service provided by selected ports in the region.
Figure 2.
Throughputs of Bohai area over China ( in ten thousand tons)
Figure 2.
Throughputs of Bohai area over China ( in ten thousand tons)
Source: China statistic year book and China shipping year book
Figure 3.
Product Composition ( in ten thousand tons)
Figure 3.
Product Composition ( in ten thousand tons)
Source: China Shipping Year Book
Ports are competitive by nature. Other than product diversification, one unique feature is that six out of the nine ports studied have gone public and have access to the stock exchange. The time frame of the initial public offerings (IPOs) of selected ports is listed in
Table 1. Tianjin (1996) and Jinzhou (1999) were the first to go public, followed by Yingkou (2001) and Rizhaoin (2006). Then Dalian and Tangshan adopted the trend in 2010.
Since 1980, China has gone through a decentralized approach in port governance. From operating and providing essential port infrastructure by the private sector to opening foreign participation and corporatization through joint ventures (JV) during the 1990s, public entity management has gone through significant institutional reforms. Private sector involvement, or even foreign participation, has the initiative to provide sufficient funds to finance capital-intensive port projects. In general, port authorities take more than 50% stake while private liner shipping companies and/or terminal operators commit to a share less than 50%. Similar to the JV formula, privatization aims to sharpen managerial incentives, improve capital utilization, and replace defective bureaucratic monitoring hierarchies (Liu, 1995). Given initial investment, funding structure, and operating status, the line between privatization and corporatization is unambiguous in China.
Table 1.
Time of IPO
| Port | year |
| Tianjin | 1996 |
| Dalian | 2010 |
| Tangshan | 2010 |
| Rizhao | 2006 |
| Yingkou | 2001 |
| Jinzhou | 1999 |
| Qinhuangdao | N/A |
| Yantai | N/A |
| Qingdao | N/A |
However, Wang et al. (2004) point out the trade-off of domestic interest and foreign capital, saying that “a number of port authorities have incorporated part of their activities or created entirely separate local companies to be involved in the port’s equity shareholding….all public corporations created out of reform necessities.” Examples are Shanghai Port Group Holdings Ltd and Yantian Port Holdings.
3. METHODOLOGY
3.1. Panel Fixed Effect Model
We consider the one-way error component panel regression model with the fixed effect, where
is assumed to be a fixed parameter to be estimated, and the random effect, where
can be assumed randomly.
where
is the unobservable time-invariant individual effect, and
is the random disturbance. The fixed effects model is an appropriate specification if the subject of study is a specific set of
ports or ports cross
states or
geographic regions, using dummy variables for (
-1) ports, (
-1) states or (
-1) geographic areas. Inference is conditional on the particular ports, states, or areas that are observed.
3.2 Statistics Frontier Model
We provide an abbreviated version of Wang, et al (forthcoming) of the frontier model. Production frontier models indicate the maximum production capacity given the combination of available resources. Inefficiency is measured by the extent that a firm deviates from the production possible frontier. Aigner et al. (1977) is among the pioneers proposing the stochastic frontier model (SFM) with the maximum likelihood estimators. Since then, the SFM has been applied extensively in industrial analysis. Battese and Coelli (1995) is one of the examples, using SFM in evaluating efficiency of selected container ports.
We assume that each firm produces less than its optimal output due to a degree of inefficiency. Specially,
, where
and
are the appropriate form of output and the combination of inputs, respectively, in the production function with
denoting ports and
denoting time.
is the level of technical efficiency. The production function is subject to random and uncontrolled factors by adding the stochastic components to the model. These effects are described by
.
where
,
. Taking the natural log on both sides of the above equation and substituting
, we obtain
where
v is the idiosyncratic component that captures statistical noise. It is assumed to be independently and identically
distributed.
indicates the unobservable efficiency shortfall that could be potentially avoided. Different specifications of the inefficiency
studied are half-normal, exponential, and truncated normal with the log-transformed variables to estimate the maximum likelihood function. The equations above present the frontier model in a general panel date format. A cross-sectional study can be done by simply dropping the subscript of
. In the time-varying decay model, we suppose
, where
is the last period in the
th panel and
is the decay parameter.
4. EMPIRICAL RESULTS
The purpose of this study is to analyze regional competition and privatization on port efficiency. Due to the potential competition among the coastal ports in the Bohai economic rim, nine ports are selected and defined as regional market, including Dalian, Jinzhou, Yingkou, Tangshan, Tianjin, Qinhuangdao, Yantai, Rizhao, and Qingdao.
Then Herfindahl-Hirschman index (HHI), measuring the concentration of the industry and the competition among the firms in the industry, is applied as one of the efficiency determinants. It is widely used in management and industry to measure the level of competition. The HHI ratio is invariable among different participants in the same market, but it will vary over time. A relatively high HHI implies a high monopoly with a low level of competition. We calculate the HHI index as the throughput of each port over the total throughputs in the markets.
where
in the market of
ports in the region.
Then the fixed-effect empirical model is
Table 2.
Definition of Variables
Table 2.
Definition of Variables
| Notation | Definition |
| Throughput | Total cargo throughput (in ten thousand tons) |
| HHI | Index of throughput of each port over the total throughputs in the defined markets |
| GDP | Province or Municipality nominal GDP |
| Berthlength | The length of quay in meters including productive and nonproductive equipments |
| Privatization | 1 if port goes public; 0, otherwise |
As we assume that the technical efficiency can be estimated by using the logarithmic of the throughput, the results show the effect of competition, economic growth, and privatization on production efficiency.
Table 3 is the inform description of statistics.
Table 3.
Description Statistics of Variables
Table 3.
Description Statistics of Variables
| Variable | Obs | Mean | Std. Dev. | Min | Max |
| Throughput (thr) | 144 | 10,077.89 | 9,409.506 | 217.8 | 41,325 |
| HHI | 144 | 0.16306 | 0.018859 | 0.128539 | 0.19365 |
| GDP | 144 | 10,215.98 | 8,486.09 | 920.11 | 39,169.92 |
| Berthlength (Berth) | 144 | 10,402.12 | 8,522.415 | 1,648 | 37,563 |
4.1. Panel Fixed-Effect Model
Table 4 presents the fixed-effect linear regression results. In Model 1, we observe that production efficiency is highly related to physical infrastructure, overall macroeconomic condition, and the decision of privatization. The coefficient of GDP is quite significant, meaning that the GDP of the province serves as an indicator in predicting overall demand of maritime services. The dummy variable,
, cannot be ignored as it well explains that the governance strategy of going public increases the technical efficiency of the ports. However, the HHI is not statistically significant in explaining the efficiency. Market concentration and potential market competition have less impact on production efficiency in the region. The same results are obtained in Model 2 when excluding HHI in the model. Most of the results seem to follow the intuition except the index of HHI.
At first glance, sign of the variable HHI is ambiguous. A high HHI ratio implies a high level of market concentration with a move towards monopoly. A monopolistic firm, in order to set up a high service price, has incentives to reduce the quantity provided and deviates from the production possibility frontier. Thus, a high HHI may lead to production inefficiency. On the other hand, if there are many ports in the region, over-competition and unfavorable pricing strategy may lead to inefficiency in the service provided. This happens in circumstances when the HHI index is low. The relatively small HHI ratio implies a highly competitive market. Therefore, the insignificant result for HHI may be due to intertwining of the two forces mentioned above.
Table 4.
Results of the Fixed Effect Model
Table 4.
Results of the Fixed Effect Model
| | Model 1 | Model 2 |
| ln Berth | 1.048 | 1.024 |
| (0.086)*** | (0.085)*** |
| ln GDP | 0.773 | 0.528 |
| (0.181)*** | (0.065)*** |
| ln HHI | 1.400 |
| (-0.965) |
| Privatization | 0.141 | 0.123 |
| (0.066)** | (0.066)* |
| Constant | -11.513 | -5.211 |
| (4.358)*** | (0.383)*** |
| Obs | 144 | 144 |
| N | 9 | 9 |
| σu | 0.484 | 0.409 |
| σe | 0.208 | 0.209 |
| R2 overall | 0.946 | 0.9449 |
| F-test | 43.88 | 48.52 |
4.2. The Stochastic Frontier Model
We re-examine the same empirical model, using the stochastic frontier model (SFM). The difference between the panel fixed-effect model and the SFM is that the latter provides a ranking of relative efficiency score, which can be estimated under the assumptions that production inefficiency can be either time-invariant or time-decay.
The time-varying decay frontier model is
The
in each model is positive, meaning the the efficiency for each port is increasing as time goes. But the value of
is so little, it is almost ignored.
Table 5 shows the results of the SFM.
Table 5.
Results of the Stochastic Frontier Model
Table 5.
Results of the Stochastic Frontier Model
| | Model 1 | Model 2 |
| | Time-invariant | Time-varying | Time-invariant | Time-varying |
| ln Berth | 1.078 | 0.499 | 1.062 | 0.626 |
| (0.079)*** | (0.109)*** | (0.076)*** | (0.103)*** |
| ln GDP | 0.593 | 0.284 | 0.498 | 0.500 |
| (0.132)*** | (0.121)** | (0.060)*** | (0.066)*** |
| ln HHI | 0.582 | -1.587 | | |
| (0.786)** | (0.758)** | | |
| Privatization | 0.134 | 0.105 | 0.124 | 0.142 |
| (0.065)** | (0.057)* | (0.065)* | (0.056)** |
| cons. | -7.229 | 6.913 | -4.614 | -0.476 |
| (3.542)** | (3.643)* | (0.412)*** | (1.017)* |
| Obs | 144 | 144 | 144 | 144 |
| N | 9 | 9 | 9 | 9 |
| η | --- | 0.052 | --- | 0.044 |
| σu2 | 0.229 | 0.225 | 0.188 | 0.179 |
| σv2 | 0.042 | 0.035 | 0.043 | 0.036 |
Most of the results are consistent with the panel fixed-effect model except for the HHI index. The model with HHI shows different signs with time-invariant and time-varying inefficiency. This is because the technical efficiency for each port is actually increasing while the HHI is decreasing, and regional competition of the Bohai Economic Rim area is getting stronger. With the assumption of time-varying error term, the ranking of production efficiency may vary over time. The relative efficiency scores of Models 1 and 2 are reported in
Table 6.
The rankings of the nine ports are slightly different between Models 1 and 2; Qinhuangdao is ranked the first in Model 1 when market concentration and competition is controlled, but Tianjin is the most efficient in production in Model 2, without considering the market share measured by the HHI index. As we know the Qinhuangdao port is mainly focused on exporting coal. Specialization in trading raw materials in bulk shipping may create a unique demand for certain manufacturing businesses. This somehow strengthens the competitiveness among other regional ports.
Table 6.
Report of the Efficiency Scores
Table 6.
Report of the Efficiency Scores
| | Time-varying model 1 | | Time-varying model 2 |
| | Mean | Min. | Max. | | Mean | Min. | Max. |
| Dalian | 0.57472 | 0.445358 | 0.691001 | | 0.462967 | 0.344606 | 0.576082 |
| Jinzhou | 0.229232 | 0.109585 | 0.364433 | | 0.239497 | 0.134696 | 0.35439 |
| Qingdao | 0.689772 | 0.583147 | 0.78144 | | 0.534823 | 0.421857 | 0.639612 |
| Qinhuangdao | 0.917934 | 0.884287 | 0.945009 | | 0.816863 | 0.758633 | 0.866432 |
| Rizhao | 0.369173 | 0.228832 | 0.509944 | | 0.312717 | 0.197603 | 0.432081 |
| Tangshan | 0.242989 | 0.120042 | 0.379907 | | 0.245565 | 0.139651 | 0.361074 |
| Tianjin | 0.893022 | 0.84984 | 0.927977 | | 0.893131 | 0.857378 | 0.923061 |
| Yantai | 0.257512 | 0.131409 | 0.395919 | | 0.209197 | 0.11073 | 0.320239 |
| Yingkou | 0.38107 | 0.240154 | 0.521306 | | 0.362647 | 0.244028 | 0.481908 |
5. CONCLUSIONS
Using the econometrics methods, we conclude that although there are many midsize ports in the Bohai Economic Rim, intra-port competition has relatively small effect on technical efficiency because product and service diversification. At the same time the process of going public, entering the stock market to have access to public capital, is proven to increase port efficiency. The results are supportive and encouraging for policy makers to move along with the decentralized port governance in China. Tianjin Port Co Ltd. was listed the first of the nine selected port companies; it was ranked relatively high in technical efficiency and profitability. The more important issue is that Tianjin may reach the capacity in maintaining predominance in production and sustainability in growth. Thus, regional competition may gradually increase its importance in port planning and development.


