1. Introduction
Prospective financial information (PFI) is “any financial information about the future” of a company (
AICPA, 2021) both of a narrative and quantitative nature. “Either financial forecasts (based on expected assumptions) or financial projections (based on hypothetical assumptions), including the summaries of significant assumptions and accounting policies, constitute the prospective financial statements (PFS)” (
AICPA, 2021, pp. 2236–2237). Corporate evaluations and analyses are developed by examining and stressing PFS; opinions on business continuity are determined in the same way. Maintaining the trust of capital lenders and shareholders for a company evidently depends on the credibility and uncertainty of its future plans (
Dainelli et al., 2024).
The focus of financial operators on prospective information has grown significantly in recent years, as a result of various factors. Regulators are becoming increasingly demanding on the issue of business continuity evaluation, which is based on business plans (
European Union, 2019, EU Insolvency Directive 2019/1023). The main international standard setters require companies to publish forward-looking information in their annual reports, mainly of a quantitative nature (
CFA Institute, 2014). Moreover, financial institutions have recently been called to use forward-looking perspectives in their credit worthiness systems (
EBA, 2020).
This emphasis on PFSs begs a significant question: how does one determine their reliability? “At the crux of any evaluation of PFS is management’s ability to execute a forecast and the consequent willingness to publish it in a transparent and fair manner. This is even more critical when the PFS includes significant improvements in revenue growth or margin expansion” (
KPMG, 2022).
Since prospective information is so important for market operators, it is proprietary and highly market-sensitive information. As a result, its communication to the market is strongly affected by the classic problems of information asymmetry and managers tend to overestimate the company’s future performance. In fact, PFI communication is shown to be affected by optimistic biases (
Rogers & Stocken, 2005). This, in turn, contributes to increase analysts’ forecast dispersion (
Barron et al., 1998,
2009;
J. Wang, 2020).
In this principal-agent “game”, the review, audit, and validation of this type of information are fundamental tools for reducing asymmetries and conflicts. In more advanced countries, the review of financial forecasts by external experts is becoming more and more important, and auditors are called upon to give an assessment of their quality. In addition, PFI is an area of increasing focus in the audit of financial statements, especially when fair value measurements are involved. Evidently, this topic is also fundamental for running the classic voluntary analyses. Financial analysts constantly address this issue, with the aim of releasing a “consensus” on future performance expectations of companies that they follow. More generally, this work is useful whenever a fundamental analysis of a company has to be carried out (for example, the classic Discount Cash Flow model). In connection with our core question, there is a problem of assessing the degree of reasonableness and uncertainty of the assumptions of financial forecasts.
Despite the fact that the examination of PFSs is so relevant for the market, this topic is scarcely investigated in the literature. On the other hand, standard setters and practitioners provide more in-depth and detailed guidance about assumption validation. In summary, there is no underlying conceptual or operational framework to guide the validation process of financial forecasts and help experts to express a judgment.
We contribute to this subject by building a framework to review PFSs issued by companies. It emerges from integrating the literature with the work of standard setters and best practices. This framework consists of the following: (a) a definition of the objectives of the review (reasonableness and uncertainty); (b) a reconstruction of the estimation process the expert has to conduct in the light of PFS review principles (materiality, visibility, competitive consistency, strategic consistency, internal consistency, historical consistency, and prospective consistency); (c) an operationalization process to guide the assumption validation. The framework leads us to formulate a first backward-looking judgment (stationary assessment) and a second prospective judgment (forward-looking assessment) concerning the degree of reasonableness and uncertainty of a plan presented by a company.
Our work could result in valuable operational benefits for the different market participants, helping banks, shareholders, analysts, and other stakeholders to improve and refine their assessments about the future performance and growth of a company. In addition, this work supports management and auditors in evaluating the likelihood that the plan will ensure business continuity for the company.
The remainder of this article is organized as follows:
Section 2 provides a literature review;
Section 3 highlights PFS review objectives and develops the structure of an estimation process to address them;
Section 4 defines the guiding principles for the review of PFSs;
Section 5 presents the framework and its operationalization; and
Section 6 concludes the paper.
2. Literature Review
Prospective financial information is any financial information that allows users to examine the future performance of a company (
Hussainey, 2004). The accounting-based representation of prospective financial information is defined in prospective financial statements. Consequently, the forecasts contained in a PFS represent the variables (such as expected revenues or investments) to be revised.
PFI is demonstrated to be value-relevant for market operators (
Hussainey, 2004) because it reduces important information asymmetries concerning future performance expectations (
Bujaki et al., 1999). This kind of information enables refinement of the investment decision-making process (
Kieso & Weygandt, 1995;
Hossain et al., 2005) and the accuracy of estimates (
Barron et al., 1999;
M. Wang & Hussainey, 2013;
Cai et al., 2015), which, in turn, stimulates firms’ growth opportunities (
Hossain et al., 2005).
The importance of PFI in corporate valuations has also been confirmed by empirical studies.
Kim and Shi (
2011) and
Cao et al. (
2017) showed a strong relation between the communication of PFI and the cost of capital. In fact, this communication reduces the estimation risk related to the future prospects of the company, which is evidently associated with the cost of capital (
Barry & Brown, 1985). The same effect is also observed for the cost of debt.
Demerjian et al. (
2020) and
Kitagawa and Shuto (
2021) found a strong use of quantitative PFI for creditworthiness purposes, highlighting the role of these data in setting the cost of debt.
As PFI is so important for the market, it is proprietary and highly market-sensitive information. Its communication helps markets but may also lead to threats for the company. First, it might reveal useful strategic information to competitors (
Beyer et al., 2010;
Kanoujiya et al., 2023) and, hence, weaken the competitive position of the publisher (
Hussainey, 2004). Second, if the company’s prospects are not good, PFI communication evidently increases the risk perceived by the market (
Kim & Shi, 2011;
Kitagawa & Shuto, 2021).
The more relevant information is to the market (as in the case of PFI), the more management is encouraged to adopt moral hazard actions, by neglecting negative information or distorting it (
Beyer et al., 2010;
Healy & Palepu, 2001).
Bujaki et al. (
1999) used a content analysis method to describe the nature of forward-looking information published in the MD&A for 46 Canadian companies and they found that “good news dominate bad news”. Good news disclosures account for 97.5%, while only 2.5% of forward-looking information is bad news. According to
Celik et al. (
2006), management forecasts tend to be overly optimistic. By examining the management earnings forecasts of more than 500 firms from the US,
Rogers and Stocken (
2005) found that management forecasts are, on average, affected by optimistic biases. Moreover, they also found that managers’ incentives to misrepresent information are more widespread when the ability of market operators to assess forecasts is poor. This evidence was confirmed by
Cho et al. (
2011), who analyzed a sample of Japanese firms and found that management tries to avoid loss forecasts, thus increasing the information asymmetry.
In conclusion, PFI communication presents a significant problem of reliability, which is related to its quantity, quality, and level of misrepresentation. The external use of prospective information is thus discouraged because of fears “that forecasts would fall far short in reliability” (
Berlinger & Robbins, 1986). Moreover, biases in financial forecasts may result in the inefficient valuation of companies (
Garcia-Ayuso, 2003). As a consequence, the review and audit of PFI are becoming increasingly important and required as an external source of assurance (
Mercer, 2004;
Schelluch & Gay, 2006;
Maroun, 2019). In these cases, the focus is on the PFS (
Schelluch & Gay, 2006), and auditors are called to express a judgment upon its reasonableness. International auditing standards and guidelines have been published within this scope in the past decade (
AICPA, 2021;
IAASB, 2013), which define certain criteria of examination.
The literature has examined several factors that must be taken into account when assessing the reasonableness of a PFS.
Houston et al. (
2010),
Cassar and Gibson (
2008) highlight the importance of the visibility of prospective data as a starting point for the review process. Visibility refers to the ability to reconstruct the drivers underlying the forecasts, which, in turn, mainly depends on the availability of the relative data. This availability depends on the following: (i) the possibility of accessing the database (external source); (ii) the quantity and the quality of information which can be obtained directly from the business plan and the other management materials (internal source).
Naylor (
1983) conducted one of the earliest studies addressing the reasonableness of forecasts. According to him, “the driving force underlying any strategic plan is a forecast of the company’s external environment”. Therefore, he suggests analyzing financial forecasts by taking into account the evolution of the external environment of the company. This might include a forecast of the national economy, assumptions about how the firm’s competitors are likely to behave, and predictions about changes in the firm’s political and technological environment. The importance of the analysis of the external environment for the development of reasonable forecasts is also emphasized by other studies. See, for example,
Harvey and Lusch (
1995),
Sykes and Dunham (
1995), and
Dewar (
2002), which state that the analysis of macroeconomic and competitive dynamics guides the reasonableness of financial forecasts. This kind of analysis is particularly important for companies operating in emerging markets, which are more exposed to macroeconomic trends. Finally,
Joseph (
2013) also highlights the importance of external analysis and suggests using Porter’s five competitive forces model to analyze the dynamics of the industry.
In addition to the external environment, other studies stress the importance of analyzing the internal context of the company (
Harvey & Lusch, 1995;
Sykes & Dunham, 1995;
Michaluk, 2007;
Steyn, 2014;
Kunc et al., 2021). First, this analysis concerns the alignment of a company’s strategy with the forecasts.
Michaluk (
2007) argues that forecasts must be based on the objectives set by the company and the strategy implemented to achieve them. This point is also emphasized by
Celik et al. (
2006), who argue that investors and analysts need to analyze the strategy planned by management in order to validate financial forecasts. For other studies, the analysis of the internal context is specifically concerned with the technological level of the entity (
Harvey & Lusch, 1995) or the skills and experience of the management (
Harvey & Lusch, 1995;
Sahlman, 1997).
Joseph (
2013) finally proposes using a BCG matrix or SWOT analysis to examine these topics.
Over time, however, approaches have been developed which combine different factors. These studies are based on the interdependence between internal and external factors (
Sahlman, 1997). Their interrelationship defines a different weight by which each factor affects the forecast. He proposes an approach which considers three factors that must be integrated to develop the forecast: (a) people, including management experience and education; (b) opportunities, which mainly refer to the growth rate of the market in which the company operates; (c) context, which refers to the macroeconomic environment. In the same way,
Joseph (
2013) argues that the analysis must be executed on an “aggregation basis”. Finally,
Wiklund et al. (
2009) and
Rodríguez-Gutiérrez et al. (
2015) present empirical evidence of the influence of multiple factors on company performance, including strategic orientation, management skills and external environment.
Besides the assumption validation, there is also a problem of uncertainty of the forecasts. According to
Dewar (
2002) and
Michaluk (
2007), it is important to conduct a scenario analysis. Starting from a baseline forecast, the aim is to develop alternative scenarios based on possible future market conditions. This kind of analysis is important to assess the risk related to the forecasts.
The classic models for analyzing and validating the future performance of a company derive from stationary approaches (
Mensah, 1984). These models are predictive, under the strong assumption that company performance is stationary over time (
Eisenbeis, 1977). In fact, they use historical data to build future trends of the company’s results. In this way, backward-looking forecasts are generated, i.e., they project stationary historical performance into the future. For example, time series analyses have been developed following this approach.
Makridakis and Hibon (
2000), in their analysis of the M3-Competition, found that these methods are widely used and show good forecasting performance. In their qualitative study,
Winklhofer and Diamantopoulos (
1996) interviewed corporate managers and found that past results are considered a valuable source for forecasting.
Nevertheless, backward-looking models evidently exhibit significant limitations in “highly dynamic environments” (
Gruber, 2007).
Kieso and Weygandt (
1995) argue that the modern environment is too dynamic to rely on historical information alone. Its continuous changes require an analysis of future development variables. As a result, backward-looking assessments generally cause market inefficiencies, such as the pro-cyclicality of the economic system and adverse selection (
Allen & Saunders, 2003;
Leroy & Lucotte, 2019;
Resende et al., 2024). Throughout an economic expansion phase, a backward-looking valuation system underestimates the risks associated with future threats of a company and its market. On the other hand, during a recession phase, the same approach overestimates risk, thereby penalizing companies with promising prospects.
The forward-looking approach arises from the integration of backward-looking analysis with prospective information and data. In this way,
Wu et al. (
1991) and
Makridakis et al. (
2009) argue that past performance analysis allows the identification of discontinuities between historical and future trends and brings out drivers that must be integrated into the forecast. These drivers relate to the future evolution of the external context and the company’s business (
PWC, 2007;
Naylor, 1983;
Joseph, 2013). Analysts have followed a similar approach.
O’Brien (
1988) argued that analysts start from historical time series analysis and then integrate the results with a broader information set. In this way,
Brown et al. (
2015) and
Bradshaw et al. (
2012) stated that analysts integrate their forecasts with information such as the industry dynamics and the evolution of the company’s business.
Brown et al. (
1987) and
Loungani (
2001) empirically showed that these methods provide more accurate forecasts than those based only on historical time-series.
Green et al. (
2014) found that the access to qualitative management information on future strategies constitutes an important source of the analysts’ informational advantage, which leads to more accurate forecasts.
In conclusion, the literature shows the value relevance of PFI for the market, as well as significant problems of information asymmetry due to optimistic misrepresentations and information obscuration. As a result, market operators need to verify the reasonableness of PFI (specifically the PFS), preferably by external auditors. Some studies propose criteria and methods to conduct analysis of PFSs. Finally, the literature shows the limitations of backward-looking methods, and it emerges that, for developing a forward-looking system, two steps are required: (a) reconstructing future result trajectories based on past trends (business-as-usual forecast); (b) considering all factors related to the future evolution of the external environment and the corporate strategy, which may lead to deviations from past patterns.
However, for the scope of a PFS review, the literature presents three significant limitations:
It is generic and incomplete. The literature is dated and only addresses PFS analysis criteria in general terms, without identifying techniques for their operationalization. On the other hand, standard setters and practitioners provide review principles that offer a more comprehensive and detailed view for PFS validation. Nevertheless, even these principles are not organized nor operationalized in a process; this results in a fragmented approach to PFS review.
It lacks a conceptual and operational process to reconstruct the interrelation between business drivers (internal and external), data trends, and future results.
It lacks a model to operationalize a forward-looking approach.
3. Objectives and Estimation Process for PFS
We conducted a literature review with regard to PFS analysis and then integrated the literature, through guidelines issued by standard setters and professional bodies, as well as best practices from consulting firms. This work led to the results of our research. First, we shed light on the objectives of PFS review. Second, we defined a structured estimation process, in order to reconstruct a reasonable forecast with a degree of uncertainty. Third, we operationalized the estimation process, in the light of PFS principles, to build a comprehensive framework for PFS review.
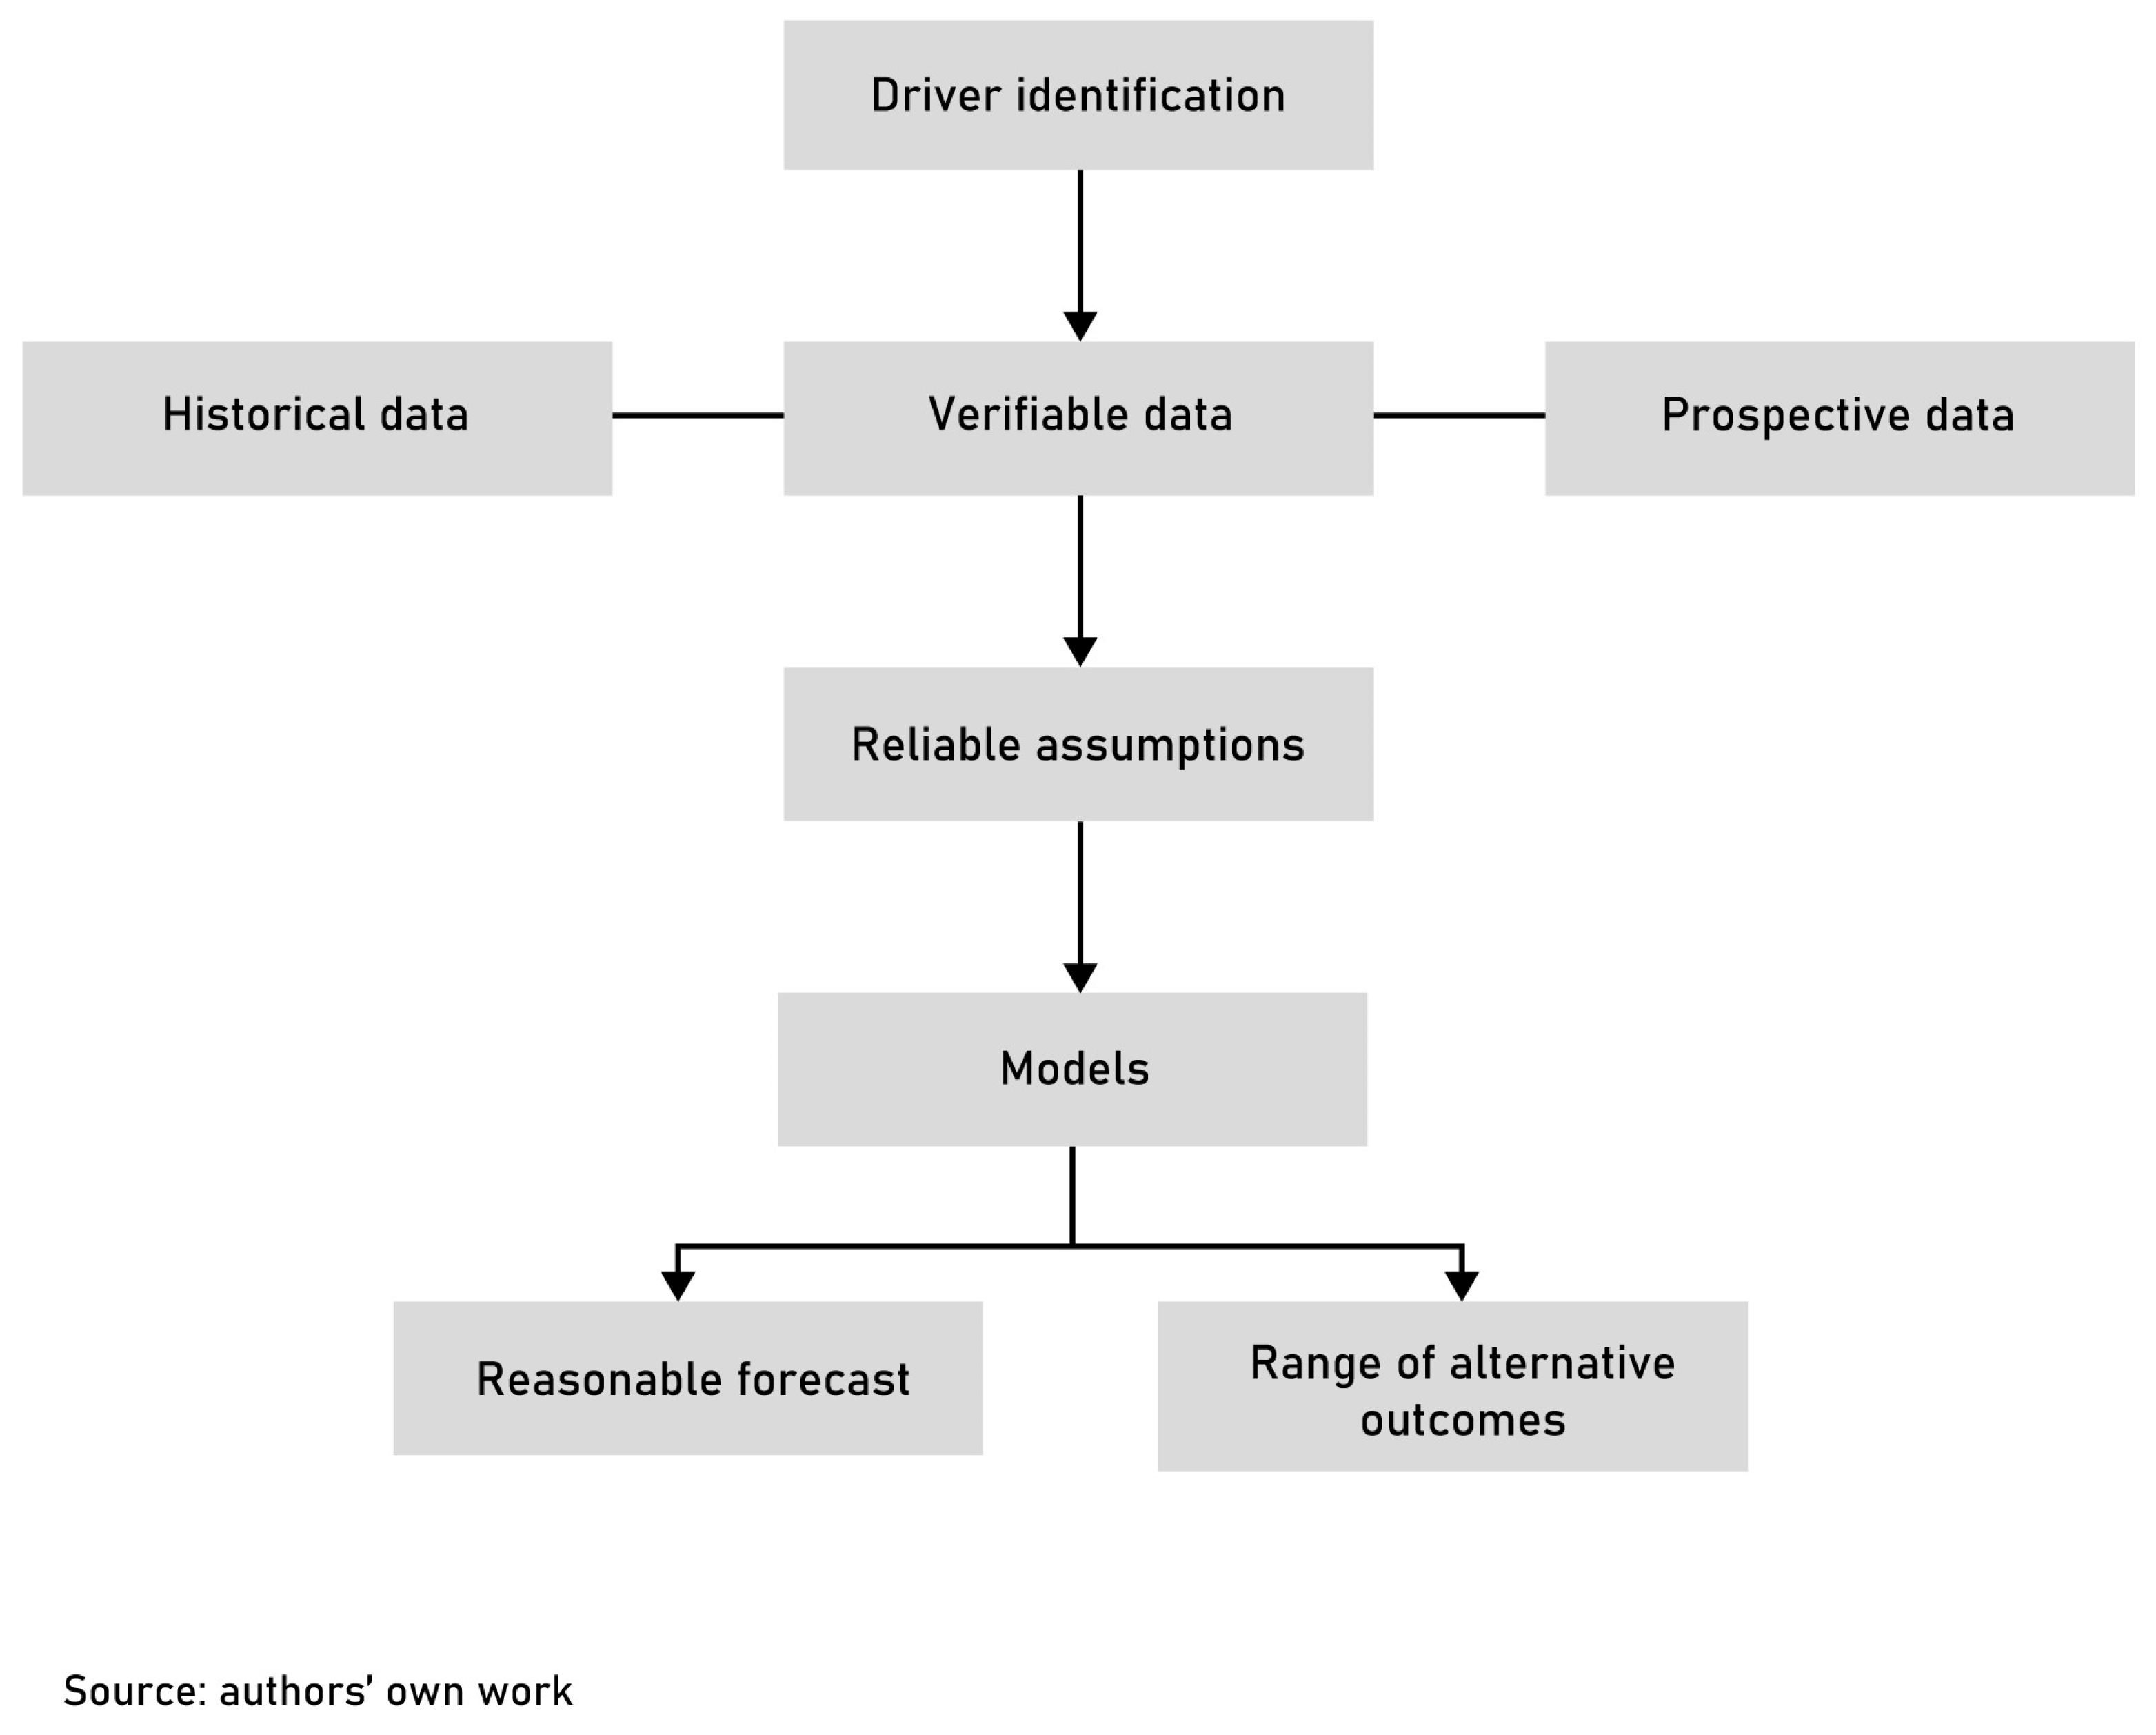
The objectives of this review consist of formulating two judgments about the following, as we will examine in depth later: (i) reasonableness; (ii) the uncertainty of forecasts. An expert can achieve these objectives by rebuilding the estimation process underlying the forecasts (
Figure 1). The estimation process is structured into four steps: (i) it determines the significant drivers (for example, market demand) upon which an entity’s future results (revenues) are expected to depend; (ii) it collects verifiable historical and prospective data for each driver (historical and expected market demand growth rate); (iii) it defines reliable forecast assumptions, i.e., the rationale by which the drivers impact the future results (evolution of company’s market share); (iv) it employs appropriate models to operationalize the assumptions and uses the drivers’ data to elaborate future results and their degree of uncertainty.
A forecast developed following this structured process is the representation of “the best of the responsible party’s knowledge and belief and it is based on responsible party’s assumptions reflecting conditions it expects to exist” (
AICPA, 2021). As a result, that forecast represents the future estimate with the greatest probability of occurrence (
IVSC, 2024). It is defined as a “reasonable” forecast. The less structured the process is (for example, because it lacks certain important data), the less reasonable the forecast is.
Each forecast, regardless of its reasonableness, is always uncertain in nature. This determines the degree of probability that alternative scenarios may occur (
AICPA, 2021;
ICAEW, 2003). The second objective of PFS review concerns the assessment of the “degree of uncertainty” of a reasonable forecast. This uncertainty derives from two factors. First, the estimation process is based on drivers and employs prospective data which are both inherently uncertain. Second, the models used for the prediction inevitably show errors and volatility. As a consequence, the structured estimation process has to synthesize the uncertainty attached to drivers, data, and models, into a range of alternative outcomes, which is generally represented by the standard deviation of the reasonable forecast. The alternative outcomes follow a normal distribution, where the mean represents the reasonable forecast (the expected value) and the standard deviation reflects its dispersion.
In conclusion, in order to express judgment about the reasonableness and the uncertainty of a forecast, the experts rebuild the structured process (drivers, data, assumptions, and models) underlying that forecast, following the principles stated for PFS review (discussed below).
This leads to two outputs:
- (a)
A forecast is deemed “reasonable”, as it is developed following a structured estimation process and the relative guiding principles concerning PFS review. The reasonable forecast is then compared with the forecast issued by the management, in order to measure potential bias. As a consequence, the company’s forecast is judged to be conservative (if underestimated), reasonable (if aligned with that of the expert), or optimistic (if overestimated).
- (b)
There is a range of alternative outcomes, reflecting the uncertainty of the forecast; the wider the range is, the more uncertain the forecast is.
4. PFS Review Principles
PFS review is based on seven principles, which have emerged in the literature and from standard setters and practitioners.
4.1. Materiality
A PFS variable is considered material if it is able to influence stakeholders’ decisions about the company (
Table 1 reports standard setters’ guidance and best practices). This depends on the magnitude of the impact of the variable on the company’s net income and cash flows. As a consequence, the review process only focuses on material variables, which can be identified by the means of sensitivity analysis. All the selected material variables are defined as reviewed variables and are analyzed in the review process.
4.2. Visibility
Visibility refers to the capability to reconstruct the drivers underlying the forecasts (
Houston et al., 2010;
Cassar & Gibson, 2008) (
Table 2 reports standard setters’ guidance and best practices). The drivers are highlighted in the business plan and/or reconstructed through an analysis of the business model of the company. A driver is actually visible when its data are available for the process, in the form of historical and/or prospective data. Moreover, the assessment of future uncertainty requires prospective data to include an estimate related to the dispersion of the alternative outcomes.
The source of these data is either internal or external to the company. External data should be preferred, where possible, because of their greater reliability.
Whenever qualitative data are available, they must be quantified. This can be performed by converting the qualitative data into a quantitative scale. If this is not possible, in order to use the driver in the process, the experts have to measure their impact on the reviewed variables.
4.3. Competitive Consistency
Competitive consistency refers to the alignment of the forecast with the drivers representing the evolution of the external environment (
Naylor, 1983;
Harvey & Lusch, 1995;
Sykes & Dunham, 1995) (
Table 3 reports standard setters’ guidance and best practices). The experts use the competitive drivers to reconstruct the dynamics of the external environment and their relationship with the company’s results, identifying signals of convergence or divergence between them. First, this reconstruction requires analysis of the evolution of the macroeconomic environment (
Sahlman, 1997;
Hormozi et al., 2002), which can be measured through indicators such as the GDP growth rate (
Joseph, 2013). Second, the industry must be considered, by analyzing its competitive forces (
Naylor, 1983;
Joseph, 2013). For example, if an expert assumes the industry growth to be 4%, a forecast of revenues is competitively consistent if it is +4%. However, if the PFS forecast is +10%, this misalignment may indicate potential strategic strengths, which will need to be analyzed later.
4.4. Strategic Consistency
Strategic consistency refers to the alignment of the forecast with the drivers representing the evolution of the strategic position of the company (
Table 4 reports standard setters’ guidance and best practices). The experts use the strategic drivers to map the dynamics of the company’s strategic behavior and its relationship with company results. This requires an analysis of the company’s historical and planned strategy, aimed at examining its competitive positioning and strengths (
Michaluk, 2007;
Joseph, 2013). Professional bodies highlight the importance of strategic risk management and particular importance is devoted to the ESG issues (
Friede et al., 2015;
Giese et al., 2019;
Sassen et al., 2016). These analyses can also be integrated by considering the organizational and technological levels of the firm (
Harvey & Lusch, 1995), as well as the management’s skills, experience (
Sahlman, 1997), and other intellectual capital variables (
Abhayawansa et al., 2018). Referring to the example presented for competitive consistency, it is assumed that the company has launched an innovative product. This could generate a competitive advantage and, thus, justify a larger growth in revenue than planned (+10%, or even more).
4.5. Internal Consistency
Internal consistency refers to the alignment of the forecast with the combined evolution of competitive and strategic drivers (
Table 5 reports standard setters’ guidance and best practices). It represents the link between competitive and strategic consistency, as their drivers are interdependent (
Sahlman, 1997;
Joseph, 2013). In fact, competitive and strategic factors influence each other and their interrelation affects a company’s results. The experts study the interrelationships between the competitive and strategic drivers, opportunely weigh their influence on the results, and then generate a forecast that is internally consistent. Coming back to the example of competitive and strategic consistency, the launch of an innovative product, opportunely integrated with relative industrial growth, can generate a final result of +7%.
4.6. Historical Consistency
Historical consistency refers to the alignment of the forecast with the historical drivers and the company’s past results (
Table 6 reports standard setters’ guidance and best practices). The experts analyze the interaction between the company’s past results, its strategy, and the evolution of the competitive environment, to reconstruct an historical trend of the PFS variables. The historical trend is projected in a stationary way into the future. This future trend is then compared with the company’s forecast to define its degree of alignment. This comparison may reveal continuity signals (historical consistency) or discontinuity signals (
Wu et al., 1991). The discontinuity signals must be deeply examined through a prospective consistency analysis.
4.7. Prospective Consistency
Prospective consistency refers to the alignment of the forecast with both prospective and historical drivers (
Table 7 reports standard setters’ guidance and best practices). The experts analyze the future development of the company’s business to draw out future drivers (
Joseph, 2013), which can justify the potential discontinuity signals (
Wu et al., 1991). The future drivers are integrated into the analysis of the interactions between historical drivers and company’s results to reconstruct new future trends of the reviewed variable.
5. The Review Framework
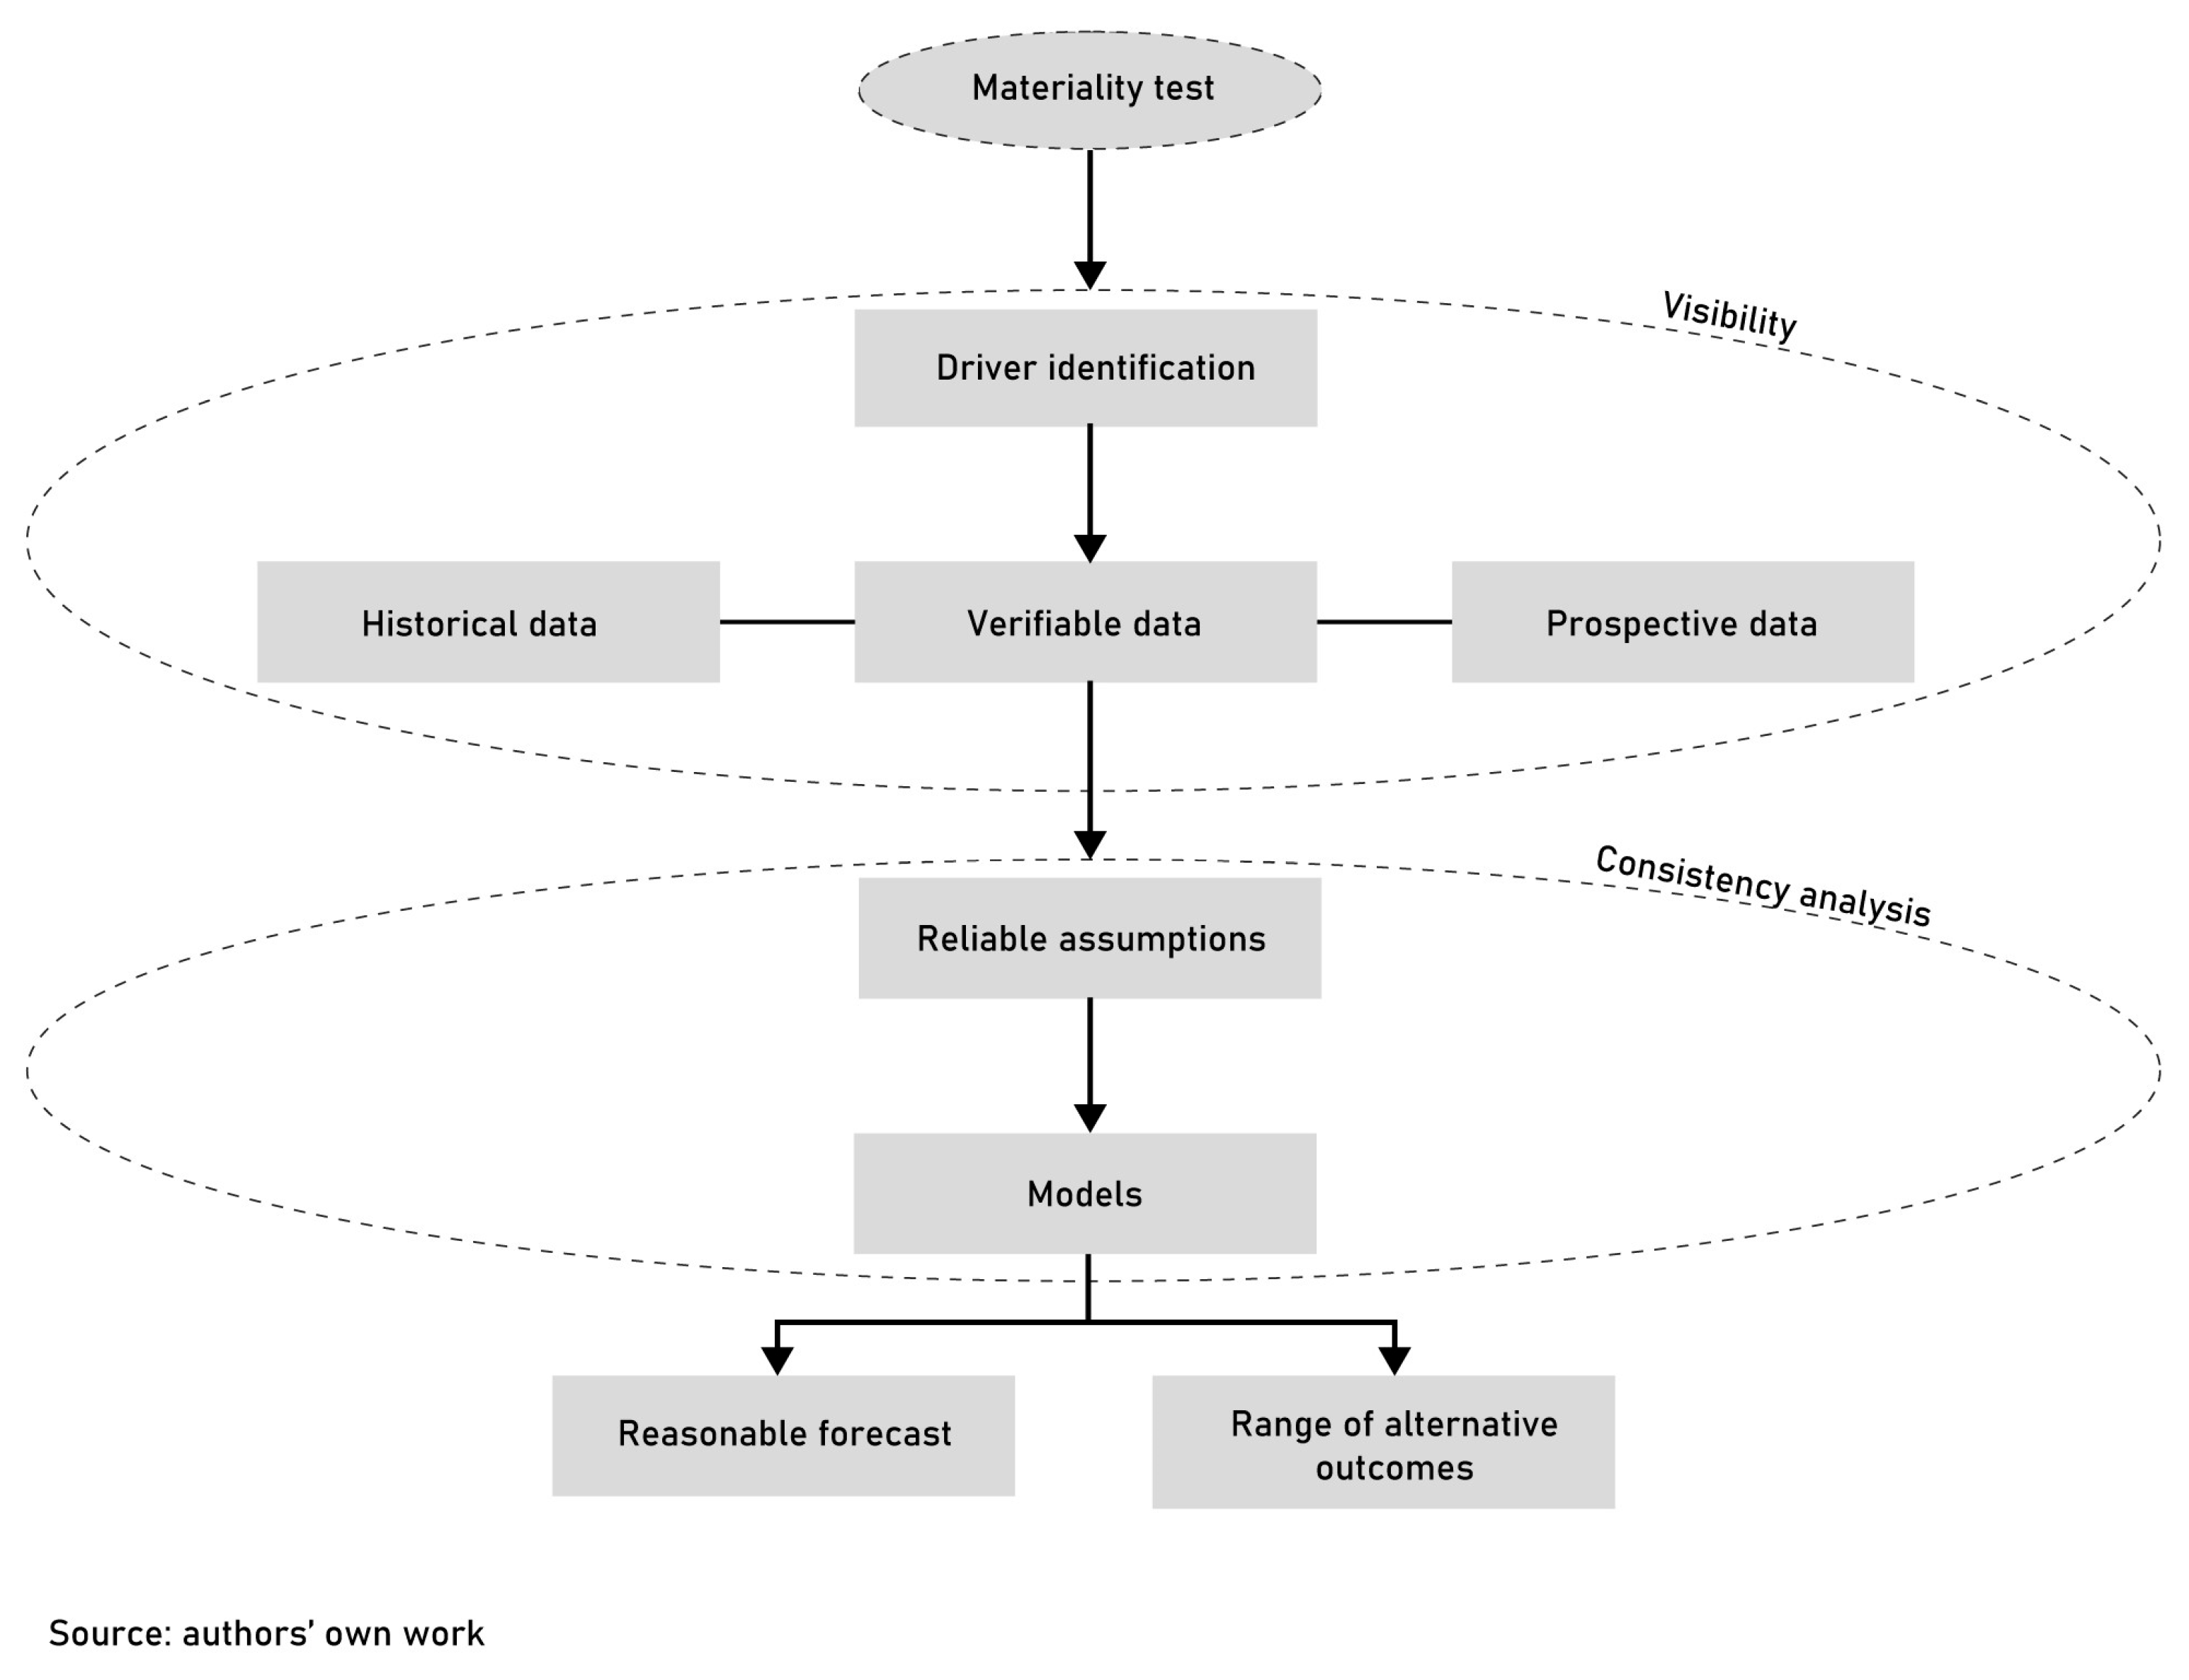
The estimation process (
Figure 1) is operationalized in the light of PFS principles, to build the architecture of our framework (
Figure 2). It starts with the materiality testing of the PFS variables and proceeds with the driver identification and collection of historical and prospective verifiable data. This consists of a visibility analysis. The development of assumptions (the rationale) and operationalization, using appropriate models, are performed following the principles of consistency analysis between the drivers and the company’s results.
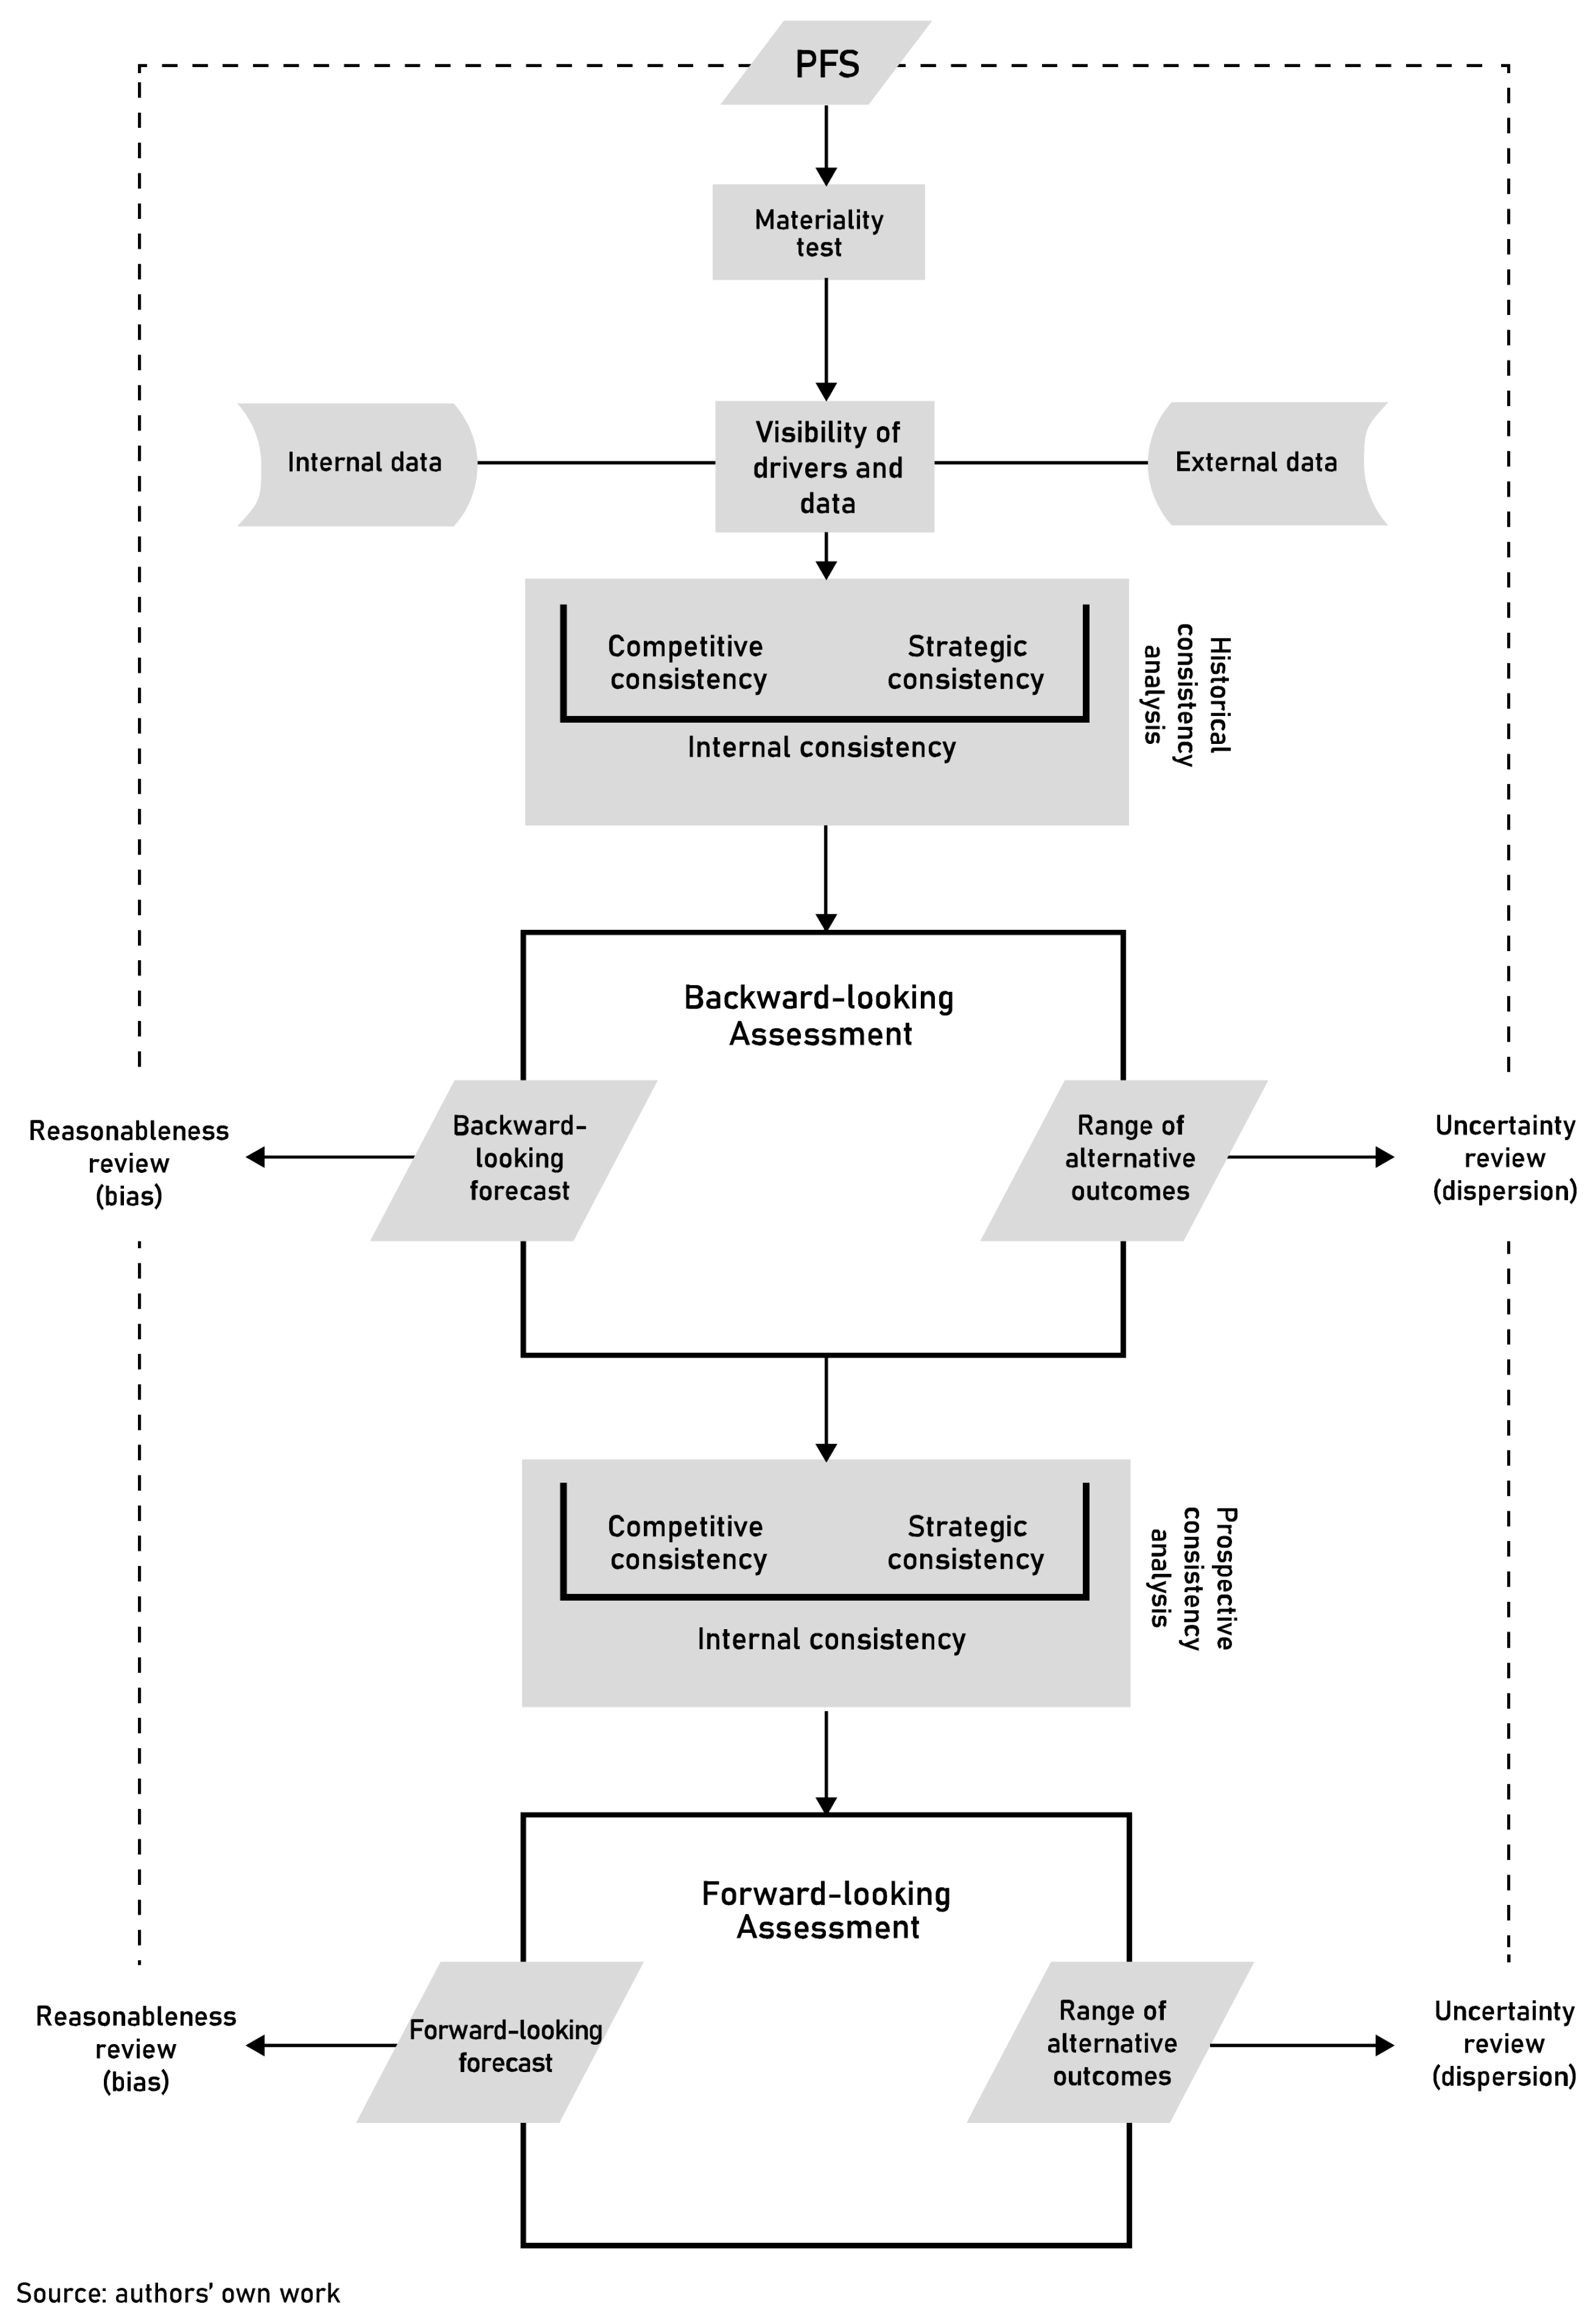
The analytic process developed from this architecture defines a comprehensive framework for PFS review (
Figure 3). It highlights the PFS review process to be followed, in order to express judgment about the reasonableness and uncertainty of a company’s forecasts. This process allows users to run a first stationary assessment, which generates a backward-looking judgment. Subsequently, this work develops a second forward-looking assessment that leads to a prospective judgment, which integrates the stationary assessment by considering prospective factors.
The first step of the process concerns materiality analysis. It aims to identify the PFS material variables on which the estimation process is conducted. For this purpose, the experts perform a sensitivity analysis and select only the variables whose change has a significant impact on the performance of the analyzed company. The sensitivity analysis can be implemented through a differentiation-based method, which is based on the elasticity of a company’s performance, with respect to the examined variables (
Apostolakis & Borgonovo, 2001;
Borgonovo & Plischke, 2016). All of the selected material variables are called “reviewed variables”.
A visibility analysis is conducted on each of the reviewed variables. The first step of the visibility analysis is based on the reconstruction of the main drivers capable of “moving” the reviewed variable. Second, for each driver, the experts collect historical time series and prospective data, both derived from internal and external sources of information. Moreover, the assessment of forecast uncertainty requires the prospective data to include an estimate related to the dispersion of alternative outcomes. Whenever qualitative data are available, they must be quantified, e.g., by using the Likert scale. When Likert scale conversion is not possible, we need to measure the impact of qualitative data on the reviewed variables. An example of this would be the determination of the impact on future sales of an important qualitative driver, such as the launch of a new product.
Once the experts have reconstructed the drivers (with their data) underlying each reviewed variable, they perform historical consistency analysis, which takes place through two dimensions: competitive consistency and strategic consistency.
Starting with competitive consistency, the determination of a forecast aligned with the competitive environment is complex. The drivers influencing the forecast may exhibit divergent trends and affect the reviewed variable with different weights (i.e., inflation rate +1%; GDP growth rate −3%; industry growth rate +6%). Statistical models for time series analysis are frequently used to estimate the influence and weight of each driver (driver coefficient) on the reviewed variable. As a consequence, the future trend of a variable can be predicted by the means of the coefficients of the competitive drivers. This produces forecasts which are historically consistent with the company’s competitive environment (competitive–historical consistency).
In general, this reconstruction method of future trends elaborates projections based on the historical evolution of certain environments, because it is developed by using the historical links between a variable and its drivers. As a result, it produces business-as-usual forecasts. For this reason, we speak of backward-looking forecasts because they are based on a stationary theoretical view of historical patterns.
The historical consistency analysis proceeds with the examination of the strategic dimension. The same problem of reconstructing the interaction between reviewed variables and their drivers (seen in competitive consistency) also emerges in this case and is developed with the same method. By using coefficients of the strategic drivers, we produce forecasts which are historically consistent with the company’s strategic position (strategic-historical consistency).
Finally, there is also the issue of the interrelationship between strategic and competitive drivers to be solved. This poses an internal consistency problem. We need to re-examine the interactions between strategic and competitive drivers with the reviewed variable, determine new weights for each driver (that consider the combined effects of all the factors influencing the variable), and provide new (competitive–strategic) backward-looking forecasts. This method provides reasonable forecasts which are backward-looking oriented.
In conclusion, the experts can express their first judgment about the reasonableness and uncertainty of each company’s forecast. The reasonable forecast is compared to the PFS forecast, to determine the potential bias. With regard to the uncertainty, since the historical consistency analysis does not use prospective data, the uncertainty of the forecast only depends on the predictive capabilities of the models employed in the process, from which users draw the standard deviation of the forecast. This is a range of alternative outcomes from the reasonable forecast, which represents the mean of the distribution of the future scenarios.
In general, this backward-looking review technique constitutes a stationary assessment method because it assumes that the historical trend of the competitive and strategic environment will not change in the future, as well as the links between the drivers and the reviewed variables. However, this approach exhibits significant limitations in dynamic environments, so it is necessary to adopt a forward-looking approach.
The forward-looking assessment integrates the backward-looking procedure by implementing the historical trends and links between the reviewed variable and its (competitive and strategic) drivers with future factors (prospective consistency analysis). For example, if the company launches an innovative product, it shifts the determinants of its future performance to its strategic initiatives. Evidently, the strategic and competitive drivers, and their weights, need to be re-balanced.
The steps to build a forward-looking system are the following: (i) integrate future drivers with historical drivers and re-examine their new systemic interactions with the reviewed variable (competitive and strategic consistency); (ii) recalibrate the weights of all the drivers (internal consistency); (iii) perform a new forward-looking oriented forecast.
Finally, the experts express their second kind of judgment about reasonableness and uncertainty of company’s forecasts. The reasonable forecast is compared to the PFS forecast, to determine the potential bias. With regard to the uncertainty, the work presents greater complexity. Due to their uncertainty, future data present alternative scenarios with different degrees of occurrence. Therefore, the uncertainty dimension of the forecast has to combine the error of the models with the degree of future data dispersion. This results in a range (standard deviation) of the alternative outcomes from the reasonable forecast (mean) and responds to the second estimation objective (uncertainty).
6. Conclusions
When someone analyzes a business plan, they ask two fundamental questions: “Is it credible?” and “How uncertain is it?”
For example, Nvidia is known for presenting conservative business plans (
Griffin et al., 2024). Nevertheless, in many other cases, the PFI of a company tends to be optimistic due to moral hazard schemes in “games” with significant information asymmetries. For example, Enron estimated a significant growth in revenues and profits just before its bankruptcy (
Forbes, 2002;
The Wall Street Journal, 1999).
The review of financial forecasts is becoming more and more important for banks, analysts, and other stakeholders. When this review is conducted by external auditors, the public interest in reliable communication is even protected by regulations. In this way, the Insolvency Directive (EU 2019/1023) requires auditors to assess business continuity by examining the PFS. In this context, international auditing standards have been published within the scope of PFS review (
AICPA, 2021;
IAASB, 2013). A second aspect of this increasing interest in the review of PFSs derives from the growing market and competitive turbulence, which gives the historical performance of a company a bad predictor of its future possible trends. All these challenges require PFS review work to embrace a more forward-looking orientation.
Despite the growing importance of this topic, it is scarcely investigated in the literature, which appears to be dated and generic and only proposes backward-looking models. We have highlighted the review objectives (reasonableness and uncertainty) and a method to allow experts to express a judgment concerning their fulfillment. Specifically, we have operationalized the forecast’s estimation process in the light of PFS review principles. This allows users to elaborate reasonable forecasts and estimate their related degree of uncertainty under two different approaches. A first stationary assessment generates a backward-looking judgment, while a second forward-looking assessment leads to a prospective judgment.
From a theoretical perspective, our work contributes to the studies on the communication of highly sensitive proprietary data, as in the case of PFSs. Specifically, our framework provides a systematic workflow which is able to appreciate the degree of reasonableness and uncertainty of this specific form of communication, promising to reduce moral hazards and adverse selection phenomena. These two outputs of our framework are valuable data for the development of forward-looking scoring systems (
Dainelli et al., 2024).
As a future research stream, our framework could constitute the conceptual foundations for the development of mathematical models aimed at operationalizing PFS review. Due to the complexity and interactions of the variables involved in our process, AI algorithms could be a suitable solution to this scope.
Our work provides valuable operational benefits for many different economic actors.
First, it supports auditors in evaluating the likelihood that a plan will ensure business continuity for the company analyzed. Moreover, they can also review the fair value measurements used in the financial statements with the same tool.
Second, our work can support all users (banks, analysts, valuers, etc.), who are called to adopt a more forward-looking approach in formulating estimates and corporate valuations. In this respect, on the one hand, they can better assess the reasonableness and riskiness of future cash flows of a company. On the other hand, they can better estimate the operational risk by means of forecast dispersion (uncertainty) and inject this measure into the discount rate of cash flows. This should reduce the procyclicality caused by the classic scoring systems used by financial institutions.
Third, managers can be supported in the development and publication of a PFS because they can follow a structured process that ensures consistency between the variables and their (competitive and strategic) drivers. Moreover, classic sensitivity analysis can be enriched by the use of dispersion measures of forecasts, leading to a more comprehensive assessment about the financial sustainability of the plan. These elements help managers to develop “early warning tools” for preventing insolvency (EU Insolvency Directive 2019/1023).
Our framework is generalizable, as it defines a process and guiding principles that can be applied to any context and any type of company. It is also modular, so certain steps in the process can be bypassed or adapted to specific situations. For example, if we aim to express only stationary judgments, the process can stop at historical consistency analysis. This is more suitable for companies operating in stable competitive environments, such as pharmaceutical and consumer staples industries. Similarly, the review process can be simplified for acyclical sectors, by only considering the strategic consistency, since the external environment is less impactful. Conversely, when we deal with start-ups, we have to rely exclusively on prospective data, evidently bypassing the historical consistency analysis.
In conclusion, we propose a PFS review framework tailored to the users’ expertise, skills, information availability, etc. This characteristic responds to the recent recommendation of the European Banking Authority (
EBA, 2020) concerning the “single customer view” and the need to develop models tailored to the specific business characteristics of a firm.
Looking at the limitations of our work, the application of the framework undoubtedly presents significant complexities. The first problem relates to the characteristics and quantity of the available data. Data availability is a critical aspect, on which the driver reconstruction depends. Having access to large databases and management materials is essential for collecting historical and prospective data, in the competitive and strategic context. Evidently, review work is easier when we consider large and transparent companies, operating in deeply analyzed industries.
The ability to process a large amount of data and to analyze their interactions represents another source of complexity. To this end, we highlight the role of machine learning algorithms, whose ability to identify and manage non-linear relationships between variables is increasingly widespread in corporate finance (
Chen et al., 2022).


