Article

Is Bitcoin’s Market Maturing? Cumulative Abnormal Returns and Volatility in the 2024 Halving and Past Cycles

by
Vinícius Veloso
1,†,
Rafael Confetti Gatsios
2,†,
Vinícius Medeiros Magnani
1,* and
Fabiano Guasti Lima
1
1
School of Economics, Business Administration and Accounting at Ribeirão Preto, University of São Paulo, São Paulo 14040-905, Brazil
2
ISG Business School, 1500-552 Lisboa, Portugal
*
Author to whom correspondence should be addressed.
These authors contributed equally to this work.
J. Risk Financial Manag. 2025, 18(5), 242; https://doi.org/10.3390/jrfm18050242
Submission received: 4 February 2025 / Revised: 21 April 2025 / Accepted: 23 April 2025 / Published: 1 May 2025
(This article belongs to the Special Issue Financial Reporting Quality and Capital Markets Efficiency)

Abstract

:
This study examines how cumulative abnormal returns (CARs, the sum of abnormal returns over a period) and volatility behave around Bitcoin halving events, focusing on whether these patterns have evolved as the cryptocurrency market matures. Halvings are periodic events defined by Bitcoin’s algorithm, during which the reward—in the form of newly issued bitcoins—paid to miners for validating network transactions is reduced, impacting miners’ profitability and potentially influencing the asset’s price due to a decreased supply. To carry out the analysis, we collected data on returns and risk for the 2012, 2016, 2020, and 2024 halving events and compared abnormal returns before and around the event, focusing on the 2020 and 2024 halvings. The results reveal significant shifts in Bitcoin’s price behavior within the event window, with an increased occurrence of abnormal returns in 2020 and 2024, alongside variations in average return, volatility, and maximum drawdown across all events. These findings suggest that Bitcoin’s returns and volatility during halvings are decreasing as the cryptocurrency market becomes more regulated and attracts greater participation from institutional investors and governments.

1. Introduction

Bitcoin halving events, occurring approximately every four years as programmed by its algorithm, halve the block reward paid to miners, reducing the issuance of new coins and potentially influencing asset prices through supply constraints. These predictable events offer a valuable opportunity to evaluate market efficiency and investigate how investor responses evolve as the cryptocurrency market matures under increasing regulatory scrutiny and institutional engagement.
According to the Efficient Market Hypothesis presented by (Fama, 1970), asset prices in an efficient market follow a random walk, rendering it unfeasible to devise trading strategies that consistently exploit predictable patterns for abnormal profits. However, empirical evidence from (Caporale et al., 2019) identifies market anomalies, such as calendar effects, exaggerated price reactions, or volume-driven patterns, that contradict this theory.
A substantial body of literature has examined Bitcoin’s financial properties. Studies like (Urquhart, 2016) contend that Bitcoin departs from the Efficient Market Hypothesis, exhibiting inefficiencies distinct from traditional assets, while (Dyhrberg, 2016) emphasizes its unique hedging capabilities. Regulatory impacts on pricing are explored in (Zohar, 2015), and (Ramos et al., 2021) analyzes how cyberattacks affect cryptocurrency returns. Concerning halvings specifically, (M’Bakob, 2024) and (Meynkhard, 2019) associate supply reductions with speculative price movements; however, comprehensive studies spanning all four events, 28 November 2012, 9 July 2016, 11 May 2020, and 19 April 2024, to assess long-term trends, remain limited. This study extends prior work by including the 2024 halving, comparing all four events in a unified framework, and providing evidence of evolving investor behavior and increasing market maturity.
The objective of this study is to examine how Bitcoin’s market response to halving events—measured using cumulative abnormal returns (CARs) and volatility—has evolved across the 2012, 2016, 2020, and 2024 cycles, with a particular focus on the 2020 and 2024 events. We collected price data over a 480-day window for each event, estimated normal returns using ordinary least squares (OLS, a statistical method for linear regression) regression, and computed CARs by comparing actual returns to modeled expectations, while also tracking volatility trends across all halvings. This approach enables us to assess both immediate reactions and broader market evolution, contributing a cohesive historical perspective to the literature.
We find that while the 2024 halving triggered elevated CAR and volatility, these effects were less pronounced than in earlier cycles, with returns and volatility declining from 2012 to 2024, suggesting market stabilization. The 2024 halving elevated CARs and volatility proximate to the event, with average 30-day volatility increasing from 1.88% in the reference period to 2.72% during the event, though these effects were less intense than in earlier cycles, such as 2012 (3.24%) and 2020 (3.92%). In both 2020 and 2024, CAR peaked prior to the halving, impacted by external factors like the 2020 pandemic and bolstered by institutional investments in 2024, before aligning with reference levels post-event. Over the four halvings, mean daily returns and volatility declined, dropping from 0.92% and 3.24% in 2012 to 0.13% and 2.72% in 2024 (240-day window), indicating that Bitcoin’s market is stabilizing as regulatory frameworks strengthen and mainstream adoption expands.

2. Materials and Methods

In this study, an analysis of the economic parameters of the Bitcoin asset was conducted to assess the occurrence of abnormal returns influenced by the halving events that took place in 2020 and 2024. Data pertaining to the asset’s volatility and drawdown were also collected and analyzed for all halving events that occurred up to the present date (2012, 2016, 2020, and 2024) in order to examine, over time, the trends in risk and return exhibited by the asset in proximity to the halving events.

2.1. Event Definition

The events examined in this study were the halvings that occurred on 28 November 2012, when reward for solved block was reduced from 50 to 25 bitcoins), 9 July 2016 (reward reduction to 12.5 bitcoins), 11 May 2020 (reward reduction to 6.25 bitcoins), 19 April 2024 (reward reduction to 3.125 bitcoins).

2.2. Sample Definition

Three distinct time windows were employed to evaluate the asset’s behavior. A 16-month time window was established to analyze the asset’s long-term behavior. This interval was subdivided into a reference interval lasting 8 months, commencing 12 months and concluding 4 months prior to the event. The second interval, termed the event window, was also defined as spanning 8 months, beginning 4 months before the event and ending 4 months after the event. We determined the sizes of these intervals based on observations by (Meynkhard, 2019), which suggested that approximately 4 months are required for Bitcoin to reflect behavioral changes following a halving event. The reference interval was utilized to obtain normal returns, as it represents a period sufficiently removed from the event, with returns obtained during this period compared to those of the event period to identify abnormal returns. Two additional windows were employed for the analysis of the asset’s risk and return in proximity to halving events: a medium-term window (30 days) and a short-term window (7 days). The use of these reduced-interval windows aimed to capture short-term effects on the asset’s behavior over time.

2.3. Calculation Procedures

We used the collected data as the foundation for calculating Bitcoin’s economic parameters and evaluating abnormal returns during the periods relative to the asset’s 365-day average. The decision to adopt a 365-day window was grounded in its ability to smooth short-term fluctuations while capturing longer-term trends, establishing it as an appropriate benchmark for expected returns in cryptocurrency markets. The cumulative abnormal return was derived by comparing actual and estimated returns. Additionally, smaller time windows of 30 and 7 days were employed to capture the medium- and short-term behavior of the asset’s risk and return around the halving period. The analysis of abnormal returns specifically considered the halving events of 2020 and 2024, while the risk and return analysis was conducted by comparing long-, medium-, and short-term behavior across the halvings that occurred between 2012 and 2024. The analysis was performed using a Python 3.12-based algorithm that processed historical price data, calculated expected returns via OLS regression, and identified abnormal returns by comparing actual performance with modeled expectations. This approach ensures a straightforward application of the event study methodology widely utilized in financial research. The Python algorithm was also developed to generate graphical representations. We additionally conducted calculations using Microsoft Excel. The following parameters were raised for the evaluated periods.

2.4. Continuous Return

This measures the gain or loss of an investment over a period of time, considering continuous compounding (Assaf Neto, 2018). It can be obtained from Equation (1).
R t = l n P t P t 1

2.5. Volatility

Volatility represents a measure of asset risk, calculated from the standard deviation of the continuous returns of the asset during the period (Dyhrberg, 2016), as shown in Equation (2).
v o l a t = 1 n 1 i = 1 n ( R i R m e a n ) ²

2.6. Drawdown

This is a risk indicator represented by the percentage variation between the maximum and minimum values of the asset price time series (Lima, 2023).
.2.7. Calculation of Normal and Abnormal Returns
Event studies, as described by (Campbell et al., 1997), assess the impact of economic events on asset prices. To evaluate the effects of Bitcoin halvings, we calculated normal and abnormal returns. Normal returns are those expected in the absence of the event, while abnormal returns reflect deviations caused by the event. We used a 365-day moving average of Bitcoin’s USD exchange rate as the benchmark for normal returns, justified by Bitcoin’s low correlation with traditional assets (Baur et al., 2018; Marthinsen & Gordon, 2022).
We calculated the 365-day moving average for each daily closing price within the study period. Using ordinary least squares (OLS) regression, we modeled the relationship between the asset price and its 365-day moving average as follows:
Rit = αi + βiRmt + ϵit
Expected returns were derived from this model, and actual returns were compared to identify abnormal returns, as follows:
*ϵit = RitE[Rit|Xt]
Daily abnormal returns were summed over the reference and event periods to compute cumulative abnormal returns (CARs), highlighting behavioral differences due to the halving.

3. Results

3.1. Cumulative Abnormal Returns Analysis—2020 and 2024 Halving Events

Initially, linear regressions were performed using the ordinary least squares method on data regarding the price of Bitcoin and the 365-day moving average values during both analysis periods. Figure 1 illustrates the relationship between Bitcoin’s closing price and its 365-day moving average during the reference interval for the 2020 halving event. This comparison establishes a baseline for price behavior before the halving, which is essential when modeling normal returns.
As shown in Figure 1, the closing price closely follows the moving average, suggesting consistent market conditions in the reference period, in contrast to the fluctuations observed during the event window.
Figure 2 depicts the relationship between Bitcoin’s closing price and its 365-day moving average during the event interval for the 2020 halving. This figure is crucial for identifying deviations from normal price behavior around the halving event.
In Figure 2, the widening gap between the closing price and the moving average reflects the market’s reaction to the halving, exacerbated by external factors such as the COVID-19 pandemic.
Figure 3 shows the relationship between Bitcoin’s closing price and its 365-day moving average during the reference interval for the 2024 halving event. This serves as a benchmark for normal market conditions prior to the 2024 halving.
As illustrated in Figure 3, the price tracks the moving average closely, indicating that the market was relatively stable in the months leading up to the 2024 halving. Figure 4 presents the relationship between Bitcoin’s closing price and its 365-day moving average during the event interval for the 2024 halving. This figure highlights the market’s response to the halving event in a more mature market environment.
The coefficients of determination (R2) of the regression models showed significant differences in both years, with a value of 0.70 for the reference interval and 0.37 for the period of events in 2024, as well as 0,27 and 0,05 in 2020. This indicates a variation in the representativeness of the linear model between the intervals evaluated. An analysis of the significance of the parameters of the linear models used was conducted, with the following results, and both models presented statistically significant parameters at a 95% confidence level (p-value = 0). Table 1 summarizes key economic parameters for Bitcoin during the reference and event periods of the 2020 and 2024 halving events. These metrics, including average daily return and volatility, reveal how market dynamics shift around the halving.
Table 2 provides a detailed comparison of Bitcoin’s economic parameters before and after the 2020 and 2024 halving events. This breakdown allows for a closer examination of how the market adjusted in the immediate lead-up and aftermath of each halving.
We observed higher average returns during the pre-halving periods of both events. The minimum returns exhibited similar levels; however, regarding maximum returns, it is noteworthy that, in March 2020, at the onset of the COVID-19 pandemic, there was a significant impact on the asset’s performance, resulting in a negative return of 47.99% in a single day. This led to an average volatility of 5% and triggered a drawdown that extended over 158 days. Following the recovery from the event, in the post-halving period, the return and volatility values across both periods converged once again.
The correlation between the volatility curves is presented in Table 3.
The volatility correlations in Table 3 indicate varying dynamics between 2020 and 2024. The weak positive correlation (0.547) in the 60-day pre-halving window suggests some alignment in volatility patterns, possibly due to shared market expectations. The strong negative correlation (−0.843) in the 14-day post-halving window for 2020 reflects the pandemic’s disruptive impact, contrasting with 2024’s more stable post-halving period (0.624 in the 240-day window), indicating improved investor adaptation and market efficiency.
Figure 5 compares the 30-day volatility of Bitcoin during the reference and event periods for the 2020 and 2024 halvings. This figure is essential for understanding how market risk changes around these events.
As seen in Figure 5, volatility peaked significantly during the 2020 event period, likely influenced by the pandemic, while the 2024 event shows a more moderate increase, suggesting greater market resilience.
To evaluate the correlation between the asset’s closing price and volatility during the event period, the correlation coefficient between these two variables was calculated. The obtained values were −0.71 for 2020 and 0.30 for 2024, indicating a weak positive correlation between the closing price and the asset’s volatility in 2024, but a stronger negative correlation in 2020, possibly due to the destabilizing effect of the pandemic.
Figure 6 plots Bitcoin’s closing price against its 30-day volatility during the event interval for the 2020 halving. This figure helps visualize the relationship between price movements and market risk during the halving period.
Figure 7 displays Bitcoin’s closing price and 30-day volatility during the event interval for the 2024 halving. This figure reveals how price and volatility interact in a more stable market environment.
In contrast to 2020, Figure 7 shows a weaker relationship between price and volatility in 2024, indicating that the market was less reactive to price changes during this halving.
The negative correlation (−0.71) between price and volatility in 2020, as shown in Figure 6, underscores the market’s sensitivity to external shocks during this period.
For both intervals studied, abnormal returns were obtained by calculating the difference between the daily continuous return of the actual prices and the daily continuous return obtained through the respective regression equation. The cumulative abnormal return (CAR), representing the sum of the returns over the evaluated periods, was then calculated. Figure 8 tracks the cumulative abnormal returns (CARs) for Bitcoin during the 2020 halving event.
As illustrated in Figure 8, the CAR reached its highest point just before the halving but dropped significantly during the event window, reflecting the market’s initial optimism and subsequent correction.
Figure 9 presents the cumulative abnormal returns (CARs) for Bitcoin during the 2024 halving event. This figure highlights the market’s more muted response compared to earlier cycles.
In Figure 9, CAR peaks earlier and returns to baseline faster than in 2020, indicating that the market anticipated the halving’s impact more effectively in 2024.
An analysis of the abnormal returns during the 2020 and 2024 halvings showed similarities and differences. The pandemic caused significant losses starting in March 2020; however, these were slowly recovered over time, with positive cumulative returns seen at the end of the post-halving period. This pandemic impact might have disrupted typical return dynamics, possibly preventing much higher gains, especially since positive cumulative returns were recorded early in the pre-halving window before the big drop. In 2024, there were no major disruptive events, and some stabilizing factors helped, such as the hope for better market rules, more money coming from ETFs by big financial firms, and countries like El Salvador planning to hold cryptocurrency reserves. These factors likely led to a significant increase in the maximum level of cumulative positive abnormal returns.
It is interesting to note that in both halving events we examined, by the end of the 240-day window, the cumulative return values between the reference and event periods came closer together. This suggests that changes in mining currency supply might not affect asset returns as much as market expectations do, and that mining costs tend to follow the asset’s price movements rather than predict them, which matches the findings obtained by (Ramos et al., 2021). Despite the reduced currency supply post-halving, the expected sustained increase in cumulative abnormal returns did not occur, indicating that external factors may have had a stronger influence than supply-side effects.

3.2. Return and Volatility Analysis—2012 to 2024 Halvings

In this section, the asset’s behavior was evaluated in terms of its return and volatility during pre- and post-halving periods, using time windows of 240 days (long-term), 30 days (medium-term), and 7 days (short-term). The behavior of Bitcoin during these periods was studied, considering all halving events that have already occurred, as presented in Table 4.
The mean return and volatility were calculated for all halving periods, considering different time windows. This approach aimed to capture, in a more precise and direct manner, the effects related to the halving of the profitability and risk associated with the asset, both in the short and long term. The inclusion of all periods in the analysis also sought to identify trends in returns and volatility over the years, as Bitcoin has gradually undergone changes in its investor profile and regulatory framework, resulting in increased adoption in the investment portfolios of various sizes worldwide. These changes could lead to greater maturity of the asset, potentially reducing its volatility and, consequently, the returns it provides over time.
The data pertaining to the mean return are presented in Table 5.
Figure 10 illustrates the mean daily returns across all halving events.
In 2012, we see the highest returns at 0.23%, 0.76%, and 0.92% for the short, medium, and long windows, which makes sense given the early market’s high volatility and growth.
But the trend goes down from there—by 2024, returns are much lower, with a negative −0.23% in the 30-day window, hinting that the market is maturing and becoming less volatile. The graph backs this up, showing a sharp drop from 2012 to 2016, somewhat of a bounce back in 2020 (probably due to the post-pandemic recovery), and then a leveling off at lower values in 2024, especially in the shorter windows. This suggests that as Bitcoin becomes more widely used and regulated, the effect of halving on returns becomes weaker, probably because market expectations and outside factors play a bigger role now.
The data obtained for the average volatility during the periods are presented in Table 6.
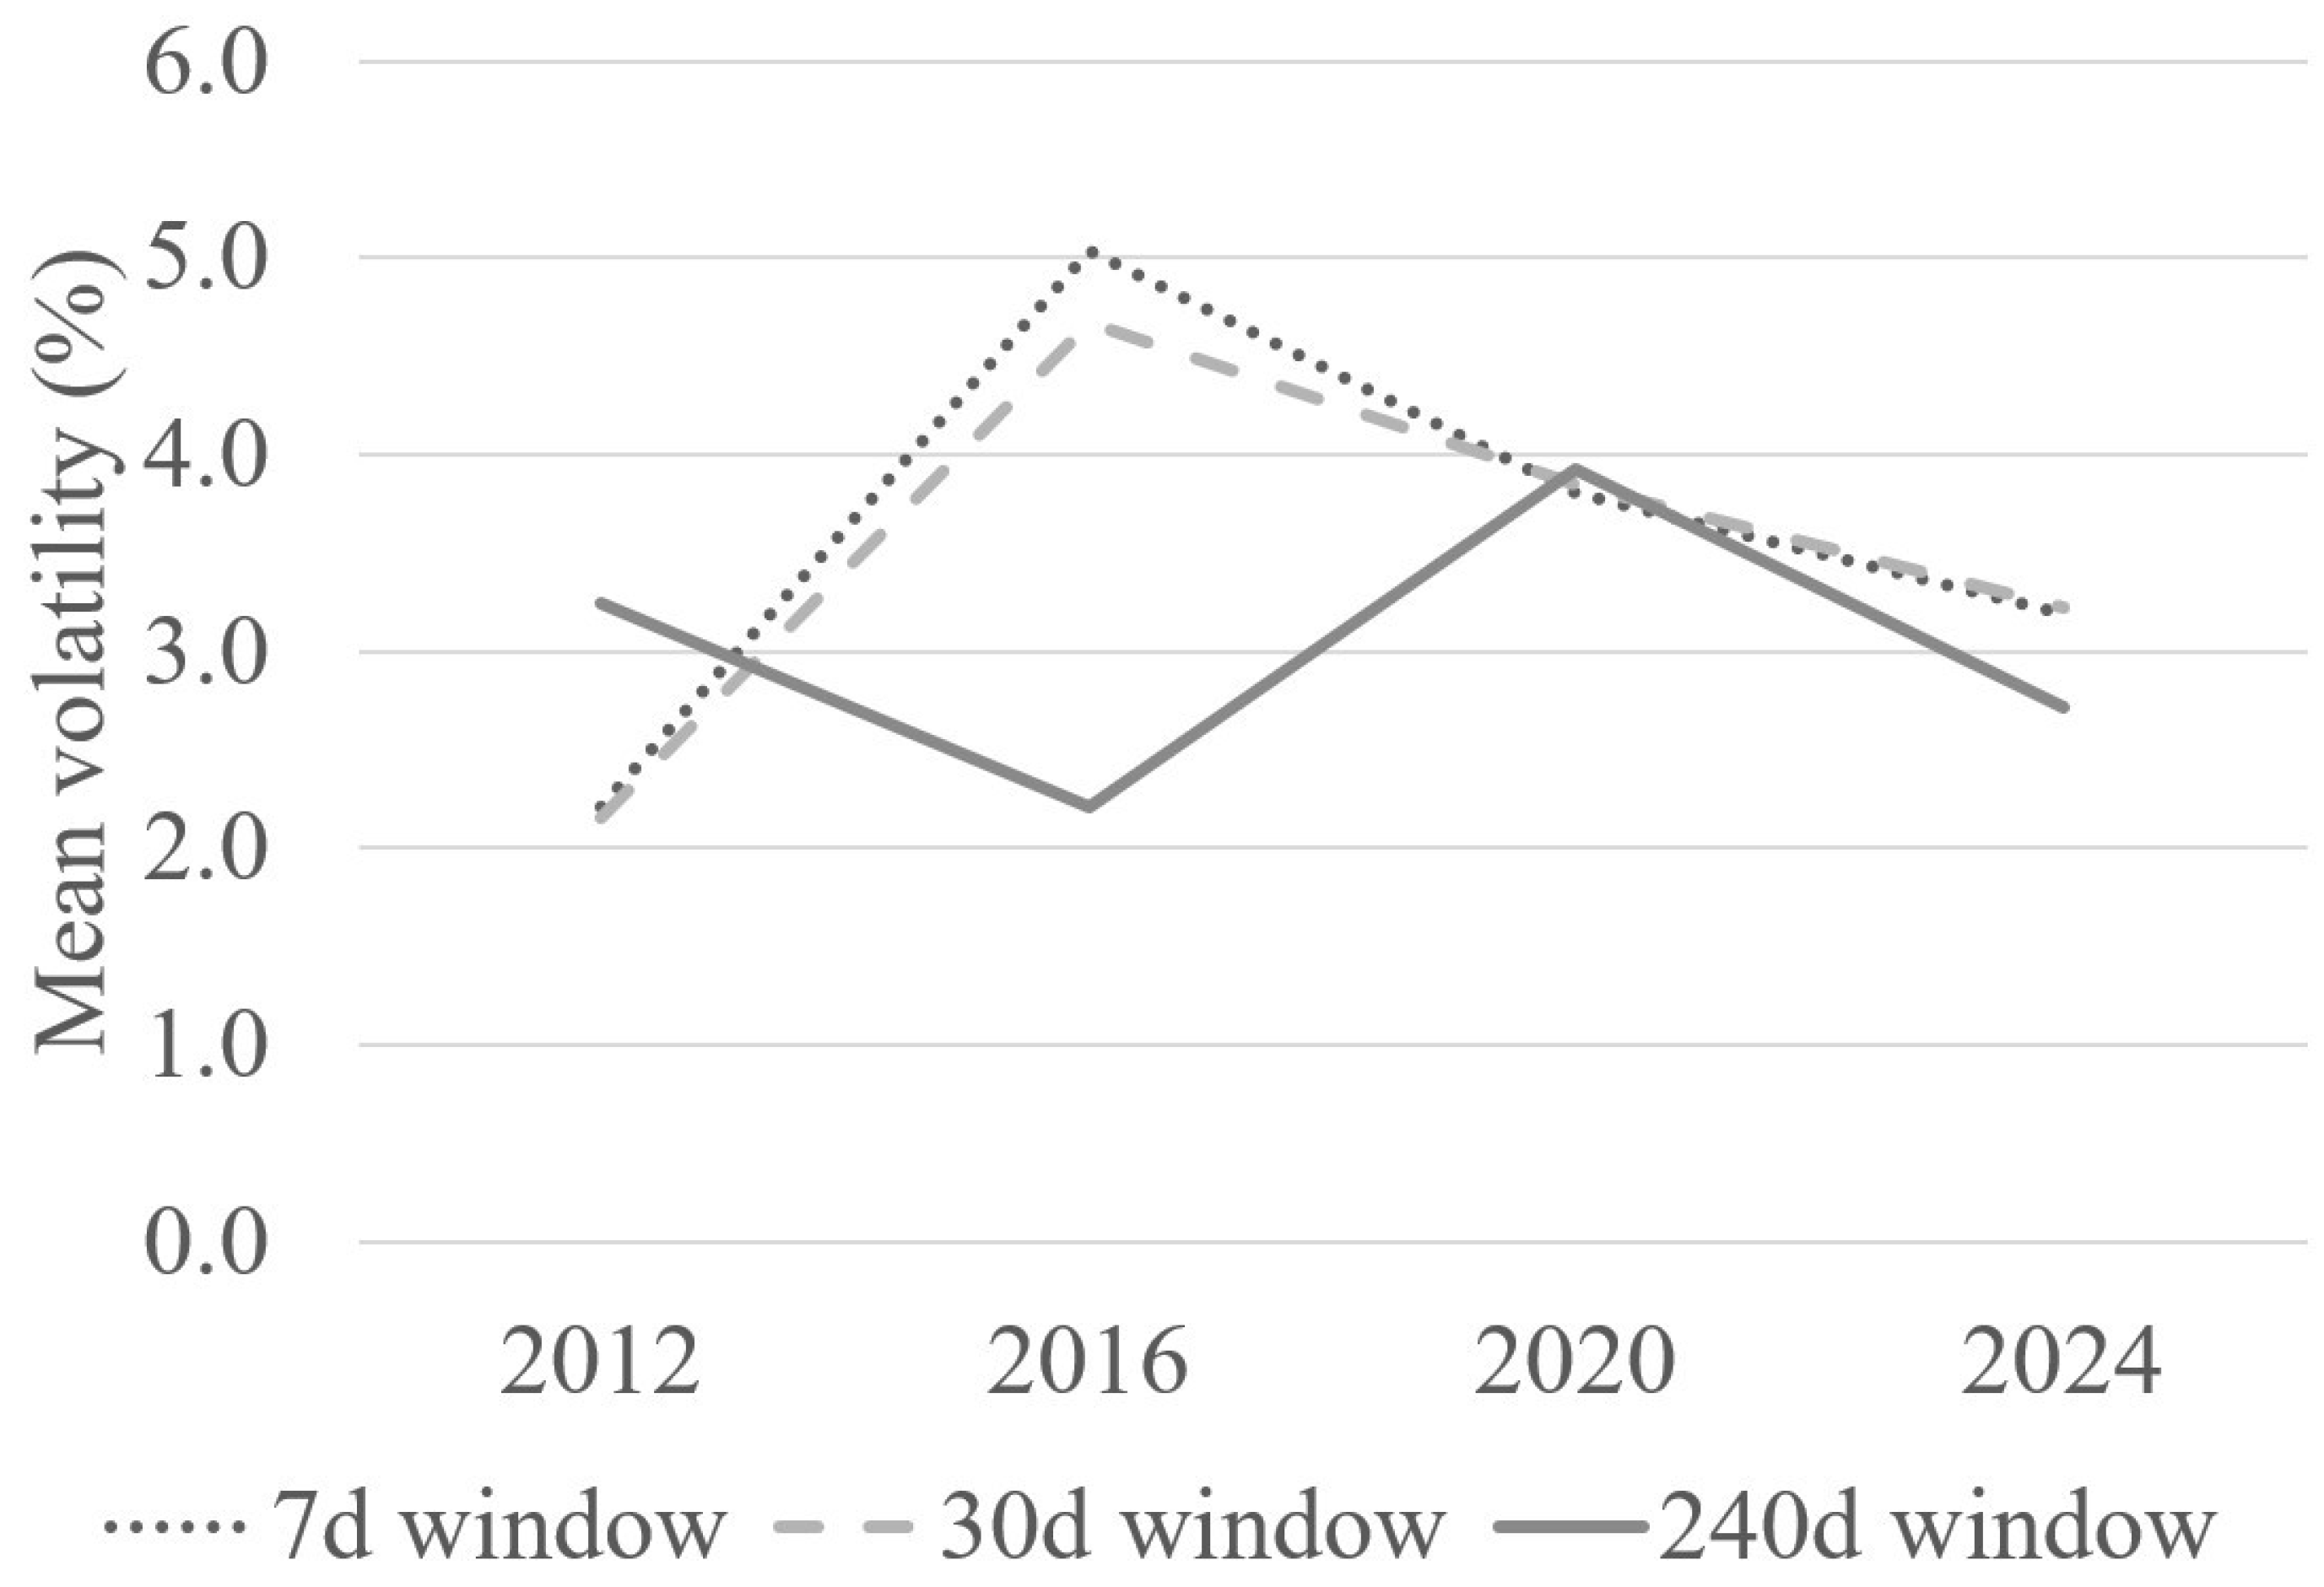
The illustrative graph of the mean volatility is presented in Figure 11.
Figure 11 reveals different volatility patterns across the four halving cycles. For the 7-day and 30-day windows, volatility peaked in 2016 at 5.04% and 4.67%, respectively, before declining to 3.19% and 3.22% in 2024. In the 240-day window, volatility was highest in 2020 at 3.92%, influenced by the COVID-19 pandemic, but dropped to 2.72% in 2024, indicating greater market resilience and efficiency in pricing predictable supply shocks.
The lower volatility in 2024 (2.72%) compared to 2012 (3.24%) and 2020 (3.92%) suggests increasing market efficiency, as investors better price in predictable supply reductions, reducing the scope for speculative overreactions. The gradual decline after the peaks may reflect market stabilization or reduced speculative activity. Figure 6 visually supports these findings, showing how different time windows capture unique aspects of Bitcoin’s market behavior during halving cycles.

4. Discussion

The findings of this study reveal that the halving of 2024 Bitcoin, which reduced the block reward to 3.125 BTC on 19–20 April 2024, significantly influenced the price behavior of the asset. Compared to the reference period, the event window showed increased volatility (2.72% vs. 1.88%, Table 1) and maximum drawdown (26.10% vs. 20.07%), along with a lower correlation between actual prices and the regression model (0.61 vs. 0.84). These shifts indicate a destabilizing effect, likely driven by speculative trading tied to the expected supply reduction, consistent with the temporary market inefficiencies noted in prior research (Urquhart, 2016; Dyhrberg, 2016).
Connecting these results to earlier halvings (2012, 2016, 2020) reveals an evolving trend. The volatility of the 2024 halving (2.72% over 240 days, Table 6) is lower than 2012 (3.24%), 2016 (2.21%), and 2020 (3.92%), while the mean daily returns (0.13%, Table 5) are markedly reduced from 2012 (0.92%) and 2016 (0.22%), although similar to 2020 (0.11%). This decline suggests that the Bitcoin market is maturing, with halvings exerting a diminishing impact on returns and volatility over time. In 2012, early market exuberance drove high returns (0.92%) and moderate volatility (3.24%), while 2016 saw a volatility spike (5.04% over 7 days) but lower returns (0.15%). The 2020 halving, disrupted by the COVID-19 pandemic, exhibited a sharp pre-halving drop (−47.99%) but recovered to positive CARs, unlike in 2024, where no major external shock occurred, and CARs peaked higher due to stabilizing factors such as institutional ETF investments and regulatory clarity.
Despite the supply cut of 2024, the expected sustained price increase did not occur, as the CAR converged with the reference period at the end of the 240-day window, echoing the finding of (Ramos et al., 2021) that mining costs follow price trends rather than dictate them. This pattern, evident in all halvings, suggests that market expectations and external forces, such as the pandemic in 2020 or institutional adoption in 2024, outweigh supply shocks. The decreasing volatility and returns from 2012 to 2024 (Table 5 and Table 6) reflect the growing integration of Bitcoin into mainstream finance, reducing its sensitivity to halving.

5. Conclusions

This study examined how Bitcoin’s market response to halving events, measured using cumulative abnormal returns (CARs) and volatility, has evolved across the 2012, 2016, 2020, and 2024 cycles. Our findings indicate that the impact of halvings on Bitcoin’s price behavior has diminished over time, reflecting a maturing market. Unlike earlier cycles marked by high volatility and returns, the 2024 halving showed more restrained market reactions, driven by increased investor anticipation of supply shocks and stabilizing external factors, such as institutional investments and clearer regulatory frameworks. These trends suggest that Bitcoin is transitioning from a speculative asset to a more stable financial instrument, offering valuable insights for investors navigating short-term opportunities and regulators addressing persistent market dynamics. Future research could explore how these patterns influence other cryptocurrencies, further illuminating Bitcoin’s role in the evolving financial landscape.

Author Contributions

Conceptualization, V.V. and R.C.G.; methodology, V.V. and V.M.M.; software, V.V. and V.M.M.; validation, V.V., R.C.G., V.M.M. and F.G.L.; formal analysis, V.V., R.C.G. and V.M.M.; investigation, V.V. and R.C.G.; resources, V.V.; data curation, V.V.; writing—original draft preparation, V.V. and V.M.M.; writing—review and editing, V.M.M., F.G.L. and R.C.G.; visualization, V.V.; supervision, R.C.G.; project administration, R.C.G. All authors have read and agreed to the published version of the manuscript.

Funding

This research received no external funding.

Data Availability Statement

The data presented in this study is available on request from the authors.

Conflicts of Interest

The authors declare no conflicts of interest.

Abbreviations

The following abbreviations are used in this manuscript:
CARCumulative Abnormal Return
RtContinuous Return
volatVolatility
ϵitAbnormal Return
RmeanMean Return
RmtMoving Average Return
E(Rit)Normal Return
RitActual Return
365 d365 days
30 d30 days

References

  1. Assaf Neto, A. (2018). Mercado financeiro. Atlas. [Google Scholar]
  2. Baur, D. G., Hong, K., & Lee, A. D. (2018). Bitcoin: Medium of exchange or speculative asset? Journal of International Financial Markets, Institutions and Money, 54, 177–189. [Google Scholar] [CrossRef]
  3. Campbell, J. Y., Lo, A. W., & MacKinlay, A. C. (1997). The econometrics of financial markets. Princeton University Press. [Google Scholar]
  4. Caporale, G. M., Plastun, A., & Oliinyk, V. (2019). Bitcoin fluctuations and the frequency of price overreactions. Financial Markets and Portfolio Management, 33(2), 109–131. [Google Scholar] [CrossRef]
  5. Dyhrberg, A. H. (2016). Hedging capabilities of bitcoin: Is it the virtual gold? Finance Research Letters, 16, 139–144. [Google Scholar] [CrossRef]
  6. Fama, E. F. (1970). Efficient capital markets: A review of theory and empirical work. The Journal of Finance, 25(2), 383–417. [Google Scholar] [CrossRef]
  7. Lima, F. G. (2023). Análise de riscos. Atlas. [Google Scholar]
  8. Marthinsen, J. E., & Gordon, S. R. (2022). The price and cost of bitcoin. The Quarterly Review of Economics and Finance, 85, 280–288. [Google Scholar] [CrossRef]
  9. M’Bakob, G. B. (2024). Bubbles in bitcoin and ethereum: The role of halving in the formation of super cycles. Sustainable Futures, 7, 100178. [Google Scholar] [CrossRef]
  10. Meynkhard, F. (2019). Fair market value of bitcoin: Halving effect. Investment Management and Financial Innovations, 16(4), 72–85. [Google Scholar] [CrossRef]
  11. Ramos, S., Pianese, F., Leach, T., & Oliveras, E. (2021). A great disturbance in the crypto: Understanding cryptocurrency returns under attacks. Blockchain: Research and Applications, 2(3), 100021. [Google Scholar] [CrossRef]
  12. Urquhart, A. (2016). The inefficiency of bitcoin. Economics Letters, 148, 80–82. [Google Scholar] [CrossRef]
  13. Zohar, A. (2015). Bitcoin: Under the hood. Communications of the ACM, 58(9), 104–113. [Google Scholar] [CrossRef]
Figure 1. Bitcoin’s closing price compared to its 365-day moving average during the reference interval for the 2020 halving event. The figure highlights how short-term price movements align with long-term trends, providing a benchmark for pre-halving market stability.
Jrfm 18 00242 g001
Figure 2. Bitcoin’s closing price versus its 365-day moving average during the event interval for the 2020 halving. The divergence between the two lines indicates increased market volatility and abnormal price movements during this period.
Jrfm 18 00242 g002
Figure 3. Comparison of Bitcoin’s closing price and its 365-day moving average during the reference interval for the 2024 halving event. The close alignment suggests stable market behavior before the halving.
Jrfm 18 00242 g003
Figure 4. Bitcoin’s closing price versus its 365-day moving average during the event interval for the 2024 halving. The figure shows moderate deviations, reflecting a more tempered market reaction compared to earlier halvings.
Jrfm 18 00242 g004
Figure 5. Thirty-day volatility of Bitcoin during the reference and event periods for the 2020 and 2024 halving events. The figure illustrates the increase in volatility during the event windows, with a notable spike in 2020 due to external factors.
Jrfm 18 00242 g005
Figure 6. Bitcoin’s closing price and 30-day volatility during the event interval for the 2020 halving. The figure shows a strong inverse relationship, with volatility spiking as prices drop, particularly during the pandemic-induced market crash.
Jrfm 18 00242 g006
Figure 7. Bitcoin’s closing price and 30-day volatility during the event interval for the 2024 halving. The weak positive correlation (0.30) suggests that volatility remained relatively stable despite price fluctuations.
Jrfm 18 00242 g007
Figure 8. Cumulative abnormal returns (CARs) for Bitcoin during the 2020 halving event. The figure shows a pre-halving peak, followed by a sharp decline during the pandemic and a gradual recovery post-halving.
Jrfm 18 00242 g008
Figure 9. Cumulative abnormal returns (CARs) for Bitcoin during the 2024 halving event. The figure reveals a smaller pre-halving peak and quicker convergence to reference levels, suggesting improved market efficiency.
Jrfm 18 00242 g009
Figure 10. Mean daily returns of Bitcoin across 7-day, 30-day, and 240-day windows for the 2012–2024 halvings. The figure shows a decline from 0.92% in 2012 to 0.13% in 2024 (240-day), indicating market maturity.
Jrfm 18 00242 g010
Figure 11. Mean volatility of Bitcoin across 7-day, 30-day, and 240-day windows for the 2012–2024 halvings, showing a peak in 2016 and decline by 2024.
Jrfm 18 00242 g011
Table 1. Comparative analysis of Bitcoin’s economic parameters during the reference and event periods for the 2020 and 2024 halving events. Metrics such as average daily return, 30-day volatility, maximum drawdown, and 365-day price-average correlation highlight increased market uncertainty during the event windows.
20202024
ReferenceEventReferenceEvent
Average Daily Return (%)0.010.110.180.13
Maximum Daily Return15.2613.599.7811.27
Minimum Daily Return−14.64−47.99−7.50−8.78
Average 30-Day Volatility (%)3.843.921.882.72
Maximum Drawdown (%)48.6152.5420.0726.10
Price × Average Correlation 365 Days−0.520.230.840.61
Table 2. Comparative analysis of Bitcoin’s economic parameters pre- and post-halving for the 2020 and 2024 events. Key metrics include average daily return, volatility, and maximum drawdown, revealing distinct behavioral shifts before and after each halving.
20202024
PrehalvingPosthalvingPrehalvingPosthalving
Average Daily Return (%)0.150.140.31−0.06
Maximum Daily Return13.5910.509.1511.27
Minimum Daily Return−47.99−11.35−8.78−7.32
Average 30-Day Volatility (%)5.002.852.912.53
Maximum Drawdown (%)52.5417.34−16.19−24.36
Maximum Drawdown Duration (days)158193577
Table 3. Thirty-day volatility correlation across different time windows for the years 2020 and 2024.
2020 and 2024 30d Volatility Correlation14d Window60d Window240d Window
Pre-halving0.1070.5470.051
Post-halving−0.843−0.0600.624
Table 4. Bitcoin halving events and block reward reductions.
EventDatePrevious Reward (BTC)New Reward (BTC)
First Halving28 November 20125025
Second Halving9 July 20162512.5
Third Halving11 May 202012.56.25
Fourth Halving19 April 20246.253.125
Table 5. Mean daily returns of Bitcoin across different time windows during halving years.
Mean Daily Return (%)2012201620202024
7d window0.230.150.250.01
30d window0.760.0010.55−0.23
240d window0.920.220.110.13
Table 6. Mean volatility over different periods and time windows.
Mean Volatility (%)2012201620202024
7d window2.215.043.803.19
30d window2.164.673.853.22
240d window3.242.213.922.72
Disclaimer/Publisher’s Note: The statements, opinions and data contained in all publications are solely those of the individual author(s) and contributor(s) and not of MDPI and/or the editor(s). MDPI and/or the editor(s) disclaim responsibility for any injury to people or property resulting from any ideas, methods, instructions or products referred to in the content.

