Abstract
This study evaluates the economic viability of the South Pasopati Coal Project in Indonesia, addressing market volatility, carbon pricing policies, and the country’s energy transition towards Net Zero Emissions (NZE). Given Indonesia’s reliance on coal and the increasing global shift toward renewable energy, traditional valuation methods such as Discounted Cash Flow (DCF) may not adequately capture uncertainty and strategic flexibility. The study applies Real Options Valuation (ROV), integrating Monte Carlo Simulation (MCS) and Binomial Lattice Modeling, to assess project feasibility under various scenarios. The research compares three valuation scenarios: the base scenario (eastern route), an alternative scenario (western route), and a carbon pricing scenario. Results indicate that while the DCF method estimates a positive Net Present Value (NPV) for the base scenario, it fails to incorporate price volatility risks. The ROV method, however, captures managerial flexibility and provides a more robust valuation, showing an Expanded NPV (ENPV) that better reflects market uncertainties. Findings suggest that implementing ROV improves decision-making, particularly in volatile markets. The study underscores the necessity for Indonesia to adopt more flexible valuation frameworks to enhance investment decisions in the coal sector while aligning with international environmental standards.
1. Introduction
The global energy landscape has shifted significantly in recent years. The COVID-19 pandemic in 2020 reduced energy demand, followed by a surge in 2022 amid economic recovery and geopolitical tensions (Mofijur et al., 2021; Putra et al., 2021; Q. Wang et al., 2022). Coal prices remain volatile, influenced by geopolitics and energy policies (Abbass et al., 2022). While developed nations transition to renewables (Paradongan et al., 2024), emerging economies like Indonesia continue to rely on coal due to affordability and infrastructure limitations (Cronshaw, 2015). Recent studies have demonstrated the increasing impact of geopolitical dynamics and regulatory uncertainty on coal price volatility (Guo & Zhao, 2024; Gollier, 2024), while carbon pricing strategies continue to evolve and influence project feasibility (Pramana et al., 2024; Pang et al., 2023). These developments underscore the need for adaptive valuation frameworks in project assessments.
As a major coal producer and exporter, Indonesia depends on China and India as key markets (Kurniawan et al., 2020; Garnaut, 2015). Despite its vast reserves and low production costs (Aries, 2016), the industry is vulnerable to shifts in global policies and demand (Gustino et al., 2025). The Paris Agreement and Indonesia’s Net Zero Emission (NZE) 2060 target push for carbon reduction (Kanugrahan & Hakam, 2023), yet Indonesia struggles with renewable adoption due to fossil fuel dependence and weak infrastructure (Xiaojun & Hakam, 2024). Carbon pricing, effective in developed nations (Pramana et al., 2024; Putra et al., 2021), faces resistance from Indonesia’s carbon-intensive industries (Garnaut, 2015). Building decarbonization faces infrastructure, policy, and financial barriers; collaboration and supportive policies are essential (Madadizadeh et al., 2024).
Mining project evaluation in Indonesia primarily relies on the Discounted Cash Flow (DCF) method due to its simplicity (Alfeus & Collins, 2023; Paradongan et al., 2024). However, DCF fails to address commodity price volatility and lacks flexibility in investment decision-making (Guj & Chandra, 2019). In contrast developed nations like Canada and Australia have increasingly adoptedReal Options Valuation (ROV), which integrates uncertainty and strategic decision-making (Chandra & Hartley, 2024). ROV, often combined with Monte Carlo Simulation (MCS), models multiple risk scenarios (Garnaut, 2015; Pawlak & Wisniewski, 2024). Many countries also incorporate carbon pricing into investment assessments, whereas Indonesia has yet to adopt such practices (Xiaojun & Hakam, 2024; Zapf et al., 2019).
This study introduces an innovative multi-stage valuation model integrating DCF, MCS, ROV, and BLM to assess coal mining projects under market volatility and carbon pricing policies in Indonesia. There has not been much research examining the application of the ROV method in the coal mining industry in Indonesia. Also, it is the first empirical study in Indonesia to quantify carbon pricing’s direct impact on coal mining feasibility, bridging financial and environmental considerations. Unlike past research on large-scale, low-rank coal mining, this study focuses on small-scale, high-rank coal projects, providing a flexible decision-making framework for investors and policymakers. By combining risk-adjusted financial modeling and real-time adaptability, this research redefines investment strategies in carbon-regulated markets, offering a new benchmark for sustainable mining valuation in developing countries such Indonesia. The research gap lies in the limited empirical application of ROV within Indonesia’s coal sector, particularly in small-scale, high-rank coal projects under evolving carbon pricing mechanisms. Most previous studies focus on large-scale, low-rank projects or overlook the impact of carbon regulations. Research on the application of the ROV method in the coal mining industry in Indonesia is still very limited. Moreover, this is the first empirical study in Indonesia to quantify the direct impact of carbon pricing on the feasibility of coal mining projects, bridging financial and environmental considerations. Therefore, the main objectives of this study are as follows: (1) to assess the economic viability of coal projects under market volatility using DCF and ROV approaches, and (2) to evaluate the impact of carbon pricing policy scenarios on investment decision-making.
To improve scientific rigor, the study adopts the following hypotheses: (H1) The implementation of carbon pricing policy significantly reduces the Net Present Value (NPV) of coal mining projects in Indonesia. (H2) The use of Real Options Valuation (ROV) results in a significantly higher Expanded NPV (ENPV) compared to traditional DCF under conditions of price volatility. These hypotheses will be evaluated through scenario analysis and Monte Carlo Simulation.
2. Materials and Methods
Mining projects are capital-intensive and subject to price volatility, making investment planning complex (Chandra & Hartley, 2024). Fluctuations in coal prices have impacted profitability, highlighting the limitations of static financial models (Alfeus & Collins, 2023; C. Wang et al., 2024). This uncertainty necessitates adaptive investment approaches (Gollier, 2024). Meanwhile, Net Zero Emission (NZE) policies and carbon pricing mechanisms are reshaping energy investments (Paradongan et al., 2024). Higher carbon costs have reduced the competitiveness of coal-fired power plants (Xiaojun & Hakam, 2024). The growth of renewable energy investments, such as solar and geothermal, is putting additional pressure on traditional energy sectors (Dobrowolski & Drozdowski, 2022). These changes highlight the need for investment models that accommodate policy-driven risks (Pang et al., 2023).
The DCF method remains widely used for investment evaluation due to its simplicity and structured approach (Kamel et al., 2023). By discounting future cash flows, DCF provides a clear profitability assessment (Yang et al., 2022). However, it assumes stable cash flows and fixed discount rates, making it unsuitable for highly uncertain environments (Kim et al., 2017). This rigidity limits its applicability in industries exposed to rapid market changes (Kurniawan et al., 2020). Conversely, Real Options Valuation (ROV) offers flexibility by allowing investors to adapt investment decisions to changing market conditions (Guj & Chandra, 2019). The use of Monte Carlo Simulations and stochastic modeling enhances ROV’s risk assessment (Pawlak & Wisniewski, 2024). In the mining sector, where commodity prices are volatile, ROV provides a more realistic valuation approach (Zapf et al., 2019).
A comparison of DCF and ROV reveals key differences. While DCF is easy to implement, it struggles in volatile markets, whereas ROV incorporates risk but requires advanced modeling (Gollier, 2024). Studies indicate that DCF is preferable for stable investments, whereas ROV excels in projects subject to uncertain policy and price movements (Pramana et al., 2024). In coal-fired power plant transitions, ROV captures the value of managerial flexibility in response to carbon pricing (Pang et al., 2023). Despite its advantages, ROV faces adoption barriers due to its complexity and reliance on probabilistic forecasting (Guo & Zhao, 2024). Hybrid models, such as integrating fuzzy real options into DCF frameworks, offer potential solutions (Zapf et al., 2019). While DCF remains relevant, its inability to handle uncertainty makes ROV superior for dynamic markets. As carbon pricing and renewable energy policies evolve, ROV’s adaptability will be crucial for future investment strategies.
Developed economies such as Australia (Ajak & Topal, 2015; Chandra & Hartley, 2024), Poland (Pawlak & Wisniewski, 2024), and the Czech Republic (Čulík & Gurný, 2017), have widely adopted ROV, supported by established carbon pricing mechanisms and stable regulatory frameworks. In contrast, developing countries such as China (Wu & Lin, 2020) and Indonesia (Ardhiansyah, 2022) face obstacles in adopting ROV for project evaluation due to regulatory uncertainty and fluctuating carbon pricing policies. Building upon the existing literature, this study explores the application of ROV in evaluating coal mining projects in Indonesia, a sector that remains largely underrepresented in global valuation models.
The DCF method is widely used to assess investment projects, including those in mining. It calculates NPV by discounting future cash flows at a specific discount rate, assuming a project’s value equals the present value of all expected cash flows. The standard NPV formula is as follows:
where NCFt is the Net Cash Flow in year t; r is the discount rate; t is the time period; and I is the initial investment (Dobrowolski & Drozdowski, 2022). The key components of DCF include projected cash flows, the discount rate (reflecting project risk), alternative investments (typically calculated using Weighted Average Cost of Capital (WACC)), and project duration.
Sensitivity analysis helps assess how changes in key variables (e.g., coal price, capital cost, operating cost) impact NPV. It identifies critical variables affecting project success or failure (Kamel et al., 2023). The formula for measuring sensitivity is as follows:
where S is the sensitivity; ΔH represents the change in the outcome (e.g., NPV); ΔV denotes the change in the variable being tested (e.g., coal price); V is the initial value of the variable being tested; and H is the initial value of the project outcome (NPV).
The process involves changing one variable at a time while keeping others constant and measuring the effect on NPV. Sensitivity graphs illustrate these impacts—steeper slopes indicate stronger influence. The intersection of variable lines at 100% represents the baseline NPV when all variables remain unchanged. Coal prices, capital expenditures (CapEx), and operating expenditures (OpEx) are key sensitivity factors. These insights help refine project evaluations.
Monte Carlo Simulation generates probabilistic distributions of potential NPV outcomes based on sensitive variables. By running thousands of iterations, MCS calculates a range of possible NPVs, providing statistics such as mean, median, standard deviation, and percentiles, indicating probabilities of exceeding or falling below certain thresholds. The general MCS formula for asset projection (e.g., coal price, OpEx, or CapEx) is as follows:
St is the coal price at time t; σ is the volatility of the coal price; Δt is the runtime (usually measured in years); and Z is a random variable from a standard normal distribution.
MCS results in a distribution of project values, making it effective for handling uncertainty in project management (Kodukula & Papudesu, 2006). It also helps derive volatility, crucial for Real Options Analysis (ROA). The volatility formula (Mun, 2006) is as follows:
Real options analysis (ROA) is a valuation method used to assess project economics by adapting financial concepts to the valuation of real assets, such as coal mining projects. The Real Options concept, introduced by Stewart C. Myers in 1977, emphasizes flexibility in decision-making under conditions of uncertainty. The main factors in ROA include economic uncertainty, where fluctuating asset values impact the feasibility of a project. The options considered in ROA include the option to execute (proceed with operations according to the initial plan) and the option to abandon (cancel the project if conditions become unfavorable to minimize further losses) in response to changes in the economic environment or policy. Investment in the coal mining sector is irreversible, making early decision-making crucial. A common method used in ROA is the Binomial Lattice method, which calculates the option value in stages by modeling asset values as a stochastic process that increases (u) or decreases (d) over a specific period
The binomial model can be represented by a binomial tree (Figure 1), as can the initial value of the asset. At the first increment period, the value increases or decreases, and it continues to increase or decrease at subsequent time increments. The upward and downward movements are represented by factors u and d, where u > 1 and d < 1, so u = 1/d is assumed. The size of these factors depends on the volatility of the underlying asset. The first time step of the binomial tree has two nodes indicating the possible value of the asset (Sou, Sod) at the end of that time period. The second time step produces three nodes and asset values (Sou2, Soud, Sod2); the third time step produces four nodes (Sou3, Sou2d, Soud2, Sod3); and so on until the n time produces n nodes. This process continues at each node until the end of the project time, resulting in a grid of asset values across all nodes (Sn).
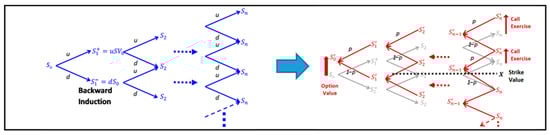
Figure 1.
Binomial lattice CRR model (Marques et al., 2021).
The last node at the end of the binomial tree represents the range of possible asset values at the conclusion of the option term, or the range of values of the underlying asset. The next step is to perform backward induction to determine the option’s value. This involves a recursive backward calculation from the final binomial node to the initial binomial node until the option’s starting value is obtained. This is performed by discounting the weighted average of potential future option values using risk-neutral probabilities. These asset values can be visualized as frequency histograms, where each histogram represents a possible asset value outcome. The height of each histogram corresponds to the frequency with which that outcome is generated across all possible paths within the binomial tree.
The total lattice time refers to the term of the option and can be represented by any number of lattice steps. While the range (minimum and maximum) of outcomes at the end of the lattice may not change significantly as the number of time steps increases, the number of possible outcomes grows exponentially, and their frequency distribution curves become smoother. The greater the number of time steps, the higher the level of precision, leading to increased accuracy in option pricing. The formula used in the Binomial Lattice is:
where u is the upward factor, d is the downward factor, and δt is the length of time at each step in the binomial tree. u and d represent the percentage change in coal prices in the upward and downward directions at each time step.
p is the risk-neutral probability. The risk-neutral probability is used to calculate the discounted expected future price. At each node, the price is calculated as follows:
As for backward induction, using the calculation with the formula:
Possible future decisions are modeled as formal call and put options, which have value and can be exercised by management. The asset value, determined using the real options methodology, is then given as the sum of two components: the present value of directly measurable cash flows and the flexibility value, which captures potential managerial opportunities in decision-making (real options). This can be formulated as follows:
Project Valuation in this study is divided into eight main steps, as depicted in Figure 2 above. The first step, Production Planning, is based on the South Pasopati Pit Mining Working Plan, annual production from mining scheduling simulation results, and operational technical calculations. The second step, Scenario Planning, involves determining the scenarios to be analyzed. Three scenarios are considered based on the coal chain route and logistics, Base Scenario, representing the East route (initial plan), Alternative 1 Scenario, representing the West route, Alternative 2 Scenario, an extension of the Base Scenario that incorporates carbon pricing into the company’s cash flow.
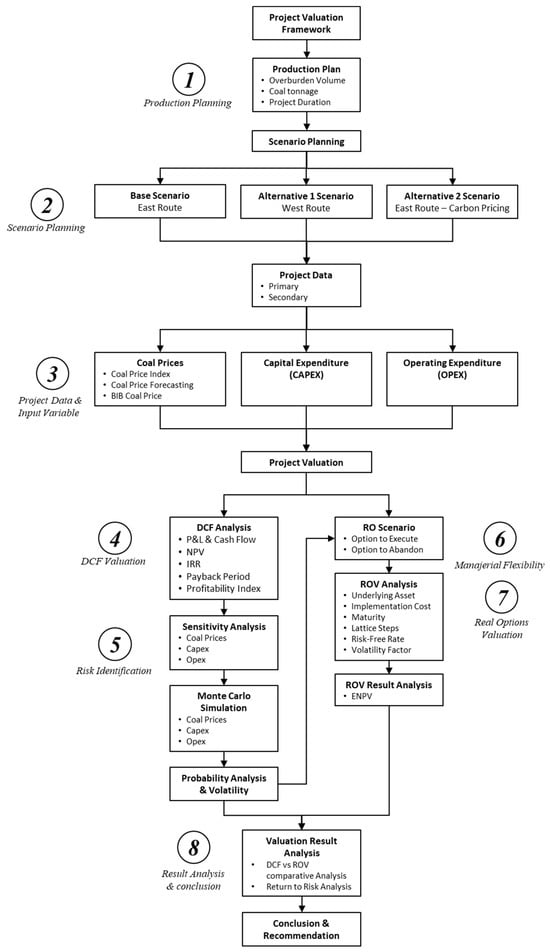
Figure 2.
Conceptual framework.
The third step involves projecting data and input variables, preparing primary and secondary data, and conducting analysis and initial basic calculations. These calculations include determining the base coal price and economic parameters for estimating capital costs (CAPEX) and operating costs (OPEX), which serve as input variables at the Project Valuation stage. The fourth step is the DCF valuation for the three scenarios. This step includes calculating the Profit and Loss statement and cash flow for each scenario to determine the NPV values based on specific discount rates, as well as the IRR, Payback Period, and Profitability Index. The fifth step focuses on risk identification across the three scenarios using Sensitivity Analysis to assess the impact of changes in key input parameters (such as coal prices, CAPEX, and OPEX) on NPV. This test determines the extent to which variations in input parameters influence project valuation. The process continues with MCS to generate a probabilistic distribution of key parameters and assess the volatility of asset values based on input variables.
The sixth step, Managerial Flexibility, is the added value of the ROV method, which provides management with the flexibility to make decisions. Operational execution options and operational cancelation options serve as the foundation for ROA. The seventh step, ROV, involves identifying and determining input parameters for Binomial Lattice modeling based on MCS. These parameters include underlying assets, implementation costs, volatility factors, risk-free rates, maturity periods, and salvage values. The binomial lattice tree is constructed by considering up and down factors. This process generates the Expected Net Present Value (ENPV) of the options and calculates the return-to-risk ratio to measure the level of return obtained from an investment relative to its associated risk. The eighth step, Result Analysis and Conclusion, involves analyzing project valuation results by comparing the NPV obtained from the DCF method with the ENPV derived from the ROV method. Additionally, the option values and return ratios for each scenario are analyzed. At this stage, the option values serve as a basis for management’s decision-making. The conclusions and recommendations from the comparison of options in the previous stage provide critical input for management’s final decision on the project.
The coal reserves of PT Borneo Indobara are generally low-calorie, with a value of 4200 kcal/kg (GAR). However, the South Pasopati prospect contains coal reserves of 1.7 million tons with different specifications, namely 6200 kcal/kg (GAR), contributing only 0.25% of the company’s total reserves. As a result, it is categorized as a valuable coal reserve (premium coal reserve) for the company but is not considered its main product. This study will analyze the South Pasopati reserves as a single-quality product. Technical complexity limits the production capacity to a maximum of 500 thousand tons per year, based on the maximum fleet capacity operated in the South Pasopati pit, ruling out the possibility of production expansion. At a maximum capacity of four fleets, the project duration is limited to four years.
Three scenarios were prepared in this study, based on the coal supply chain and logistics routes. The Base Scenario follows the eastern route, ending at Bunati Port, with a hauling distance of 42 km and a transshipment distance of 28 km. This represents the basic operation plan, where most of the infrastructure is directly owned by the company. The Alternative 1 Scenario involves a shorter western logistics route, ending at PT Pelindo Port, with a hauling distance of 40 km and a transshipment distance of 26 km. In this scenario, most of the infrastructure is owned by third parties. The Alternative 2 Scenario is an extension of the Base Scenario, incorporating carbon pricing policies to assess the impact of such policies on the company’s cash flow. The project’s basic valuation was conducted using the DCF method, applying a discount rate of 11.42% at a base coal price of USD 92.82 per ton. The initial investment required for the Base Scenario is USD 6.71 million (primarily for infrastructure). Alternative 1 Scenario requires USD 8.26 million, and Alternative 2 Scenario requires USD 7.29 million, which includes the costs associated with adopting emission-reducing technologies and infrastructure improvements.
The execution option will commence operations in 2026, with a duration of four years, while the abandonment option will yield a salvage value. ROV is used to assess these options, exploring various possibilities with different outcomes. The decision on project investment and implementation is fully determined before all stages are executed, ensuring that pre-mining and mining operations form a single phase. Consequently, the determination of real options (execution or abandonment) is entirely based on the final valuation conducted before the project begins.
3. Results
3.1. Production Planning
In this study, project valuation is conducted using the traditional DCF method and further developed using the ROV method. The production plan (Figure 3) is based on technical parameters related to the production capacity of heavy equipment, consisting of four fleets (PC1250 class) for overburden removal and two fleets (PC500 class) for coal extraction.
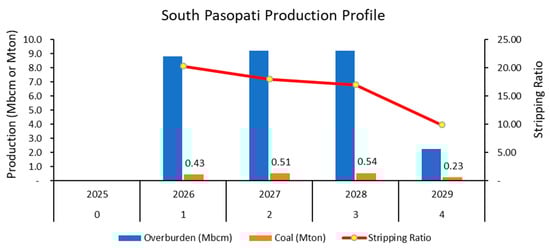
Figure 3.
Production plan profile.
3.2. Coal Price Projection
PT Borneo Indobara coal selling price is determined by the proportion of coal sales based on market destinations: Europe–East Asia (10%—Newcastle Index), China–India–Southeast Asia (65%—ICI Index), and Domestic (25%—HBA). The projection of future selling prices is calculated using historical coal prices (pre-COVID-19) through the Linear Regression Model, with the intercept points adjusted to align with the average coal price in 2024 (post-COVID-19 trend), as shown in Figure 4.
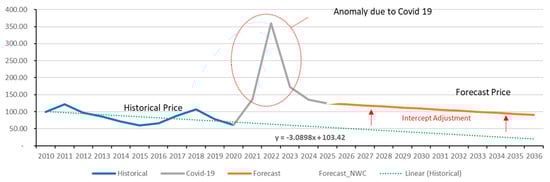
Figure 4.
Historical coal price and forecasting (in USD/ton).
The production cost structure in the basic scenario consists of capital expenditures that begin in the pre-mining phase (Y-0) and continue until the first year, with proportions as shown in Figure 5. Operating costs represent the largest expense associated with the production level.

Figure 5.
Production cost proportions (in million USD).
3.3. Discounted Cash Flow (DCF)
The cash flow model is derived from coal price projections, with an average price of USD 92.82/ton, generating revenue of USD 158.06 million. Operational costs account for 83–89% of total revenue across the three scenarios, necessitating good governance and operational efficiency to prevent profit margin erosion. Investment (CAPEX) is allocated as follows: USD 6.71 million for the Base Scenario, USD 8.26 million for alternative 1, and USD 7.29 million for alternative 2. These investments occur at the beginning of the project, primarily focusing on infrastructure development to support mining operations. In the Alternative 2 Scenario, additional investment is directed toward carbon emission reduction infrastructure. In the Base Scenario, the cumulative Net Cash Flow (NCF) is USD 12.04 million, indicating the project’s financial potential for profitability. The Alternative 1 Scenario yields an NCF of USD 9.16 million, while the Alternative 2 Scenario results in an NCF of USD 4.68 million. The NCF growth rate is slightly slower in the Alternative 2 Scenario (East Route—Carbon Tax) due to the additional capital and operating costs associated with carbon pricing (in the form of a carbon tax), which significantly impacts cash flow. Meanwhile, emission reduction incentives have not yet met the Net Zero Emission (NZE) threshold to generate carbon credits that could serve as an additional income source. A comparison of the Discounted Cash Flow (DCF) valuation for the three scenarios is presented in Figure 6.
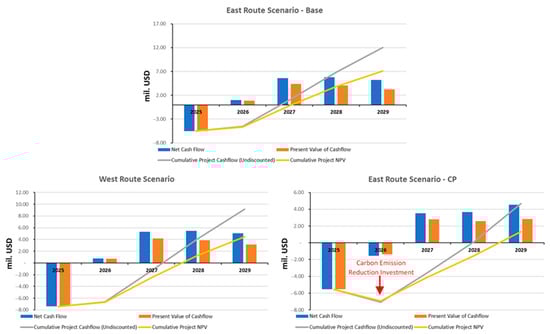
Figure 6.
Project valuation by DCF for 3 scenarios (in million USD).
The Cash Flow Projection is then discounted to determine the project’s current value. The discount rate is obtained by calculating the Weighted Average Cost of Capital (WACC). NPV of the Base Scenario project is USD 7.1 million; Alternative 1 Scenario is USD 4.47 million; and Alternative 2 Scenario is USD 1.32 million (as shown in Figure 6 above).
The coal price factor has the largest influence on valuation changes, followed by operating costs, with capital costs having a smaller effect. As shown in the sensitivity graph below (Figure 7), the project is highly dependent on coal price fluctuations. In the Base Scenario, a 20% decrease in coal prices results in a 72% reduction in NPV, and vice versa. Similarly, a 20% increase in operating costs leads to a 60% decrease in NPV, and vice versa.
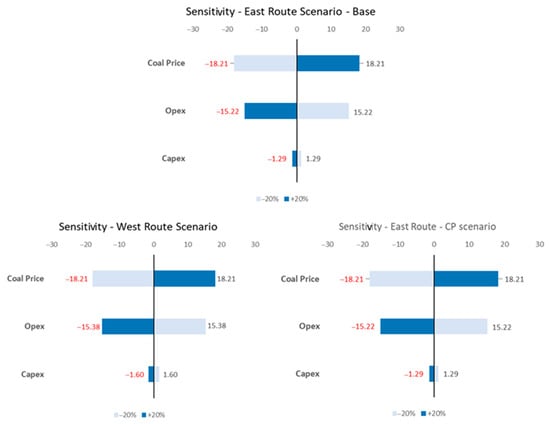
Figure 7.
Tornado diagram for DCF–NPV sensitivity analysis.
Further analysis was conducted to measure the uncertainty factor using an MCS to determine the probabilistic distribution of project valuation based on the three sensitive variables mentioned above (Figure 8). The simulation involved 10,000 iterations, with a base NPV of USD 7.10 million for the Base Scenario, resulting in an NPV range with an average (mean) of USD 7.19 million and a standard deviation of USD 13.3 million. The percentile table indicates that the worst-case scenario (10% percentile) would result in a negative value of USD 9.79 million, while the best-case scenario (90% percentile) could generate USD 24.16 million. Alternative 1 Scenario, with a base NPV of USD 4.47 million, the simulation produces an NPV range with an average of USD 4.49 million, a standard deviation of USD 0.94 million, a worst-case value of USD 3.22 million, and a best-case value of USD 6.22 million. Similarly, for Alternative 2 Scenario, the base NPV is USD 1.32 million, with a simulated NPV range averaging USD 1.24 million, a standard deviation of USD 1.09 million, a worst-case negative value of USD 0.11 million, and a best-case value of USD 2.83 million. The MCS also reveals that the volatility of the underlying asset value, based on the three input parameters, is 184.17% for the Base Scenario, indicating a very high level of volatility. In comparison, Alternative 1 Scenario exhibits a volatility of 30.07%, while Alternative 2 Scenario has a volatility of 86.77%.
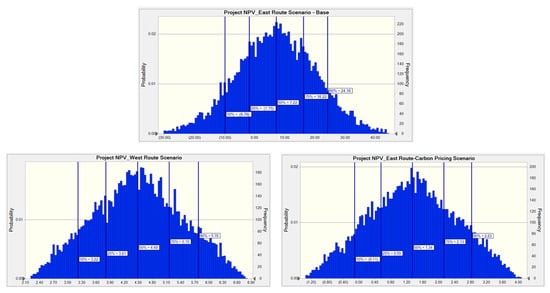
Figure 8.
Monte Carlo Simulation on three scenario NPV (in million USD).
3.4. Real Options Valuation (ROV)
Real Options Modeling assumes that data generated from the previous process is summarized in Table 1 below:

Table 1.
Project Assumption.
The choice of real options in this study is to either execute the project according to the initial plan (execute) or cancel the project (abandon). To determine the entry point for the real options, a trigger point is needed, which is reflected in the project’s NPV. The Execute Option in the Base Scenario is based on the average PV of the underlying asset, which is USD 14.55 million. The Abandon Option is characterized by the presence of a salvage value at a specific period or at the end of the project when termination occurs. The key determinant for this option is that the value of the option in real options must be equal to or less than the salvage value.
Binomial Lattice Modeling is used to calculate the option value and determine the decision point for execution or abandonment, as illustrated in Figure 9. The model shows that the execution option can be exercised immediately, as fluctuations in the input variables still result in a positive PV. Meanwhile, the abandon option reaches its entry point at step 4 (t = 4). If, under the worst conditions, the value continues to decline up to this point, any future increase or decrease will no longer have a positive impact (i.e., the salvage value will exceed the option value).
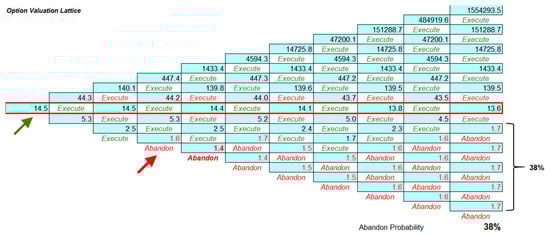
Figure 9.
Option Valuation Lattice (in million USD).
Using the Real Options Super Lattice software (2023 version), the binomial lattice model is built. In the Base Scenario, the NPV from the DCF-based approach is USD 7.10 million, and the option value from ROV is USD 0.95 million. Therefore, the Extended NPV (Formula (10)) for the Base Scenario is USD 8.05 million. Other scenarios can be seen in Figure 10 below.
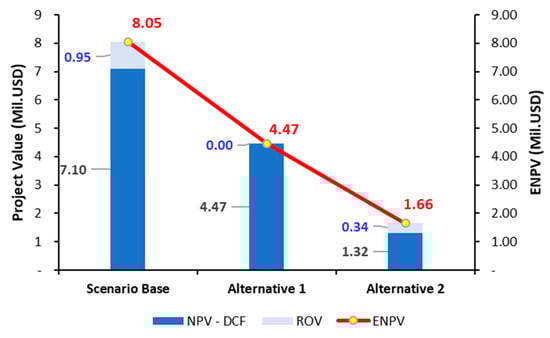
Figure 10.
Comparation of DCF and ROV for three scenarios (in million USD).
The sensitivity analysis determined the effect of project assumption variables as shown in the tornado diagram above (Figure 11), increase/decrease of 20% for each variable. The variables that affect the Option value are Underlying Asset, Salvage Value, Volatility, Risk-free Rate, Maturity, and Implementation Cost. The variables that have the greatest influence are underlying assets, Salvage value and volatility, the rest is having small or no influence. For Alternative 1 Scenario, the variable influences only the underlying asset and does not affect any other components.
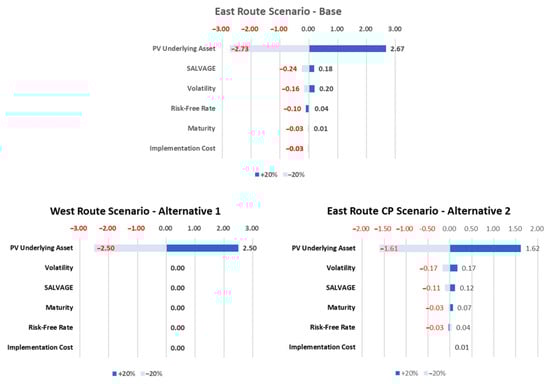
Figure 11.
Sensitivity analysis on options value.
MCS were again performed on the range of Underlying PV values to find the probability distribution resulting from the project assumptions (Figure 12).
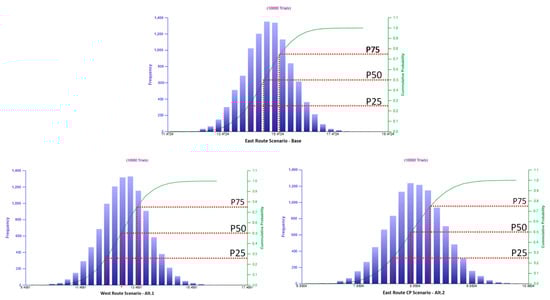
Figure 12.
MCS on underlying NPV across three Scenarios (in million USD).
While the relationship between CAPEX value and volatility is illustrated in Figure 13 below.
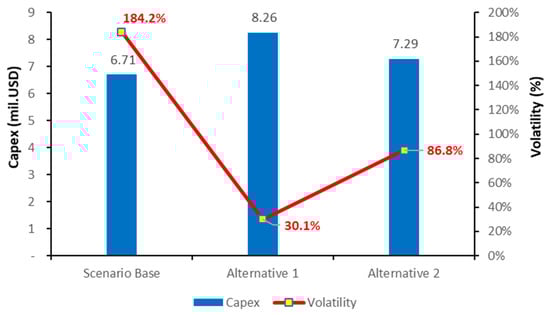
Figure 13.
Capex–volatility correlation for each scenario.
4. Discussion
From DCF methods, at a discount rate of 11.42%, the project remains feasible, as its NPV is still greater than the discount rate of 54% for the Base Scenario. The payback period of three years indicates that the project still provides benefits, with a Profitability Index (PI) of 1.06, demonstrating investment attractiveness, although it is relatively marginal in the Base Scenario. In contrast, Alternative 1 Scenario, despite having an Internal Rate of Return (IRR) of 33.7%, which is still quite ideal, has a lower PI. Meanwhile, Alternative 2 Scenario has a significantly lower IRR of 19.7%, indicating reduced investment attractiveness, supported by a PI of 0.54 and 0.18, suggesting that Alternative Scenario Projects 1 and 2 are not financially feasible.
However, some important considerations regarding this DCF valuation include the fact that certain risks have not been fully captured by this method, particularly the potential volatility of coal prices and the high proportion of operating costs relative to revenue. Significant changes in these factors (prices and operating expenses) will greatly impact the overall project valuation.
The probabilistic distribution analysis of the three scenarios shows that a higher CAPEX value narrows the project’s baseline value range and reduces the standard deviation (as seen in Alternative 1 Scenario), leading to lower volatility. The relationship between CAPEX value and volatility is illustrated in Figure 13 below.
Real Options Valuation for the Base Scenario yields a PV of the underlying asset of USD 14.55 million, which is greater than the investment value of USD 6.71 million. Additionally, the value of the real options remains higher than the implementation cost. Therefore, this option can be executed directly according to plan. In the Base Scenario, the probability of choosing the Abandon option is 38%. If management decides to cancel the project based on this probability level, the company will receive the salvage value of the investment, amounting to USD 1.68 million, and the coal reserve status will be reclassified under the coal resource category.
The MCS produces an average Real Options value of USD 14.55 million with a standard deviation of USD 1.33 million for the Base Scenario, resulting in a project ENPV of USD 8.05 million. The results of the MCS for the ROV of all scenarios are presented in Table 2 below.
Table 2.
Real Options value (in million USD).
5. Conclusions
The South Pasopati Project is a small-scale production project, high-rank coal specification, analyzed as a single product. The capital costs required are relatively low, accounting for only 5–7% of the total costs. Similarly, the coal price assumption used as the basis for revenue calculation has been adjusted to reflect the current price level (post-COVID-19) while considering the historical price trend pattern from the pre-COVID-19 period.
Valuation was conducted for three different operational scenarios: The East Route Scenario as the Base Scenario, the West Route Scenario as Alternative 1 Scenario, and the East Route Scenario as Alternative 2 Scenario, incorporating the application of Carbon Pricing. The analysis results indicate that the Base Scenario offers the highest profit potential, with an NPV of USD 7.10 million, an IRR of 54%, a payback period of three years, and a Profitability Index of 1.06 (meaning that every USD 1 invested will generate an additional value of USD 0.06 or 6%). The biggest challenge for this project is the high operational costs, which account for 83–89% of revenue, making the profit margin highly vulnerable to fluctuations in coal prices and operational expenses; a 20% decrease in coal prices, for instance, could reduce the NPV by up to 72%. This underscores the critical importance of strict financial governance to maintain profitability.
ROV analysis adds an element of project management flexibility to address uncertainty, and the ROV method provides additional adaptability in decision-making. The Execute Option in the Base Scenario is recommended because the project asset’s option value (PV) of USD 14.55 million exceeds the investment cost of USD 6.71 million. This is further supported by the results of the MCS, which shows an average NPV (mean) value of USD 7.19 million and a high volatility risk of 184.17%. The Abandon Option yields a salvage value of USD 1.68 million at the end of the operational shutdown period, with the consequence of losing coal reserves (changing status to coal resources). Although Alternative 2 Scenario provides environmental benefits through the implementation of a carbon emission reduction program, its feasibility is lower, with a DCF-NPV of USD 1.32 million and an IRR of 19.7%. This is primarily due to the additional cost burden of carbon pricing implementation, while emission reduction incentives remain insufficient to meet NZE limits to generate carbon credits that could contribute to revenue. In the Base Scenario, the Binomial Lattice and Backward Induction methods calculate a project option value of USD 0.95 million. This value, when combined with the basic NPV from DCF, results in an ENPV of USD 8.05 million.
Given the vulnerability of this project to fluctuations in coal prices and operating costs, it is crucial to mitigate future risks. Management should continue to monitor coal price fluctuations as a critical factor, seek long-term contracts at profitable prices, and focus on operational efficiency to minimize the impact of high operating costs, thereby preventing erosion of profit margins. In the face of market uncertainty, the option to cancel the project can be considered, while also considering the additional costs incurred and the project’s salvage value. Investing in carbon emission reduction technology can enhance the company’s image and ensure compliance with environmental regulations, although a thorough cost–benefit analysis is necessary. Maintaining managerial flexibility enables adaptation to changing market conditions, ensuring that the project not only delivers optimal benefits but also remains resilient in uncertain market dynamics while contributing to the commitment to environmental sustainability.
While this study primarily focused on financial feasibility using Discounted Cash Flow (DCF) and Real Options Valuation (ROV), the limitations of traditional methods were acknowledged in fully capturing market volatility and policy-driven uncertainties. The use of ROV provides a more dynamic evaluation by quantifying managerial flexibility and reflecting the real economic value of strategic decisions under uncertainty. The ROV approach offers a more robust alternative by incorporating flexibility, especially in scenarios with carbon pricing and operational uncertainties. This conclusion aligns with the evidence showing that the Expanded NPV (ENPV) under ROV consistently provides a more realistic measure of value under uncertain conditions.
Although the Base Scenario showed the highest financial return, this does not diminish the relevance of the ROV method. On the contrary, the volatility observed in alternative scenarios highlights the value of flexible investment strategies under market stress, which DCF alone cannot reflect.
Moreover, the study acknowledges the environmental impact of the coal project as a critical consideration in the valuation. Although financial analysis remains the core, the implementation of carbon pricing serves as a proxy to integrate environmental costs. Meanwhile, emission reduction incentives have not yet met the Net Zero Emission (NZE) threshold to generate carbon credits that could serve as a project revenue due to its short duration.
Future studies should focus on enhancing coal price projection accuracy. More advanced models, such as the Mean-Reverting Process or Geometric Brownian Motion, should be considered, as the Linear Regression model used in this study is insufficient for capturing drastic price fluctuations and external factors. Regarding Carbon Pricing Policy, a comprehensive financial model integrating DCF, ROV, and a Carbon-Adjusted Valuation framework is necessary to assess the impact of carbon regulations on profitability. Additionally, it should include more direct metrics such as carbon intensity, emission reduction potential, or lifecycle analysis to assess environmental trade-offs in greater detail. Risk simulations should not be limited to only three variables but should incorporate broader risks such as regulatory changes, geopolitics, labor, and operational challenges. While this study analyzes logistics and coal chain routes, future research should delve deeper into technical aspects, including logistics and supply chain costs and their influence on project feasibility. Currently focused on economic aspects with minimal technical insight, future studies should expand to include social and environmental impacts, aligning with sustainability principles. Furthermore, given the limitations of the DCF method in addressing market volatility and uncertainty, future research should emphasize the application of ROV in project valuation, particularly within Indonesia’s coal mining industry. Future studies are encouraged to adopt more advanced analytical tools, such as fuzzy and compound real options or multi-dimensional valuation frameworks that integrate environmental and regulatory risks. These approaches would help address the broader range of questions and scenarios raised in this study, offering deeper insights for investment decisions under uncertainty. These advancements will contribute to more accurate, comprehensive, and resilient valuation methodologies in the face of an evolving market.
Author Contributions
Conceptualization, D.F.H.; literature review, T.T.; methodology and study design, T.T.; calculation and analysis, T.T.; software, T.T.; writing and reviewing the article, D.F.H. All authors have read and agreed to the published version of the manuscript.
Funding
This research received no external funding.
Institutional Review Board Statement
Not applicable.
Informed Consent Statement
Not Applicable.
Data Availability Statement
The data presented in this study are available on request from the corresponding author due to privacy.
Conflicts of Interest
The author declares no conflicts of interest.
Abbreviations
The following abbreviations are used in this manuscript:
| NZE | Net Zero Emission |
| DCF | Discounted Cash Flow |
| WACC | Weighted Average Cost of Capital |
| Opex | Operational Expenditure |
| Capex | Capital Expenditure |
| GAR | Gros As Received |
| NCF | Net Cash Flow |
| IRR | Internal Rate of Return |
| PBP | Payback Period |
| PI | Profitability Index |
| ROV | Real Options Valuation |
| ROA | Real Options Analysis |
| MCS | Monte Carlo Simulation |
| BLM | Binomial Lattice Model |
| NPV | Net Present Value |
| ENPV | Expanded Net Present Value |
| CF | Cash Flow |
References
- Abbass, K., Qasim, M. Z., Song, H., Murshed, M., Mahmood, H., & Younis, I. (2022). A review of the global climate change impacts, adaptation, and sustainable mitigation measures. Environmental Science and Pollution Research, 29(28), 42539–42559. [Google Scholar] [CrossRef] [PubMed]
- Ajak, A. D., & Topal, E. (2015). Real option in action: An example of flexible decision making at a mine operational level. Resources Policy, 45, 109–120. [Google Scholar] [CrossRef]
- Alfeus, M., & Collins, J. (2023). A novel stochastic modeling framework for coal production and logistics through options pricing analysis. Financial Innovation, 9(1), 54. [Google Scholar] [CrossRef]
- Ardhiansyah, M. R. (2022). Combining economic, geological, and technical uncertainties in mining projects valuation using real options analysis. Available online: https://air.repo.nii.ac.jp/records/5801 (accessed on 9 August 2024).
- Aries, P. H. (2016). What drives international competitiveness? An empirical test in emerging Indonesian market. Journal of Competitiveness, 8(4), 124–139. [Google Scholar] [CrossRef][Green Version]
- Chandra, A., & Hartley, P. R. (2024). Sequential investment decisions for mining projects using compound multiple volatility real options approach. Resources Policy, 97, 105241. [Google Scholar] [CrossRef]
- Cronshaw, I. (2015). World Energy Outlook 2014 projections to 2040: Natural gas and coal trade, and the role of China. Australian Journal of Agricultural and Resource Economics, 59(4), 571–585. [Google Scholar] [CrossRef]
- Čulík, M., & Gurný, P. (2017). Assessing hard coal mining: An application with abandonment in the Czech Republic ’assessing hard coal mining: An application with abandonment in the. International Journal of Mining and Mineral Engineering, 8(3), 187–206. [Google Scholar] [CrossRef]
- Dobrowolski, Z., & Drozdowski, G. (2022). Does the net present value as a financial metric fit investment in green energy security? Energies, 15(1), 353. [Google Scholar] [CrossRef]
- Garnaut, R. (2015). Indonesia’s resources boom in international perspective: Policy dilemmas and options for continued strong growth. Bulletin of Indonesian Economic Studies, 51(2), 189–212. [Google Scholar] [CrossRef]
- Gollier, C. (2024). The cost-efficiency carbon pricing puzzle. Journal of Environmental Economics and Management, 128, 103062. [Google Scholar] [CrossRef]
- Guj, P., & Chandra, A. (2019). Comparing different real option valuation approaches as applied to a copper mine. Resources Policy, 61, 180–189. [Google Scholar] [CrossRef]
- Guo, Y., & Zhao, H. (2024). Volatility spillovers between oil and coal prices and its implications for energy portfolio management in China. International Review of Economics and Finance, 89, 446–457. [Google Scholar] [CrossRef]
- Gustino, R., Hakam, D. F., & Prasetio, E. A. (2025). Real options valuation for refinery and petrochemical investments: A feasibility study in Indonesia. Energy Reports, 13, 1321–1331. [Google Scholar] [CrossRef]
- Kamel, A., Elwageeh, M., Bonduà, S., & Elkarmoty, M. (2023). Evaluation of mining projects subjected to economic uncertainties using the Monte Carlo simulation and the binomial tree method: Case study in a phosphate mine in Egypt. Resources Policy, 80, 103266. [Google Scholar] [CrossRef]
- Kanugrahan, S. P., & Hakam, D. F. (2023). Long-term scenarios of indonesia power sector to achieve nationally determined contribution (NDC) 2060. Energies, 16(12), 4719. [Google Scholar] [CrossRef]
- Kim, K., Park, H., & Kim, H. (2017). Real options analysis for renewable energy investment decisions in developing countries. In Renewable and sustainable energy reviews (Vol. 75, pp. 918–926). Elsevier Ltd. [Google Scholar] [CrossRef]
- Kodukula, P., & Papudesu, C. (2006). Project valuation using real options a practitioner’s guide. J. Ross Publishing. [Google Scholar]
- Kurniawan, R., Trencher, G. P., Edianto, A. S., Setiawan, I. E., & Matsubae, K. (2020). Understanding the multi-faceted drivers of increasing coal consumption in Indonesia. Energies, 13(14), 3660. [Google Scholar] [CrossRef]
- Madadizadeh, A., Siddiqui, K., & Aliabadi, A. A. (2024). Review: The economics landscape for building decarbonization. Sustainability, 16(14), 6214. [Google Scholar] [CrossRef]
- Marques, N. L., de Lamare Bastian-Pinto, C., & Brandão, L. E. T. (2021). A tutorial for modeling real options lattices from project cash flows. Revista de Administracao Contemporanea, 25, e200093. [Google Scholar] [CrossRef]
- Mofijur, M., Fattah, I. M. R., Alam, M. A., Islam, A. B. M. S., Ong, H. C., Rahman, S. M. A., Najafi, G., Ahmed, S. F., Uddin, M. A., & Mahlia, T. M. I. (2021). Impact of COVID-19 on the social, economic, environmental and energy domains: Lessons learnt from a global pandemic. Sustainable Production and Consumption, 26, 343–359. [Google Scholar] [CrossRef]
- Mun, J. (2006). Real options analysis tools and techniques for valuing strategic investments and decisions (2nd ed.). John Wiley & Sons. [Google Scholar]
- Pang, Y., Chi, Y., & Tian, B. (2023). Economic evaluation of flexible transformation in coal-fired power plants with multi price links. Journal of Cleaner Production, 402, 136851. [Google Scholar] [CrossRef]
- Paradongan, H. T., Hakam, D. F., Wiryono, S. K., Prahastono, I., Aditya, I. A., Banjarnahor, K. M., Sinisuka, N. I., & Asekomeh, A. (2024). Techno-economic feasibility study of solar photovoltaic power plant using RETScreen to achieve Indonesia energy transition. Heliyon, 10(7), e27680. [Google Scholar] [CrossRef] [PubMed]
- Pawlak, M., & Wisniewski, T. (2024). The valuation of exit option in a lignite mine using Monte Carlo simulation. Journal of Sustainable Mining, 23(1), 40–54. [Google Scholar] [CrossRef]
- Pramana, P. A. A., Hakam, D. F., Tambunan, H. B., Tofani, K. M., & Mangunkusumo, K. G. H. (2024). How are consumer perspectives of PV rooftops and new business initiatives in Indonesia’s energy transition? Sustainability, 16(4), 1590. [Google Scholar] [CrossRef]
- Putra, J. J. H., Nabilla, N., & Jabanto, F. Y. (2021). Comparing “carbon tax” and “cap and trade” as mechanism to reduce emission in Indonesia. International Journal of Energy Economics and Policy, 11(5), 106–111. [Google Scholar] [CrossRef]
- Wang, C., Xu, G., Sun, C., Xu, J., Xu, K., Jiang, L., Wang, Y., Su, S., Hu, S., & Xiang, J. (2024). Modeling and forecasting of coal price based on influencing factors and time series. Journal of Cleaner Production, 467, 143030. [Google Scholar] [CrossRef]
- Wang, Q., Yang, X., & Li, R. (2022). The impact of the COVID-19 pandemic on the energy market—A comparative relationship between oil and coal. Energy Strategy Reviews, 39, 100761. [Google Scholar] [CrossRef]
- Wu, W., & Lin, B. (2020). Reducing overcapacity in China’s coal industry: A real option approach. Computational Economics, 55(4), 1073–1093. [Google Scholar] [CrossRef]
- Xiaojun, Y., & Hakam, D. F. (2024). Advanced financial and risk feasibility assessment of indonesia’s binary geothermal plant with carbon credit integration. International Journal of Energy Economics and Policy, 14(6), 230–245. [Google Scholar] [CrossRef]
- Yang, W., Fang, N., Wang, Y., Long, T., Deng, S., Xue, M., & Deng, B. (2022). Value evaluation of mining right based on fuzzy real options. Resources Policy, 78, 102818. [Google Scholar] [CrossRef]
- Zapf, M., Pengg, H., & Weindl, C. (2019). How to comply with the Paris agreement temperature goal: Global carbon pricing according to carbon budgets. Energies, 14(15), 2983. [Google Scholar] [CrossRef]
Disclaimer/Publisher’s Note: The statements, opinions and data contained in all publications are solely those of the individual author(s) and contributor(s) and not of MDPI and/or the editor(s). MDPI and/or the editor(s) disclaim responsibility for any injury to people or property resulting from any ideas, methods, instructions or products referred to in the content. |
© 2025 by the authors. Licensee MDPI, Basel, Switzerland. This article is an open access article distributed under the terms and conditions of the Creative Commons Attribution (CC BY) license (https://creativecommons.org/licenses/by/4.0/).