1. Introduction
Economic capital is the optimal capital requirement needed to cover borrowers’ losses related to their credit default payment. However, regulatory capital plays the same role as economic capital but it is imposed by regulatory authorities. In addition, economic capital takes into account more factors than regulatory capital, as the systematic risk measures the contagion effect between borrowers in terms of default payment. To this end, in 2009, the Basel Committee introduced a new derivation of regulatory capital based on the systematic risk sensitivity called the regulatory correlation. However, does the Basel regulatory capital converge well with the economic capital? Additionally, is the regulatory risk sensitivity responding to the economic risk sensitivity? To this end, we are trying to simulate optimal capital and economic systematic risk and compare them with regulatory risk.
When the Basel Committee introduced the norm of capital requirement for credit risk coverage, a broad discussion started about its effectiveness in its role, as played by economic capital. In fact, effective regulatory capital is economic capital that considers the entire bank’s internal and external factors to cover real credit risk. The bank itself determines the economic capital requirement, so it knows the real funds needed to hedge its own risk. However, supervisory authorities set another approach to determine the uniform capital requirement for all banks (
Barakova and Plavia 2014). At this level, there is a dilemma that arises at the convergence of regulatory and regulatory capital requirements. Many factors can cause this divergence between these two capital requirements. The main factors discussed in the literature are the sensitivity to systematic risk and the capital cost.
The relationship between sensitivity to systematic risk and borrower’s probability has received a great deal of attention.
Lang et al. (
2008) showed that regulatory capital derivative sensitivity is positive, indicating that the more defaulters depend on each other, the greater and more significant the losses. Therefore, the bank will require more regulatory capital to cover these losses.
Theoretically, the default probability has a positive relationship with the sensitivity to economic systematic risk and a negative relationship with the sensitivity to regulatory systematic risk. This last contribution can be explained by the cyclical effect of a crisis on the capital requirement of banks.
Gordy (
2000) showed that to avoid cyclically between economic state and contagion effect of borrowers, the Basel Committee established a negative relationship between the sensitivity of systematic risk and default probability.
Many studies have pointed out the impact of systematic risk on default borrowers.
Lee et al. (
2021) investigated the effect of systematic risk on the borrowers’ class notation of a set of US-securitized loans. They showed that systematic risk is decomposed into general systemic risk and specific systematic risk. On the other hand, systematic risk sensitivity is important in the lower notation class and less so in the higher class.
Thus, in a crisis period, the negative relationship leads to a cushioning of the increase in regulatory capital requirements to avoid the cyclicity effect during stress periods and in growth periods, leading to the cushioning of its decrease. On the other hand, the Basel Committee posited this negative relationship because small businesses are generally poorly rated to avoid penalising them on accessing credit; a negative change in economic conditions will have less effect on their default probabilities.
The relationship between crisis and systematic risk has been studied by
Rizwan et al. (
2022). They measured the systematic risk of Islamic banks in the dual system using the spillover index. They showed that Islamic banks had fewer spillovers during the COVID-19 crisis and they did not have any abnormal returns compared to conventional banks.
However, in the set of external and common factors is systematic risk. Each borrower can be influenced by their owner’s behaviours. Therefore, this last is the borrower’s contagion factor that indicates the sensitivity to systematic risk. In this sense, more contagion effect requires more capital to cover borrowers’ real failure-based losses (
Dietsch and Petey 2004).
On the other hand,
Naili and Lahrichi (
2022) found that failure banks, using data from 53 banks listed in five Middle East and North African (MENA region) countries including Morocco, Tunisia, Egypt, Jordan, and Turkey, depend on systematic factors rather than specific ones. The main systematic factors are sovereign debt, inflation, GDP growth, and unemployment. These authors proved that the identification of systematic risk factors helps regulators to minimise the borrower’s default and contagion effect.
Capital costs play an important role in the divergence between regulatory and economic capital.
Lang et al. (
2008) and
Ellizalde and Repullo (
2007) showed that the difference between economic capital and regulatory capital is arbitrated by the bank’s capital cost. If the required regulatory capital is less than the economic capital, the bank takes advantage of the surplus arising from the difference between economic capital and regulatory capital and invests it in risky projects. However, if the required regulatory capital is higher than the economic capital, the bank has to issue more capital. Systematically, an increase in capital cost leads to bank managers cutting down their credit-taking risk or taking more risk to compensate the fund used as regulatory.
The quantitative difference between regulatory capital and economic capital has been measured by
Gassouma and Rajhi (
2011). These authors measured the rate of capital devoted to cover credit risk using the regulatory approach and an economic approach. They examined this difference and they found that Tunisian banks devoted a large amount of capital to cover real borrower failure, and hence an opportunity cost arises. This can be explained because regulatory capital exceeds economic capital.
In addition, a comparative analysis was tested by
Lan Le et al. (
2023) on a sample of the largest UK and Australian banks from 2000 to 2019, in terms of divergence between regulatory capital and economic capital. They found that these economic ratios are broadly in line with the regulatory capital levels of both Australian and British banks. This regulatory expectation of the performance deterioration of British banks was contrary to those of Australian banks.
The systematic risk sensitivity shows the contagion effect of borrowers in the same bank. For this aim,
Biswas and Gomez (
2018) pointed out that the contagion effect between banks can be observed when banks lend to the same borrowers of these banks. This last contagion is the systematic risk sensitivity of banks that is caused by these borrowers.
The capital requirement foundation is based on conditional probability, which depends on specific and systematic factors.
Koyluoglu and Hickman (
1998) generated the foundation of economic or regulatory capital and then developed it using a Credit Suisse financial product, Basel Committee, and
Dietsch and Petey (
2004). We are taking the economic approach of
Lee et al. (
2011), who introduced a model based on conditional probability to a single factor. They assumed that only a common external factor could affect all borrower behaviours. We are focusing mainly on the role of systematic risk sensitivity.
The relationship between debt maturity and systematic risk sensitivity has been reviewed by the Basel Committee on the regulatory capital requirement, which has been adjusted by debt maturities. In the same context,
Chen et al. (
2020) recently demonstrated that systematic risk sensitivity improves with debt maturity. Therefore, borrowers that have a long debt are more sensitive to credit risk.
The systematic sensitivity risk is influenced by economic policy uncertainty. In fact,
Yfanti et al. (
2023) showed that both financial and health crises amplify the correlation between default risks, leading to contagion effects and financial instability.
Giammarino and Barrieu (
2009) pointed out that the credit contagion effect is more intense during a market crisis.
On the other hand, systematic risk sensitivity is affected by shareholding mechanisms.
Li and Sun (
2023) demonstrated, using a KMV approach, that the controlling shareholder’s credit risk is contagious to the firms.
In terms of credit Islamic banking, there is an empirical investigation that studied the Islamic systematic risk:
Mseddi (
2022) showed that sukuk securitization has a positive impact on the systematic risk of originator companies of sukuk. In addition, after the announcement of sukuk selling, the risk is immediately transferred from originators to holders, because the holder in Islamic finance is a real investor in a good market and service.
Our contribution in this paper is to derive, on the one hand, an economic capital requirement, which responds better to the contagion effect of the borrower’s default. This last factor measures the systematic risk sensitivity between borrowers. We will propose the Monte Carlo simulation as an approach to measure the systematic sensitivity and will obtain a simulated economic capital that can prove to be better than the real context of borrowers.
Our main aim is to appreciate if the regulatory capital based on the regulatory sensitivity risk, as imposed by the Basel settlement banks, converges to an economic sensitivity risk based on systematic sensitivity risk, as simulated by the Monte Carlo method.
We are introducing the derivation from economic to regulatory capital, which is based on conditional probability depending on the sensitivity to systematic risk. This last has been through many economic approaches, such as the Monte Carlo simulation and market approach. It can be the main factor of divergence between the two capitals.
Therefore, we ask the following main question as a problem for this paper:
Can the Basel Committee succeed to have a regulatory capital near the economic capital, for better hedging of credit losses?
The following two hypotheses must be tested to answer the above question:
- ✓
Regulatory Capital does not converge to Economic Capital;
- ✓
The divergence between regulatory and economic capital is due to the divergence of systematic risk sensitivity between the regulatory and simulated approaches.
This paper will be organized as follows:
Section 2 will discuss both the theoretical and empirical mathematical derivation of capital requirements and the sensitivity to systematic risk in Tunisian banks. Then, we deduce from the literature, the effect on the credit risk of divergence between these two approaches.
Section 3 discusses the main result of this study, and to close, we offer the conclusion.
2. Data and Methodology: Theoretical Derivation and Application
In this section, we attempt to stimulate the economy and measure the regulatory capital of a sample of Tunisian banking borrowers. The simulation consists of a portfolio of bank credits granted to customers of a Tunisian bank. We collected data on 100 individual borrowers from the bank’s financing and litigation services through an investigation of a set of customer credit files. We have elaborated a database containing the financial information of each borrower. We have supposed that when a borrower makes more than five late payments or is declared a defaulting borrower, they are considered a defaulting customer. To avoid the result distortion between the two categories of borrowers, we have shown two equal groups: creditworthy (50) and defaulting (50). We used a set of variables to describe the borrower’s solvency situation.
One step to simulate these capital requirements is the construction of the default probability series for each borrower in the sample. Through this data, we determine the distribution of losses and choose a quantile corresponding to an acceptance threshold of these probable losses. This quantile, measured by the value at risk, is the total loan losses. The expected loss is the mean of loss. Consequently, the unexpected loss is the difference between these last losses; it is the capital requirement for credit risk. In our case, we take the single-factor model that depends on the default probability and the systematic risk sensitivity modelled below.
In fact, there are two types of default probabilities: nonconditional probabilities (DP) and conditional probabilities (Pr (x)). The first probability focuses only on the internal factors specific to each borrower that leads to a specific risk. The second also takes into account the internal and external factors that affect all borrowers included in the model. These external factors are common for all borrowers and are called systematic risks. The conditional probabilities report two types of risk: systematic risk and specific risk (
Koyluoglu and Hickman 1998).
On the other hand, conditional default probability depends on systematic risk sensitivity and default probability. The quantile of total losses corresponding to a threshold acceptance by banks as a maximum loss is derived by conditional probability depending on systematic risk sensitivity and default probability.
2.1. Default Probability
To this end, we are considering logistical regression as the main method to compute individual default probabilities for the scoring borrowers. The model chosen in this study is more relevant and is known for its simplicity (
Gassouma and Rajhi 2013;
Gassouma 2006). The function assigns a default score to any borrower by codifying the borrower’s status. For a creditworthy customer, the assigned rating is zero (0). For a defaulting borrower, the score assigned is one (1).
The scoring model Is as follows:
where the dependent variable
(DEF) indicates the default status measured by a dummy variable that is one if the borrower has made a default repayment and zero otherwise. This dummy variable depends on a vector of a specific factor. By referring to the works of
Georges et al. (
1996), the vector of a specific factor is composed of social and financial factors. For social factors, we can find the age
(AGE) of borrowers expressed in years. The age of the borrower can indicate the stability and maturity of the borrower, which can have a positive effect on solvability. On the other hand, the civil status
(CS) can affect the repayment capacity of the borrower. This last is a qualitative variable that takes the value of one (1) if the borrower is single and two (2) if married. A borrower’s profession (PRO) can play an important role in solvability; a public profession is more of a profession that guarantees credit repayment. This variable takes the value of one (1) if the profession is public, two (2) if the profession is private, three (3) if the profession is liberal, and four (4) if the borrower is retired. Social status can also be demonstrated by the bank relationship
(RLB), which is the period that the customer has held an account with the bank. The other commitments
(COM) can depreciate the solvency quality of a borrower if they have another commitment (discovered another credit, etc.). It takes the value of one (1) if the borrower has no other commitment and two (2) if they have another commitment.
The financial factors depend on the borrower’s financial status, such as their annual income. Therefore, the principal factor is repayment capacity (RC), which denotes all of the deductions made from the borrower’s salary: deductions/total salary. Generally, Tunisian banks grant credit to a customer when their RC is higher than 45%. In the sense that credit granted to a customer is characterised by the interest rate (IR), which is the lending rate charged by the bank to the borrower for the credit granted (MMR + margin), by the type (CRT), which takes the value of one (1) if the credit is a direct credit A MT-type, two (2) if the credit is a real estate-type, and three (3) if it is intended for the purchase of cars. The repayment period (RP) is from granting the credit until its payment and the amount of outstanding credit (ACR).
This is a statistical description of the variables that will be imputed into the score model in
Table 1:
The model is estimated using the maximum likelihood method. The result is summarized in
Table 2:
The scoring model is globally significant regarding the chi-square test, which shows a value of 191.2, with a probability equal to 0.005. However, all of the variables imputed in this model are significant too, which is shown by the likelihood ratio test.
By applying this model to the 100 borrowers, we obtain the 100 scores for each borrower. Knowing that the score is equal to , where DP is the default probability, thus .
The series of the default probability for each borrower is summarized in
Figure 1:
We can conclude that 70% of the borrowers present a default probability lower than 50%. In contrast, 30% have a default probability higher than 50%. This result leads Tunisian banks to devote a capital requirement to cover this credit risk.
2.2. Systematic Risk Sensitivity
This is the most important part of the paper, as we are trying to derive the conditional default probability that depends on the systematic and specific risk of the borrower. We can deduce the economic and regulatory capital requirement through this default conditional probability. Our model is based on the model of the single factor, as adopted by (
Lee et al. 2011).
Several studies have examined conditional default probabilities of which we mention JP Morgan’s Metrix Credit. This study underestimated the potential losses; the real distribution of funds is asymmetrical and has a thicker tail distribution than the normal distribution. The reason for underestimating the worst losses relates to not considering the exogenous factors reflecting systematic risk. Hence, the Basel international settlement 2005 then 2010 introduced the systematic factor in the conditional probability in the “single-factor model”.
A borrower makes a default payment if the value of their loan
Ui is less than a threshold value
u. Therefore, the conditional probability of their default payment
P(x), taking into account a single systematic factor
x, will have, as an expression:
where
is the centred and reduced normal distribution function, and
is the centred and reduced reciprocal normal distribution function.
Therefore, this conditional default probability
depends on three factors: default probability
, systematic risk noted by
x, and specific risk noted by
ε, with
w being the sensitivity to systematic risk showing the default contagion effect of one borrower on another. This probability can give a loss distribution maximum and is asymmetric (
Lee et al. 2011).
The measure of economic sensitivity to systematic risk
w has been the subject of several studies:
Dietsch and Petey (
2004) developed an approach based on the correlation between a borrower’s assets;
Bystrôm et al. (
2005) followed a deductive approach, calculating the default distance using the Merton model and then deducting the sensitivities of the systematic factors in relation to default distance;
Düllmann and Scheule (
2003) and
Dietsch and Petey (
2008) used the default transition probabilities matrices of borrowers;
Düllmann et al. (
2007),
La Porta et al. (
2002), calculated the correlation between the returns of listed and unlisted shares of borrowers; and
Clauβen et al. (
2017) adopted the approach of
Musto and Souleles (
2006) by estimating the sensitivity to systematic risk by the CAPM-Beta model. They concluded that the borrower’s systematic risk has been priced better beyond idiosyncratic factors and that it increases in crisis periods.
Liu et al. (
2022) measured the systematic risk by research based on a knowledge map, using a set of factors such as macro-prudence literature, financial risks, financial supervision, internet finance, supply-side reform, and the real economy.
Our approach is to simulate the systematic risk sensitivity (w) with a Monte Carlo approach starting from a conditional probability default that depends on default probability DP: .
Under the assumption that there is one systematic risk factor and that the overall loan U is a linear function of two types of risk, i.e., systematic risk x and specific risk ε that follow a centred and a reduced normal distribution, where ..
As adopted by
Targino et al. (
2015), the first step after determining the different probabilities of a borrower’s
DP is to simulate several values of sensitivity to systematic risk
w (1000 replications in our case) for the 100 borrowers. In fact, the number of replications is provided from the empirical works of
Lee et al. (
2011) and
Dietsch and Petey (
2008). The more frequently the replication number is higher, the more pertinent the default probability. To find the 100-default probability and systematic risk sensitivity for each borrower, we make the average the mean of 1000 values, as obtained for each borrower.
Eventually, we obtain a series of p(x) for each of these values. We work with the latter formula and then proceed to arrange them in ascending order, the simulated losses forming a function of the loss distribution.
On the other hand, the Basel Committee present the same mathematical foundation of capital requirement based on the same conditional probability model named by a single-factor model as the fundamental model of its regulatory capital.
In our case, all borrowers are retail borrowers composed of individuals admitting a turnover (S) of less than five million euros and an outstanding credit of less than one million euros. Therefore, the sensitivity is .
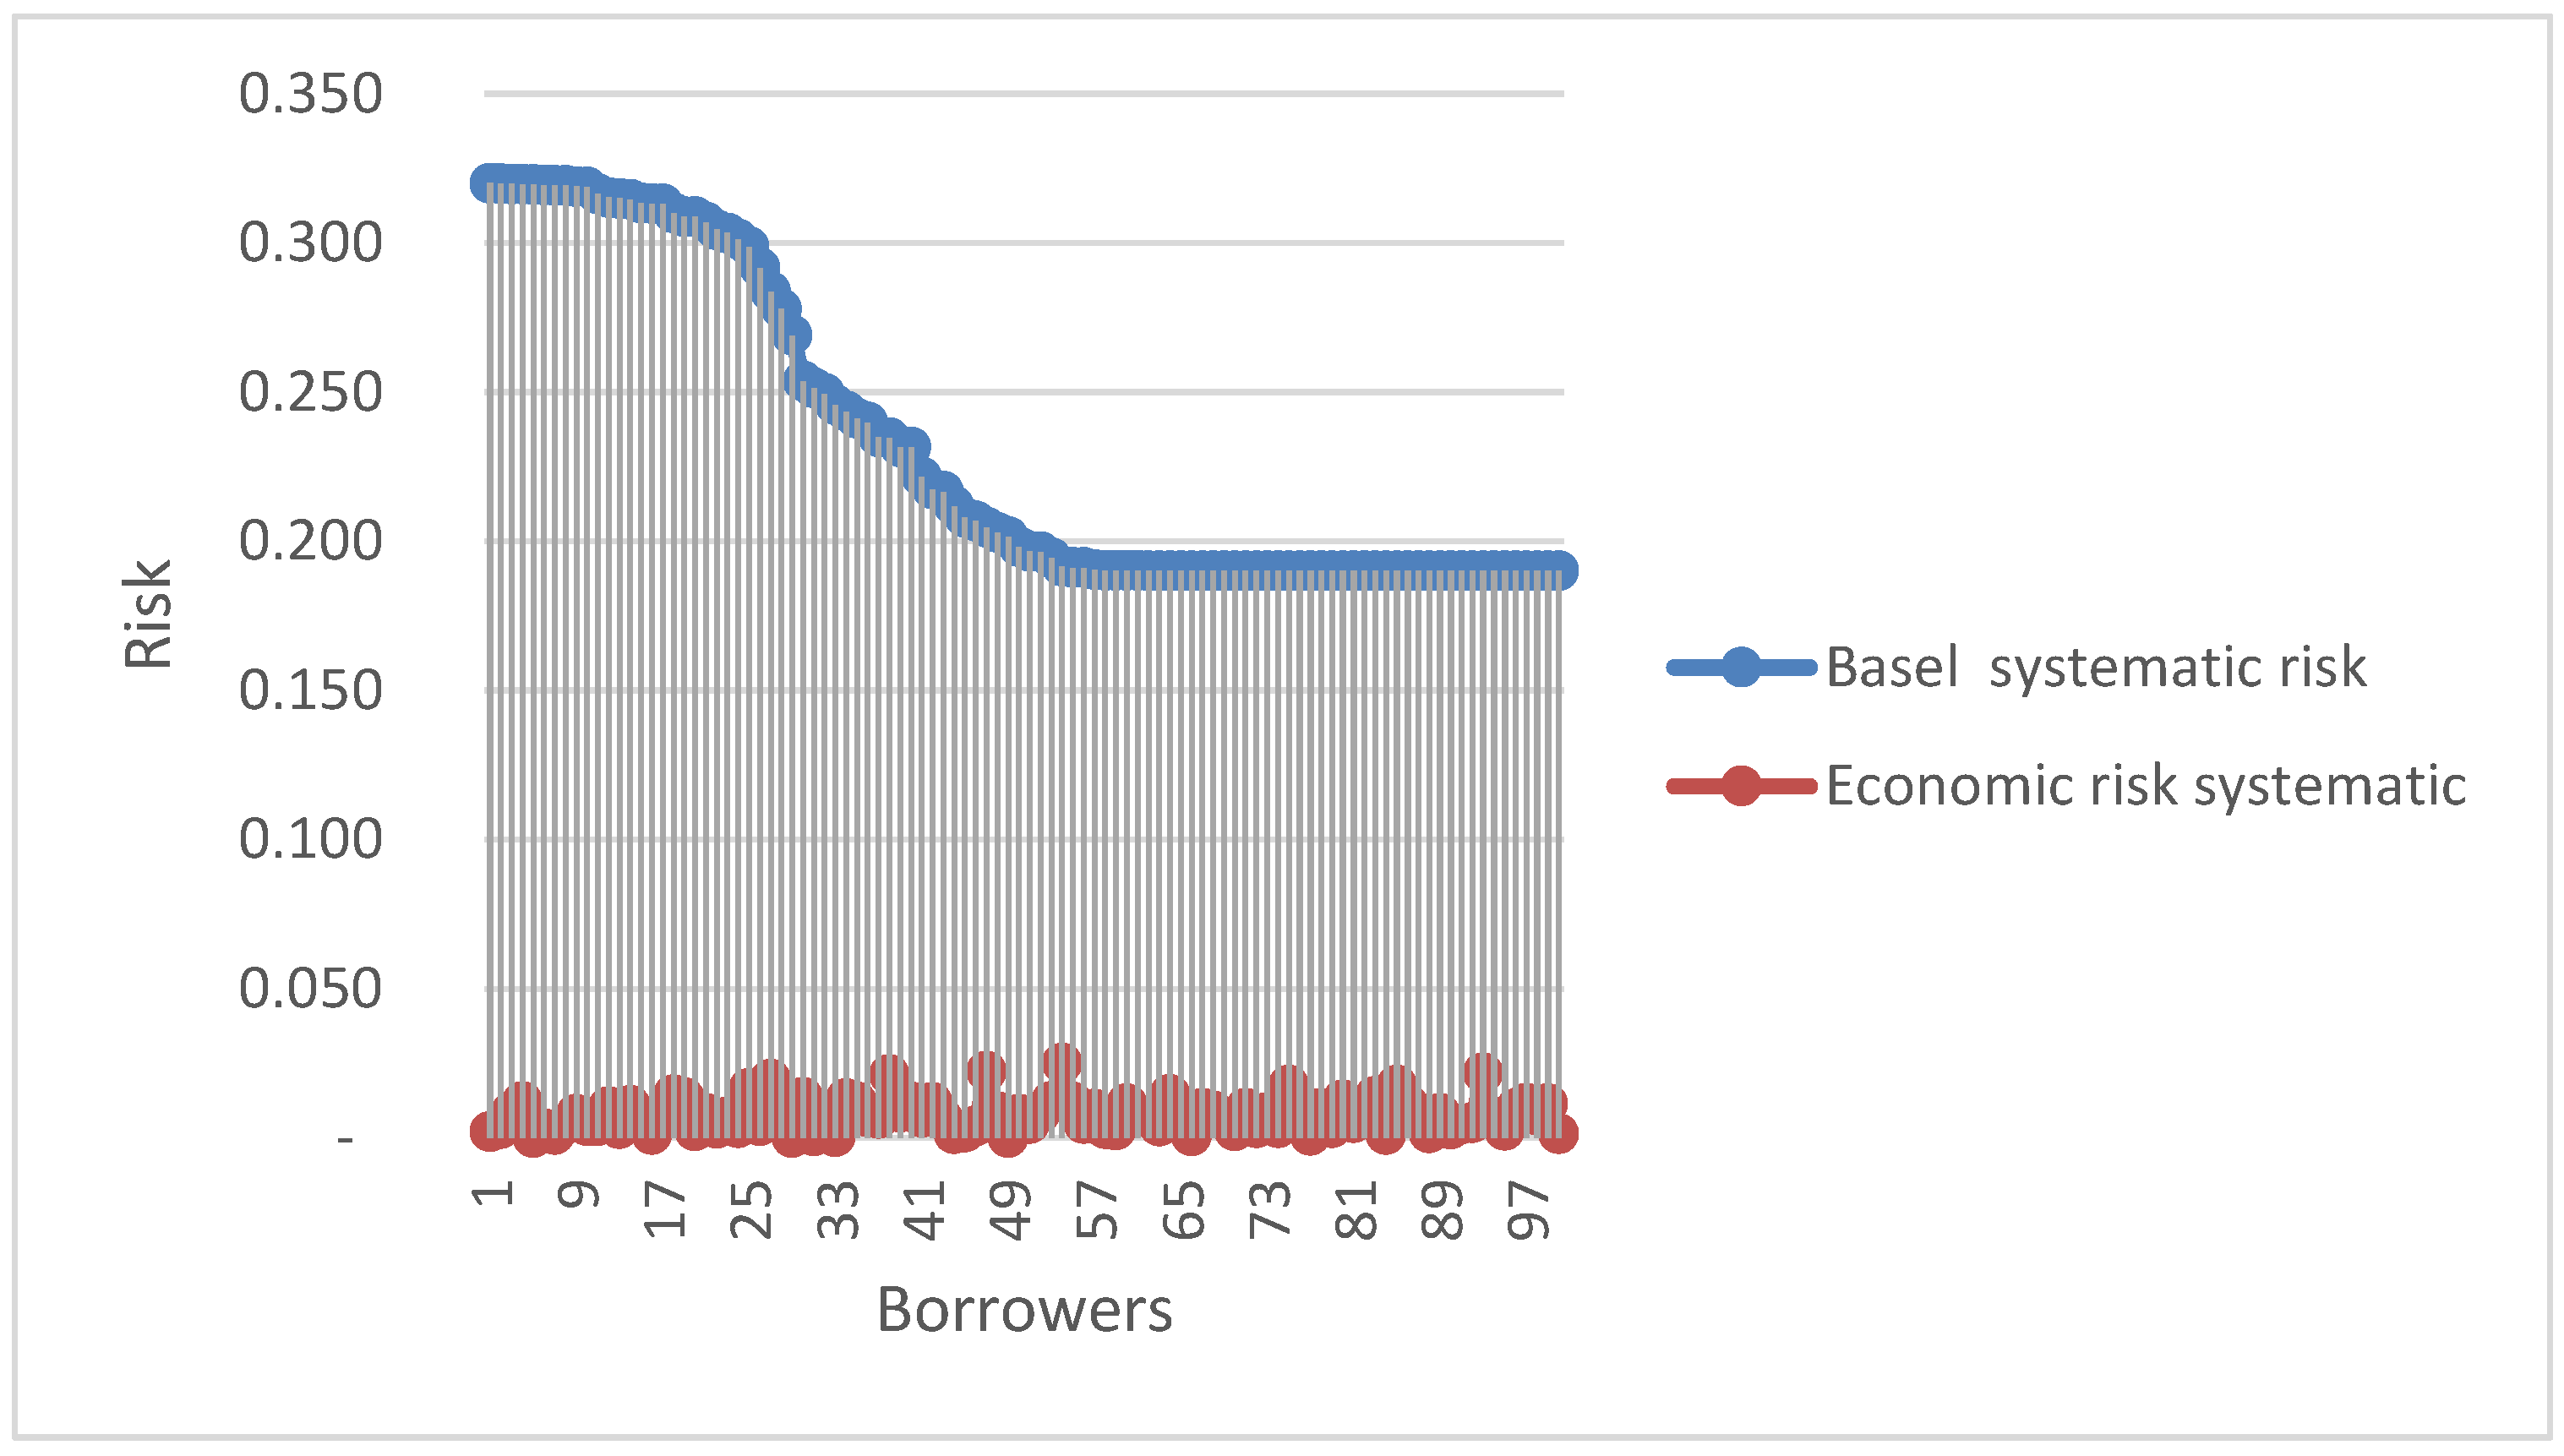
This list of 100 economic and regulatory sensitivities to the systematic risk of the 100 borrowers of Tunisian banks is presented in
Figure 2:
2.3. Modelling of Capital Requirement: From Economic to Regulatory
The model derives the quantile of a conditional probability that can indicate the maximum loss that a bank can accept. On the other hand, banks must devote the percentage of exposure at default as a capital requirement.
Theoretically, economic capital is the amount of capital used to cover unexpected losses on credit portfolios (exposure at default). Unexpected loss is the difference between the maximum loss measured by conditional probability that the bank may accept as referenced to a predetermined threshold, and the expected loss measured by average default probability . This measure can be an approximation of the value at risk.
However, a unique systematic risk factor x exists in a conditional probability, and it can take an infinite number of values. Taking into account the fact that systematic risk follows a centred and reduced normal distribution, the acceptance threshold of the systematic risk factor is given by
1. This amounts to rewriting
. Replacing the systematic risk by its function in the conditional probability, we obtain the maximum loss on a credit portfolio that a bank can accept and which does not exceed q% of cases. We choose, in our model, a quantile equal to 99.9% to cover credit risk losses. The quantile value is issued from the Basel banking settlement.
The capital requirement is the difference between maximum loss and expected loss measured by default probability considered by the loss-given default
(LGD)2 and adjusted by a maturity coefficient. In our work, we will neglect this adjustment to be able to appreciate the effect of systematic risk on the capital buffer in an economic or regulatory approach, and we are expressing economic and regulatory capital as a percentage of exposure at default (
EAD)
3. Therefore, the capital requirement takes this expression:
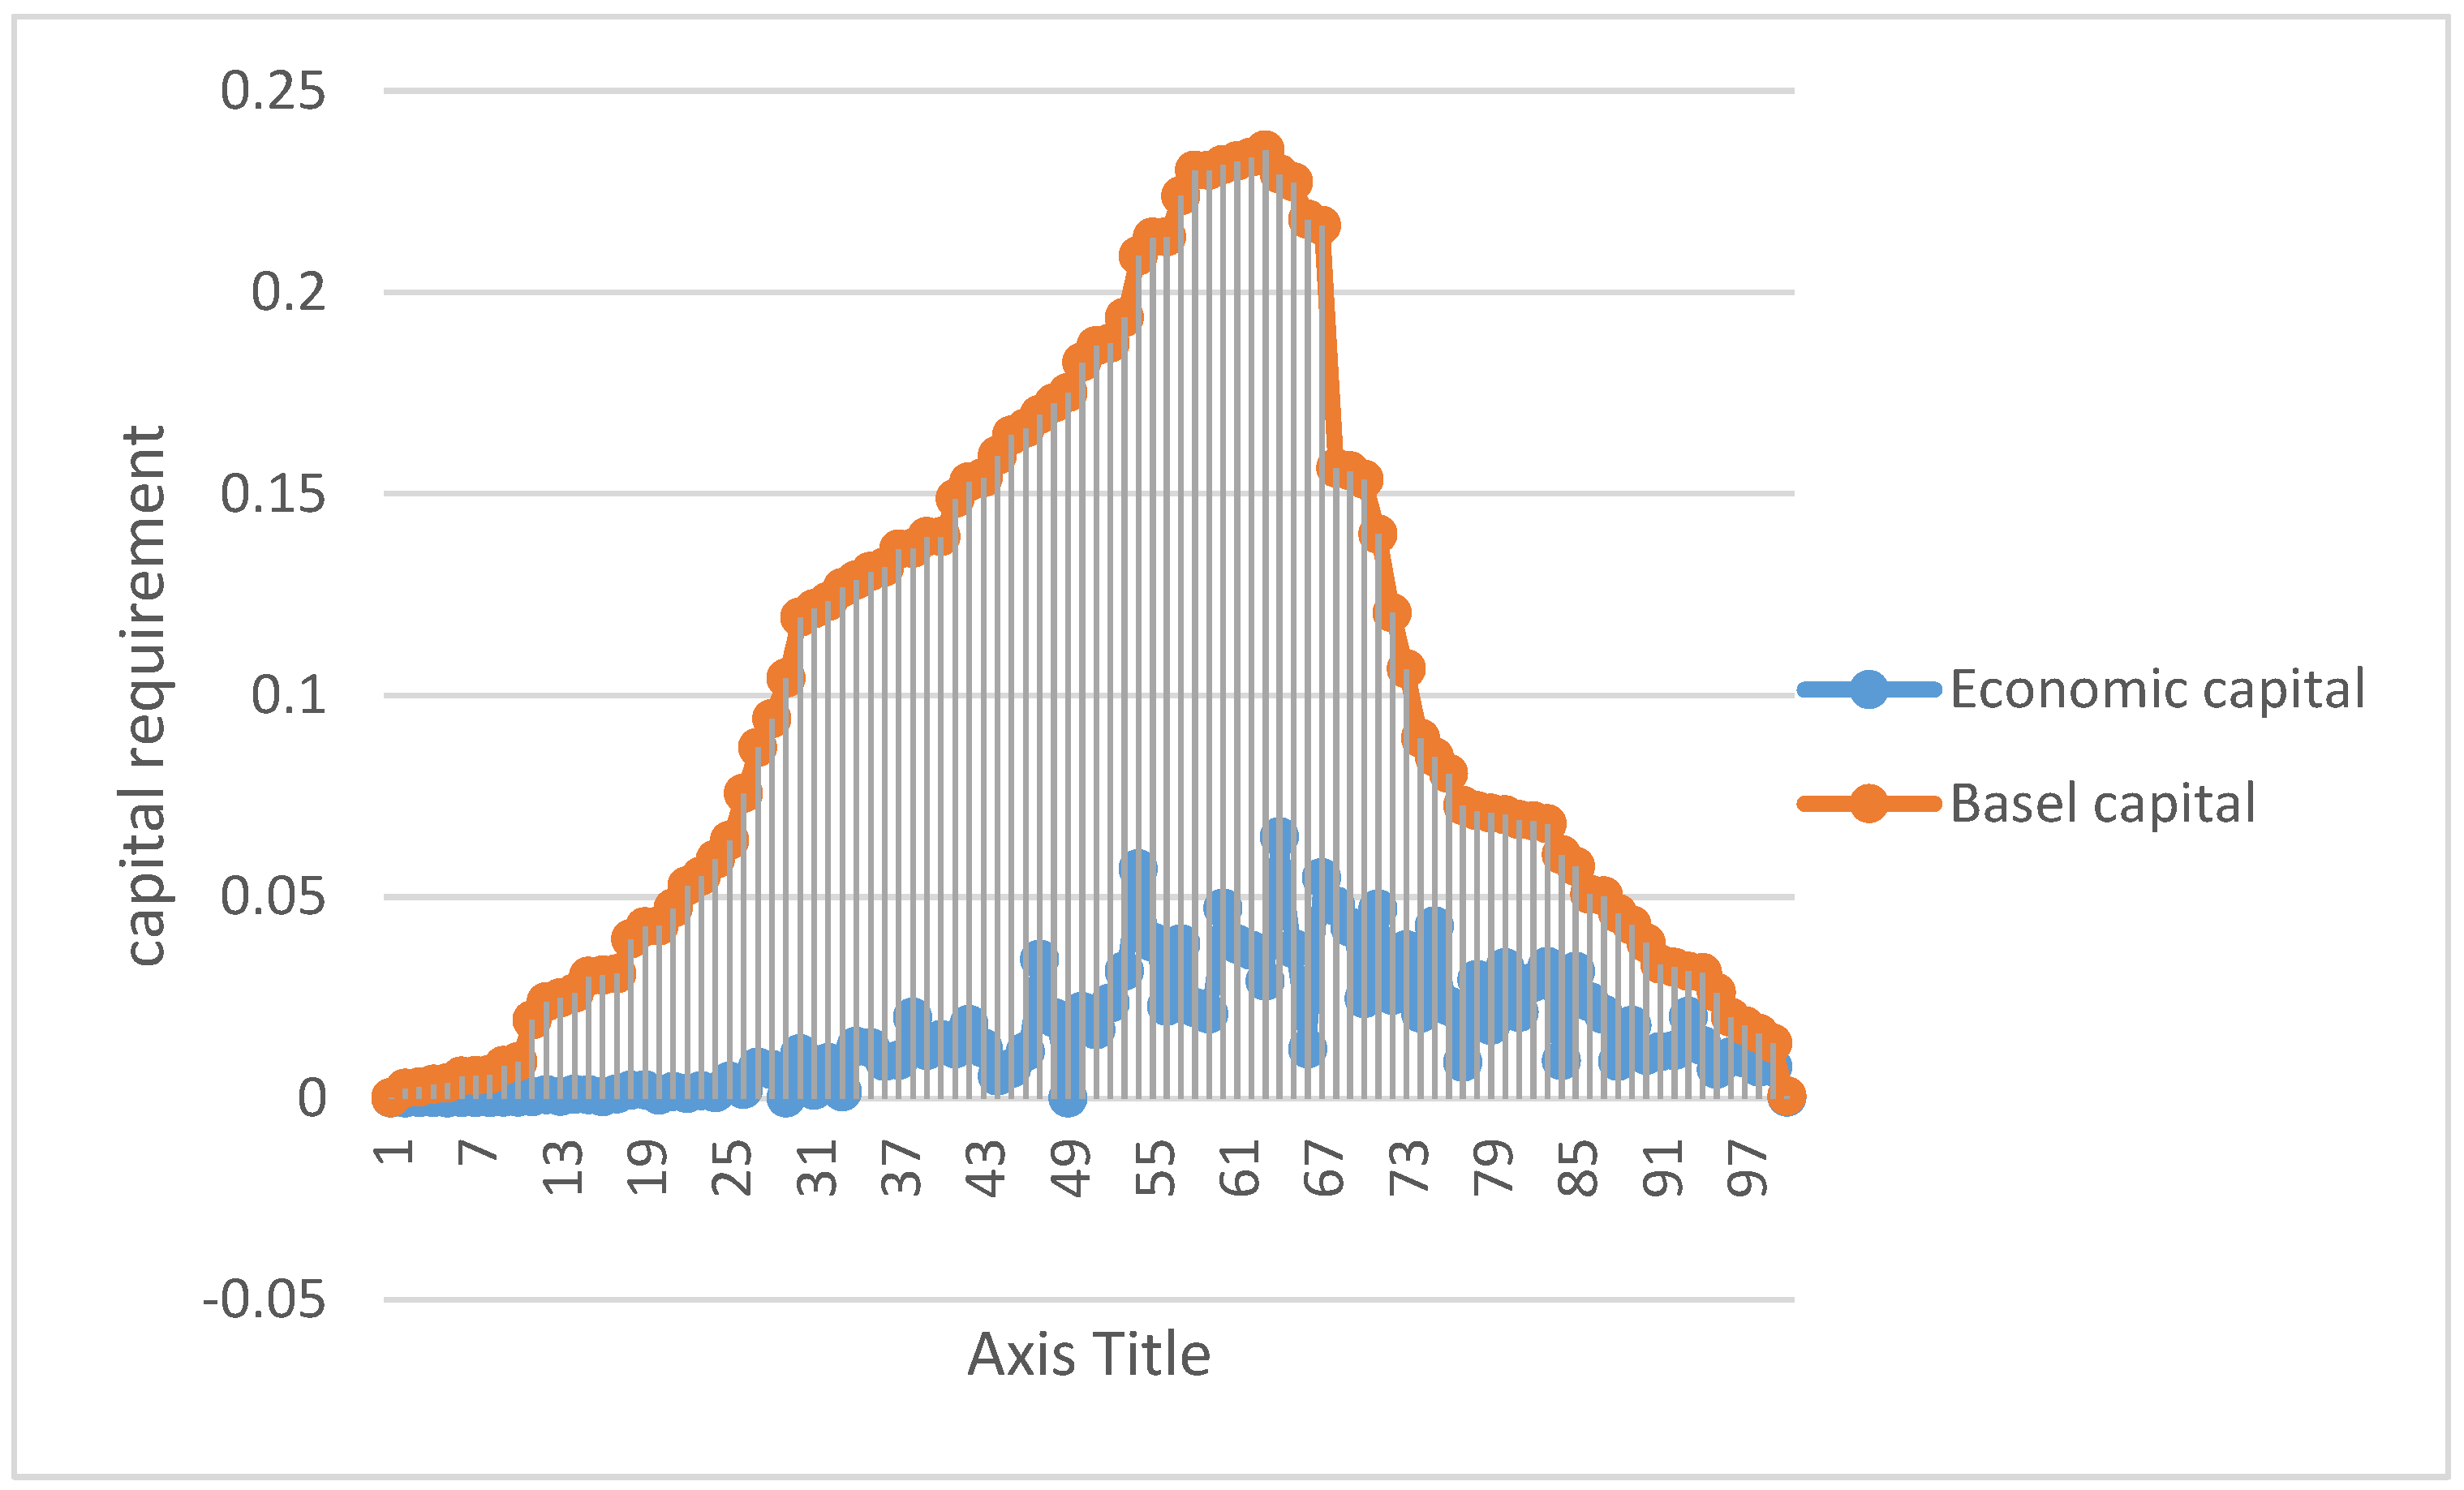
When this capital requirement takes the simulated value of systematic risk sensitivity, it becomes economic. When it takes the value of sensitivity imposed by the Basel Committee, it becomes regulatory. Therefore, the economic and regulatory capital for each borrower
4 is assumed in
Figure 3:
To have a better vision of the result of the economic and regulatory approaches, we assume all of the indicators in the portfolio of the 100 borrowers: sensitivity to systematic risk, maximum losses, expected losses, and the capital requirement under an economic approach and a regulatory approach.
Indeed, all results are summarized in
Table 3 and
Table 4. These last tables report the descriptive statistic of default probability, capital requirement, and systematic risk sensitivity to the economic and regulatory approaches, respectively.
3. Main Result
To have a better vision of the result of the economic and regulatory approaches, we assumed all indicators in the portfolio of the 100 borrowers including sensitivity to systematic risk, maximum losses, expected losses, and the capital requirement under an economic approach and a regulatory approach.
The total loan loss under the regulatory approach is measured by conditional probability taking into account the loss-given default (45%), which is at 24.59%, and under an economic approach, is at 16.25%. The expected loss is the mean of default probability, taking into account the loss-given default (45%). It is at 14.66% of exposure, by default.
The unexpected loan loss is the difference between the total and expected loss; it is the capital requirement to cover the credit risk. Accordingly, for the regulatory approach imposed by the Basel Committee, the regulatory capital is 9.92% × exposure at default. The same was for economic capital, which stood at 1.58% × exposure at default.
The regulatory approach allocates more capital for credit risk coverage than the economic approach. This means that the Basel Committee’s new regulation overestimated borrower real global credit risk. This led banks to devote more capital than they really needed. Hence, there was an increase in capital costs and the possibility of an arbitrage opportunity.
Lang et al. (
2008) also showed this result.
We conclude that under a regulatory approach, the supervisory incite Tunisian banks to be risk averse. Therefore, Tunisian banks devoted more capital to cover credit risk than necessary, which led Tunisian banks to compensate for this loss by risk-taking. This situation can help Tunisian banks to perform better, as shown by
Lan Le et al. (
2023). Banks whose optimal capital is equal to those required by the authorities, do not tend to ameliorate their performance.
On the other hand, we conclude that the sensitivity required by the Basel Committee (0.23) is much higher than simulated under the economic approach (0.0076). This leads banks to hold more capital against the economic reality, as banks are supposed to apply regulatory capital and not economic capital. Therefore, the Basel Committee has given more importance to the contagion effect between borrowers to a shock from society or the economy, such as a political crisis, inflation, life quality degradation, etc.
In addition, the p-person correlation between regulatory systematic risk sensitivity and borrowers’ default probability is positive (1.14%) and negative (−67.79%) in the economic approach. Hence, really and economically, the default contagion effect is important in the lower notation class of borrowers, contrary to the result of the regulatory approach, as found by
Lee et al. (
2021). However, the regulatory authorities have supposed that the contagion effect is higher in the higher class of default risk. This result explains why the regulatory system has applied more importance to the contagion effect.
This last result can be explained by the fact that when the Basel Committee established a higher value of systematic risk sensitivity, it could not avoid the cyclic effect between economic state and capital requirement. Hence, this higher value leads to maximising the capital increase, leading to an increase in the capital cost in a crisis period. This suggestion was shown by
Gordy (
2000) and
Naili and Lahrichi (
2022).
4. Conclusions
In reviewing the theoretical literature, we conclude that the regulatory capital adopted by the Basel Committee is a mathematical derivation of economic capital. The main difference reported in the literature primarily relates to the contagion effect between the defaulting borrowers and is measured by the sensitivity to systematic risk.
Under an economic approach, this sensitivity has been simulated by many market approaches. However, under a regulatory approach, it was measured using a formula imposed by the Basel Committee. This established the sensitivity to systematic risk to avoid excess credit risk and to control capital costs. However, the economic capital is estimated as the real necessary funds to cover failure—borrowers—including the real sensitivity to systematic risk.
In a comparative study examining economic and regulatory capital conducted on a portfolio of 100 individual Tunisian bank borrowers, we simulated the banking requirement capital under regulatory and economic approaches. We found that regulatory capital overestimates the economic capital due to overestimating the contagion effect between borrowers (sensitivity to systematic risk) under a regulatory approach. However, in reality, this contagion is much lower than imposed by the Basel Committee. This divergence between the two capital requirements leads to an opportunity cost and a raised capital cost.
Therefore, when Tunisian banks want to apply a regulatory approach, they will devote more requirement capital to cover a default credit payment than necessary because they have given more importance to sensitivity than to systematic risk. This divergence between the economic capital requirement and the regulatory requirement can lead to a risk arbitrage between different kinds of credit and can maximise credit risk. Therefore, the Basel Committee has been unsuccessful in standardising and generalising internal economic capital to any Tunisian banks.
In this paper, we limited ourselves to only testing an economic approach to simulate requirement capital and sensitivity to systematic risk by modelling a single factor. We could have examined other economic approaches, including several economic foundations of sensitivity, such as the market approach, to provide a better comparison with regulatory capital.


