Abstract
COVID-19 has made virtual interactions an integral part of learning modes. This made it possible for college students to live further away from school than before, which might change the house price neighboring universities. This article studies the effect of proximity to school on house prices after the COVID-19 outbreak using a non-parametric difference-in-differences approach with property-level transaction data surrounding 128 universities in the U.S. The results show that house prices within 0.5 miles of universities experienced a maximum decrease of approximately 7% after three months of the outbreak. The effects vary for universities that implemented different teaching modes of in-person, hybrid, and online. Since house prices are important indicators for local economic conditions, the results help local homeowners, investors, and governments in their decision-making processes.
1. Introduction
The outbreak of COVID-19 resulted in tremendous changes in our lives. One change has involved virtual interactions, which have become an integral part of current working modes. For example, some industries that do not heavily rely on in-person contacts have shifted to a hybrid mode of working, such as working two-to-three days a week in-person. This might result in a relocation wave in employees to places with lower house prices but better environment. Universities are also one of the industries that have integrated online learning in their teaching modes to deal with the challenges brought by COVID-19. Since college students might constitute one of the major demands in housing surrounding universities, the COVID outbreak might lead to changes in house prices neighboring universities. This article, therefore, analyzes the effect of proximity to universities on house prices as a result of the COVID outbreak.
According to my best knowledge, this effect has hardly been studied in the literature before. The first contribution of this article is thus to enlighten the homeowners/landlords, whose homes locate nearby universities, on house price movements in response to COVID-19. Since housing is a major indicator of local economic conditions, the findings also benefit the investors on their investment plans in neighborhoods surrounding universities and facilitate the local government on their policy making in local economic development. Second, the discussed effects on house prices might differ across universities that vary in the teaching mode implemented after COVID-19, including in-person, online, and hybrid. This article, therefore, analyzes the differential effects with these three modes that differ in the degree of online incorporations in their teaching. Third, the article contributes to analyzing the effect using a spatial non-parametric difference-in-differences (DID) method that yields the treatment effect as a continuous function of distance to the university and time since the COVID outbreak, which details the effect with respect to space and time. The method further controls more rigorously for the unobservables of houses that are used to compare the home prices, reducing the prior trends magnitudes (Diamond and McQuade 2019).
Property transactions within 2 miles of 128 universities in the U.S. were self-collected. Of those universities, there were 62 online, 29 in-person, and 33 hybrid. Utilizing the non-parametric DID method, the results suggest that COVID-19 resulted in an average decrease of 3% in neighboring house prices within 2 miles of the university for the first three months after the COVID outbreak. Taking February 2020 as the COVID outbreak date, the first three months include March, April, and May of 2020. This is the period when the stay-home orders were first implemented in the U.S. The decrease might thus result from the school shutting down and students all returning home and learning virtually. From months 4 to 5 (June and July 2020) after the outbreak, the house price of homes located closer to the university increased by approximately 5% as a result of the COVID outbreak compared to that of homes located farther from the university. This could be from the lift of the stay-home orders and low interest rates. In months 6 to 8 (August to October 2020), the neighboring house prices again experienced declines of approximately 8% for within 1 mile of the university. During this time, many states reversed the lift of stay-home orders. They implemented restrictions on indoor activities, and non-essential businesses were still encouraged to work online. Many universities also extended their online teaching schedule at this time, and students may have realized that they were not able to return to school anytime soon. The differential effect analysis finds that in-person and hybrid schools tended to experience a higher house price increase in months 4–5 and a lower house price decrease in months 6–8 than online schools.
For local homeowners, investors, and local government, the decrease in house prices indicates that there might be fewer students living nearby universities after the COVID outbreak. This suggests declines in both local consumption and transportation neighboring schools. Local homeowners, investors, and governments might prepare for these changes and apply policies to tackle challenges brought by the changes. The rest of the article is organized as follows. Section 2 introduces the research background. Section 3 describes the method. Section 4 discusses the data, and Section 5 provides the results. Section 6 concludes the paper.
2. Research Background
2.1. The COVID-19 Effect on House Prices
COVID-19 started to spread in the U.S. in February 2020. Most states in the country implemented the first-round social distancing and stay-home orders in late March 2020 and ended them in May 2020. For instance, California started the order on 19 March 2020, and ended the order on 8 May 2020. Texas’s stay-home order lasted from 2 April 2020 to 30 April 2020, for about one month, which was the shortest of all first-round stay-home orders. The effects of the stay-home orders on house prices are evident. Transaction volumes fell by about 40% in April, May, and June 2020 compared to those of 2019, as shown in Panel A of Table 1. According to Wang (2022), from April to June 2020, demand decrease dominated the housing market in Los Angeles, resulting in both declines in house prices and transaction volumes. Other research also found that house prices decreased in April and May 2020 (Del Giudice et al. 2020; Allen-Coghlan and McQuinn 2021; Zhao 2020; Tian et al. 2021; Cheung et al. 2021; Yiu 2023a, 2023b).

Table 1.
Summary characteristics of housing data.
Since COVID-19 negatively affected almost every aspect of the economy, such as consumption, stocks, etc. (Baker et al. 2020a; Ling et al. 2020; Milcheva 2020; Baker et al. 2020b; Thorbecke 2020), the Federal Reserve lowered interest rates to a historically low level. Together with the lift of the first-round stay-home orders in May 2020, the housing market was boosted by the low interest rates and the release of the housing demand after May. Wang (2022) found that the housing demand and house prices experienced increases through June to August 2020. In mid-August, some states reversed the lift of stay-home orders, issued restrictions on indoor activities, and still encouraged non-essential businesses to work virtually, such as California, New York, and Hawaii, but the implementation was generally less strict, and people did not follow the second-round orders as strictly as before. Some other states, such as Texas and Florida, did not even have second-round restrictions on activities. The negative effect on the general housing market would thus be limited after August.
2.2. The COVID-19 Effect on Universities and How the Effect Affects Neighboring House Prices
Universities were also affected by stay-home orders, and teaching started to shift online in mid-March 2020. This probably resulted in most students returning home and stopping paying rents for their residence near school. The Current Population Survey specified that more young adults (18–29) lived with their parents or relatives in May 2020 compared to May 2019. This could then have led to decreases in housing demand and house prices neighboring universities. After the first-round stay-home orders started, different universities adopted different teaching modes in the study period (May to October 2020), ranging from full and primarily online, hybrid, to full and primarily in-person. The distribution of the universities by teaching modes is shown in Figure 1, which shows that most universities adopted online teaching. The variation in the effects of proximity on house prices since the COVID outbreak is then studied in the article. Another channel through which the COVID outbreak affected student numbers living nearby universities is that, after the outbreak, international student enrolment dropped significantly (Thatcher et al. 2020). According to my best knowledge, limited research has studied the effect of proximity to universities on nearby house prices and almost none of the literature has analyzed those effects since COVID-19.
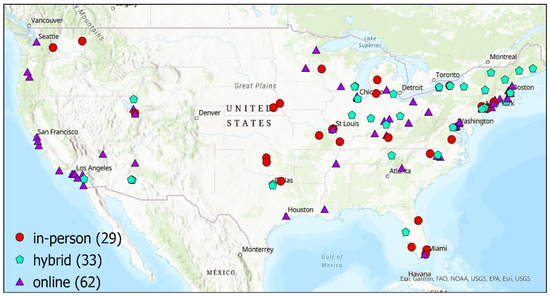
Figure 1.
The distribution of universities. Note: this figure shows the distribution of 128 universities by teaching modes of in-person, hybrid, and online from March to October 2020.
3. Methods
The objective is to identify the net effect of proximity to universities on house prices since the COVID outbreak. Previous research which analyzed the effect of proximity to a certain project on neighboring house prices used a ring method (Campbell et al. 2011; Pope and Pope 2015; Slade 2018). To study the effect of proximity to universities on house prices after the COVID outbreak, this ring method first compares the house price of homes located in the closer ring to house prices of homes located in the farther ring after the outbreak, to obtain the price difference for after. The method then compares the house prices in closer rings to those in farther rings before the outbreak to obtain the price difference for before, which serves as a counterfactual of how the house price might have trended if there had been no COVID outbreaks. The difference in the after price difference and before price difference is then the net effect of being near the universities on house prices since the COVID outbreak. Typically, the closer ring is categorized as within 0.5 miles, 0.5 to 1 mile, and 1 to 2 miles of the project. Their house prices are compared to those of homes located from 2 to 4 miles from the project, which is categorized as the farther ring. The drawbacks in this ring method are that, firstly, the houses located in the closer and farther rings are quite distant and they might differ in neighborhood characteristics, resulting in bias in the estimates. Second, the analysis needs to choose an arbitrary cut-off point in distance for the closer and farther rings.
A non-parametric difference-in-differences method, developed by Diamond and McQuade (2019), improves the ring method in two important aspects. First, they managed to keep the properties used for comparison as similar as possible by choosing properties within close proximity. The locational proximity makes those properties similar in their neighborhood features and local time trends in house prices that can be crossed out when considering their price differences. Second, the non-parametric method generates the net effect as a continuous function of distance to the university and time since the COVID outbreak. Specifically, since the house price comparison is performed at numerous distances to the university and for multiple months since the outbreak, a smooth function of the price difference with respect to distance and time can be recovered by non-parametrically smoothing the price difference to distance and time. Figure 2 illustrates the method, and the details of the method are outlined below.
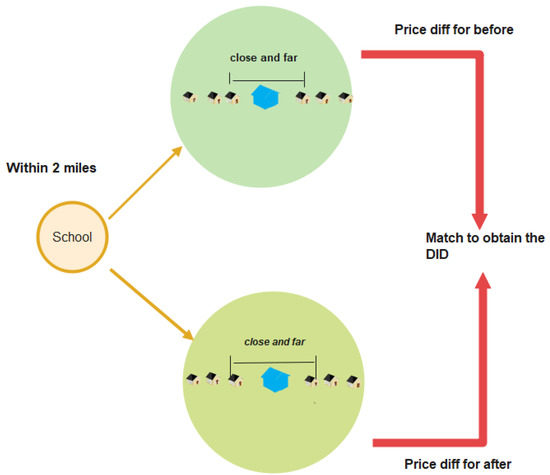
Figure 2.
The difference-in-differences method.
At every location of the transaction properties drawn within 2 miles of the university, properties are drawn to be used for comparisons. As discussed before, these properties need to be similar in their neighborhood and housing characteristics so that taking the house price difference of these properties can cross out those features and yield the house price as a function of the effect of proximity to the universities. The before and after price differences are calculated separately below:
where DLHPafter and DLHPbefore represent the price differences for after and before the COVID outbreak, respectively. LHPclose,after represents the log of house prices for homes located close to the university and transacted after the outbreak, ranging from March to October of 2020. LHPfar,after denotes the log of house prices for homes located far from the university and transacted after the outbreak. The close-after and far-after properties that are used to calculate the price differences are located within 0.625 miles and transacted within the same month of 2020 so that their local neighborhood characteristics and local time trends in house prices are similar. The close and far properties are also kept relatively similar in their housing characteristics so that their house type is the same and their square footage difference is kept within 20%. The close-before and far-before properties are also within 0.625 miles, transacted in the same month of 2019 (March to October 2019), and are kept relatively similar in their housing features. The before and after price differences are calculated at each location that has a transaction record within 2 miles of the universities. The price difference is therefore for certain distances to the university and for certain months before and after the outbreak. The individual before and after price differences are then matched at the same location and the difference-in-differences effect will be calculated as below:
where stands for the individual net treatment effect at each location of the property with a transaction record within 2 miles of the universities for each month of March to October 2020. The treatment effect is then non-parametrically smoothed with an Epichanokov kernel over all transaction locations to yield the effect as a continuous function of distance and time.
4. Data
4.1. Universities
Multiple data sources are collected for the analyses, including the universities and individual property transaction data. Altogether, 128 universities were drawn in the U.S. that had teaching mode information during the first 8 months after the outbreak in February 2020. The geographical distribution of the schools is shown in Figure 1. Of these schools, there were 29 universities that implemented fully or primarily in-person teaching after the COVID-19 outbreak from May to October 2020, including Texas A&M University at Commerce, University of Nebraska at Omaha, University of Miami, etc. A total of 34 universities performed hybrid teaching, including Duke, UIUC, Arizona State U. at Tempe, U. at Buffalo, etc. The remaining 65 universities implemented fully or primarily online teaching, including Harvard, Stanford, Yale, MIT, UCLA, UC Berkeley, University of Southern California, University of Nevada at Las Vegas, California State University, etc. A majority share of universities used online teaching modes. From Figure 1, we can see that most universities on the West Coast implemented online or hybrid teaching modes. The universities that implemented in-person teaching were concentrated in the central region and the East Coast, especially in the central region.
4.2. Properties
Property transactions that surround the 128 universities in a 2-mile radius are drawn. This results in 46,881 transactions within 8 months (transacted from March to October 2020) after the COVID outbreak, and 48,354 transactions from March to October 2019. The detailed breakdown of the transaction volume for each month of 2019 and 2020 is shown in Panel A of Table 1. Compared to 2019, the overall transaction volume in 2020 did not change much. The transaction only fell in April and May of 2020. The decreased transactions in April and May were then made up in the following months of 2020. The property data contain the address, transaction dates, transaction price, the number of bedrooms and bathrooms, square footage, and built years. The detailed summary statistics of the data are shown in Panel B of Table 1 for four distance categories of within 0.5 miles, 0.5 to 1 mile, 1 to 1.5 miles, and 1.5 to 2 miles for 2019 and 2020, respectively. The 2019 and 2020 data contain March to October. The properties in these two years are used for comparison. We can see that the house price was higher in 2020 compared to 2019 for all distance categories. We also observe relatively larger houses transacted in 2020 than 2019.
5. Results
In this section, results for all 128 universities in the U.S. are firstly provided. I second show the variation in the results by teaching modes of in-person, online, and hybrid.
5.1. The Results of All 128 Universities
Figure 3 shows the results from the non-parametric estimations. These are three-dimensional surface results that are continuous with respect to both distance in miles from the school and the number of months after the COVID outbreak. The results thus show the detailed variation in the effect of proximity to universities on house prices after the COVID outbreak. The COVID outbreak month is taken as February of 2020. Then, a number of 2 on the axis of “Months after COVID Outbreak” shows the effect for 2 months after the outbreak, that is, April of 2020. This is when the offer was made as opposed to when the transaction was closed. Normally, the transaction takes about one month and a half to complete. An effect of 5% for month 2 since the outbreak and 1 mile to the university reflects that the houses located at 1 mile from the school were sold for 5% more than houses located a little further away in April 2020. This is the net effect of being 1 mile from the school for 2 months after the pandemic.
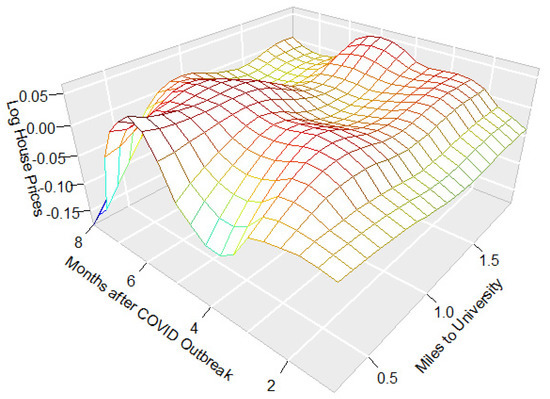
Figure 3.
The effect of proximity to universities on house prices since COVID-19. Note: this figure shows the effect of proximity to universities on house prices since COVID-19 with respect to distance to the university and years after the outbreak.
The results demonstrate that, for 1–3 months (March, April, and May of 2020) after the outbreak, house prices experienced decreases of approximately 3% for within 2 miles. This was the period when the U.S. first entered into COVID-19 lockdown and implemented the first-round stay-home orders. The real estate market was badly hit since many prospective buyers and sellers cancelled their plans or were waiting during this period. The transaction process was also largely affected by the stay-home orders. Tours of houses were mostly cancelled; recordings of transactions were postponed; agents, house inspectors, and brokers were not able to meet face-to-face with home buyers and sellers. For universities, they were mostly shut down in these three months, resulting in a decrease in housing demand near the school. This explains the decrease in house prices neighboring universities.
As we analyze months 4–5 (June and July of 2020) after the outbreak, we can observe that the house prices saw an increase of approximately 5% for within 1 mile and about zero effects for beyond 1 mile. The reason for this price increase might be that, after the lift of the stay-home orders in May 2020, people at that time did not expect that COVID-19 would be such a long-lasting pandemic. The market was then boosted by low interest rates and the lift of stay-home orders. For universities, most people also did not expect that remote teaching would last for another year in June 2020, and they were expecting to return to school after two months of staying home. This explains the increases during this period. Lastly, in months 6–8 (August, September, and October of 2020) after the outbreak, houses near the universities experienced large decreases in house prices. The decline magnitudes were larger than those in months 1–3. This was a period when case rates were still rising. Some states implemented second-round stay-home orders in around August, and college students realized that they might not be able to return to school in the very-near future.
5.2. Variation in Results by Teaching Modes
Next is the discussion on the effect variations by teaching modes of in-person, online, and hybrid. The teaching modes are for May to October 2020. The effect of proximity to universities on house prices relies on the fact that the housing market neighboring universities is heavily influenced by college students. If they do not need to go to classes in person, they do not need to live close to school. Therefore, different teaching modes might lead to differential effects of proximity to universities on house prices following the outbreak of COVID-19. Figure 4 shows the effects. Since the effects need to be compared by teaching modes and 3-D format results make it hard to discern the differences, the results are shown in a 2-D format where the effects are averaged over different months and shown as continuous over distance to the school. The effects and 90% confidence bounds are shown in the figures.
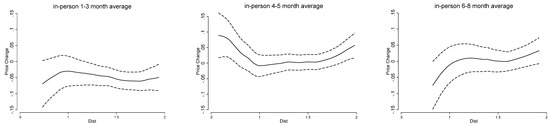
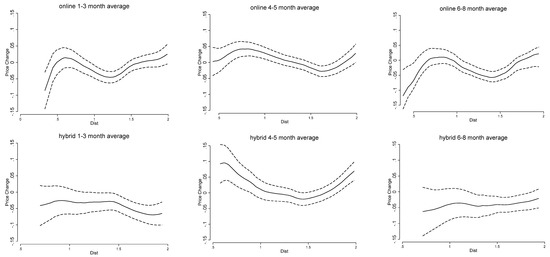
Figure 4.
The effect of proximity to universities on house prices following the outbreak of COVID−19, by teaching modes. Note: these figures show the estimates with respect to distance averaged over respective months after the COVID outbreak. The horizontal axis provides distance to the university in miles. The vertical axis denotes the effect on neighboring house prices. The 90% confidence bonds are also provided.
The results show that all three types of universities experienced house price declines with approximately similar magnitudes in months 1–3. This is reasonable since, in these three months, regardless of the teaching modes, universities were shut down. For months 4–5, a variation in the effects is detected, in that the in-person and hybrid schools had a larger increase in house prices than the online schools. This is intuitive, since in-person schools perform face-to-face class meetings, and students who formerly live close continue to live nearby. Hybrid teaching combines in-person and online teaching that still needs students to go to classes from time to time. This explains the similarities in the effects between in-person and hybrid schools. For months 6–8, there is also a universal decrease in house prices nearby the school, and online schools experienced a larger decline.
6. Conclusions
With COVID-19 being part of our lives nowadays, we have incorporated online working and teaching in our daily work and study life. This transformation has resulted in significant changes in house prices. Traditionally, as the bid rent theory predicts, the land/house price closer to the CBD area is higher due to the save on transportation costs than those farther away. Nowadays, with the shift to virtual interactions, living in proximity to work and study places becomes less attractive than before. Universities also incorporated online teaching to cope with challenges brought about by the COVID outbreak. This probably decreased the house prices neighboring universities. This article analyzes the effect of proximity to universities on house prices following the outbreak of COVID-19. The results suggest that houses located close to universities indeed were sold for less than those located further away on average in the 1–8 months following the outbreak of COVID-19. Universities implementing in-person and hybrid teaching experienced lower declines compared to those that adopted primarily or fully online teaching.
The results indicate that there might be fewer students living nearby universities that adopted online teaching in 2020. This could lead to decreased levels of consumption and transportation in local areas nearby the school. This study focuses on the effect of the change in teaching modes on local house prices neighboring universities. Looking at the larger picture, online teaching also makes learning more versatile and more flexible. It has resulted in increased numbers of student enrolment for many schools. The limitation of the study is that with more data on property transactions, we can observe the effect for a longer time period. Further, with local consumption and transportation data, we can analyze how these have changed near universities to broaden our knowledge on the effect of being close to universities following the COVID-19 outbreak.
Funding
This research received no external funding.
Data Availability Statement
Not applicable.
Conflicts of Interest
The author declares no conflict of interest.
References
- Allen-Coghlan, Matthew, and Kieran Michael McQuinn. 2021. The potential impact of COVID-19 on the Irish housing sector. International Journal of Housing Markets and Analysis 14: 636–51. [Google Scholar] [CrossRef]
- Baker, Scott R., Nicholas Bloom, Steven J. Davis, Kyle Kost, Marco Sammon, and Tasaneeya Viratyosin. 2020a. The Unprecedented Stock Market Reaction to COVID-19. The Review of Asset Pricing Studies 10: 742–58. [Google Scholar] [CrossRef]
- Baker, Scott R., Robert A. Farrokhnia, Steffen Meyer, Michaela Pagel, and Constantine Yannelis. 2020b. How Does Household Spending Respond to an Epidemic? Consumption During the 2020 COVID-19 Pandemic. The Review of Asset Pricing Studies 10: 834–62. [Google Scholar] [CrossRef]
- Campbell, John Y., Stefano Giglio, and Parag Pathak. 2011. Forced Sales and House Prices. American Economic Review 101: 2108–31. [Google Scholar] [CrossRef]
- Cheung, Ka S., Chung Y. Yiu, and Chuyi Xiong. 2021. Housing Market in the Time of Pandemic: A Price Gradient Analysis from the COVID-19 Epicentre in China. Journal of Risk and Financial Management 14: 108. [Google Scholar] [CrossRef]
- Del Giudice, Vincenzo, Pierfrancesco De Paola, and Francesco Paolo Del Giudice. 2020. COVID-19 Infects Real Estate Markets: Short and Mid-Run Effects on Housing Prices in Campania Region (Italy). Social Sciences 9: 114. [Google Scholar] [CrossRef]
- Diamond, Rebecca, and Timothy McQuade. 2019. Who Wants Affordable Housing in their Backyard? An Equilibrium Analysis of Low Income Property Development. Journal of Political Economy 127: 1063–117. [Google Scholar] [CrossRef]
- Ling, David C., Chongyu Wang, and Tingyu Zhou. 2020. A First Look at the Impact of COVID-19 on Commercial Real Estate Prices: Asset-Level Evidence. Review of Asset Pricing Studies 10: 669–704. [Google Scholar] [CrossRef]
- Milcheva, Stanimira. 2020. Volatility and the Cross-Section of Real Estate Equity Returns during COVID-19. Available online: https://ssrn.com/abstract=3599211 (accessed on 30 January 2023). [CrossRef]
- Pope, G. Devin, and Jaren C. Pope. 2015. When Walmart Comes to Town: Always Low Housing Prices? Always? Journal of Urban Economics 87: 1–13. [Google Scholar] [CrossRef]
- Slade, Barrett. 2018. Big-Box Stores and Urban Land Prices: Friend or Foe? Real Estate Economics 46: 7–58. [Google Scholar] [CrossRef]
- Thatcher, Arran, Mona Zhang, Hayden Todoroski, Anthony Chau, Joanna Wang, and Gang Liang. 2020. Predicting the Impact of COVID-19 on Australian Universities. Journal of Risk and Financial Management 13: 188. [Google Scholar] [CrossRef]
- Thorbecke, Willem. 2020. The Impact of the COVID-19 Pandemic on the U.S. Economy: Evidence from the Stock Market. Journal of Risk and Financial Management 13: 233. [Google Scholar] [CrossRef]
- Tian, Chuanhao, Xintian Peng, and Xiang Zhang. 2021. COVID-19 Pandemic, Urban Resilience and Real Estate Prices: The Experience of Cities in the Yangtze River Delta in China. Land 10: 960. [Google Scholar] [CrossRef]
- Wang, Bingbing. 2022. Housing market volatility under COVID-19: Diverging response of demand in luxury and low-end housing markets. Land Use Policy 119: 106191. [Google Scholar] [CrossRef] [PubMed]
- Yiu, Chung Yim. 2023a. A Natural Quasi-Experiment of the Monetary Policy Shocks on the Housing Markets of New Zealand during COVID-19. Journal of Risk and Financial Management 16: 73. [Google Scholar] [CrossRef]
- Yiu, Chung Yim. 2023b. Are Central Banks’ Monetary Policies the Future of Housing Affordability Solutions. Urban Science 7: 18. [Google Scholar] [CrossRef]
- Zhao, Yunhui. 2020. US Housing Market During COVID-19: Aggregate and Distributional Evidence. IMF Working Paper No. 2020/212. September 1. Available online: https://ssrn.com/abstract=3744679 (accessed on 31 January 2023).


Disclaimer/Publisher’s Note: The statements, opinions and data contained in all publications are solely those of the individual author(s) and contributor(s) and not of MDPI and/or the editor(s). MDPI and/or the editor(s) disclaim responsibility for any injury to people or property resulting from any ideas, methods, instructions or products referred to in the content. |
© 2023 by the author. Licensee MDPI, Basel, Switzerland. This article is an open access article distributed under the terms and conditions of the Creative Commons Attribution (CC BY) license (https://creativecommons.org/licenses/by/4.0/).