Abstract
As historical data are typically unavailable for a start-up, risk assessment is always complex and challenging. Traditional methods are incapable of capturing all facets of this complexity; therefore, more sophisticated tools are necessary. Using an expert-elicited Bayesian networks (BNs) methodology, this paper aims to provide a method for combining diverse sources of information, such as historical data, expert knowledge, and the unique characteristics of each start-up, to estimate the default rate at various stages of the life cycle. The proposed method not only reduces the cognitive error of expert opinion for a new start-up but also considers the learning feature of BNs and the effect of lifespan when updating default estimations. In addition, the model considers the impact of investors’ risk appetite. Furthermore, the model can rank the most effective risk factors at various stages. The receiver operating characteristic (ROC) curve was utilized to assess the model’s explanatory power. Moreover, three distinct case studies were used to demonstrate the model’s capabilities.
1. Introduction
Start-ups do not generate significant cash flows in the early stages of the life cycle due to their uncertainties (Trabelsi and Siyahhan 2020), and the survival rate of start-ups in the first years is low (Pena 2002).
Due to the issue’s complexity, numerous studies have investigated it from various angles. A study of defining and measuring failure in small- and medium-sized enterprises (SMEs) was conducted by Altman (1968). However, the impact of investors’ risk appetite, which plays a crucial role in risk taking, was not adequately considered. The problem’s dynamic nature is also significant. Individualistic tendencies, for instance, are advantageous in the beginning but detrimental in later stages (Tiessen 1997). Consequently, a success factor in one stage may be a failure factor in subsequent stages (Marco van Gelderen et al. 2005). In addition, the effect of unknown risk factors and inherent industry-related risks must be considered.
On the other hand, there are numerous general risk assessment methods, such as risk failure mode and effect analysis (RFMEA) (Luppino et al. 2014) or intuitionistic fuzzy set in FMEA (Chang and Cheng 2010), a multi-hierarchy grey method (Junchen et al. 2013), probabilistic fuzzy system (Rudnik and Deptuła 2015), fuzzy analytic hierarchy process (Yin et al. 2022), simulation-based risk interdependency network model (Guan et al. 2021), and risk matrix (based on multi-criteria and multi-experts information) (Tian et al. 2018). Nevertheless, these methods have drawbacks that emphasize the need to identify all failure modes by identifying self-acting individuals, which can be problematic on a large scale. The lack of sufficient data and the excessive sensitivity of the methods to data are other drawbacks of existing methods for risk assessment in start-ups (Akhavan et al. 2021).
Considering the increase in venture capital investments (e.g., the value of investments in the United States has increased more than tenfold between 2006 and 2021 (Statista 2022)), determining the failure rate of each type of investment is crucial for maximizing efficiency and preventing the waste of funds. Consequently, probabilistic causal methods such as BNs are suitable for assessing risk in start-ups. BNs are probabilistic graphical models that provide a combination of variables and their probabilistic distribution function-based relationships. Applying expert hypotheses accurately, modeling potential relationships between causes and effects, establishing dependency relationships between causes of failure (Fenton and Neil 2012), combining diverse types of data, and updating opinions about a variable in response to new information are characteristics of BNs (Khodakarami and Abdi 2014).
This paper contributes to the literature by offering providing an operational and practical framework based on BNs’ method for estimating the probability of start-up default by considering the maturity and lifespan of start-ups, the effects of risk factors, and unknown factors regarding the causes of start-up default. Because some investors, such as venture capitalists, provide “know-how” and capital to early-stage firms (Klonowski 2010), and they can accept a certain level of risk based on their experience, applying the effect of investor risk appetite default is deemed the significant innovation of this article.
This paper is organized as outlined below. Section 2 discusses the SR (startup risk) factors and how they can be measured. Section 3 explains the proposed BNs model’s structure, including identifying the risks and their effects on start-ups, determining the relationships between risk factors, assigning a table of marginal probabilities, and analyzing the results. Section 4 and Section 5 provide a validation framework and three examples of risk assessments for start-ups in various industries and time periods. The final section summarizes the conducted processes and suggestions for future research.
2. Literature Review
Most individuals associate the term risk with something negative. However, limiting the concept of risk to negative outcomes is problematic, as it is frequently challenging to differentiate between negative and positive results. For instance, failure may be costly and undesirable in the short term, but it may lead to long-term improvements in performance (Aven 2011). Therefore, this section presents a variety of risk definitions in the field of innovation and start-ups. Subsequently, the applications of BN models for start-up and innovation projects are investigated.
Hansson (2009) provides various definitions of risk as follows:
- An unintended event that may or may not occur;
- A reason for an unintended event that may or may not occur;
- The probability of an unintended event that may or may not occur;
- The expected value of an unintended event that may or may not occur;
- A decision is made under conditions where the probability of events is certain.
According to the definition of the Committee of Sponsoring Organizations of the Tredway Commission (COSO), a risk is an event that may have a negative impact, while an opportunity is an event that may have a positive effect. Nonetheless, risk analysts may fail to recognize which threats and opportunities are inextricably linked. Whether an occurrence is a risk or an opportunity is determined by its (possibly positive or negative) consequences (Fenton and Neil 2012). For example, Li and Hasan (2020) presented two concepts for risk: bankruptcy and termination of investor funds. In corporations, the concept of bankruptcy is significant, and studies such as that by Altman (1968) and Altman (2013) have proposed models for predicting corporate bankruptcy based on financial rates. Altman et al. (2022) published one of the most recent articles on estimating the probability of SME default. Using financial indicators, management, employee, and payment behavioral variables, they proposed a new indicator (called the omega score) and enhanced the default predictions model. In addition, their model categorized SMEs into three categories: healthy, moderate risk, and high risk. The model was proposed using data from 2040 Croatian SMEs examining 164 variables. Recently, researchers have started to examine the performance of SMEs from different perspectives including stakeholder relationship management (SRM) (Dimitropoulos et al. 2019) and the influence of ethics and motivation (Koronios et al. 2019).
In many instances, however, the start-up may not require additional funding and will continue to operate independently without failing. Consequently, the probability of default is considered in this paper. The default of a start-up occurs when its founders recognize that they have failed to achieve their objectives and will no longer attempt to do so. Notably, a start-up’s lack of default status is not a positive display of its success, as a start-up may not be successful even if it has not defaulted and will continue by bootstrapping.
Start-up risk was determined using the SHELL (Software, Hardware, Environment, Live-ware, and People) method by Cantamessa et al. (2018). In this approach, the relationship between the model’s quadruple components and the start-up’s organizational dimension is crucial. The evaluation was based on information from “Autopsy.io” and “the CB Insights platform” containing data of 214 start-ups for which failure reports were available. It should be noted that the reasons for the failure of new businesses are based on the founders’ perspectives (Cantamessa et al. 2018). Marco van Gelderen et al. (2005) tracked 517 individuals who started a new business during a three-year period to examine the causes of start-up success and failure. Using logistic regression, the samples are analyzed. According to this study, the success criteria of one phase of product development may not apply to another phase, and the success criterion of a project in one phase may be the reason for its failure in the next phase. Polishchuk et al. (2019) presented a fuzzy model to evaluate the risk of environmental start-up projects in air transportation using twenty-one criteria divided into five sections. However, there was no relationship between the lifespan of the start-ups and the cause–effect relationships. Spoiala et al. (2020) presented a proper risk management procedure for a manufacturing start-up’s activities. The risk was calculated using the simple equation probability of failure multiplied by the severity of the impact of the risk factor. Furthermore, the advanced methods such as fuzzy systems could be used for risk assessment (Khanzadi et al. 2017); however, these methods are difficult for users to implement. Other models, such as artificial neural networks, necessitate extensive data experience and transparency.
In contrast, BNs are a method for graphically representing complex modeling of cause–effect relationships and analyzing data and expert knowledge regarding uncertainty. In addition, the graphical representation of this model can contribute to the evaluation of the relationship between variables and can be especially useful when combining objective and subjective data (Khanzadi et al. 2017).
BNs have been constructed using data- and knowledge-based methods. Data-based methods are developed based on existing data (Heckerman 1997), whereas knowledge-based approaches emphasize the significance of experts’ knowledge in building BNs. The knowledge-based approach is more effective when the knowledge domain is extremely complex, and data access is difficult (Nadkarni and Shenoy 2001). Ghasemi et al. (2018) introduced a method for modeling portfolio risk analysis utilizing BNs. Their model considers the connection and interdependence between risk factors. The risks associated with independent projects were analyzed, the portfolio-level risks were examined, and the probability of portfolio risk was estimated by using conditional probability distributions and BNs. Using BNs methodology, Yet et al. (2016) proposed an overall risk assessment structure to evaluate the project’s costs and benefits under various risk scenarios. This model also combines numerous causal factors such as the impact of budget constraints, uncertainty in cost estimation, time value of money, and risk. It was assumed that only one risk factor would be considered initially. If the risk estimates were higher or lower than the actual amount, the actual costs would be higher or lower than the estimates. Consequently, the estimated costs were modeled using the difference between actual and estimated risks.
As part of the cash flow analysis, a BNs model was then developed to determine the possible distribution of the key parameters. BNs were utilized by Kemmerer et al. (2002) for improved decision making in VCs to predict investment programs’ success. In addition, a causal map and a BNs technique were utilized to construct a causal Bayesian map. Hu et al. (2013) used BNs with causality constraints (BNCC) to analyze software development project risk. A Bayesian network model proposed by Akhavan et al. (2021) was evaluated for an early-stage innovative investment program. After identifying the risks affecting start-ups and forming their relationships based on experts’ opinions, the results were analyzed using conditional probabilities. Based on data from 247 questionnaires, the most significant risks were identified, and the risk assessment result was evaluated based on the degree of impact on net present value (NPV). However, this cannot fully capture the reality of most start-ups due to the asymmetrical nature of start-up returns and the insensitivity of traffic lights to respond to changes in the influencing variables. More importantly, they do not consider the effect of a start-up’s lifespan in their assessment.
The most important criteria for a practical and general SR assessment model can be summarized as follows:
- Developing a method for combining subjective and objective data (if available);
- The ability to model different types of risks such as industry-specific risks that are known and unknown risks;
- Considering the dynamic behavior of a start-up during its lifespan;
- Being adaptable enough to be implemented in any start-up in any industry.
3. Materials and Methods
Bayesian networks provide a mechanism to model complex relationship between uncertain variables. Combining subjective opinions with objective probabilities, probabilistic reasoning, reasoning with incomplete data, and capturing cause–consequence relationships are strong capabilities of BNs that make them suitable for start-up risk assessment.
This paper’s proposed framework for BNs is based on two-stage BNs adjustment. A prototype model was created in the first stage to capture essential risk factors, their various categories, and actual start-up conditions. The prototype model parameterizes the variables and their states to reflect the typical behavior of start-ups. In the second stage, an expert modified the prototype model to incorporate the specific information/conditions of the new start-up with the BNs model. Combining the start-ups’ general data with the new start-up’s specific condition enabled the model to estimate the probability of start-up default. The structure of the prototype model is explained next, and the model is then extended to other stages of a start-up’s lifespan.
3.1. Prototype Model of BNs
The prototype model described in the previous section aims to establish the general start-up environment. Because probability elicitation is typically challenging (Andersen et al. 2014), the prototype model assists experts in probability elicitation and reduces the mental biases of experts towards risk factors. It also provides a mechanism for experts to update their opinions based on the start-ups’ current state and helps them mitigate essential risk factors. It offers a general prediction analysis for a typical start-up. The process of general steps in designing the structure of the BNs and the initial adjustment of the required parameters are based on Fenton and Neil’s (2012) paper.
3.1.1. Identifying Risk Factors
Identification of risk factors is the first step in any risk assessment process. Various methods including brainstorming, document review, the Delphi method, and historical data are suggested for risk identification (Asdi and Basuki 2021). In recent years, numerous studies have attempted to identify SR in various environments and industries. Table 1 provides a summary of previous studies regarding risk factor identification.

Table 1.
Causes of start-up failure.
This study adopts the identified risk factors by Cantamessa et al. (2018) because they employed comprehensive and actual datasets from failed start-ups. Table 2 summarizes the key factors and their sub-factors used in this paper.
Table 2.
Failure factors of start-ups used in the proposed framework (Cantamessa et al. 2018).
3.1.2. The Network Architecture and Relationships between Risk Factors
It is recommended that, depending on the level of access to information, one of the following approaches be used to define relationships between risk factors and build the structure of the BNs:
- If the historical dataset of start-up default factors is complete, and access to the necessary information is possible, identifying clusters of failure factors whose simultaneous occurrence leads to failure and identifying each of these clusters as a key factor in the failure of start-ups using clustering methods is recommended (Paolo et al. 2014);
- In most cases, there is no suitable dataset for the clustering process; instead, an expert’s opinion is utilized to determine the relationships between risk factors.
Because it is assumed that there are no historical data regarding a new start-up, the second approach is utilized in this paper. In system reliability (Marvin Rausand et al. 2020), the “m out of n” structure is used to model the effect of simultaneous factors on total risk. Since a single factor rarely causes a start-up to default (Cantamessa et al. 2018), the occurrence of multiple factors can result in a start-up failing. In other words, the start-up is assumed to fail if at least “m” sub-factors occur simultaneously. The probability of failure for each key-factor subnetwork is calculated using Equation (1).
In Equation (1), “Risk(i,m)” represents the probability of failure for key factor(i), and “Risk(i,r)” denotes the probability of failure for key factor(i) if precisely “m from ni” subfactors occurred.
For example, Figure 1 shows one of the key factors of start-up failure (software factor). There are seven subfactors for the software factor and two failure state occurrence scenarios for each subfactor. Except for the “No product/market fit” and “No/wrong business model” subfactors, all other subfactors in both scenarios are identical. In the first scenario, the probability of “No product/market fit” is 12%, and the probability of “No/wrong business model” is 8%, but in the second scenario, the likelihood of both subfactors is 100%. Based on the structure “two of seven”, the probability of a software factor occurring in the first scenario is 4.8%, and the probability in the second scenario is 100%. (This means that at least two of the seven subfactors cause a total default.)
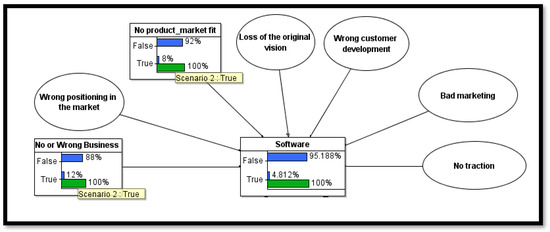
Figure 1.
The relationship between the key factor of software failure and its subfactors.
Because there are additional risk factors (the effect of unknown/unidentified factors), the “noisy-OR function” is used to calculate the effect of an unknown factor after calculating the probability of occurrence of each known key factor. The true value of noise is unknown in reality. Nonetheless, the optimal noise level can be adjusted based on the start-up environment, industry, and degree of ambiguity. Thus, Equation (2) is used to calculate the overall risk.
In Equation (2), it is assumed that the start-up will default “P(Risk Total=true|Risk(i,m)=true)=1” if any of the key factors for the default of “i” (when the P(leak) parameter is zero) occur. However, the measures of “P(Risk Total=true|Risk(i,m)=true)” can be altered for each key factor based on the initialization conditions. Figure 2 depicts the final prototype BNs for SR.
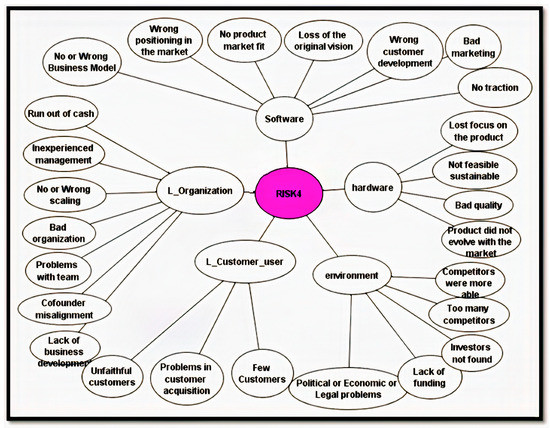
Figure 2.
BNs of assessing a start-up default in a lifespan period.
3.1.3. Assigning Node Probability Table to the Prototype Model
As shown in Appendix A, an expert modified the data from ref. (Cantamessa et al. 2018) using the prototype model presented in this paper. It summarizes the probability of the occurrence of each subfactor for each of the four start-up lifespan periods. For example, in the first row of the table, it is assumed that the probability of occurrence of the “No/wrong business model” subfactor in the software key factor is 12% in the first period (less than a year), 42% in the second period (between the second and third year), 23% in the third period (between the fourth and fifth year), and 11% in the fourth period (more than the fifth year). (These data are the input of the prototype BNs model for each subfactor.)
3.1.4. Lifespan Consideration
This consideration emphasizes that anthropomorphic analogy processes are distinct from firm aging processes. For instance, 50% of new ventures fail within three to four years of their founding (Coad 2016). As in Coad’s (2016) research, it is considered the start-ups experience different phases during their lifespan (Bocken and Snihur 2020); therefore, the survival rate of start-ups changes in stages. Each risk factor may influence the start-up default differently over time. In other words, the probability of a risk factor’s occurrence and its impact on a start-up may change as its phase progresses. For example, in the case of the “Product did not evolve with the market” risk subfactor, the product was initially designed based on the original market, but over time, the market requirement could change or even no longer correspond to the needs of current customers. As a result, the probability of this subfactor is lowest in the first period and rises in subsequent periods.
As depicted in Figure 3, a start-up has four distinct phases as described by Cantamessa et al. (2018) and Passaro et al. (2016). After estimating the probability of start-up default for each period (Risk1, Risk2, Risk3, Risk4), the overall default rate of start-ups from the current period forward is calculated (probability of non-survival). These are estimated using Equation (3).
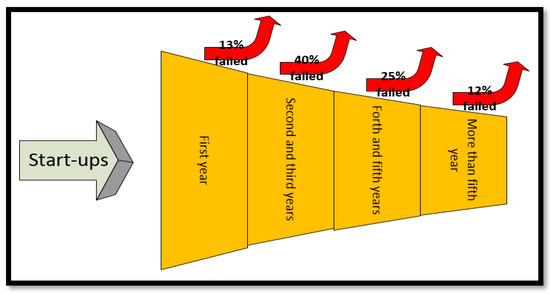
Figure 3.
Default rates of start-ups during their lifespan.
For example, in Equation (3), the overall default rate is estimated for a start-up in its third year by applying the equation FR = 1 − [(1 − Risk3)(1 − Risk4)] after predicting the probability of default for the third and fourth periods (Risk3 and Risk4). Lastly, as illustrated in Figure 3, the prior probability of default for each period for the prototype models Risk1, Risk2, Risk3, and Risk4 is set to 13%, 40%, 25%, and 12%, respectively.
3.2. Customizing the Prototype Model
The next step in estimating the risk of a new start-up is to tailor our assessment using a combination of expert opinions (observations in the BNs) and general provided knowledge about the probability of start-up default (i.e., prior probabilities in the prototype model).
4. Validation Framework and Discussion
In practice, achieving such a complete model validation may be challenging, especially if the model does not yet exist (Hillston 2017). A common reason for employing the BN model is the lack of data accessibility (Pitchforth and Mengersen 2013). The BNs model is believed to be suitable for risk assessment because most start-ups are new, and there is no confidence in historical data. There are three approaches to model validation: expert intuition, real system measurements (RSM), and theoretical results/analysis (TR/TA) (Hillston 2017). In this paper, the expert intuition validation method is utilized. RSM is not used, as it requires too much time for accurate system measurements. On the other hand, since there is no comparable risk assessment model with investor interaction, only the mathematical formulas of TR/TA models are presented. In addition, the three aspects including expert intuition should be considered during model validation: assumptions, input parameter values and distributions, output values, and conclusions (Hillston 2017).
4.1. Assumptions
There are two main assumptions:
- If any of the following key factors occur, the start-up will fail:
In this study, it is assumed that a set of minimum criteria, known as key factors, must exist for the survival of any start-up. Consequently, the start-up will default if any of them do not exist.
- The key factors occur if at least “m” of “n” subfactors eventuate:
The founders of start-ups typically attempt to find the solutions to solving the problems (risk factors) if the number of problems is insignificant. In other words, start-ups will be resilient to multiple risks. Moreover, start-up investors, such as venture capitalists, provide “know-how” support in addition to financial issues (Klonowski 2010) and can accept start-up risks based on their abilities in various areas. The “m” (sub-factor) parameter indicates the investor’s risk appetite.
4.2. Input Parameter Values
One of the experts’ challenges in risk assessment is estimating each risk factor. This article proposes creating a prototype model based on real historical data or using an average of all start-ups. Then, based on the expert opinion, the ratios of each risk factor between average and new start-ups are determined. This process produces input data with fewer outliers.
4.3. Output Values
The mathematical structure of the BNs model is first proposed to validate the model outputs. Case studies and sensitivity analysis will then be used to analyze the model outputs. Figure 4 depicts the mathematical structure of the BNs model. All formulas used in the BNs model are presented in this model.
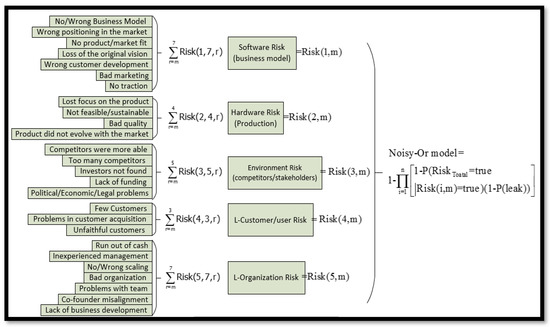
Figure 4.
Relationships between the main risks and the overall risk of start-up.
4.4. Receiver Operating Characteristic (ROC) Curve
For illustrating the estimation performance of the BN model, AUC-ROC was deployed. The greater area under the curve (AUC) indicates that the model has a greater explanatory power (Paraschiv et al. 2021). According to Paraschiv et al. (2021) and Altman et al. (2022), AUC ∈ [0.7, 0.8) is deemed acceptable, AUC ∈ [0.8, 0.9) is regarded as excellent, and AUC ≥ 0.9 is viewed as outstanding.
In order to build the ROC graph, the information of 30 startups was analyzed, and 17 of them with more than 4 years of age were selected. The result of the model in estimating their default was evaluated with (P(leak) = 0, m = 2). (The summary is specified in Appendix E.) The AUC of the model is equal to 0.76 and acceptable, as shown in (Figure 5).
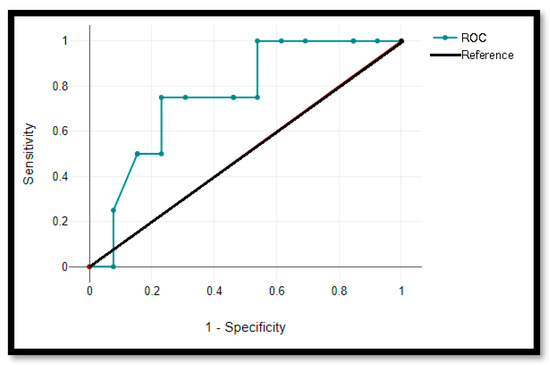
Figure 5.
ROC curve.
5. Case Studies and Results
The prototype model is meant to apply to any start-up (default rate). Upon evaluating a particular start, the model interacts with the user to customize the necessary inputs and parameters for estimating the specific default rate.
The model’s generalizability is demonstrated by presenting three case studies from distinct industry stages and risk appetite levels. Subsequently, the model’s results are evaluated to examine its behavior, as Pitchforth and Mengersen (2013) suggested. At the conclusion of each case study, the sensitivity analysis of the model output (i.e., the probability of failure in each period) relative to the selected critical parameters (i.e., m and P(leak) in Table 1 and Table 2) is assessed. The sensitivity analysis can be used to determine the most crucial risk factor to avoid default.
In addition, the diagnostic features of the model (backward reasoning) were used to revise the probability of “cause” nodes (risk factors in Figure 2) whenever an observation was entered into “consequence” nodes (risk node in Figure 2). In addition, it is demonstrated how an investor’s risk appetite can be modeled by setting the appropriate number of affecting risk factors for each key risk factor (parameter “m” in Figure 4).
5.1. Start-Up X (IT Field)
This is a start-up in information technology (IT) tasked with developing a new application. The start-up was founded three years ago. This system consists of three components: materials and equipment, human resources, and the housing market. The start-up has generated revenue but in an unstable manner. The start-up application for funding is currently being reviewed. The investor expert provided their opinion on the probability of failure after reviewing the feasibility studies report in Appendix B.
To adjust the unknown risk in the model, it uses experts’ opinions and considers the state of the IT industry, so the value of P(leak) is set at 15%, and the parameter “m” is set to two for all factors (known subfactors).
For sensitivity analysis of the impact of various factors in estimating the probabilities of BNs failure, the “m” factor of the structure “m from n” and the amount of the noise parameter (P(leak)) on the model outputs are used (Table 3). As shown in Table 3, the parameter “m” significantly impacts the probability of start-up default. In other words, the parameter “m” represents the risk appetite of the investment decision maker. The lower the value of “m” (m = 2), the more risk-averse the investor and vice versa.
Table 3.
The sensitivity analysis of the noise parameter and the structure “m from n” of start-up X.
After completing the BNs, the default probability for each period is estimated. Because the start-up is at the end of the second period (Risk1 = 0, Risk2 = 0), the model predicts the probability of default in the third and fourth periods to be Risk3 = 54% and Risk4 = 47%, respectively, and the overall default probability of this start-up to be FR = 75.85% based on Equation (3) (Table 3).
In many cases, investors and start-up founders seek to identify the factors that have the greatest impact on a start-up’s defaulting. To this end, sensitivity analysis is conducted. This enables them to prevent or reduce the incidence/impact of main risk factors via control or preventative measures.
Figure 6 displays the result of a sensitivity analysis of influencing factors on Risk3 in the form of a tornado graph.
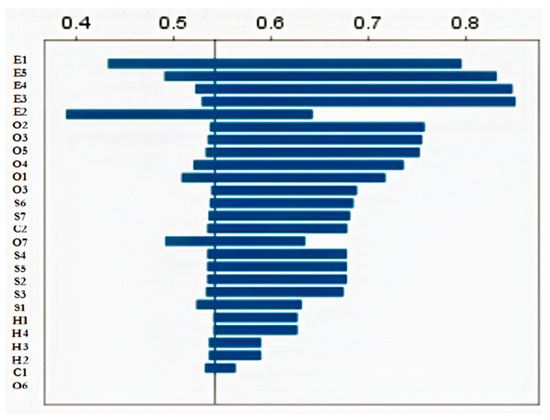
Figure 6.
Tornado graph for sensitivity analysis of the risk of start-up X—Risk3.
The top five significant subfactors identified were “competitors were more able”, “political/economic/legal problems”, “lack of funding”, “investors not found”, and “too many competitors”. The results demonstrate that environmental factors’ effects are greater than other factors, as the risk surrounding stakeholders and competitors is greater than in earlier stage. Therefore, the investee and investor should place more emphasis on the five factors.
From another point of view, the investors tend to reduce the risk of the third period (assumed to be about 46.6%). However, they cannot decrease the environment, user/customer, and software risk factors (red box). As a result, other key factors (blue box) and sub-factors (white box) should be changed. Using the back propagation feature of BNs (Fenton and Neil 2012), each sub-factor is determined as shown in Figure 7.
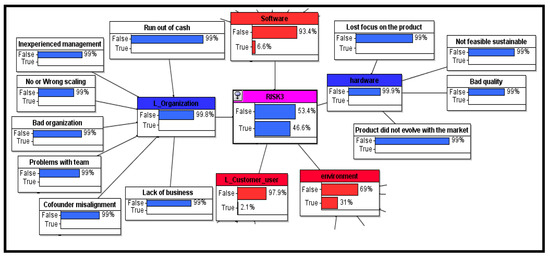
Figure 7.
Back propagation BNs for start-up X.
5.2. Start-Up Y (Fintech Field)
This payment and money-transfer services start-up was founded more than a year ago. It links the entire system by removing human intervention and intermediary factors between buyers, sellers, and the banking system. This start-up was founded by three young entrepreneurs and currently has two major competitors. The start-up generates no significant revenue. The funding request for a start-up is under review. The expert’s assessment of the probability of default, as summarized in Appendix C, was based on a review of the feasibility study report.
To adjust the unknown risk in the model, according to the opinions of experts and considering the current state of the fintech industry, it is unnecessary to use unknown risk, and the value of P(leak) is 0%. “m = 2” is set as the parameter for combining known subfactors.
The sensitivity analysis of the changes of the “m” factor of the structure “m from n” and the amount of the noise parameter (P(leak)) on the model outputs are used to evaluate the effect of various factors on the estimation of the default probabilities of BNs (Table 4). As shown in Table 4, the parameter “m” substantially affects the probability of a start-up default.
Table 4.
The sensitivity analysis of noise parameter and “m from n” structure of start-up Y.
After completing the BNs, the default probability for each period is estimated. Since the start-up is currently at the end of the first period (Risk1 = 0), the model predicts that the probability of default in the second, third, and fourth periods is 30%, 19%, and 20%, respectively. Based on Equation (3), the overall default probability of the start-up is predicted to be FR = 54.4% (Table 4).
Figure 8 depicts the result of the sensitivity analysis of influencing factors on Risk2 in the form of a tornado graph. The top five significant subfactors are “No/wrong scaling”, “poor organization”, “inexperienced management”, and “lack of business development”, respectively. In this start-up, the five most important subfactors are subfactors of the organizational key factor (human factors). These results indicate that because the founder of a start-up was young, the investor should be able to improve the human factors relevant to the start-up founders. Consequently, start-up founders or investors should pay more attention to the organizational key factor, especially in the second period.
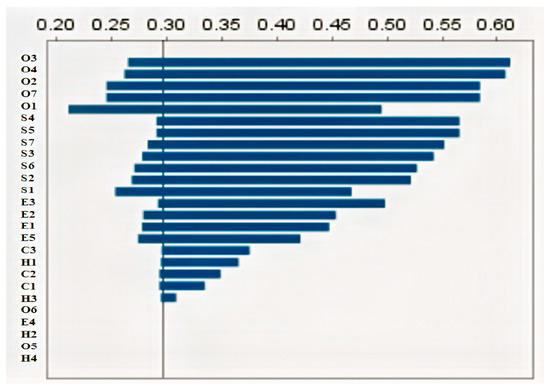
Figure 8.
Tornado graph for sensitivity analysis of the risk of start-up Y—Risk2.
5.3. Start-Up Z (Telecom Field)
This start-up is active in the telecommunications industry. The E-learning service was introduced four years ago. It provides the E-learning environment of classrooms or meetings for companies, universities, or educational institutes. One of the start-up’s strengths is a platform that provides a customized E-learning environment. The start-up was self-funded and currently has a positive cash flow, but it needed to develop its infrastructure, including servers. The expert’s assessment of the probability of default, as summarized in Appendix D, was formulated after reviewing the feasibility report. Because there are few unidentified risk factors, the P(leak) is set at 10%.
The investor in start-up Z has a distinct risk appetite for each key factor. It can be more tolerant of environmental risk factors than software ones. Therefore, the environmental factor’s “m” factor is greater than the software factor’s “m” factor. In light of the investor’s risk appetite, “m” for the environmental factor equals four, “m” for the software factor equals two, “m” for the hardware factor equals three, “m” for the customer/user factor equals two, and “m” for the organization factor equals three. Since the start-up is in its fourth period (Risk1,2,3 = 0), the model predicts that the probability of default is 16% for Risk4. The overall default probability of this start-up is predicted as FR = 16% based on Equation (3). In the alternative scenario, the Risk4 and FR are 24% if “m” parameters for all factors equal 2.
Figure 9 depicts the result of the sensitivity analysis of influencing factors on Risk4 in the form of a tornado graph. The top five significant subfactors were “no traction”, “poor marketing”, “wrong customer development” and “wrong market positioning”, respectively. These risks pertain to the non-physical aspects of start-ups and encompass, from a business standpoint, all aspects aimed at ensuring the market success of the start-up’s services (Cantamessa et al. 2018). It appears that the risk associated with this start-up is low because it is in the middle of its life cycle.
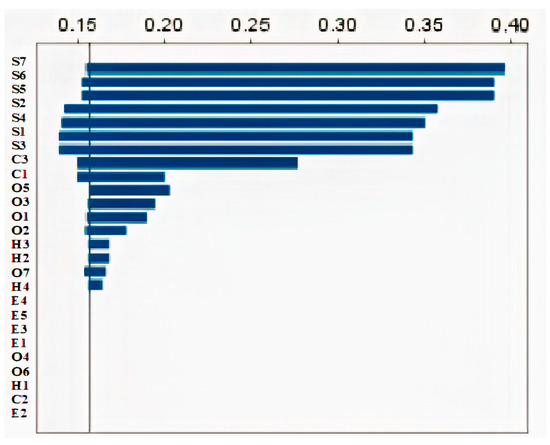
Figure 9.
Tornado graph for sensitivity analysis of the risk of start-up Z—Risk4.
5.4. Managerial Implications
Clearly, launching a new start-up involves a high degree of risk. The assessment of start-up risk is intricate, dynamic, and multidimensional. Various stakeholders are involved in the investment procedure, including venture capital managers, crowd-funding platform managers, angel investors, internal evaluators, and the start-up owner. The proposed framework integrates various information to aid decision makers. Internal evaluation and portfolio management are considered in the selection of start-ups. Consequently, it can assist investors in making more informed decisions, increase productivity, and reduce cognitive errors. In addition, by incorporating new evidence or data (observation), the framework refines or updates the default rate at various stages of a start-up’s development. This will provide a practical method for monitoring the investment process.
6. Conclusions
This study established a new framework based on Bayesian networks for estimating the probability of default for a new start-up. It captures important issues that must be considered, such as the combination of various factors and sources of uncertainty, the stage/age of a start-up, unknown risks, and the impact of investor risk appetite. The model’s applicability was discussed using three case studies. In each stage of a start-up’s life cycle, the model illustrates how the relative importance of risks and their effects can fluctuate. In addition, the model determines if investors wish to reduce a start-up’s default rate to a particular level and which factors should be altered. This will enable decision-makers in the VC industry to have a better and more accurate understanding of the start-up’s evolution, enabling them to make better decisions. To improve the explanatory power of the model in future research, additional empirical research is required to expand the model to specific industries and locations.
Moreover, combining the result of our estimation with portfolio credit risk models is recommended (Kemmerer 2006). Another aspect that can be added to the model is the impact of general support policies such as subsidies, anti-crisis funds, and grants on the survival of start-ups (Srhoj et al. 2019). Future research is encouraged to evaluate the effect of these circumstances on the model’s results.
Author Contributions
Conceptualization, M.V. and V.K.; methodology, M.V.; software, V.K. and M.V.; validation, M.V. and V.K., formal analysis, M.V.; investigation, M.V.; resources, M.V.; data curation, M.V.; writing—original draft preparation, M.V. and V.K.; writing—review and editing, V.K.; visualization, M.V.; supervision, V.K.; project administration, V.K.; funding acquisition, V.K. All authors have read and agreed to the published version of the manuscript.
Funding
This research was funded by the Iran National Science Foundation grant numbers [98017405].
Data Availability Statement
The data presented in this study are available in Appendix A, Appendix B, Appendix C, Appendix D and Appendix E.
Conflicts of Interest
The authors declare no conflict of interest. The funders had no role in the design of the study; in the collection, analyses, or interpretation of data; in the writing of the manuscript; or in the decision to publish the results.
Appendix A
Table A1.
Summary of data for elicitation of NPT for the prototype model.
Table A1.
Summary of data for elicitation of NPT for the prototype model.
| Key Risk Factors | Risk Subfactors | Node Probability Table for the Prototype Model (%) | |||
|---|---|---|---|---|---|
| Period 1 (year < 1) | Period 2 (1 ≤ year < 3) | Period 3 (3 ≤ year < 5) | Period 4 (year ≥ 5) | ||
| Software | No/wrong business model (S1) | 12 | 42 | 23 | 11 |
| Wrong positioning in the market (S2) | 2 | 11 | 7 | 9 | |
| No product/market fit (S3) | 8 | 23 | 9 | 9 | |
| Loss of the original vision (S4) | 4 | 4 | 0 | 0 | |
| Wrong customer development (S5) | 2 | 10 | 6 | 4 | |
| Bad marketing (S6) | 0 | 5 | 5 | 2 | |
| No traction (S7) | 10 | 5 | 5 | 2 | |
| Hardware | Lost focus on the product (H1) | 2 | 3 | 2 | 2 |
| Not feasible/sustainable (H2) | 2 | 1 | 2 | 6 | |
| Bad quality (H3) | 4 | 13 | 3 | 0 | |
| Product did not evolve with the market (H4) | 0 | 0 | 2 | 4 | |
| Environment | Competitors were more able (E1) | 2 | 11 | 12 | 9 |
| Too many competitors (E2) | 0 | 5 | 2 | 2 | |
| Investors not found (E3) | 4 | 6 | 6 | 0 | |
| Lack of funding (E4) | 0 | 8 | 9 | 9 | |
| Political/economic/legal problems (E5) | 8 | 5 | 2 | 2 | |
| Customer/user | Few customers (C1) | 2 | 8 | 7 | 4 |
| Problems in customer acquisition (C2) | 4 | 5 | 2 | 0 | |
| Unfaithful customers (C3) | 0 | 1 | 2 | 0 | |
| Organization | Ran out of cash (O1) | 12 | 19 | 16 | 6 |
| Inexperienced management (O2) | 6 | 3 | 0 | 4 | |
| No/wrong scaling (O3) | 2 | 10 | 6 | 11 | |
| Bad organization (O4) | 6 | 8 | 10 | 4 | |
| Problems with team (O5) | 4 | 8 | 6 | 2 | |
| Co-founder misalignment (O6) | 6 | 4 | 12 | 0 | |
| Lack of business development (O7) | 14 | 22 | 22 | 17 | |
Appendix B
Table A2.
The expert’s opinion about start-up X.
Table A2.
The expert’s opinion about start-up X.
| Risk Factors | Expert Opinion (%) | |||
|---|---|---|---|---|
| Period 1 | Period 2 | Period 3 | Period 4 | |
| No/wrong business model | 0 | 0 | 17 | 6 |
| Wrong positioning in the market | 0 | 0 | 5 | 1 |
| No product/market fit | 0 | 0 | 6 | 6 |
| Loss of the original vision | 0 | 0 | 5 | 5 |
| Wrong customer development | 0 | 0 | 5 | 5 |
| Bad marketing | 0 | 0 | 3 | 1 |
| No traction | 0 | 0 | 4 | 2 |
| Lost focus on the product | 0 | 0 | 1 | 1 |
| Not feasible/sustainable | 0 | 0 | 10 | 15 |
| Bad quality | 0 | 0 | 10 | 5 |
| Product did not evolve with the market | 0 | 0 | 1 | 3 |
| Competitors were more able | 0 | 0 | 30 | 32 |
| Too many competitors | 0 | 0 | 60 | 65 |
| Investors not found | 0 | 0 | 4 | 0 |
| Lack of funding | 0 | 0 | 6 | 5 |
| Political/economic/legal problems | 0 | 0 | 15 | 15 |
| Few customers | 0 | 0 | 30 | 27 |
| Problems in customer acquisition | 0 | 0 | 5 | 5 |
| Unfaithful customers | 0 | 0 | 2 | 0 |
| Ran out of cash | 0 | 0 | 16 | 6 |
| Inexperienced management | 0 | 0 | 2 | 2 |
| No/wrong scaling | 0 | 0 | 3 | 5 |
| Bad organization | 0 | 0 | 10 | 4 |
| Problems with team | 0 | 0 | 4 | 1 |
| Co-founder misalignment | 0 | 0 | 0 | 0 |
| Lack of business development | 0 | 0 | 35 | 20 |
Appendix C
Table A3.
The expert’s opinion about start-up Y.
Table A3.
The expert’s opinion about start-up Y.
| Risk Factors | Expert Opinion (%) | |||
|---|---|---|---|---|
| Period 1 | Period 2 | Period 3 | Period 4 | |
| No/wrong business model | 0 | 20 | 16 | 7 |
| Wrong positioning in the market | 0 | 11 | 7.4 | 8.8 |
| No product/market fit | 0 | 7 | 2 | 3 |
| Loss of the original vision | 0 | 2 | 0 | 0 |
| Wrong customer development | 0 | 2 | 1 | 0 |
| Bad marketing | 0 | 10 | 9 | 5 |
| No traction | 0 | 5 | 4.6 | 2.2 |
| Lost focus on the product | 0 | 20 | 1.8 | 2.2 |
| Not feasible/sustainable | 0 | 0 | 0 | 0 |
| Bad quality | 0 | 10 | 2 | 0 |
| Product did not evolve with the market | 0 | 0 | 0 | 0 |
| Competitors were more able | 0 | 11 | 11.6 | 8.8 |
| Too many competitors | 0 | 10 | 3 | 5 |
| Investors not found | 0 | 2 | 1 | 0 |
| Lack of funding | 0 | 0 | 0 | 0 |
| Political/economic/legal problems | 0 | 15 | 5 | 2 |
| Few customers | 0 | 7 | 7.4 | 4.4 |
| Problems in customer acquisition | 0 | 5 | 1.8 | 0 |
| Unfaithful customers | 0 | 1 | 1.8 | 0 |
| Ran out of cash | 0 | 30 | 20 | 9 |
| Inexperienced management | 0 | 15 | 5 | 20 |
| No/wrong scaling | 0 | 9 | 5.5 | 10.45 |
| Bad organization | 0 | 10 | 15 | 6 |
| Problems with team | 0 | 0 | 0 | 0 |
| Co-founder misalignment | 0 | 0 | 0 | 0 |
| Lack of business development | 0 | 15 | 21.8 | 20 |
Appendix D
Table A4.
The expert’s opinion about start-up Z.
Table A4.
The expert’s opinion about start-up Z.
| Risk Factors | Expert Opinion (%) | |||
|---|---|---|---|---|
| Period 1 | Period 2 | Period 3 | Period 4 | |
| No/wrong business model | 0 | 0 | 0 | 9 |
| Wrong positioning in the market | 0 | 0 | 0 | 7 |
| No product/market fit | 0 | 0 | 0 | 9 |
| Loss of the original vision | 0 | 0 | 0 | 8 |
| Wrong customer development | 0 | 0 | 0 | 2 |
| Bad marketing | 0 | 0 | 0 | 2 |
| No traction | 0 | 0 | 0 | 1 |
| Lost focus on the product | 0 | 0 | 0 | 0 |
| Not feasible/sustainable | 0 | 0 | 0 | 10 |
| Bad quality | 0 | 0 | 0 | 10 |
| Product did not evolve with the market | 0 | 0 | 0 | 15 |
| Competitors were more able | 0 | 0 | 0 | 10 |
| Too many competitors | 0 | 0 | 0 | 0 |
| Investors not found | 0 | 0 | 0 | 2 |
| Lack of funding | 0 | 0 | 0 | 1 |
| Political/economic/legal problems | 0 | 0 | 0 | 1 |
| Few customers | 0 | 0 | 0 | 15 |
| Problems in customer acquisition | 0 | 0 | 0 | 0 |
| Unfaithful customers | 0 | 0 | 0 | 6 |
| Ran out of cash | 0 | 0 | 0 | 4 |
| Inexperienced management | 0 | 0 | 0 | 11 |
| No/wrong scaling | 0 | 0 | 0 | 4 |
| Bad organization | 0 | 0 | 0 | 0 |
| Problems with team | 0 | 0 | 0 | 1 |
| Co-founder misalignment | 0 | 0 | 0 | 0 |
| Lack of business development | 0 | 0 | 0 | 25 |
Appendix E
Table A5.
ROC data.
Table A5.
ROC data.
| Start-Ups | 1 | 2 | 3 | 4 | 5 | 6 | 7 | 8 | 9 | 10 | 11 | 12 | 13 | 14 | 15 | 16 | 17 |
|---|---|---|---|---|---|---|---|---|---|---|---|---|---|---|---|---|---|
| Variable | 0.39 | 0.31 | 0.2 | 0.15 | 0.29 | 0.32 | 0.21 | 0.43 | 0.19 | 0.32 | 0.2 | 0.23 | 0.45 | 0.48 | 0.43 | 0.38 | 0.34 |
| Classification variable | 0 | 0 | 0 | 0 | 1 | 0 | 0 | 1 | 0 | 0 | 0 | 0 | 1 | 0 | 0 | 1 | 0 |
References
- Akhavan, Mina, Mohammad Vahid Sebt, and Mariam Ameli. 2021. Risk assessment modeling for knowledge based and startup projects based on feasibility studies: A Bayesian network approach. Knowledge-Based Systems 222: 106992. [Google Scholar] [CrossRef]
- Altman, Edward I. 1968. Financial ratios, discriminant analysis and the prediction of corporate bankruptcy. The Journal of Finance 23: 589–609. [Google Scholar] [CrossRef]
- Altman, Edward I. 2013. Predicting financial distress of companies: Revisiting the Z-score and ZETA® models. In Handbook of Research Methods and Applications in Empirical Finance. Cheltenham: Edward Elgar Publishing. [Google Scholar]
- Altman, Edward I., Marco Balzano, Alessandro Giannozzi, and Stjepan Srhoj. 2022. Revisiting SME default predictors: The Omega Score. Journal of Small Business Management, 1–35. [Google Scholar] [CrossRef]
- Andersen, Steffen, John Fountain, Glenn W Harrison, and E. Elisabet Rutström. 2014. Estimating subjective probabilities. Journal of Risk and Uncertainty 48: 207–29. [Google Scholar] [CrossRef]
- Asdi, Ridzky, and Minto Basuki. 2021. Risk management in shipbuilding using bayesian network with noisy-or. Paper presented at the IOP Conference Series: Materials Science and Engineering, Volume 1010, the 2nd International Conference on Advanced Engineering and Technology (ICATECH 2020), Surabaya, Indonesia, September 26, vol. 1010, No. 1. p. 012038. [Google Scholar]
- Aven, Terje. 2011. Misconceptions of Risk. Hoboken: John Wiley & Sons. [Google Scholar]
- Bamford, Charles E., and Edward B. Douthett, Jr. 2013. Venture capital and risk management: Evidence from initial public offerings. Journal of Managerial Issues 220–40. [Google Scholar] [CrossRef]
- Bednár, Richard, and Natália Tarišková. 2017. Indicators of startup failure. Industry 4.0 2: 238–40. [Google Scholar]
- Bocken, Nancy, and Yuliya Snihur. 2020. Lean Startup and the business model: Experimenting for novelty and impact. Long Range Planning 53: 101953. [Google Scholar] [CrossRef]
- Cantamessa, Marco, Valentina Gatteschi, Guido Perboli, and Mariangela Rosano. 2018. Startups’ roads to failure. Sustainability 10: 2346. [Google Scholar] [CrossRef]
- Cbinsights. 2016. The Top 20 Reasons Startups Fail. Available online: https://www.cbinsights.com (accessed on 18 February 2018).
- Chang, Kuei-Hu, and Ching-Hsue Cheng. 2010. A risk assessment methodology using intuitionistic fuzzy set in FMEA. International Journal of Systems Science 41: 1457–71. [Google Scholar] [CrossRef]
- Coad, Alex. 2016. Firm age: A survey. Journal of Evolutionary Economics 28: 13–43. [Google Scholar] [CrossRef]
- Dimitropoulos, Panagiotis, Konstantinos Koronios, Alkis Thrassou, and Demetris Vrontis. 2019. Cash holdings, corporate performance and viability of Greek SMEs. EuroMed Journal of Business 15: 333–48. [Google Scholar] [CrossRef]
- Fenton, Norman, and Martin Neil. 2012. Risk Assessment and Decision Analysis with Bayesian Networks. Boca Raton: CRC Press. [Google Scholar]
- Ghasemi, Foroogh, Mohammad Hossein Mahmoudi Sari, Vahidreza Yousefi, Reza Falsafi, and Jolanta Tamošaitienė. 2018. Project Portfolio Risk Identification and Analysis, Considering Project Risk Interactions and Using Bayesian Networks. Sustainability 10: 1609. [Google Scholar] [CrossRef]
- Gonçalves, Vítor Sérgio, Francisco Vitorino Martins, and Elísio Brandão. 2014. The Determinants of Credit Default on Start-Up Firms. Econometric Modeling using Financial Capital, Human Capital and Industry Dynamics Variables. No. 534. Working Papers. Porto: School of Economics and Management, University of Porto. Available online: http://wps.fep.up.pt/wps/wp534.pdf (accessed on 29 January 2023).
- Guan, Li, Alireza Abbasi, and Michael J. Ryan. 2021. A simulation-based risk interdependency network model for project risk assessment. Decision Support Systems 148: 113602. [Google Scholar] [CrossRef]
- Hansson, Sven Ove. 2009. Risk and safety in technology. In Philosophy of Technology and Engineering Sciences. Amsterdam: Elsevier, pp. 1069–102. [Google Scholar]
- Heckerman, David. 1997. Bayesian networks for data mining. Data Mining and Knowledge Discovery 1: 79–119. [Google Scholar] [CrossRef]
- Hillston, Jane. 2017. Performance Modelling—Lecture 16: Model Validation and Verification. Edinburgh: School of Informatics, The University Edinburgh. [Google Scholar]
- Hu, Yong, Xiangzhou Zhang, E. W. T. Ngai, Ruichu Cai, and Mei Liu. 2013. Software project risk analysis using Bayesian networks with causality constraints. Decision Support Systems 56: 439–49. [Google Scholar] [CrossRef]
- Junchen, Li, Xiucheng Dong, Mikael Höök, Jian Gao, and Shiqun Li. 2013. Risk evaluation of technology innovation in China’s oil and gas industry. International Journal of Global Energy Issues 36: 1–12. [Google Scholar] [CrossRef]
- Keizer, Jimme, and Jan-Peter Vos. 2003. Diagnosing Risks in New Product Development. Eindhoven: Eindhoven Centre for Innovation Studies. [Google Scholar]
- Kemmerer, Andreas. 2006. A Model to Measure Portfolio Risks in Venture Capital. SSRN 847065. Available online: https://papers.ssrn.com/sol3/papers.cfm?abstract_id=847065 (accessed on 18 February 2018).
- Kemmerer, Benedict, Sanjay Mishra, and Prakash P. Shenoy. 2002. Bayesian causal maps as decision aids in venture capital decision making: Methods and applications. In Academy of Management Proceedings. New York: Briarcliff Manor, vol. 2002, No. 1. pp. C1–C6. [Google Scholar] [CrossRef]
- Khanzadi, Mostafa, Ehsan Eshtehardian, and Mahdiyar Mokhlespour Esfahani. 2017. Cash flow forecasting with risk consideration using Bayesian Belief Networks (BBNS). Journal of Civil Engineering and Management 23: 1045–59. [Google Scholar] [CrossRef]
- Khodakarami, Vahid, and Abdollah Abdi. 2014. Project cost risk analysis: A Bayesian networks approach for modeling dependencies between cost items. International Journal of Project Management 32: 1233–45. [Google Scholar] [CrossRef]
- Klonowski, Darek. 2010. The Venture Capital Investment Process. New York: Palgrave Macmillan. [Google Scholar] [CrossRef]
- Koronios, Konstantinos, Athanasios Kriemadis, Panagiotis Dimitropoulos, and Andreas Papadopoulos. 2019. A values framework for measuring the influence of ethics and motivation regarding the performance of employees. Business & Entrepreneurship Journal 8: 1–19. [Google Scholar]
- Li, Xiaoyang, and Iftekhar Hasan. 2020. VC Participation and failure of startups: Evidence from P2P lending platforms in China. Finance Research Letters 40: 101726. [Google Scholar] [CrossRef]
- Luppino, Ricky, M Reza Hosseini, and Raufdeen Rameezdeen. 2014. Risk management in research and development (R&D) projects: The case of South Australia. Asian Academy of Management Journal 19: 67–85. [Google Scholar]
- Nadkarni, Sucheta, and Prakash P. Shenoy. 2001. A Bayesian network approach to making inferences in causal maps. European Journal of Operational Research 128: 479–98. [Google Scholar] [CrossRef]
- Paolo, Cavanna, Caron Franco, and Fratoni Filippo. 2014. Risk Dependency Analysis (RDA) in Complex Projects. Wiley StatsRef: Statistics Reference Online 1–11. [Google Scholar] [CrossRef]
- Paraschiv, Florentina, Markus Schmid, and Ranik Raaen Wahlstrøm. 2021. Bankruptcy Prediction of Privately Held SMEs Using Feature Selection Methods. Available online: https://www.alexandria.unisg.ch/266620/1/Bankruptcy%20Prediction%20of%20Privately%20Held%20SMEs.pdf (accessed on 29 October 2022).
- Passaro, Renato, Ivana Quinto, Pierluigi Rippa, and Antonio Thomas. 2016. The start-up lifecycle: An interpretative framework proposal. In RSA AiIG (XVII Annual Scientific Meeting of the Italian Association of Management Engineering). Bergamo: Higher Education and Socioeconomic Development, pp. 1–25. [Google Scholar]
- Pena, Inaki. 2002. Intellectual capital and business start-up success. Journal of Intellectual Capital 3: 180–98. [Google Scholar] [CrossRef]
- Pitchforth, Jegar, and Kerrie Mengersen. 2013. A proposed validation framework for expert elicited Bayesian Networks. Expert Systems with Applications 40: 162–67. [Google Scholar] [CrossRef]
- Polishchuk, Volodymyr, Miroslav Kelemen, Beáta Gavurová, Costas Varotsos, Rudolf Andoga, Martin Gera, John Christodoulakis, Radovan Soušek, Jaroslaw Kozuba, and Peter Blišťan. 2019. A fuzzy model of risk assessment for environmental start-up projects in the air transport sector. International Journal of Environmental Research and Public Health 16: 3573. [Google Scholar] [CrossRef]
- Proksch, Dorian, Wiebke Stranz, Andreas Pinkwart, and Michael Schefczyk. 2016. Risk management in the venture capital industry: Managing risk in portfolio companies. The Journal of Entrepreneurial Finance (JEF) 18: 1–33. [Google Scholar] [CrossRef]
- Rausand, Marvin, Anne Barros, and Arnljot Hoyland. 2020. System Reliability Theory: Models, Statistical Methods, and Applications, 3rd ed. Hoboken: Wiley. [Google Scholar]
- Rudnik, Katarzyna, and Anna Małgorzata Deptuła. 2015. System with probabilistic fuzzy knowledge base and parametric inference operators in risk assessment of innovative projects. Expert Systems with Applications 42: 6365–79. [Google Scholar] [CrossRef]
- Spoiala, Angela, Dana Deselnicu, Anton Ficai, and Ecaterina Andronescu. 2020. Risk Assessment in a Startup Company. FAIMA Business & Management Journal 8: 56–63. [Google Scholar]
- Srhoj, Stjepan, Bruno Škrinjarić, and Sonja Radas. 2019. Bidding against the odds? The impact evaluation of grants for young micro and small firms during the recession. Small Business Economics 56: 83–103. [Google Scholar] [CrossRef]
- Statista. 2022. Value of Venture Capital Investment in the U.S. 2006–2021. Hamburg: Statista Research Department. [Google Scholar]
- Tian, Donghong, Bowen Yang, Junhua Chen, and Yi Zhao. 2018. A multi-experts and multi-criteria risk assessment model for safety risks in oil and gas industry integrating risk attitudes. Knowledge-Based Systems 156: 62–73. [Google Scholar] [CrossRef]
- Tiessen, James H. 1997. Individualism, collectivism, and entrepreneurship: A framework for international comparative research. Journal of Business Venturing 12: 367–84. [Google Scholar] [CrossRef]
- Trabelsi, Donia, and Baran Siyahhan. 2020. Startup cash flows and venture capital investments: A real options approach. Managerial and Decision Economics 42: 737–50. [Google Scholar] [CrossRef]
- van Gelderen, Marco, Roy Thurik, and Niels Bosma. 2005. Success and Risk Factors in the Pre-Startup Phase. Small Business Economics 24: 365–80. [Google Scholar] [CrossRef]
- Yet, Barbaros, Anthony Constantinou, Norman Fenton, Martin Neil, Eike Luedeling, and Keith Shepherd. 2016. A Bayesian network framework for project cost, benefit and risk analysis with an agricultural development case study. Expert Systems with Applications 60: 141–55. [Google Scholar] [CrossRef]
- Yin, Hengbin, Zhuo Chen, Yi Xiao, Muhammad Mohsin, and Zhen Liu. 2022. A study on the assessment of risk management performance in maritime start-ups: Evidence from China. Maritime Policy & Management, 1–15. [Google Scholar] [CrossRef]
Disclaimer/Publisher’s Note: The statements, opinions and data contained in all publications are solely those of the individual author(s) and contributor(s) and not of MDPI and/or the editor(s). MDPI and/or the editor(s) disclaim responsibility for any injury to people or property resulting from any ideas, methods, instructions or products referred to in the content. |
© 2023 by the authors. Licensee MDPI, Basel, Switzerland. This article is an open access article distributed under the terms and conditions of the Creative Commons Attribution (CC BY) license (https://creativecommons.org/licenses/by/4.0/).