Article

The Effect of Short-Sale Restrictions on Corporate Managers

1
HSBC Business School, Peking University, University Town, Nanshan District, Shenzhen 518055, China
2
Krannert Graduate School of Management, Purdue University, 403 West State Street, West Lafayette, IN 47907, USA
3
Department of Finance, College of Business, Florida State University, 821 Academic Drive, Tallahassee, FL 32306, USA
*
Author to whom correspondence should be addressed.
J. Risk Financial Manag. 2023, 16(11), 486; https://doi.org/10.3390/jrfm16110486
Submission received: 25 September 2023 / Revised: 10 November 2023 / Accepted: 13 November 2023 / Published: 17 November 2023

Abstract

:
This paper studies the effect of short selling on corporate managers from 2002 through 2010. We examine how the exemption of short-sale uptick tests due to the Regulation SHO pilot program affects managers’ decisions to abandon value-reducing acquisition attempts. We find that when deciding whether to abandon value-reducing acquisition attempts during the program, managers of pilot firms, whose stocks are less subject to short-selling impediments, are more sensitive to stock price changes than managers of nonpilot firms. We find no difference in managers’ sensitivity prior to nor post SHO. These results indicate that, despite their dislike of short sellers, managers believe that the level of informativeness from capital markets is superior when short sellers are less impeded.
JEL Classification:
G14; G18; G30; G34

1. Introduction

A maintained virtue of a market economy is that market prices provide valuable information to decision makers and that decision makers take this information into account when making decisions. An important class of decision makers is corporate managers, and an important source of price information for these corporate managers is the firm’s stock price. Theoretically, as managers reveal new information about corporate decisions, the stock market reacts, and managers adjust appropriately to this new information. Such a perspective relies on the presumption that market prices are reliable signals that incorporate information reasonably well.
Potentially important to the reliability of market prices are stock short sellers. Short sellers search for information and, when they come upon information that indicates a stock is overpriced, take a position that accords with that view. Empirical studies support the proposition that short sellers, on average, carry out informed trades and managers take in and learn from prices.1 Nevertheless, the actions of short sellers often arouse the ire of managers whose firms become the targets of short selling. An illustrative example comes from Elon Musk, the CEO of Tesla: “[t]hey’re constantly trying to make up false rumors and amplify any negative rumors. It’s a really big incentive to lie and attack my integrity”.2 But that perspective leads to a conundrum: managers rely on price signals, short sellers provide more informative prices, and managers loathe short sellers—do managers ignore the price information provided by short sellers?
In this study, we address that question in the context of corporate takeover attempts when there is a restriction on the role of short sellers. Consider the decision process of an acquiring firm’s manager of whether to pursue or abandon a proposed acquisition. Prior to the announcement of the acquisition attempt, the acquiring firm’s manager forms their expectation of the net present value (henceforth, NPV) of the acquisition. Presumably, managers initiate an acquisition attempt only when the calculated NPV of the acquisition is positive. At the attempt announcement, the stock market reacts, and the price change of the acquiring firm’s stock is observed by the manager.
When the stock price change is positive, the manager continues to pursue the acquisition. When the stock price change is negative, the manager may reconsider the opportunity and may choose to discontinue the acquisition effort. In part, the manager’s decision depends upon the credibility of the information conveyed by the price signal. If short selling is unimpeded and the manager views short sellers as informed traders, the manager may assign more weight to the price changes than when short selling is impeded. That is, given all else equal, managers may be more likely to discontinue a takeover attempt when the stock price change is more negative and short selling is unimpeded. The alternative, of course, is that managers do not believe that short sellers are more informed and therefore, short sellers, whether constrained or not, do not play a role in the decision-making process of managers.
The setting of our empirical study is a randomized experiment on short selling activities in the US equity markets: the Rule 202T pilot program of Regulation SHO, in which stocks in the Russell 3000 index were ranked by trading volume within each exchange, and every third stock was designated as a pilot stock. From 2 May 2005 to 6 July 2007, pilot stocks were exempt from the tick test for exchange-listed stocks and the bid test for NASDAQ stocks (henceforth, collectively, uptick tests). The exemption from the short-sale uptick tests exogenously eliminated these impediments to short selling in a randomly chosen set of pilot stocks during the program.3 The short-sale uptick tests remained in place for nonpilot stocks during this time period. After 6 July 2007, the SEC eliminated short-sale uptick tests for all exchange-listed stocks.
This setting gives rise to three time periods over which we conduct our tests. The first we label as the pre-SHO period, the second as the SHO period, and the third as the post-SHO period. The first period encompasses 1 January 2002–1 May 2005; the second encompasses 2 May 2005–6 August 2007; and the third encompasses 7 August 2007–31 December 2010. During the pre-SHO period, short sellers in all stocks were subject to the uptick tests. During the SHO period, only short sellers in nonpilot stocks were subject to the uptick tests. During the post-SHO period, short sellers in no stocks were subject to the uptick tests. This setting allows for a comparison of the difference between managers of pilot and nonpilot firms in their sensitivity to stock price changes in making the decision to abandon (or complete) their proposed acquisitions when short sellers are impeded and unimpeded by the uptick tests in participating in the price setting process.
We examine the question in a linear probability regression analysis using 756 proposed acquisitions, each with a transaction value of at least USD 100 million and each of which was accompanied by a negative stock price reaction at its announcement during the period of 1 January 2002 and 31 December 2010. The dependent variable in our analysis is whether the proposed acquisition is abandoned (or not). The key independent variables are the acquiring firm’s stock price changes at the announcement of the acquisition attempt (i.e., the acquiring firm’s 3-day announcement period CAR), an indicator that is assigned the value of one if the acquiring firm’s stock is a pilot stock, an indicator that is assigned the value of one if the acquisition is announced during the SHO period, and, importantly, the interaction of these three variables.
To begin, we find that proposed value-reducing acquisitions4 are more likely to be abandoned if the stock price reaction is more negative at the announcement of the proposed transaction. That is, we find, as do others, that managers are sensitive to the stock price reaction in making the decision to abandon value-reducing acquisition attempts.5
We further find that, during the pre-SHO period, the sensitivity to stock price changes in making the decision to abandon value-reducing acquisition attempts is not different between managers of pilot and nonpilot firms. That is, during this period in which the short selling of all stocks was impeded by the uptick tests, managers of pilot and nonpilot firms are equally sensitive to stock price reactions in assessing whether to abandon value-reducing acquisition attempts.
In contrast, during the SHO period, in making that decision, managers of pilot firms are more sensitive to stock price changes than are managers of nonpilot firms. In particular, the coefficient of the triple interaction term is negative and statistically significant with a p-value less than 0.01. The significance of this variable indicates that managers are more sensitive to stock price changes when short selling is less impeded. To be more emphatic, in making potentially critical decisions about major acquisition attempts, managers are more sensitive to the stock price reaction when short sellers are more likely to be playing a role in the price setting process. Considering that the average likelihood of the abandonment of value-reducing acquisition attempts during the full sample period is 4.23% and, holding constant the acquiring firm’s announcement period CAR at its mean of −3.81%, managers of pilot firms are 7.95% more likely to abandon the proposed acquisitions than nonpilot firms during the SHO period compared to the pre-SHO period.
In sum, despite managers’ dislike for short sellers, they are more, rather than less, sensitive to price changes when short sellers are less impeded in playing a role in the price setting process. This relation provides evidence that short-selling restrictions could have significant implications for managers in their decision-making process.
In addition, we find that managers of pilot firms are more likely to abandon value-reducing acquisition attempts during the SHO period than the managers of nonpilot firms when the target is in an industry that is different from the acquirer’s industry or when the target is a high-tech firm. We further find that managers of pilot firms with stronger shareholder rights are more sensitive to the stock price reaction in making the decision to abandon value-reducing acquisition attempts during the SHO period than the managers of nonpilot firms.6
In all, our further examinations of managers’ sensitivity to the stock price reaction in the decision to abandon (or complete) value-reducing acquisition attempts based either on the type of target or on the corporate governance of the acquirer indicate that when short sellers are less impeded in the price setting process, managers are more sensitive to stock price reactions in their decisions to abandon (or complete) an acquisition when the acquirer’s operations are different from those of the target or when the acquirer is guided by stronger corporate governance.
To put our study in context, we view our investigation as being related to two lines of prior research. Firstly, our study relates to the literature on the corporate governance role of short sellers. This literature includes Massa et al. (2015), Fang et al. (2016), He et al. (2023), and Chang et al. (2019). These studies consider managers’ perception of the latent threat of potential short sellers and whether that perception of that threat influences managerial actions. Our study focuses on managers’ perception of the manifest effect of short sellers on stock price and whether that perception of manifest short sales influences managerial actions; that is, are managers more likely to learn from stock price movements when short sellers are more likely to play a role in the price setting process? We find that they are.
Secondly, our study relates to a set of studies that investigate the ways in which managers take actions to obstruct short selling of their firm’s shares. This literature includes Lamont (2012), Ljungqvist and Qian (2016), and Engelberg et al. (2018). In contrast, our study provides evidence, perhaps the first, that managers, despite their professed distrust of short sellers, are sensitive to the price information provided by short sellers in making corporate decisions.
The remainder of the paper is organized as follows. The next section sets forth the hypothesis to be tested. Section 3 describes the sample and provides the sources of the data used in the empirical analysis. Section 4 presents the primary empirical results. Section 5 presents robustness tests. Section 6 addresses the concerns raised by Litvak et al. (2020) and Heath et al. (2023) about the use of SHO as a setting for quasi-natural experiment of short selling activities. Section 7 summarizes and concludes the study.

2. Hypothesis Development

Prior studies report that a manager’s decision to abandon a proposed corporate acquisition is negatively correlated with the stock price reaction at the announcement of the proposed acquisition (Luo 2005; Chen et al. 2007; Kau et al. 2008; Masulis et al. 2009). The more negative the stock price reaction, the more likely the proposed acquisition is to be abandoned. The common interpretation of this result is that managers “listen to the market” when deciding whether to abandon (or complete) their proposed acquisitions. The question that we address here is whether managers are more (or less) likely to listen to the market when short sellers are less impeded in playing a role in the price setting process.
On the one hand, the sentiments expressed by Elon Musk and similarly inclined CEOs lead to the conclusion that “lying” short sellers are not to be trusted. It is a short step from there to the implication that stock prices set, in part, by the unimpeded trading of short sellers are less informative than when short sellers’ trading activities are impeded, and from there it is a short step to the implication that managers should ignore the stock price reaction to an acquisition announcement when short sellers are unimpeded in their trading activities.
On the other hand, a review of the literature on the trading activities of short sellers leads to the conclusion that short sellers are astute traders who understand the price setting process well.7 It is a short step from there to the implication that stock prices set in part by the unimpeded trading of short sellers are more informative than when short sellers’ trading activities are impeded, and from there it is a short step to the implication that managers should be especially sensitive to the stock price reaction to an acquisition announcement when short sellers are unimpeded in their trading activities.
Using the papers discussed above, we developed two hypotheses to explain whether managers listen to the market more when short sellers are less impeded in playing a role in the price setting process:
H0. 
Corporate managers do not value the role short sellers play in the price setting process; therefore, managers will not learn more from the market when short sellers are more or less impeded in the market;
HA. 
Corporate managers believe that short sellers, on average, do make informed trades; therefore, managers take in and learn from these more informed prices when short sellers are less impeded in playing a role in the price setting process. This leads to managers being more likely to listen to and learn from the market when making corporate decisions, including abandoning a value-reducing acquisition attempt.
We use the Regulation SHO pilot program to examine these alternative possibilities. The pilot program classifies firms into two groups, pilot and nonpilot firms, wherein pilot firms were (exogenously) selected to be exempt from short-sale uptick tests during the program. This exemption allows for short sellers’ involvement in the price setting process to be less impeded. We use this difference to test whether managers are more (or less) sensitive to stock price changes when short sellers are less impeded.

3. Data and Variable Construction

3.1. Value-Reducing Acquisition Attempts

Using the list published by the SEC, we identify an initial sample of 986 pilot stocks and 1966 nonpilot stocks.8 Of the 986 pilot stocks, 49.9% (492) are listed on NYSE, 47.9% (472) are listed on NASDAQ-NM, and 2.2% (22) are listed on Amex. The distribution of the nonpilot stocks is similar with 50.0% (982) listed on NYSE, 48.0% (944) on NASDAQ-NM, and 2.0% (40) on Amex.
We obtain proposed acquisitions from the Thomson Financial Securities Data Company’s (SDC) US Mergers and Acquisitions database. We begin with all transactions classified as a “merger”, “acquisition”, or “acquisition of a majority interest” that were announced between 1 January 2002 and 31 December 2010.
To be included in the sample for analysis (1) the potential acquirer must be a publicly traded US firm with stock price data available on the Center for Research in Security Prices (CRSP) database during the period of 53 trading days prior to the announcement through one trading day after the announcement of the acquisition; (2) the firm must have accounting data available on the Compustat database in the year prior to the announcement of the acquisition attempt; (3) the acquirer must be designated as a pilot or nonpilot firm at the start of the Regulation SHO pilot program; (4) the proposed acquirer must own less than 50% of the target firm’s shares prior to the announcement of the acquisition attempt and must seek to own 100% of the target firm’s shares as a result of the acquisition; (5) the proposed transaction must have a value of at least USD 100 million; and (6) the acquisition attempt must be classified as “withdrawn” or “completed”. Table 1 reports the number of observations dropped due to each of these requirements.
Table 1. Sample Selection Procedure. This table presents the sample selection procedure of acquisition attempts obtained from the Thomson Financial SDC Mergers and Acquisitions database. The pre-SHO column includes corporate acquisition attempts announced by pilot and nonpilot firms during 1 January 2002 and 1 May 2005. The SHO column includes corporate acquisition attempts announced by pilot and nonpilot firms during 2 May 2005 and 6 August 2007. The post-SHO column includes corporate acquisition attempts announced by pilot and nonpilot firms during 7 August 2007 and 31 December 2010.
Number of Observations
Pre-SHOSHOPost-SHO
All acquisition attempts in SDC5610 4419 4643
Less: missing data in SDC92428 1916 2331
Less: missing data in CRSP1568
Less: missing data in Compustat279247211
Less: acquirer is not designated as a pilot or nonpilot firm891819 990
Less: acquirer owns more than 50% of target at announcement29 13 13
Less: acquirer seeks to own less than 100% of target164 89 95
Less: transaction value less than USD 100 million1232 775 539
Less: acquisition attempt is not value-reducing293 295 238
Value-reducing acquisition attempts279 259 218
These criteria produce a total of 1582 acquisition announcements by 801 potential acquiring firms over the nine-year period of 2002–2010.10 For the purposes of this study, we focus on acquisition attempts that are accompanied by a negative stock price reaction at their announcement (“value-reducing acquisition attempts”). To identify such attempts, we compute the cumulative abnormal return (henceforth, CAR) using the market model. We compute CARs using a three-day interval (−1, +1), where event day 0 is the announcement day of the proposed acquisition. Abnormal returns are calculated as the residuals from a market model with the maximum estimation interval of (−252, −10) trading days and the minimum interval of (−52, −10) trading days. The market return used in the estimation is the CRSP value-weighted return. Focusing only on value-reducing acquisition attempts results in a set of 756 acquisition announcements by 473 acquirers. There are 279 acquisition announcements in the pre-SHO sample, 259 in the SHO sample, and 218 in the post-SHO sample period. In terms of the number of observations per year, this sample size is similar to prior studies that focus on value-reducing acquisitions.11

3.2. Key Independent Variables

We create an indicator variable Pilot to denote stocks that were selected as pilot stocks in the Regulation SHO pilot program. Pilot stocks are the treatment sample, and nonpilot stocks are the control sample. We construct three variables to indicate three subperiods: pre-SHO equals one if the acquisition attempt announcement falls between 1 January 2002 and 1 May 2005 and zero otherwise; SHO equals one if the acquisition attempt announcement falls between 2 May 2005 and 6 August 2007 and zero otherwise; and post-SHO equals one if the acquisition attempt announcement falls between 7 August 2007 and 31 December 2010 and zero otherwise.

3.3. Control Variables

To isolate the effect of short selling on the acquirer’s decision to abandon (or complete) an acquisition that has been announced, we control for other variables that have been shown in prior studies to be correlated with the likelihood of acquisition abandonments. Walkling (1985) and Kau et al. (2008) find that when the target firm undertakes defensive tactics to fend off an unwanted acquisition attempt (Defense Dummy), the transaction is more likely to be abandoned. Walkling (1985), Jennings and Mazzeo (1991), Kau et al. (2008), and Masulis et al. (2009) report that the emergence of a competing acquirer (Compete Dummy) is positively correlated with the likelihood of transaction abandonment. Huang and Walkling (1987) and Kau et al. (2008) find that when the proposed method of payment includes the stock of the acquiring firm (Stock Dummy), the transaction is more likely to be abandoned. Bates and Lemmon (2003) and Kau et al. (2008) report that a receptive “attitude” on the part of the target (Hostile Dummy), the presence of tender offers (Tender Offer Dummy), and the presence of termination fees (Termination Fee Dummy) all decrease the likelihood of abandonment. Burch (2001) and Kau et al. (2008) report that when the proposed transaction includes an option for the acquirer to purchase shares at a fixed price even if a competing offer emerges (Lockup Dummy), the acquisition attempt is less likely to be abandoned. Chen et al. (2007) and Kau et al. (2008) find that the larger the market capitalization of the equity of the potential acquirer (Ln(Market Cap)), the less likely the transaction is to be abandoned. Luo (2005) finds that if the acquiring and target firm are headquartered in the same state (Same State HQ Dummy), the acquisition attempt is less likely to be abandoned, and if the acquisition has a definitive agreement (Definitive Agreement Dummy), the acquisition attempt is more likely to be abandoned.

3.4. Descriptive Statistics

Table 2 presents the time series and industry composition of the acquisition attempts according to the primary industry of the acquiring firm. Panel A reports the distribution of acquisition announcements across years; Panel B shows the distribution across industries. This sample covers all 11 of the Global Industry Classification Standard (GICS) sectors.
Table 3 presents descriptive statistics of the independent variables for the pilot and nonpilot firms along with statistical tests that show whether the means and medians are different between the two groups. As shown in Panels A and B, we do find some fundamental differences between the two types of acquisitions. Pilot firms are smaller and have a larger equity Market-to-Book (M/B) ratio than nonpilot firms; the targets of pilot firms are more likely to have multiple potential acquirers; and when the acquirer is a pilot firm, the acquirer is more likely to be headquartered in the same state as the target.

4. Empirical Results

In this section, we compare the difference between the managers of pilot and nonpilot firms in their sensitivity to stock price changes in making the decision to abandon acquisition attempts when short sellers are impeded and unimpeded by the uptick tests in the price setting process.

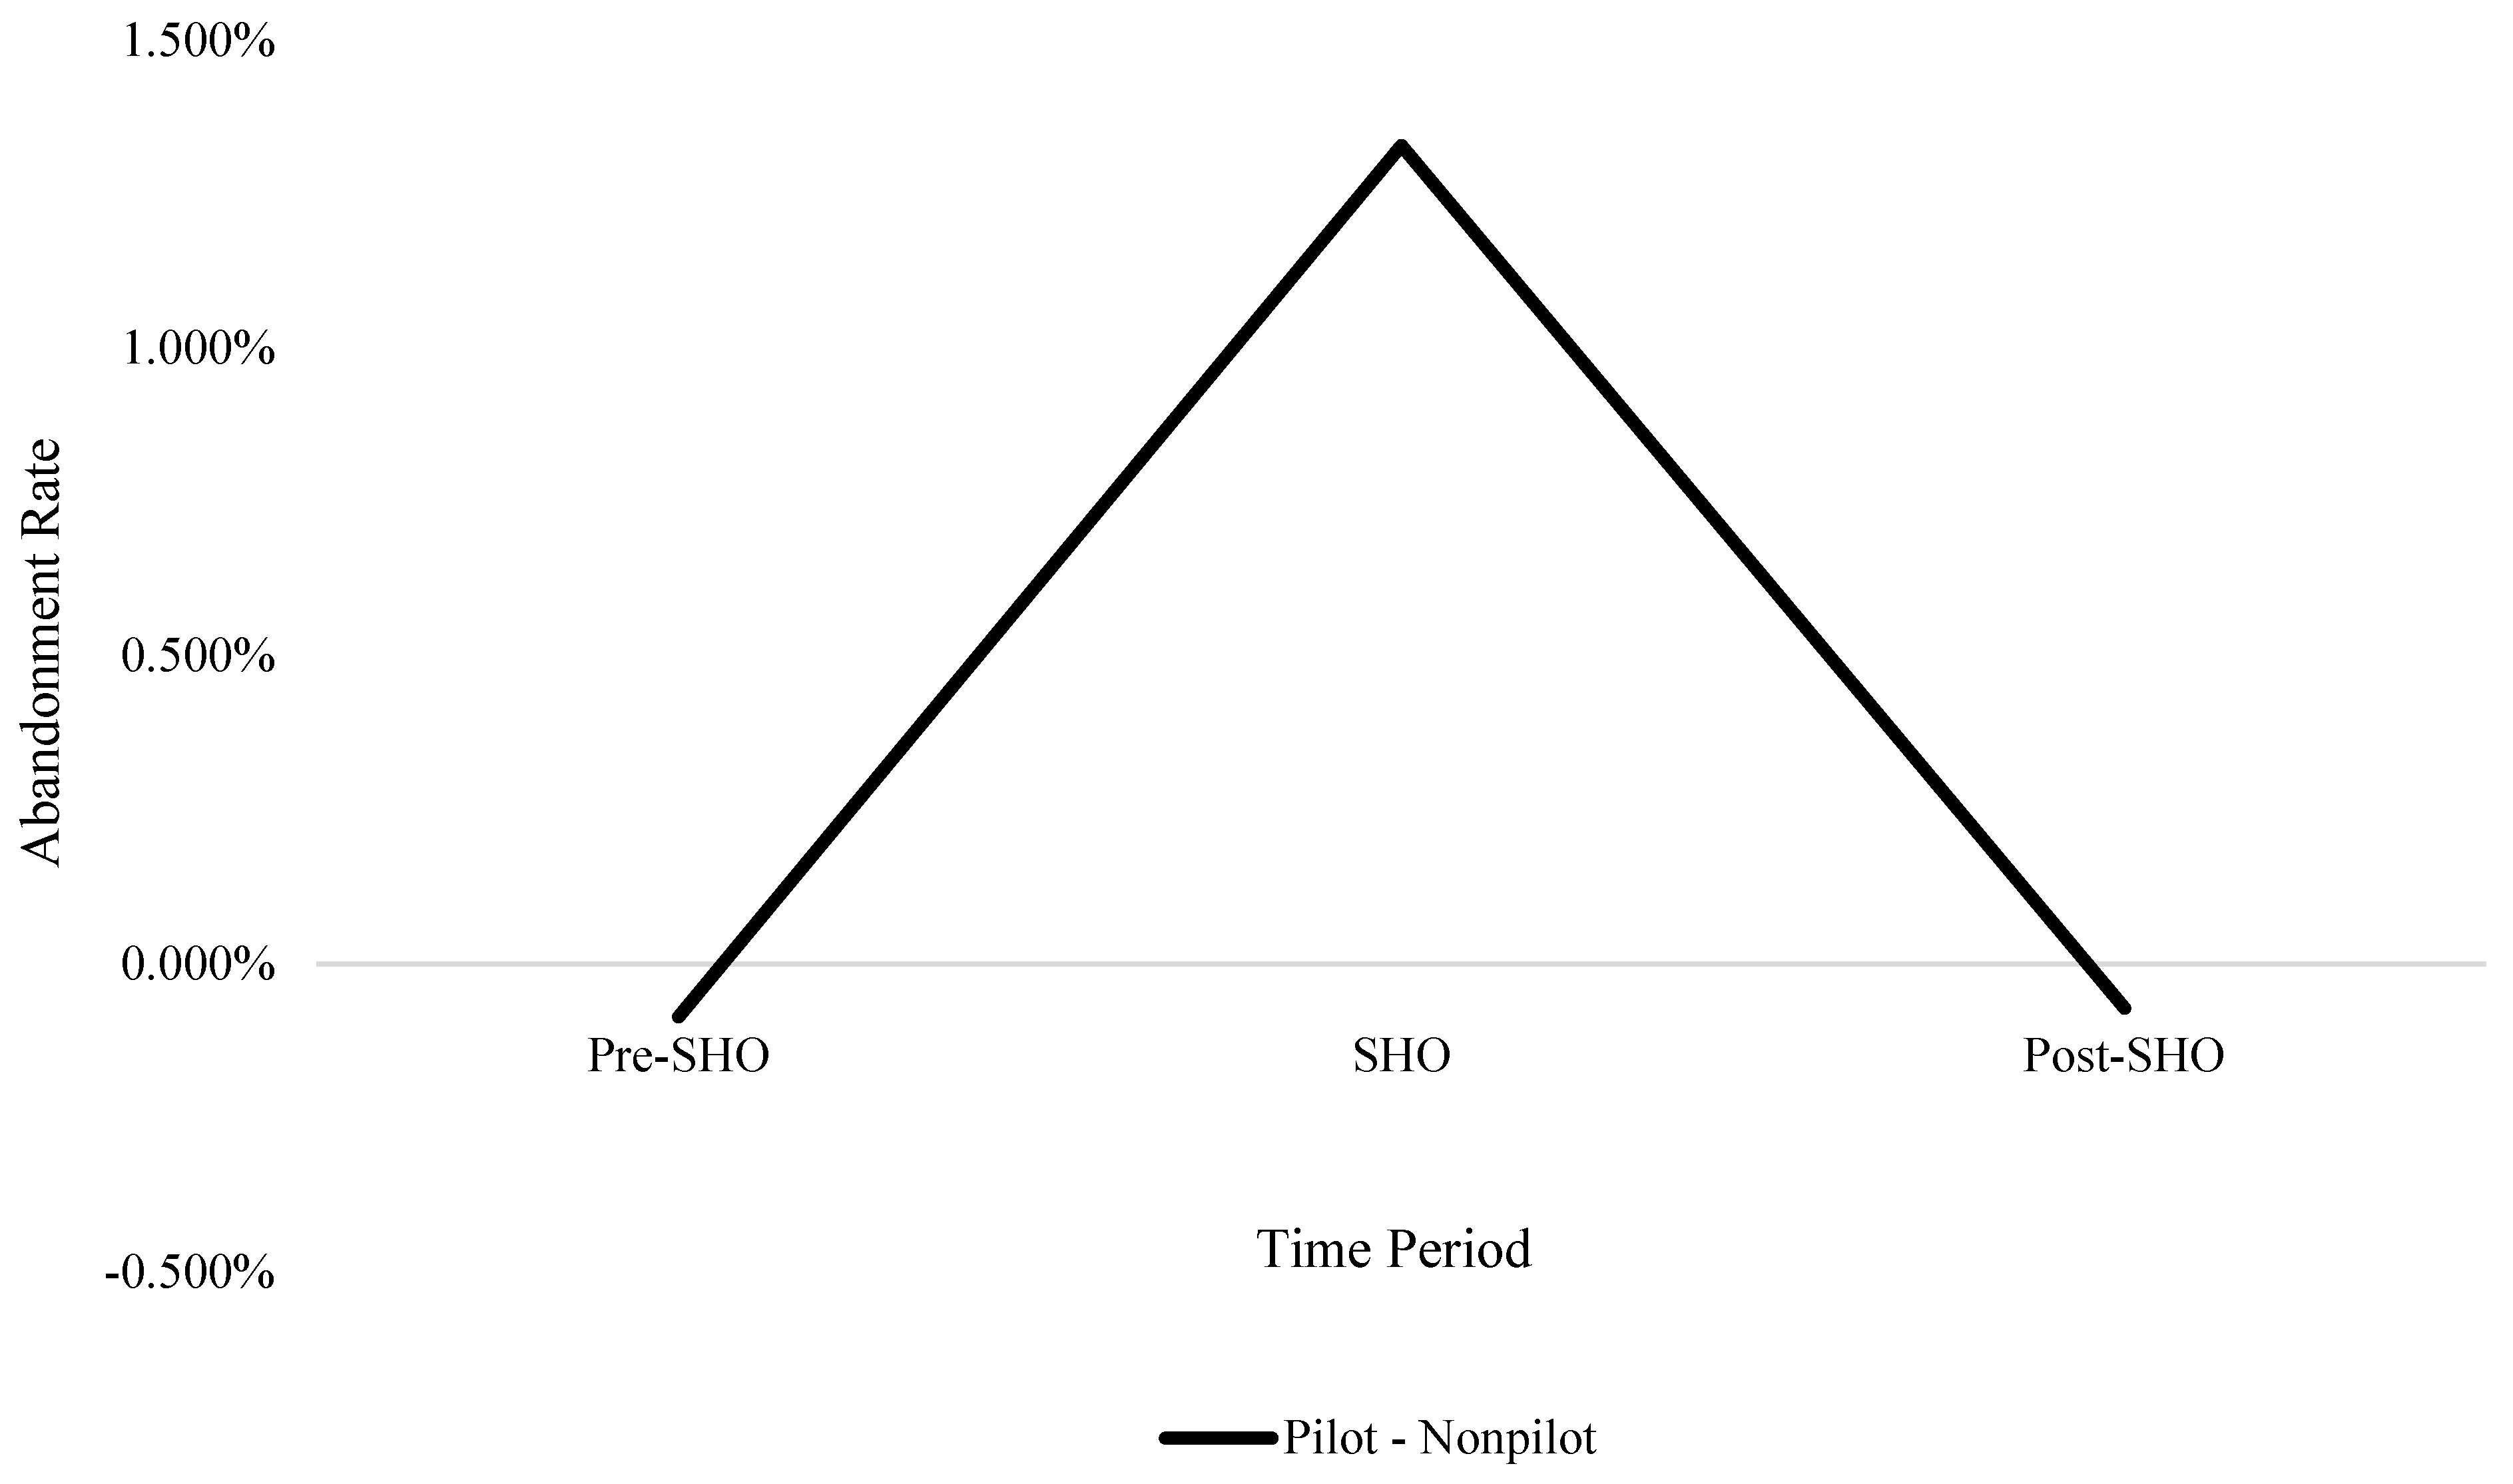
4.1. Univariate Analysis of Abandonments of Corporate Acquisition Attempts

We first compare the percentage of proposed value-reducing acquisition attempts abandoned by pilot and nonpilot firms during the pre-SHO, SHO, and post-SHO period. The comparison is illustrated in Figure 1. During the pre-SHO period, the difference between pilot and nonpilot acquirers in terms of the percentage of value-reducing acquisition attempts abandoned was −0.086%. This difference between pilot and nonpilot acquirers in abandonment rate increases to 1.329% during the SHO period. During the post-SHO period, the difference in abandonment rate reverts to −0.072%.
Consistent with the alternative hypothesis, these univariate results support the proposition that, during the pre-SHO period, when short selling is equally impeded by the uptick rule, managers of pilot and nonpilot firms are no different in their propensity to abandon proposed value-reducing acquisitions. In contrast, during the SHO period, managers of pilot firms are more likely to abandon proposed value-reducing acquisitions than managers of nonpilot firms when pilot firms are unimpeded by the uptick rule. Further, during the post-SHO period, when short selling is equally unimpeded by the uptick rule, managers of pilot and nonpilot firms are no different in their propensity to abandon proposed value-reducing acquisitions.

4.2. Linear Probability Regressions of Acquisition Attempt Abandonments

4.2.1. Acquiring Firm’s CAR

We now examine the relation between the likelihood of abandonment of value-reducing acquisition attempts and the acquiring firm’s stock price reaction at the announcement of the attempt controlling for other factors. To do so, we estimate the following linear probability model:
  A b a n d o n m e n t = β 0 + β 1 C A R + γ   C o n t r o l s   + δ Y e a r D u m m i e s + θ I n d u s t r y D u m m i e s + ε ,
where the dependent variable equals one for abandoned acquisition attempts and zero otherwise. The coefficient of interest is β 1 .
The results of the regression are reported in Column 1 of Table 4. The estimated coefficient of CAR is −0.582 with a p-value less than 0.01; that is, the more negative the stock price reaction, the greater the likelihood that the proposed acquisition will be abandoned across the full sample of value-reducing acquisition attempts. This result is consistent with the findings of prior studies that managers are sensitive to stock price changes when deciding whether to abandon (or complete) proposed value-reducing acquisitions.12

4.2.2. Acquiring Firm’s CAR and Regulation SHO

We next examine whether acquiring firm managers’ sensitivity to stock price reaction in the decision to abandon proposed value-reducing acquisitions is greater (or less) when short selling of the acquiring firm’s stocks is unimpeded by the uptick rule in a multivariate setup. Specifically, we estimate the following linear probability model:
A b a n d o n m e n t = β 0 + β 1 C A R + β 2 P i l o t + β 3 S H O + β 4 P o s t S H O + β 5 C A R × P i l o t   + β 6 C A R × S H O + β 7 C A R × P o s t S H O + β 8 P i l o t × S H O + β 9 P i l o t × P o s t S H O   + β 10 C A R × P i l o t × S H O + β 11 C A R × P i l o t × P o s t S H O + γ   C o n t r o l   V a r i a b l e s   + δ   Y e a r   D u m m i e s + θ   I n d u s t r y   D u m m i e s + ε ,  
where the dependent variable equals one for abandoned acquisition attempts and zero otherwise. The coefficient estimates of interest are those of the two triple interaction terms, β 10 for the variable C A R × P i l o t × S H O and β 11 for the variable C A R × P i l o t × P o s t S H O .
The results of the multivariate analysis are given in Column 2 of Table 4. Several items merit comment. Firstly, the coefficient estimate of Pilot, β 2 , is −0.001 with a p-value of 0.96, indicating that, during the pre-SHO period, when short selling is equally impeded by the uptick rule for both pilot and nonpilot firms, the sensitivity of managers to stock price changes when deciding whether to abandon value-reducing acquisition attempts is no different between pilot and nonpilot firms.
Secondly, the estimated coefficient of the triple interaction term, C A R × P i l o t × S H O , is −2.087 with a p-value < 0.01, indicating that holding CAR constant at the mean of −3.81%, managers of pilot acquiring firms are 7.95% more likely to abandon proposed value-reducing acquisitions than are managers of nonpilot acquiring firms during the SHO period compared to the pre-SHO period. Considering that the average likelihood of abandonment of a value-reducing acquisition attempt during our sample period is 4.23%, a 7.95% increase translates into a 187.94% increase in the likelihood of abandoning a proposed value-reducing acquisition during the SHO period compared to the pre-SHO period. Consistent with the alternative hypothesis, these findings indicate that, during the SHO period, when short selling is unimpeded by the uptick rule for pilot firms, managers of pilot firms, in comparison with managers of nonpilot firms, are more sensitive to stock price changes in the decision to abandon proposed value-reducing acquisitions. Furthermore, this provides evidence that even a single short-sale constraint could have significant negative implications on overall market conditions and the informativeness of the overall market for corporate managers.
Third, the coefficient estimate of C A R × P i l o t × P o s t S H O , β 11 , is −0.910 with a p-value of 0.41. This result shows that, during the post-SHO period, when short selling is equally unimpeded by the uptick rule for both pilot and nonpilot firms, the sensitivity of managers to stock price changes in making the decision to abandon value-reducing acquisition attempts is no different between managers of pilot and nonpilot firms.
As for the control variables, acquisition attempts that are classified as hostile attempts, attempts where a competing acquirer emerges, attempts that have a definitive agreement, or attempts in which the target firm undertakes defensive tactics to fend off an unwanted acquisition attempt are more likely to be abandoned. Acquisition attempts in which the target and acquiring firms are headquartered in the same state are less likely to be abandoned. These findings are all statistically significant with p-values < 0.10.

4.3. Acquisition Characteristics

In this section, we examine whether managers are more sensitive to the stock price reaction when short selling is less impeded by regulation and when managers are likely to put more weight on market prices in their decisions to abandon proposed acquisitions. In particular, we split the sample based on variables that have been shown to proxy for the opacity of an acquisition.13

4.3.1. Focused vs. Diversifying Acquisitions

We first split the sample based on the type of acquisition. We classify observations into two samples: diversifying and focused acquisition attempts. We define diversifying acquisition attempts as those in which the target and acquiring firms are not in the same Fama–French 17 industry. Focused acquisition attempts are defined as those in which the target, and acquiring firms are in the same Fama–French 17 industry. Aggarwal and Baxamusa (2013) have shown that diversifying acquisition attempts are positively correlated with multiple measures of information asymmetry, and thus, we use diversifying acquisition attempts as a measure of the opacity of the target to the acquirer. We conjecture that managers are likely to put more weight on market prices when the acquisition is a diversifying acquisition.
We re-estimate the model in Equation (2) for each sample. The results are reported in Table 5. Column 1 includes all diversifying acquisition attempts. The coefficient estimate, β 10 , in Column 1 is −7.524 (p-value < 0.05). Column 2 includes all the focused acquisition attempts. The coefficient estimate, β 10 , in Column 2 is −0.338 (p-value = 0.71). The difference in coefficients between diversifying and focused acquisition attempts is consistent with managers in acquisition attempts being more sensitive to stock price when short selling is less impeded and when managers put more weight on market prices in deciding whether to abandon proposed acquisitions.

4.3.2. High-Tech vs. Non-High-Tech Target Firms

We then split the sample based on target firm characteristics. We classify observations into two samples: high-tech target and non-high-tech target. We define a high-tech target as one in which the target firm is identified as a high-tech firm by the SDC database and the acquirer has a different SIC Code than the target. High-tech targets are often young, underfunded companies without prospects for generating cash flow in the near future. For these reasons, they are more difficult to evaluate due to the uncertainty associated with values which rely on future outcomes or developments in uncharted fields (Benou and Madura (2005) and Kohers and Kohers (2000)). Thus, we assume that high-tech targets are more opaque to the acquirer and use high-tech target as an indicator to identify opaque targets.
We re-estimate the model in Equation (2) for each sample. Table 6 reports the results. Column 1 includes all acquisition attempts with a high-tech target. The coefficient estimate, β 10 , in Column 1 is −2.334 (p-value < 0.01). Column 2 includes all the acquisition attempts with a non-high-tech target. The coefficient estimate, β 10 , in Column 2 is −1.255 (p-value = 0.27). The difference in the coefficients between acquisition attempts with high-tech and non-high-tech targets is consistent with the proposition that managers are more sensitive to the stock price reaction when short selling is unimpeded by the uptick rule and when managers are likely to put more weight on market prices in their decisions to abandon (or complete) proposed acquisitions.

4.4. Corporate Governance of Acquiring Firms

In this section, we examine whether managers are more sensitive to their firm’s stock price reaction in making their decisions to abandon value-reducing acquisition attempts when short sellers are unimpeded by the uptick test and when the acquiring firm is guided by a higher level of corporate governance. Specifically, we use the E-Index (Bebchuk et al. 2009) as a proxy for the quality of corporate governance and separate the sample into terciles. Firms in the bottom tercile are labeled as Strong Shareholder Rights. Firms in the top tercile are labeled as Weak Shareholder Rights.
We re-estimate the model in Equation (2) for the top and the bottom terciles. Table 7 reports the results. Column 1 includes acquiring firms labeled as Strong Shareholder Rights. The coefficient estimate, β 10 , is −4.387 (p-value < 0.01). Column 2 includes acquiring firms labeled as Weak Shareholder Rights. The coefficient estimate, β 10 , is −1.621 (p-value < 0.05).
Though both coefficients of interest in Columns 1 and 2 are negative and statistically significant, they represent different economic significance when holding the CAR constant at its mean of −3.81%. For acquisition attempts with acquiring firms labeled as Strong Shareholder Rights, managers of pilot acquiring firms are 2.59 percentage points more likely to abandon the proposed acquisition than are managers of nonpilot acquiring firms. For acquisition attempts by acquiring firms labeled as Weak Shareholder Rights, managers of pilot acquiring firms are 1.51 percentage points more likely to abandon the proposed acquisition than managers of nonpilot acquiring firms.
These findings are consistent with the proposition that managers of pilot acquiring firms with stronger corporate governance are more sensitive to stock price changes in making the decision to abandon value-reducing acquisition attempts than are managers of nonpilot acquiring firms during the SHO period compared with the pre-SHO period. That is, managers are more sensitive to the stock price changes when short selling is less impeded by regulations and when the acquiring firm is guided by stronger corporate governance.

5. Robustness

The findings thus far are consistent with the proposition that although the participation of short sellers in stock trading often arouses the ire of managers whose firms become the targets of short selling, managers are more sensitive to stock price changes when short sellers are less impeded in playing a role in the price setting process. In this section, we address the robustness of the results using different specifications of the data and variables. All results reported are presented in the Supplementary Materials.

5.1. Delayed Response in Stock Prices Due to Impeded Short Sellers

The key premise of our study is that, as informed traders, short sellers’ unimpeded involvement in the price setting process makes the change in stock price a more accurate depiction of the value destroyed by proposed value-reducing acquisitions. Consequently, managers are more sensitive to stock price changes when short sellers are less impeded by regulation in the price setting process.
An alternative possibility is that because short sellers are impeded from participating in the price setting process, for nonpilot firms the price response is delayed. Consider an example of two acquisition attempts. Suppose that both acquirers experience a −5% CAR at the announcement of proposed acquisitions. Furthermore, suppose that the stock of the first acquiring firm has fewer short-sale impediments than the stock of the second acquiring firm. For the second firm whose stock is more short sale impeded, the observed value reduction could be less than the actual value reduction due to lesser involvement of short sellers. In this scenario, the short sale impeded firm could experience a more gradual decline in stock price as the market converges to the actual value destruction following the announcement of the proposed acquisition. Therefore, managers of more short sale impeded firms, in expectation of further price decline following the announcement, could be more sensitive to the −5% stock price decline in the days immediately surrounding the announcement. If so, the implication is that, during the SHO period, managers of nonpilot acquiring firms would be more sensitive to stock price changes at the announcement of the proposed acquisition attempt in making their decisions to abandon (or complete) the transaction than managers of pilot firms. We find they are not, thereby ruling out this alternative possibility.

5.2. Post-Announcement Drift

Our study relies upon the validity of the three-day CAR as an unbiased measure of the value added (destroyed) due to the proposed acquisitions. One concern with this assumption is that there could be systematic drift in stock returns following acquisition announcements, in particular for firms where short selling is more impeded by regulation. If so, the difference in managers’ sensitivity to stock price changes in their decisions to abandon proposed value-reducing acquisitions could be explained by the difference in stock price changes post the announcement of the proposed acquisitions. To address such a concern, we examine the difference in post-announcement drift in abnormal stock returns between pilot and nonpilot firms.
We find that for acquisition announcements made during the SHO period, there is no statistically nor economically significant difference in cumulative abnormal stock returns (CARs) between pilot and nonpilot firms in the post announcement period up to 20 trading days following the announcement of the proposed acquisitions. In particular, for acquisitions announced during the SHO period, the difference in CARs over the interval of [+2, +20] for acquisitions proposed by pilot and nonpilot firms is 0.08% with a p-value of 0.46. These results suggest that there is no difference following the announcement of acquisition attempts by pilot and nonpilot firms.

5.3. Benchmark for Value-Reducing Acquisitions

Our criterion of a CAR less than zero for the identification of value-reducing acquisition attempts implicitly assumes that CARs are measured without error. Since CARs are, indeed, measured with error, some of the attempts classified as value-reducing might be misclassified. To mitigate the concern that our results are due to misclassified value-reducing acquisition attempts, we re-estimate Equation (2) including only acquisition attempts with CARs less than −2%. Despite the decrease in sample size, the coefficient estimate of the triple interaction term C A R × P i l o t × S H O is negative and statistically significant (p-value < 0.05). This estimate indicates that the results of our analysis are not due to potentially misclassified value-reducing acquisition attempts where the CARs are slightly less than zero.

5.4. Acquirers Repeatedly Abandoning Acquisition Attempts

Some acquirers enter the sample more than once. Indeed, 67 of the sample firms abandoned value-reducing acquisition attempts three or more times. To mitigate the concern that our results are due to a handful of repeated acquirers where managers are especially sensitive to stock price in making the decision to abandon value-reducing acquisition attempts and their firms just happen to be included in the pilot program, we include only the first acquisition attempt by any acquirer and re-estimate Equation (2). Despite the decrease in sample size, the coefficient estimate of the triple interaction term C A R × P i l o t × S H O is negative and statistically significant at −2.466 (p-value < 0.10). Thus, the results of our analysis are not due only to acquirers that repeatedly abandon value-reducing acquisition attempts.

5.5. Other Robustness Tests

We also re-estimate our models using probit and tobit specifications, using a five-day interval (−2, +2) and a seven-day interval (−3, +3) to calculate CAR, using the Fama–French–Carhart four factor model to calculate CAR, and including proposed acquisitions that have a transaction value of at least USD 50 million or USD 10 million. In all cases, the triple interaction term C A R × P i l o t × S H O is negative and statistically significant (all p-values < 0.05), and the triple interaction term of C A R × P i l o t × P o s t S H O is statistically insignificant (all p-values > 0.46).

6. Using Regulation SHO as an Exogenous Shock

Concerns about the validity of empirical tests that utilize the SHO experiment have been set forth by Litvak et al. (2020) and Heath et al. (2023). The basis of the concerns is that the causal chain argument fails as there is no evidence that the Regulation SHO pilot program significantly altered the level of short selling in pilot stocks.14 We argue that our interpretation of the results can survive such concerns.
Firstly, our study focuses on managers’ perception of the manifest effect of short sellers on stock price and whether that perception of manifest short sales influences managerial actions. We presume that the Regulation SHO pilot program significantly altered managers’ perception of short sellers’ participation in stock price setting process. To support this presumption, we consider the number of news articles including “short sellers” or “short selling” in the Wall Street Journal, New York Times, Washington Post, and USA Today during the pre-SHO and SHO periods of the Regulation SHO pilot program. As illustrated in Figure 2, we find the monthly number of news articles including “short sellers” or “short selling” is 12.08 during the pre-SHO period and 18.13 during the SHO period. The more than 50% increase in the media attention given to short selling activities supports our presumption that the Regulation SHO pilot program exogenously increased managers’ perception of the manifest effect of short sellers on stock price.
Secondly, Litvak et al. (2020) contend that the SEC erred in the setup of the regulation SHO experiment, and, thus, if researchers find a treatment effect using SHO as an exogenous shock, the effect is likely to be spurious. In particular, “the SEC took the randomly selected original nonpilot firms, picked the largest third, and suspended the uptick rule for trading in these firms’ shares after regular trading hours. Moreover, the Nasdaq national market never applied short sale restrictions after trading hours”. Thereby, Litvak et al. argue that the nonpilot firms in the Regulation SHO program include “partially” pilot firms.15 We acknowledge that the error in the SHO program leads us to misclassify “partially” pilot firms as nonpilot firms. In general, such a misclassification reduces the likelihood of rejecting the null hypothesis. Nevertheless, our tests do reject the null hypothesis.
Thirdly, Heath et al. (2023) comment that there were more than 40 papers that use Regulation SHO as a quasi-natural experiment, and combined, these papers examine more than 23 different dependent variables. They argue that the repeated use of a quasi-natural experiment increases the likelihood of false discoveries. They recommend that the critical values for significance tests be adjusted. Using the Heath et al. (2023) adjusted critical values, all of the coefficient estimates of C A R × P i l o t × S H O continue to be significant at the 0.05 level.

7. Conclusions

In this study, we exploit a quasi-randomized experiment to examine the cost of restricting short sales in the form of the reduction in market information and efficiency for managers; that is, we test whether the participation of short sellers in the price setting process increases (or decreases) managers’ sensitivity to stock price changes when making corporate decisions. Our setting is the SEC mandated exemption of short-sale uptick tests for a set of firms included in the Regulation SHO pilot program and 756 proposed value-reducing acquisition attempts during the period of 2002–2010. We find that during the pilot program, managers of pilot firms are more sensitive to stock price changes when deciding whether to abandon value-reducing acquisition attempts than nonpilot firms. Furthermore, we find that, during the pre- and post-SHO period, the sensitivity of managers to stock price changes in deciding whether to abandon (or complete) value-reducing acquisition attempts is not different between managers of pilot and nonpilot firms. We further find that managers are more sensitive to stock price changes when short sellers are less impeded in the price setting process and when managers put more weight on market prices in making corporate decisions. While this finding must include caveats based on the recent literature discussing Regulation SHO, we believe this finding is important for both corporate managers and other market participants. It is our hope that the literature in this area which examines the corporate governance role of short sellers continues to grow.
The results of our study suggest that, although the participation of short sellers in stock trading often arouse the criticism of managers whose firms become the targets of short selling, managers are more sensitive to stock price changes when short sellers are less impeded in playing a role in the price setting process. This finding can be generalized to show that despite their dislike for them, managers believe that overall market conditions and the level of information from markets is superior when short sellers are less impeded, and therefore, the imposition of short sale constraints could have a large effect on market price information.

Supplementary Materials

The following supporting information can be downloaded at: https://www.mdpi.com/article/10.3390/jrfm16110486/s1.

Author Contributions

All authors contributed to all parts of this article. All authors have read and agreed to the published version of the manuscript.

Funding

This research received no external funding.

Data Availability Statement

The data presented in this study are available on request from the corresponding author.

Acknowledgments

We are grateful for the constructive and helpful comments received from Don Autore, Yingmei Cheng, Francois Cocquemas, David Denis, Diane Denis, Casey Dougal, Mara Faccio, Irena Hutton, Byoung-Hyoun Hwang, Anastasia Semykina, Henri Servaes, and Rene Stulz.

Conflicts of Interest

The authors declare no conflict of interest.

Appendix A. Variable Definitions

VariableDefinition
CARCumulative abnormal return over the (−1, +1) interval surrounding announcements of an acquisition using the market model where the announcement dates are from SDC.
AbandonmentOne for abandoned acquisition attempts and zero for completed acquisition attempts, as reported by SDC.
Compete DummyOne for acquisition attempts with the emergence of a third party who launches an offer to the same target firm while the original acquisition attempt is pending and zero otherwise, as reported by SDC.
Defense DummyOne for acquisition attempts in which the target firm undertakes defensive tactics to fend off the acquisition attempt and zero otherwise, as reported by SDC.
Definitive Agreement DummyOne for acquisition attempts in which the finalized terms of the deal are agreed upon prior to or on the acquisition announcement date and zero otherwise, as reported by SDC.
Diversifying AcquisitionsAcquisition attempts in which the target and acquiring firm are not in the same Fama–French 17 industry.
E-IndexThe Entrenchment index of Bebchuk et al. (2009) in the year prior to the acquisition announcement.
Focused AcquisitionsAcquisition attempts in which the target and acquiring firm are in the same Fama–French 17 industry.
Hostile DummyOne for acquisition attempts in which the “attitude” of the proposed acquisition is hostile and zero otherwise, as reported by SDC.
High-Tech TargetOne for acquisition attempts in which the target firm is categorized as high-tech and the acquirer has a different SIC Code than the target and zero otherwise, as reported by SDC.
Lockup DummyOne for acquisition attempts including a lockup of target shares in which the potential acquirer is granted an option to purchase shares at a fixed price even if a competing offer emerges and zero otherwise, as reported by SDC.
Ln(Market Cap)The natural log of the acquirer’s market value of equity (in millions of dollars) on the 43rd trading day prior to the announcement day of the acquisition attempt.
Same-State HQ DummyOne for acquisition attempts where the acquirer and target firms are incorporated in the same state and zero otherwise.
Tender Offer DummyOne for acquisition attempts structured as a tender offer and zero otherwise, as reported by SDC.
Pre-SHOOne for acquisition attempts announced between 1 January 2002 and 1 May 2005 (inclusive) and zero otherwise.
PilotOne for acquisition attempts where the acquirer was a pilot firm in Regulation SHO and zero otherwise.
SHOOne for acquisition attempts announced between 2 May 2005 and 6 August 2007 (inclusive) and zero otherwise.
Post-SHOOne for acquisition attempts announced between 7 August 2007 and 31 December 2010 (inclusive) and zero otherwise.
Stock DummyOne for acquisition attempts financed or partially financed by the acquirer’s common stock and zero otherwise.
Termination Fee DummyOne for acquisition attempts that include termination fees that the potential acquirer must pay to the target if the transaction is abandoned and zero otherwise, as reported by SDC.

Appendix B. Institutional Background

Short-sale price tests, introduced in the 1930s in the US equity markets, are trading restrictions that limit when a short sale can be made. One such rule, known as the “uptick test”, was adopted by the SEC in 1938 as a part of Rule 10a-1 and continued in force until 2007. According to Pessin (1978), the rule was designed to curtail “groups of speculators from pooling their capital and selling short for the sole purpose of driving down the stock price of a particular security to a level where the stockholders would panic and unload their fully owned shares”. The uptick test mandates that a short sale must be at a price either above the last traded price of the security or at the last traded price when the most recent movement between traded prices was upward. In 1994, the National Association of Securities Dealers (NASD) adopted its own stricter price test, the “bid test”, under Rule 3350. The bid test requires that a short sale occur at a price at least one penny above the bid price if the bid is a downtick from the previous bid.
On 28 July 2004, the SEC issued the Securities Exchange Act Release No. 50104 (available at http://www.sec.gov/rules/other/34-50104.htm (accessed on 12 November 2023). This act suspended the operation of short-sale uptick tests for a group of stocks during a pilot period. To select the stocks in the pilot program, the SEC first sorted firms in the Russell 3000 as of June 2004 into three groups—Amex, Nasdaq nm and NYSE—excluding stocks that went public or had a spin-off between 30 April 2004 and 28 July 2004 or that were not subject to uptick tests as of 25 June 2004. The securities in each group were then ranked from highest to lowest average daily dollar volume for the period of June 2003–May 2004. In each group, every third stock was selected to be in the pilot study, yielding a total of 986 stocks that would trade without being subjected to any uptick tests during the pilot program.
As set forth by the SEC, from 2 May 2005 to 6 August 2007, pilot stocks were to be exempted from short-sale price tests. The program effectively ended one month early on 6 July 2007, when the SEC eliminated short-sale price tests for all the exchange listed stocks. The SEC stated that “[t]he general consensus was that the Commission should remove price test restrictions because they modestly reduce liquidity and do not appear necessary to prevent manipulation”.16
The decision to remove all short-sale price tests was met with hostility by managers, politicians, and the media. Just one month after the decision, Muriel Siebert, founder of the Siebert Financial Corporation and former state banking superintendent of New York, asserted that the removal of the uptick rule on short sales “may be exacerbating the downdrafts when they come along”.17 US Senator John McCain stated that the removal of the uptick rule on short sales “allowed abusive short-selling, or bearish bets on a company’s stock, to turn our markets into a casino”.18 Prominent economic commentator Jim Cramer called for the restoration of the uptick rule and claimed that “only then will the shorts lose the upper hand, and the market will become a safer, fairer place for you to invest”.19
In April 2009, the SEC voted to seek public comment on proposals to restore a form of the uptick rule. In February 2010, the SEC adopted the alternative uptick rule by amending Rules 200(g) and 201 of Regulation SHO. The alternative uptick rule is triggered when a security’s price falls by 10% or more from the previous day’s closing price. The rule is in effect until the close of trading the next day.20

Notes

1
For papers on the informativeness of short sellers trades, see Miller (1977), Diamond and Verrecchia (1987), Senchack and Starks (1993), Desai et al. (2002), Duffie et al. (2002), Asquith et al. (2005), Bris et al. (2007), Boehmer et al. (2008), Saffi and Sigurdsson (2011), Engelberg et al. (2012), Boehmer and Wu (2013), Curtis and Fargher (2014), Akbas et al. (2017), and Hwang et al. (2019), among others. For papers on managers learning from prices, see Gilchrist et al. (2005), Grullon et al. (2015), He et al. (2023), among others.
2
“Elon Musk: The Architect of Tomorrow”, Neil Strauss, 15 November 2017. Similar sentiments include, for example, Jamie Dimon’s (CEO of JP Morgan), discussion of the role of short sellers in the downfall of Bear Stearns in “S.E.C. Unveils Measures to Limit Short-Selling”, Jenny Anderson, 16 July 2008 or Patrick Byrne’s (CEO of Overstock) allegation against short sellers in “Overstock’s Phantom Menace”, Bethany McLean, 1 November 2005.
3
(Securities and Exchange Commission (SEC) 2007), Economic analysis of the short sale price restrictions under the regulation SHO pilot, Office of Economic Analysis.
4
We define value-reducing acquisition attempts as those that are accompanied by a negative stock price reaction at the announcement of the deal as measured by the acquiring firm’s 3-day announcement period CAR.
5
See, for example, Luo (2005), Chen et al. (2007), Kau et al. (2008), Masulis et al. (2009), and Liu and McConnell (2013) who report that managers are more likely to abandon acquisition attempts the lower the stock returns of the acquirer at the announcement of the potential acquisition.
6
See Bebchuk et al. (2009) for further discussion on the E-Index.
7
8
The SEC initially published a list of 986 pilot stocks (available at https://www.sec.gov/rules/other/34-50104.htm) on 28 July 2004. The list was later updated to 948 pilot stocks to account for business combinations, permanent delistings, and other corporate events (available at https://www.sec.gov/spotlight/shopilot.htm (accessed on 13 November 2023)). For robustness, we re-estimate our models using the updated list of pilot stocks and find quantitatively similar results. These results are reported in the Supplementary Materials.
9
Missing variables include the percentage of target shares that the acquirer owns prior to the proposed acquisition, percentage of shares sought by the acquirer, transaction value, and the final transaction status (i.e., completed or withdrawn).
10
Following Fang et al. (2016), who also use Regulation SHO as a quasi-natural experiment, we limit our sample from 2002 (inclusive) to 2010 (inclusive). This allows us to compare the results from the three-year window when Regulation SHO was active to a three-year window prior to and post the program.
11
See, for example, Henry (2004), Liu and McConnell (2013), Chen et al. (2015), Becht et al. (2016), and Bereskin et al. (2018) among others.
12
See note 5 above.
13
We are limited in our selection of variables to proxy for the opacity of the target firm by their availability of variables for non-listed firms.
14
The causal chain approach sequences the results such that first order effects are tested first. The Romano and Wolf (2005) procedure is then performed resulting in updated critical values with which the second order effects are tested. This continues to the third order effects and so on until all effects have been tested. For Regulation SHO, variables related to the price formation process (i.e., manager’s perception of short sellers’ involvement) are considered second order outcomes.
15
“The busted randomization went unnoticed by all prior researchers, including the OEA. Indeed, Chester Spatt, the then-SEC Chief Economist who oversaw the experiment, told us that he was not aware that the SEC had created a partly treated group from the original controls”. Litvak et al. (2020).
16
http://www.sec.gov/rules/other/34-50104.htm (accessed on 12 November 2023).
17
See Morgenson, Gretchen. “Why the roller coaster seems wilder”, The New York Times. 26 August 2007.
18
See Meckler, Laura and Scannell, Kara. “McCain Says Cox Should Be Fired as SEC Chief Amid ‘Casino’ Markets” The Wall Street Journal. 18 September 2008.
19
See Carney, John. “Bring Back the Uptick Rule?” Business Insider. 18 November 2008.
20
See https://www.sec.gov/news/press/2010/2010-26.htm (accessed on 12 November 2023) for the SEC’s press release announcing the adoption of the alternative uptick rule.

References

  1. Aggarwal, Rajesh K., and Mufaddal. H. Baxamusa. 2013. Unrelated acquisitions. Paper presented at the American Finance Association Meeting, San Diego, CA, USA, January 3–5. [Google Scholar]
  2. Akbas, Ferhat, Ekkehart Boehmer, Bilal Erturk, and Sorin Sorescu. 2017. Short interest, returns, and fundamentals. Financial Management 46: 455–86. [Google Scholar] [CrossRef]
  3. Asquith, Paul, Parag A. Pathak, and Jay R. Ritter. 2005. Short interest, institutional ownership, and stock returns. Journal of Financial Economics 78: 243–76. [Google Scholar] [CrossRef]
  4. Bates, Thomas W., and Michael L. Lemmon. 2003. Breaking up is hard to do? An analysis of termination fee provisions and merger outcomes. Journal of Financial Economics 69: 469–504. [Google Scholar] [CrossRef]
  5. Bebchuk, Lucian, Alma Cohen, and Allen Ferrell. 2009. What matters in corporate governance? The Review of Financial Studies 22: 783–827. [Google Scholar] [CrossRef]
  6. Beber, Alessandro, and Marco Pagano. 2013. Short-selling bans around the world: Evidence from the 2007–09 crisis. The Journal of Finance 68: 343–81. [Google Scholar] [CrossRef]
  7. Becht, Marco, Andrea Polo, and Stefano Rossi. 2016. Does mandatory shareholder voting prevent bad acquisitions? The Review of Financial Studies 29: 3035–67. [Google Scholar] [CrossRef]
  8. Benou, Georgina, and Jeff Madura. 2005. High-tech acquisitions, firm specific characteristics and the role of investment bank advisors. The Journal of High Technology Management Research 16: 101–20. [Google Scholar] [CrossRef]
  9. Bereskin, Fred, Seong K. Byun, Micah S. Officer, and Jong-Min Oh. 2018. The effect of cultural similarity on mergers and acquisitions: Evidence from corporate social responsibility. Journal of Financial and Quantitative Analysis 53: 1995–2039. [Google Scholar] [CrossRef]
  10. Boehmer, Ekkehart, and Julie Wu. 2013. Short selling and the price discovery process. The Review of Financial Studies 26: 287–322. [Google Scholar] [CrossRef]
  11. Boehmer, Ekkehart, Charles M. Jones, and Xiaoyan Zhang. 2008. Which shorts are informed? The Journal of Finance 63: 491–527. [Google Scholar] [CrossRef]
  12. Bris, Arturo, William N. Goetzmann, and Ning Zhu. 2007. Efficiency and the bear: Short sales and markets around the world. The Journal of Finance 62: 1029–79. [Google Scholar] [CrossRef]
  13. Burch, Timothy R. 2001. Locking out rival bidders: The use of lockup options in corporate mergers. Journal of Financial Economics 60: 103–41. [Google Scholar]
  14. Chang, Eric C., Tse-Chun Lin, and Xiaorong Ma. 2019. Does short-selling threat discipline managers in mergers and acquisitions decisions? Journal of Accounting and Economics 68: 101223. [Google Scholar] [CrossRef]
  15. Charoenrook, Anchada Aida, and Hazem Daouk. 2009. A Study of Market-Wide Short-Selling Restrictions. Working Paper. Ithaca: Cornell University, Department of Applied Economics and Management. [Google Scholar]
  16. Chen, Tao, Jarrad Harford, and Chen Lin. 2015. Do analysts matter for governance? Evidence from natural experiments. Journal of Financial Economics 115: 383–410. [Google Scholar] [CrossRef]
  17. Chen, Xia, Jarrad Harford, and Kai Li. 2007. Monitoring: Which institutions matter? Journal of Financial Economics 86: 279–305. [Google Scholar] [CrossRef]
  18. Curtis, Asher, and Neil L. Fargher. 2014. Does short selling amplify price declines or align stocks with their fundamental values? Management Science 60: 2324–40. [Google Scholar]
  19. Desai, Hemang, K. Ramesh, S. Ramu Thiagarajan, and Bala V. Balachandran. 2002. An investigation of the informational role of short interest in the Nasdaq market. The Journal of Finance 57: 2263–87. [Google Scholar] [CrossRef]
  20. Diamond, Douglas W., and Robert E. Verrecchia. 1987. Constraints on short-selling and asset price adjustment to private information. Journal of Financial Economics 18: 277–311. [Google Scholar] [CrossRef]
  21. Duffie, Darrell, Nicolae Garleanu, and Lasse Heje Pedersen. 2002. Securities lending, shorting, and pricing. Journal of Financial Economics 66: 307–39. [Google Scholar] [CrossRef]
  22. Engelberg, Joseph E., Adam V. Reed, and Matthew C. Ringgenberg. 2012. How are shorts informed? Short sellers, news, and information processing. Journal of Financial Economics 105: 260–78. [Google Scholar] [CrossRef]
  23. Engelberg, Joseph E., Adam V. Reed, and Matthew C. Ringgenberg. 2018. Short-selling risk. The Journal of Finance 73: 755–86. [Google Scholar] [CrossRef]
  24. Fang, Vivian W., Allen H. Huang, and Jonathan M. Karpoff. 2016. Short selling and earnings management: A controlled experiment. The Journal of Finance 71: 1251–94. [Google Scholar] [CrossRef]
  25. Gilchrist, Simon, Charles P. Himmelberg, and Gur Huberman. 2005. Do Stock Price Bubbles Influence Corporate Investment? Journal of Monetary Economics 52: 805–27. [Google Scholar]
  26. Grullon, Gustavo, Sebastien Michenaud, and James P. Weston. 2015. The Real Effects of Short-Selling Constraints. The Review of Financial Studies 28: 1737–67. [Google Scholar] [CrossRef]
  27. He, Jie, Xiao Ren, and Xuan Tian. 2023. Do Short Sellers Affect Corporate Innovation? Evidence from a Policy Experiment. The Review of Corporate Finance Studies. Available online: https://academic.oup.com/rcfs/advance-article-abstract/doi/10.1093/rcfs/cfad007/7087109?redirectedFrom=fulltext (accessed on 12 November 2023).
  28. Heath, Davidson, Matthew Ringgenberg, Mehrdad Samadi, and Ingrid M. Werner. 2023. Reusing Natural Experiments. Journal of Finance. forthcoming. Available online: https://papers.ssrn.com/sol3/papers.cfm?abstract_id=3457525 (accessed on 12 November 2023). [CrossRef]
  29. Henry, Darren. 2004. Corporate governance and ownership structure of target companies and the outcome of takeovers. Pacific-Basin Finance Journal 12: 419–44. [Google Scholar] [CrossRef]
  30. Huang, Yen-Sheng, and Ralph A. Walkling. 1987. Target abnormal returns associated with acquisition announcements: Payment, acquisition form, and managerial resistance. Journal of Financial Economics 19: 329–49. [Google Scholar] [CrossRef]
  31. Hwang, Byoung-Hyoun, Baixiao Liu, and Wei Xu. 2019. Arbitrage involvement and security prices. Management Science 65: 2858–75. [Google Scholar] [CrossRef]
  32. Jennings, Robert H., and Michael A. Mazzeo. 1991. Stock price movements around acquisition announcements and management’s response. Journal of Business 64: 139–63. [Google Scholar] [CrossRef]
  33. Kau, James B., James S. Linck, and Paul H. Rubin. 2008. Do managers listen to the market? Journal of Corporate Finance 14: 347–62. [Google Scholar] [CrossRef]
  34. Kohers, Ninon, and Theodor Kohers. 2000. The value creation potential of high-tech mergers. Financial Analysts Journal 56: 40–51. [Google Scholar] [CrossRef]
  35. Lamont, Owen A. 2012. Go down fighting: Short sellers vs. firms. The Review of Asset Pricing Studies 2: 1–30. [Google Scholar] [CrossRef]
  36. Litvak, Kate, Bernard S. Black, and Woongsun Yoo. 2020. The SEC’s Busted Randomized Experiment: What Can and Cannot Be Learned. Working Paper. Available online: https://papers.ssrn.com/sol3/papers.cfm?abstract_id=2820031 (accessed on 12 November 2023).
  37. Liu, Baixiao, and John J. McConnell. 2013. The role of the media in corporate governance: Do the media influence managers’ capital allocation decisions? Journal of Financial Economics 110: 1–17. [Google Scholar] [CrossRef]
  38. Ljungqvist, Alexander, and Wenlan Qian. 2016. How constraining are limits to arbitrage? The Review of Financial Studies 29: 1975–2028. [Google Scholar] [CrossRef]
  39. Luo, Yuanzhi. 2005. Do insiders learn from outsiders? Evidence from mergers and acquisitions. The Journal of Finance 60: 1951–82. [Google Scholar] [CrossRef]
  40. Massa, Massimo, Bohui Zhang, and Hong Zhang. 2015. The invisible hand of short selling: Does short selling discipline earnings management? The Review of Financial Studies 28: 1701–36. [Google Scholar] [CrossRef]
  41. Masulis, Ronald W., Cong Wang, and Fei Xie. 2009. Agency problems at dual-class companies. The Journal of Finance 64: 1697–727. [Google Scholar] [CrossRef]
  42. Miller, Edward M. 1977. Risk, uncertainty, and divergence of opinion. The Journal of Finance 32: 1151–68. [Google Scholar] [CrossRef]
  43. Pessin, Allan. 1978. Fundamentals of the Securities Industry. New York: New York Institute of Finance, p. 241. [Google Scholar]
  44. Romano, Joseph P., and Michael Wolf. 2005. Stepwise multiple testing as formalized data snooping. Econometrica 73: 1237–82. [Google Scholar] [CrossRef]
  45. Saffi, Pedro A., and Kari Sigurdsson. 2011. Price efficiency and short selling. The Review of Financial Studies 24: 821–52. [Google Scholar] [CrossRef]
  46. Securities and Exchange Commission (SEC). 2007. Economic Analysis of the Short Sale Price Restrictions under the Regulation SHO Pilot; Office of Economic Analysis. Available online: https://www.sec.gov/news/studies/2007/regshopilot020607.pdf (accessed on 12 November 2023).
  47. Senchack, A. J., Jr., and Laura T. Starks. 1993. Short sale restrictions and market reaction to short-interest announcements. Journal of Financial and Quantitative Analysis 28: 177–94. [Google Scholar] [CrossRef]
  48. Walkling, Ralph A. 1985. Predicting tender offer success: A logistic analysis. Journal of Financial and Quantitative Analysis 20: 461–78. [Google Scholar] [CrossRef]
Figure 1. Differences in abandonment rates of value-reducing acquisition attempts between pilot and nonpilot firms during the pre-SHO, SHO and post-SHO Periods. This figure depicts the differences in abandonment rates between Regulation SHO pilot and nonpilot firms of value-reducing acquisition attempts during the pre-SHO, SHO and post-SHO periods of the Regulation SHO pilot program. The pre-SHO period is 1 January 2002 through 1 May 2005. The SHO period is 2 May 2005 through 6 August 2007. The post-SHO period is 7 August 2007 through 31 December 2010. The sample is from the 2004 Russell 3000 Index as of June 2002. The difference in abandonment rates is calculated as the difference between the abandonment rate for pilot acquirers and the abandonment rate for nonpilot acquirers of proposed value-reducing acquisitions during the time period.
Jrfm 16 00486 g001
Figure 2. Media attention given to short selling activities during the pre-SHO and the SHO periods. This figure depicts the monthly number of news articles including “short sellers” or “short selling” in the Wall Street Journal, New York Times, Washington Post, and USA Today during the pre-SHO and SHO periods of the Regulation SHO pilot program. The pre-SHO period is 1 January 2002 through 1 May 2005. The SHO period is 2 May 2005 through 6 August 2007.
Jrfm 16 00486 g002
Table 2. Distribution of value-reducing acquisition attempts by SHO program across years and industries. This table presents the distribution of the sample of value-reducing acquisition attempts across years in Panel A and across industries in Panel B for Regulation SHO pilot and nonpilot acquirers over the period of 1 January 2002 through 31 December 2010, obtained from the Thomson Financial SDC Mergers and Acquisitions database.
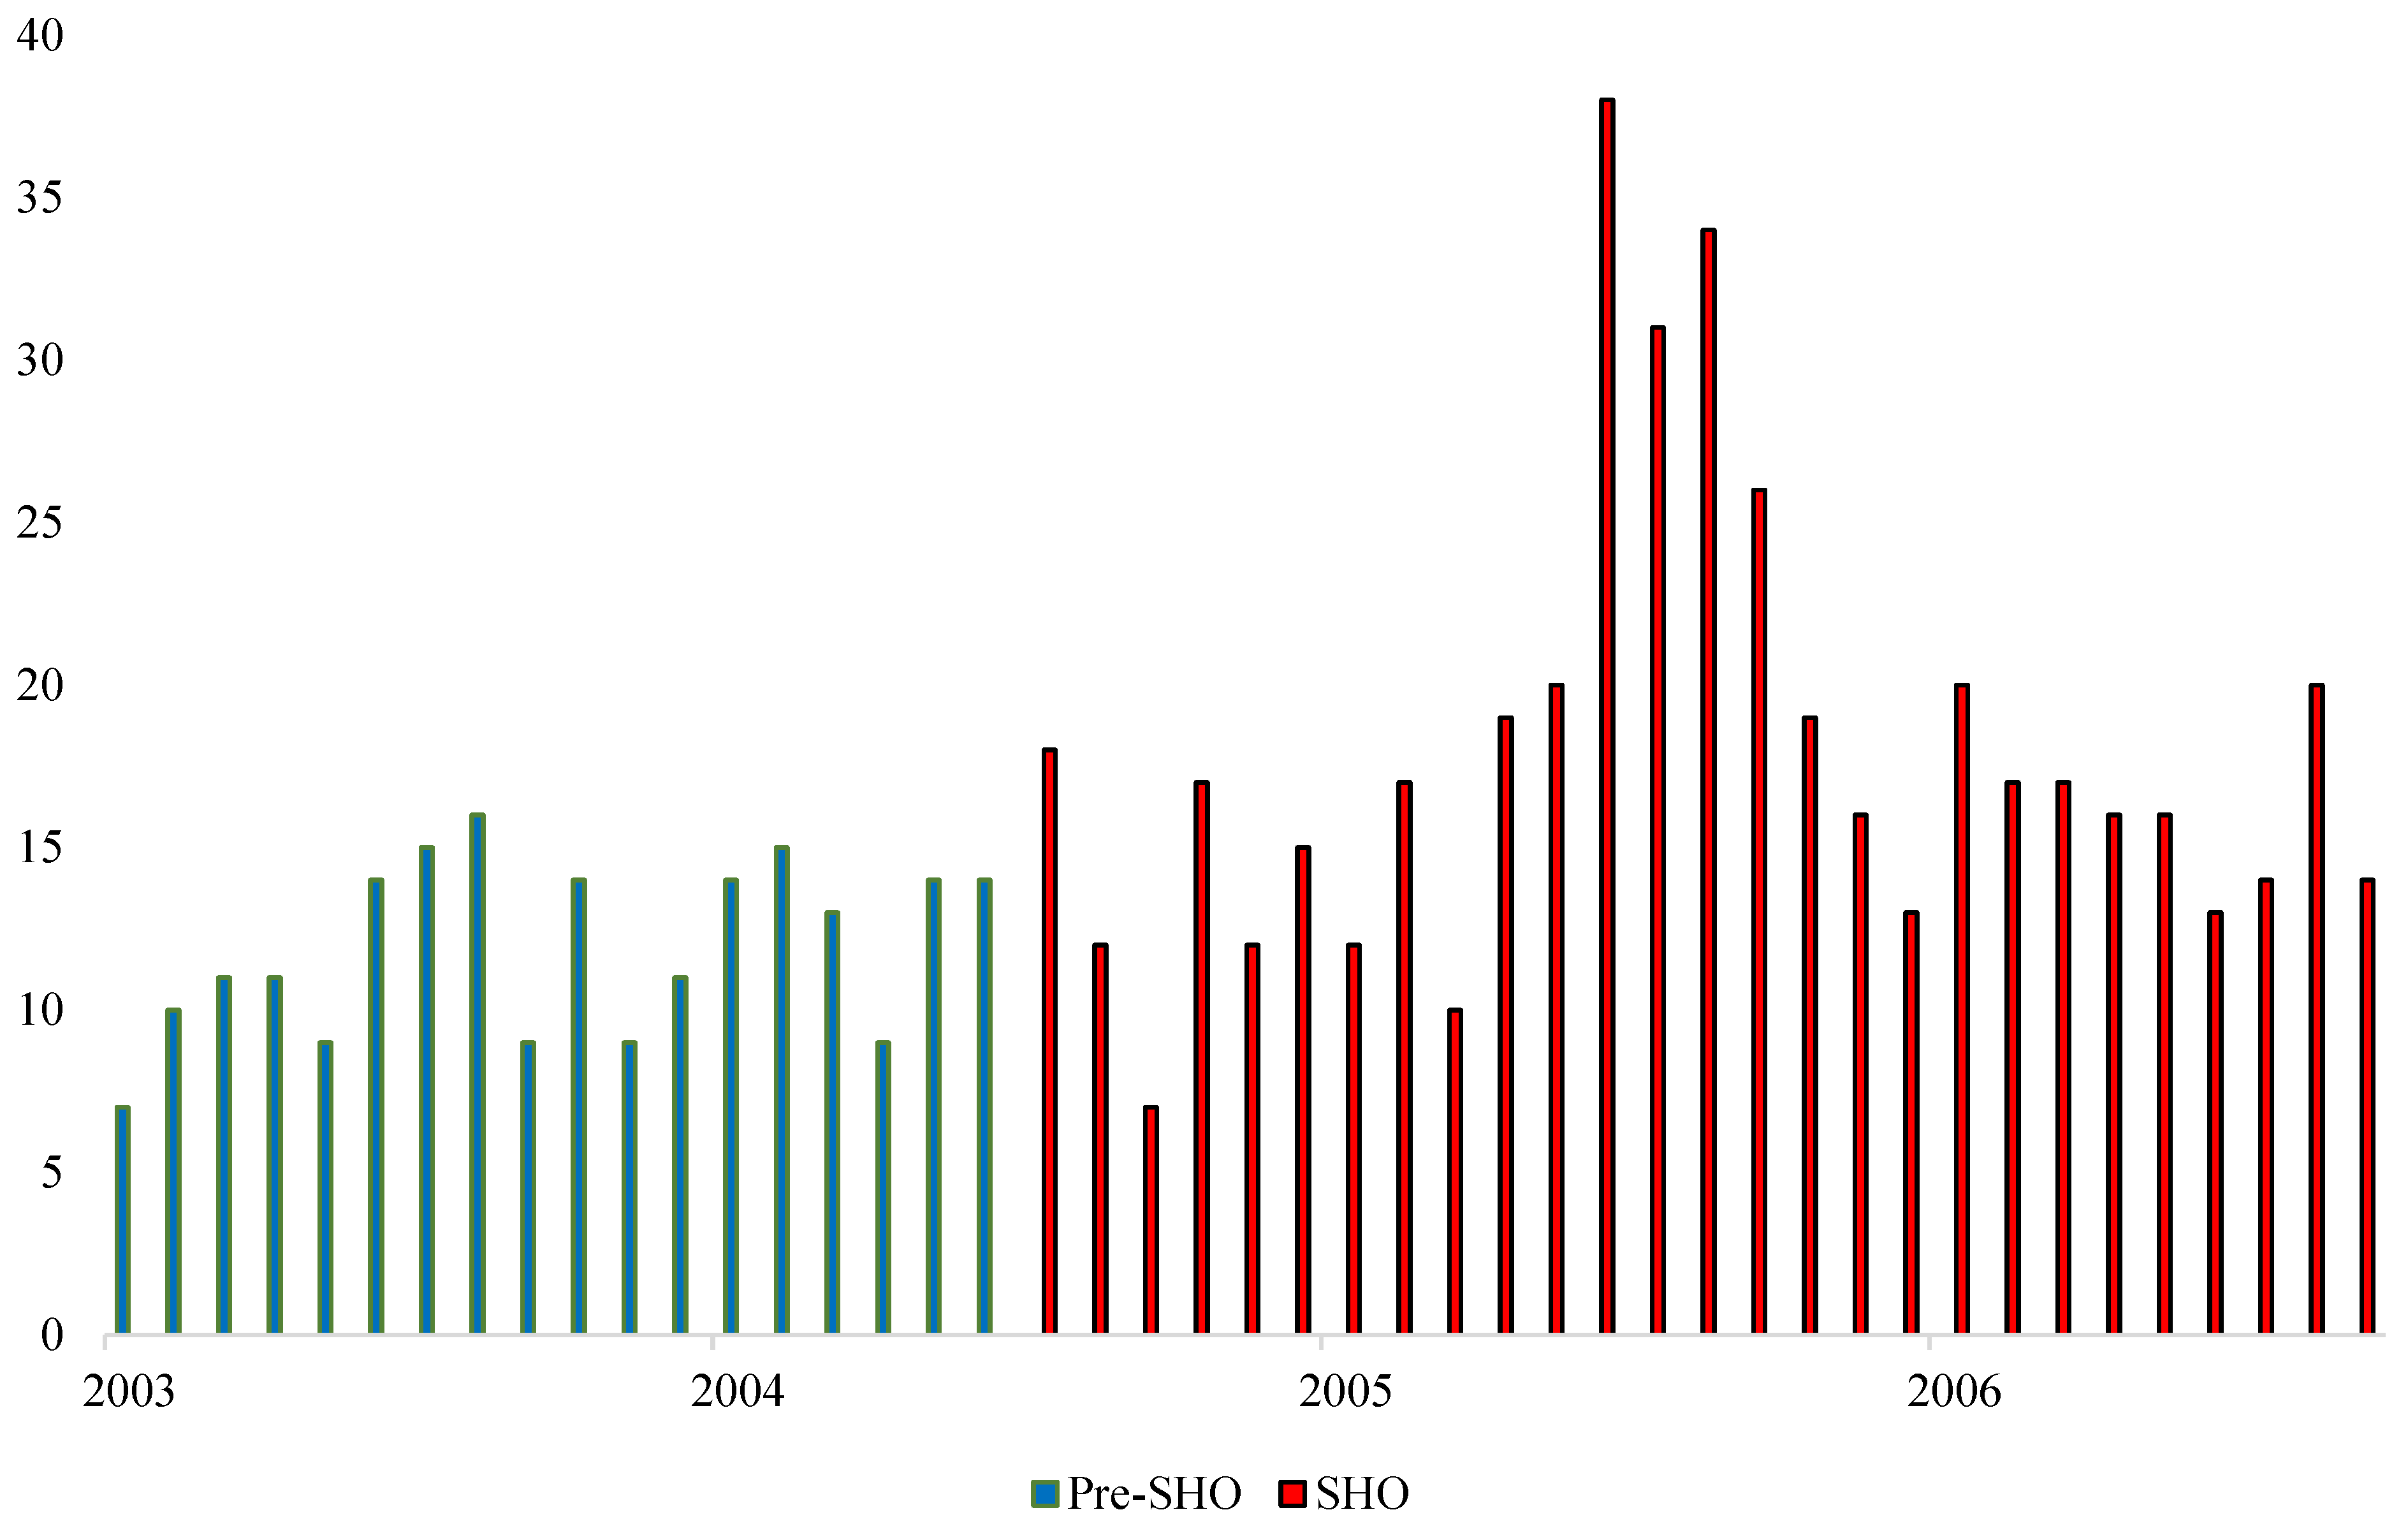
Panel A: Distribution of acquisition attempts across years
YearPilot AcquirersNonpilot Acquirers% Pilot Acquirers
2002153927.78%
2003214930.00%
2004467438.33%
2005397833.33%
2006466541.44%
2007336533.67%
2008244833.33%
2009142535.90%
2010314441.33%
Total26948735.58%
Panel B: Distribution of acquisition attempts across industries
IndustryN% of Acquisitions AttemptsPilot Acquirers% Pilot Acquirers Acquisitions
Energy658.60%3132.29%
Materials233.04%825.81%
Industrials739.66%2323.96%
Consumer Discretionary425.56%1627.59%
Consumer Staples172.25%832.00%
Health Care11415.08%3825.00%
Financials13918.39%5427.98%
Information Technology16722.09%5424.43%
Telecommunication Services283.70%720.00%
Utilities192.51%829.63%
Real Estate699.13%2224.18%
Total756100.00%26935.58%
Table 3. Descriptive statistics. This table presents descriptive statistics for value-reducing acquisition attempts by the Regulation SHO pilot and nonpilot firms obtained from the Thomson Financial SDC Mergers and Acquisitions database over the period of 1 January 2002 through 31 December 2010. Panels A and B show the means and medians for acquirers and transaction characteristics, respectively, both for the full sample and for subsamples of only pilot and only nonpilot acquirers. All variables are defined in Appendix A. Statistical tests for differences in means and medians for each characteristic for pilot and nonpilot acquirers are also presented. ***, **, and * indicate significance at 1%, 5%, and 10%, respectively.
Full SamplePilot AcquirersNonpilot AcquirersDifference
MeanMedian MeanMedian MeanMedian MeanMedian
Panel A. Acquirer and acquisition characteristics
Acquirer Size 17,477.24 3396.49 13,173.03 3334.04 19,854.72 3430.69 −6681.69 **−96.65
Equity Market-to-Book Ratio2.58 2.41 3.24 2.42 2.21 2.40 1.03 **0.02
Log (Firm Age)2.94 3.00 2.91 2.94 2.95 3.00 −0.05−0.05
Transaction Value 1785.32 289.20 2104.46 300.00 1609.04 275.00 495.4225.00
CAR (%)−3.81−2.22−4.14−2.59−3.63−2.13−0.52−0.46 *
Panel B: Percentage of acquisition attempts with the following characteristics (in %)
Defense Dummy1.06 -1.49 -0.82 -0.67-
Compete Dummy2.51 -4.09 -1.64 -2.45 *-
Hostile Dummy0.79 -0.74 -0.82 -−0.08-
Tender Offer Dummy3.57 -4.09 -3.29 -0.80-
Lockup Dummy0.53 -0.74 -0.41 -0.33-
Termination Fee Dummy31.08 -31.60 -30.80 -0.80-
Stock Dummy62.43-65.06-60.99-4.07-
Same State HQ Dummy26.46 -30.11 -24.44 -5.68 *-
Definitive Agreement Dummy95.37 -94.05 -96.10 -−2.05-
Table 4. Acquisition abandonment during the pre-SHO, SHO, and post-SHO periods. This table presents the estimates of a triple difference analysis in a linear probability model of acquisition abandonment. The sample includes 756 value-reducing acquisition attempts by the Regulation SHO pilot and nonpilot firms announced over the period of 1 January 2002 through 31 December 2010. The dependent variable is an indicator that is given the value of one for abandoned acquisition attempts and zero for completed attempts. An acquisition attempt is classified as pilot if the acquirer was designated as a pilot firm during the Regulation SHO pilot program and is designated as SHO or post-SHO based on the announcement date of the acquisition attempt. Variables are defined in Appendix A. All regressions control for year and industry fixed effects. The coefficient estimates of the constant, year, and industry dummies are omitted for brevity. Heteroskedasticity-robust standard errors are clustered by industry, and t-statistics are reported in brackets. ***, **, and * indicate significance at 1%, 5%, and 10%, respectively.
Dependent Variable: Abandonment (1,0)
(1)(2)
CAR × Pilot × SHO −2.087 ***
[−2.67]
CAR × Pilot × Post-SHO −0.910
[−0.82]
CAR−0.582 ***−1.645 ***
[−2.71][−5.53]
Pilot −0.001
[−0.05]
SHO 0.032
[1.60]
Post-SHO 0.008
[0.33]
CAR × Pilot 0.720
[0.87]
CAR × SHO 1.850 ***
[4.96]
CAR × Post-SHO 1.820 ***
[5.00]
Pilot × SHO −0.041
[−1.60]
Pilot × Post-SHO 0.006
[0.13]
Defense Dummy0.353 ***0.371 ***
[2.76][3.25]
Compete Dummy0.334 ***0.342 ***
[4.64][4.35]
Hostile Dummy0.518 **0.533 **
[2.22][2.40]
Tender Offer Dummy−0.029−0.030
[−0.38][−0.47]
Lockup Dummy−0.129−0.164
[−0.49][−0.68]
Termination Fee Dummy0.0040.004
[0.42][0.44]
Stock Dummy0.0100.009
[0.92][0.89]
Ln(Market Cap)−0.006−0.006
[−1.08][−1.13]
Same State HQ Dummy−0.023 ***−0.030 ***
[−3.13][−3.72]
Definitive Agreement Dummy0.074 ***0.070 ***
[3.88][3.46]
Industry Fixed EffectsYesYes
Year Fixed EffectsYesYes
Observations756756
Adj. R20.23970.2699
Table 5. Acquisition abandonment during the pre-SHO, SHO, and post-SHO periods by the type of acquisition. This table presents estimates of a triple difference analysis in a linear probability model of acquisition abandonment. The sample includes 756 value-reducing acquisition attempts by the Regulation SHO pilot and nonpilot firms announced over the period of 1 January 2002 through 31 December 2010. The dependent variable is an indicator that takes the value of one for abandoned acquisition attempts and zero for completed attempts. An acquisition attempt is classified as pilot if the acquirer was designated as a pilot firm during the Regulation SHO pilot program and is designated as SHO or post-SHO based on the announcement date of the acquisition attempt. The sample is split based on whether the acquisition attempt is categorized as a diversifying or focused acquisition attempt. A diversifying acquisition attempt is defined as one in which the target and acquiring firm are not in the same Fama–French 17 industry. Variables are defined in Appendix A. All regressions control for year and industry fixed effects. The coefficient estimates of the constant, year, and industry dummies are omitted for brevity. Heteroskedasticity-robust standard errors are clustered by industry, and t-statistics are reported in brackets. ***, **, and * indicate significance at 1%, 5%, and 10%, respectively.
Dependent Variable: Abandonment (1,0)
Diversifying AcquisitionFocused Acquisition
AttemptsAttempts
CAR × Pilot × SHO−7.524 **−0.338
[−2.37][−0.37]
CAR × Pilot × Post-SHO−2.3101.683
[−1.66][1.63]
CAR−1.995 *−1.668 ***
[−1.67][−4.30]
Pilot0.050−0.019
[1.09][−0.62]
SHO−0.0350.030
[−0.31][1.24]
Post-SHO−0.011−0.036
[−0.11][−1.17]
CAR × Pilot2.000−1.178
[1.47][−1.39]
CAR × SHO1.9591.688 ***
[1.62][4.03]
CAR × Post-SHO2.232 *1.395 ***
[1.79][3.34]
Pilot × SHO−0.150−0.005
[−1.50][−0.19]
Pilot × Post-SHO−0.0930.060
[−1.46][1.14]
Industry Fixed EffectsYesYes
Year Fixed EffectsYesYes
Observations197559
Adj. R20.13340.1714
Table 6. Acquisition abandonment during the pre-SHO, SHO, and post-SHO periods by the type of target. This table presents estimates of a triple difference analysis in a linear probability model of acquisition abandonment. The sample includes 756 value-reducing acquisition attempts by the Regulation SHO pilot and nonpilot firms announced over the period of 1 January 2002 through 31 December 2010. The dependent variable is an indicator that takes the value of one for abandoned acquisition attempts and zero for completed attempts. An acquisition attempt is classified as pilot if the acquirer was designated as a pilot firm during the Regulation SHO pilot program and is designated as SHO or post-SHO based on the announcement date of the acquisition attempt. The sample is split based on whether the target firm is categorized as high-tech by the SDC database along with the acquirer having a different SIC Code than the target. Variables are defined in Appendix A. All regressions control for year and industry fixed effects. The coefficient estimates of the constant, year, and industry dummies are omitted for brevity. Heteroskedasticity-robust standard errors are clustered by industry, and t-statistics are reported in brackets. ***, **, and * indicate significance at 1%, 5%, and 10%, respectively.
Dependent Variable: Abandonment (1,0)
High-Tech TargetNon-High-Tech Target
CAR × Pilot × SHO−2.334 ***−1.255
[−3.22][−1.11]
CAR × Pilot × Post-SHO−1.9430.338
[−1.11][0.26]
CAR−1.126 ***−1.731 ***
[−2.88][−3.27]
Pilot−0.0220.021
[−0.25][0.65]
SHO−0.0620.034
[−0.78][1.53]
Post-SHO−0.1150.000
[−0.88][0.01]
CAR × Pilot0.7250.006
[0.82][0.01]
CAR × SHO0.8561.920 ***
[1.23][3.88]
CAR × Post-SHO1.204 ***1.866 ***
[3.39][2.80]
Pilot × SHO−0.030−0.060 **
[−0.40][−2.12]
Pilot × Post-SHO−0.0500.018
[−0.42][0.35]
Industry Fixed EffectsYesYes
Year Fixed EffectsYesYes
Observations203553
Adj. R20.10480.1614
Table 7. Acquisition abandonment during the pre-SHO, SHO, and post-SHO periods by the corporate governance of the acquirer. This table presents estimates of a triple difference analysis in a linear probability model of acquisition abandonment. The sample includes 756 value-reducing acquisition attempts by the Regulation SHO pilot and nonpilot firms announced over the period of 1 January 2002 through 31 December 2010. The dependent variable is an indicator that is given the value of one for abandoned acquisition attempts and zero for completed attempts. An acquisition attempt is classified as pilot if the acquirer was designated as a pilot firm during the Regulation SHO pilot program and is designated as SHO or post-SHO based on the announcement date of the acquisition attempt. Column (1) includes acquisition attempts where the acquiring firm has Strong Shareholder Rights based on their E-Index, and Column (2) includes acquisition attempts where the acquiring firm has Weak Shareholder Rights based on their E-Index. Variables are defined in Appendix A. All regressions control for year and industry fixed effects. The coefficient estimates of the constant, year, and industry dummies are omitted for brevity. Heteroskedasticity-robust standard errors are clustered by industry, and t-statistics are reported in brackets. ***, **, and * indicate significance at 1%, 5%, and 10%, respectively.
Dependent Variable: Abandonment (1,0)
Strong Shareholder RightsWeak Shareholder Rights
CAR × Pilot × SHO−4.387 ***−1.621 **
[−4.03][−2.26]
CAR × Pilot × Post-SHO−0.935−0.207
[−1.55][−0.49]
CAR−2.719 ***−2.007 ***
[−7.74][−5.95]
Pilot0.0680.065
[1.31][1.07]
SHO−0.0600.012
[−0.48][0.22]
Post-SHO−0.151−0.053
[−1.47][−1.03]
CAR × Pilot2.486 ***1.704 ***
[6.50][3.06]
CAR × SHO2.758 ***2.167 ***
[7.85][5.80]
CAR × Post-SHO1.917 ***2.069 ***
[3.93][5.16]
Pilot × SHO−0.115 **−0.077
[−2.15][−1.13]
Pilot × Post-SHO0.000−0.056
[0.00][−0.88]
Industry Fixed EffectsYesYes
Year Fixed EffectsYesYes
Observations246253
Adj. R20.18830.1918
Disclaimer/Publisher’s Note: The statements, opinions and data contained in all publications are solely those of the individual author(s) and contributor(s) and not of MDPI and/or the editor(s). MDPI and/or the editor(s) disclaim responsibility for any injury to people or property resulting from any ideas, methods, instructions or products referred to in the content.

