Article

Trading Activity in Public Real Estate Markets

ZHAW School of Management and Law, Technoparkstrasse 2, 8400 Winterthur, Switzerland
J. Risk Financial Manag. 2022, 15(9), 374; https://doi.org/10.3390/jrfm15090374
Submission received: 21 July 2022 / Revised: 21 August 2022 / Accepted: 23 August 2022 / Published: 24 August 2022

Abstract

:
Trading activity is an important characteristic of financial markets, since it is related to price discovery, volatility, and market liquidity. It is therefore of crucial importance to understand what drives trading activity in real estate markets. Here, we use a panel dataset consisting of 142 US REIT stocks observed over almost 20 years and a fixed-effects regression approach to link variation in trading activity to proxies for different trading motives (theory-motivated). The paper shows that the drivers of trading activity in real estate markets are distinct from those in the broader equity market. Proxies for portfolio rebalancing needs and liquidity trading are shown to be important trading motives in REIT markets. However, unlike in the broader equity market, difference of opinions and information-based trading motives seem to play a minor role for REIT trading activity.

1. Introduction

Liquidity and trading activity in financial markets have received a lot of attention from academics, industry professionals, and exchange officials in recent years. While the equity market in general has been studied extensively, studies on the real estate market are scarce. Market microstructure research in real estate markets has centered around the pricing of liquidity and liquidity risk as well as common liquidity movements and their determinants. Many topics around trading activity in real estate markets remain unexplored. This is surprising because (1) trading activity is an important feature of financial markets, (2) the nature of real estate investment trusts (REITs) is different from regular stocks, (3) the existing studies have found distinct liquidity dynamics for real estate markets, and (4) trading activity and liquidity are distinct quantities.
This paper contributes to the literature by studying the motives for trading activity in the US REIT market. Previous research has shown that trading activity and liquidity are distinct quantities. Fleming (2003) states that market episodes with poor liquidity are associated with both high and low levels of trading volume. Similarly, Mancini et al. (2013) concludes that “the relation between liquidity and trading activity is ambiguous”. Östberg and Richter (2018) also show that the relation between liquidity and volume is state-dependent.
Trading activity is an important variable itself. A thorough understanding of this variable is crucial because it predicts returns (Chordia et al. 2001a), is related to transaction costs (Hartmann 1999; Bessembinder 1994), can be an origin of market volatility (Danthine and Moresi 1993), and supports the incorporation of information into security prices (Barclay and Hendershott 2003). The importance of the topic is also highlighted by the high and ever-increasing trading volume in the US equity market. In 2020, the daily average trading volume amounted to USD 479.4 billion.
Market microstructure theory predicts that trading arises from (1) portfolio rebalancing needs, (2) liquidity needs, (3) information, and (4) differences in beliefs (see Section 2). Empirical studies of the broader equity market have found evidence in favor of all four of these trading motives. Chordia et al. (2007) showed that factors that proxy for the respective trading motives can explain cross-sectional differences in the trading activity of US equities.
Do these results from the broader equity market transfer to the REIT market? The previous market microstructure literature that studied REITs has shown that the market microstructure of this segment is distinct from other asset classes. As noted, e.g., by Hoesli et al. (2017) when studying common liquidity movements and REIT returns, one must consider intra-market commonality (liquidity correlations among REITs) and cross-asset commonality (liquidity correlation among stock and REIT markets) as well as commonality with the underlying property market. This is because REITs are interlinked with the equity market, and there are transparent benchmarking opportunities (Hoesli et al. 2017).1 A distinct analysis for REIT trading activity therefore seems important.
We argue that the distinct features of REITs are important when it comes to the motives for trading in this market. Given the transparency and the benchmarking opportunities for the underlying assets (Hoesli et al. 2017) REIT stocks are predestined for liquidity trades. This suggests that liquidity trading is a more important trading motive in REIT markets than in the broader equity market.
In addition, REITs provide stable and predictable cash flows (Nelling and Gyourko 1998), and there are mandatory dividend payments amounting to 90% of the taxable income (Chou et al. 2013). This reduces managerial discretion and therefore agency problems (Jensen 1986). We therefore hypothesize that differences in beliefs are less likely to be an important driver for REIT trading. Given the transparency and the stability of REITs, we also claim that private information acquisition is less likely to generate a significant advantage and is therefore less important as a trading motive (compared to the broader equity market).
Overall, this paper contributes to the existing market microstructure literature for REIT markets by showing that trading activity in REIT stocks is predominantly driven by factors related to proxies that resemble liquidity trading (portfolio rebalancing activity and stock visibility). Proxies for information-based trading and differences in beliefs do not have significant explanatory power. A special analysis during the COVID-19 period shows a quite different picture. A proxy for differences in beliefs gained significant importance. This can be reconciled with increased cash-flow uncertainty for REITs during the pandemic (Akinsomi 2020) and less information from the private real estate market (Van Dijk et al. 2020).

2. Literature Review

For decades, the academic literature has been concerned with the drivers of trading activity. Models that assume frictionless markets, rational expectations, and homogenous agents show that there will not be trade among individuals if their original portfolio allocation is pareto efficient (Milgrom and Stokey 1982; Marshall 1974). However, these theories are not in line with the significant trading volume that can be observed empirically. As pointed out in Section 1, the daily average trading volume in the US equity market reached almost USD 500 billion in 2020. To explain this stylized fact, the theoretical literature has identified information, liquidity needs, rebalancing, and differences in beliefs as motives for trading.
A first generation of models such as the model of Grossman and Stiglitz (1980), rationalized trades with the existence of informed and uninformed traders. They do not differ ex ante, but some traders engage in costly information acquisitions and therefore gain an informational advantage, leading them to acquire underpriced stocks, which creates trading volume. The presence of informed traders can also explain the existence of transaction costs such as bid-ask spreads and links trading activity to the liquidity of a security.
Newer models rationalized the occurrence of trading with liquidity needs (liquidity trading or non-information-based trading). According to Subrahmanyam (1991), liquidity trades occur when individuals are invested in securities and have immediate cash flow needs (unplanned) due to, e.g., immediate consumption needs, wealth shocks, or due tax payments. These individuals are usually referred to as liquidity traders. Under certain assumptions, they trade even though they face transaction costs because of the presence of informed traders. Well-known models where trading activity is rationalized with the liquidity motive include Kyle (1985), Glosten and Milgrom (1985), and Diamond and Verrecchia (1987).
Trading can also arise from differences in beliefs as suggested by Wang (1998), Kandel and Pearson (1995), and Harris and Raviv (1991). Heterogeneous beliefs (also referred to as differences in opinion) arise either due to different beliefs about an asset’s fundamental value or due to different beliefs about the relationship between new information (referred to as signal in the respective papers) and the actual value of an asset (Wang 1998).
Based on these theoretical models, numerous papers have investigated the drivers of trading activity. The closest paper to this one is that of Chordia et al. (2007). The paper investigates drivers of trading activity along the dimensions of different trading motives for the US equity market using cross-sectional regression techniques. The paper found evidence in favor of all the above-mentioned trade motives. Chordia et al. (2001b) investigated the drivers of time variation of aggregate market liquidity. This paper contributes to the literature by assessing the relevance of the above-mentioned theories to rationalize trading activity for the special case of REITs.
Since the paper studies the market microstructure of real estate markets, it is naturally related to papers that study liquidity in real estate markets. The measurement (e.g., Kluger and Miller 1990) and the characteristics of liquidity (see Ametefe et al. (2016) for a thorough literature review) have been extensively studied in real estate markets. Moreover, researchers have established that the characteristic level of liquidity is related to real estate returns (e.g., Cajias et al. 2020; Benveniste et al. 2001). Recently, it has been shown that liquidity risk is also priced in real estate markets (Hoesli et al. 2017; DiBartolomeo et al. 2021).
By virtue of studying REITs, this paper is also related to the strand of literature that tries to improve our understanding of REITs as an investment vehicle. Previous research has focused on the performance and investment decisions of REITs (Parker 2014; Newell and Marzuki 2018; Newell et al. 2013; Yat-Hung et al. 2008), the emergence of REITs (Newell and Marzuki 2018; Marzuki and Newell 2018; Schacht and Wimschulte 2008) as well as the significance of REITs for the overall property investment sector (e.g., Lin et al. 2019). Moreover, Kyriakou et al. (2021) study the integration between the real estate and the stock market for selected developed countries. This paper adds to this literature by enhancing our understanding of the motives for REIT trading.

3. Data and Variable Definition

We use data from the financial data provider Refinitiv (formerly Thomson Reuters). We consider all REIT stocks that are primarily listed on the NYSE and NASDAQ. We identify REITs by the Thomson Reuters Industry Sector Code “Commercial and Residential REITs”. In addition, we focus our analysis on common stocks. We only keep the observations for which, we can calculate all the necessary variables we need for our analysis. This resulted in a sample of 142 REIT stocks. We tracked those stocks for almost twenty years between February 2002 and December 2020. This resulted in a sample of 14,781 observations. The sample therefore includes calm periods as well as crisis periods (e.g., the great financial crisis and the beginning of the COVID-19 pandemic).
To measure trading activity, we retrieved data on the number of shares traded. We calculated the daily USD trading volume (VOL) by multiplying the number of shares traded with the closing price for the respective day. We aggregated the trading volume to monthly figures. As determinants of trading activity, we consider, in line with Chordia et al. (2007), proxies for investor rebalancing and liquidity trading as well as measures to capture information-based trading and differences of opinion. We focus on proxies that can be applied over a long history and are readily available for a large cross-section of stocks.
Portfolio rebalancing could be triggered by price changes. This is because price changes passively change an investor’s target portfolio allocation and therefore may lead to rebalancing trades (Calvet et al. 2009). We retrieved daily total return data and calculated first the absolute return and then the average over a month (RET). The higher the price changes are (no matter in which direction), the higher the trading incentives because of the rebalancing motive (see, e.g., Chordia et al. 2007). This variable was winsorized at the 99.9% quantiles to remove extreme returns.
To capture differences in stock visibility, which are proxies for the liquidity trading motives, we used the natural logarithm of the price level (PCR), the book-to-market ratio (BTM), and the natural logarithm of the market value (LMVL). According to Chordia et al. (2007), these quantities are related to stock visibility. PCR is relevant because brokers prefer to advertise low-priced stocks (see also Brennan and Hughes 1991) leading to increased trading activity. However, the relationship can also be positive because mutual funds prefer high priced stocks due to lower bid-ask spreads (Chordia et al. 2007). Growth stocks (low BTM) usually have a lot of press coverage, and large stocks receive more investor attention (see also Merton 1987). The BTM variable was winsorized at the 5% and 95% quantiles. The BTM variable was calculated based on the latest available accounting data. This is also the case for all the variables that require accounting input described in the following paragraphs. REITs are particularly suited for liquidity trading because they are transparent assets with benchmarking opportunities. Therefore, it is to be expected that liquidity trading is more important for REITs than for common stocks.
Following Chordia et al. (2007), we used analyst coverage as a proxy for information-based trading (LAN). We transformed the number of analysts as log(1+Number of Analysts) and refer to it as LAN. Research has shown that analyst forecasts are informative (Womack 1996) and that stock prices adjust faster to new information when many analysts cover it (Brennan et al. 1993). The more analysts cover a company the more information is created and the higher the likelihood that trades occur (due to information).
Differences in beliefs are approximated with debt-to-asset ratio (LEV), because enhanced risk is associated with more uncertain projects (Chordia et al. 2007). The variable was winsorized at the 95% quantile. In addition, we consider earnings surprise (SUP) and earnings volatility (EVO) to capture differences in beliefs. SUP is calculated as the difference of the actual EPS (earnings per share) vs. the consensus estimate EPS. EVO is calculated as the standard deviation of the last 8 EPS observations. Both variables were winsorized at the 5% and 95% quantiles.
Following the argument of Coles and Loewenstein (1988), low information securities have high betas. Chordia et al. (2007) therefore included betas in their regression with the intention to measure greater estimation errors made for low information securities and therefore greater error correction (trade incentive). We estimated individual betas with daily data and rolling regressions for 200-day windows using the following equation: R i = α i + β i R m + e i , where Ri is the individual REITs daily return and Rm is the market return (S&P500). The beta used in the regression (BET) is a monthly average of the betas calculated as described above.

4. Empirical Analysis

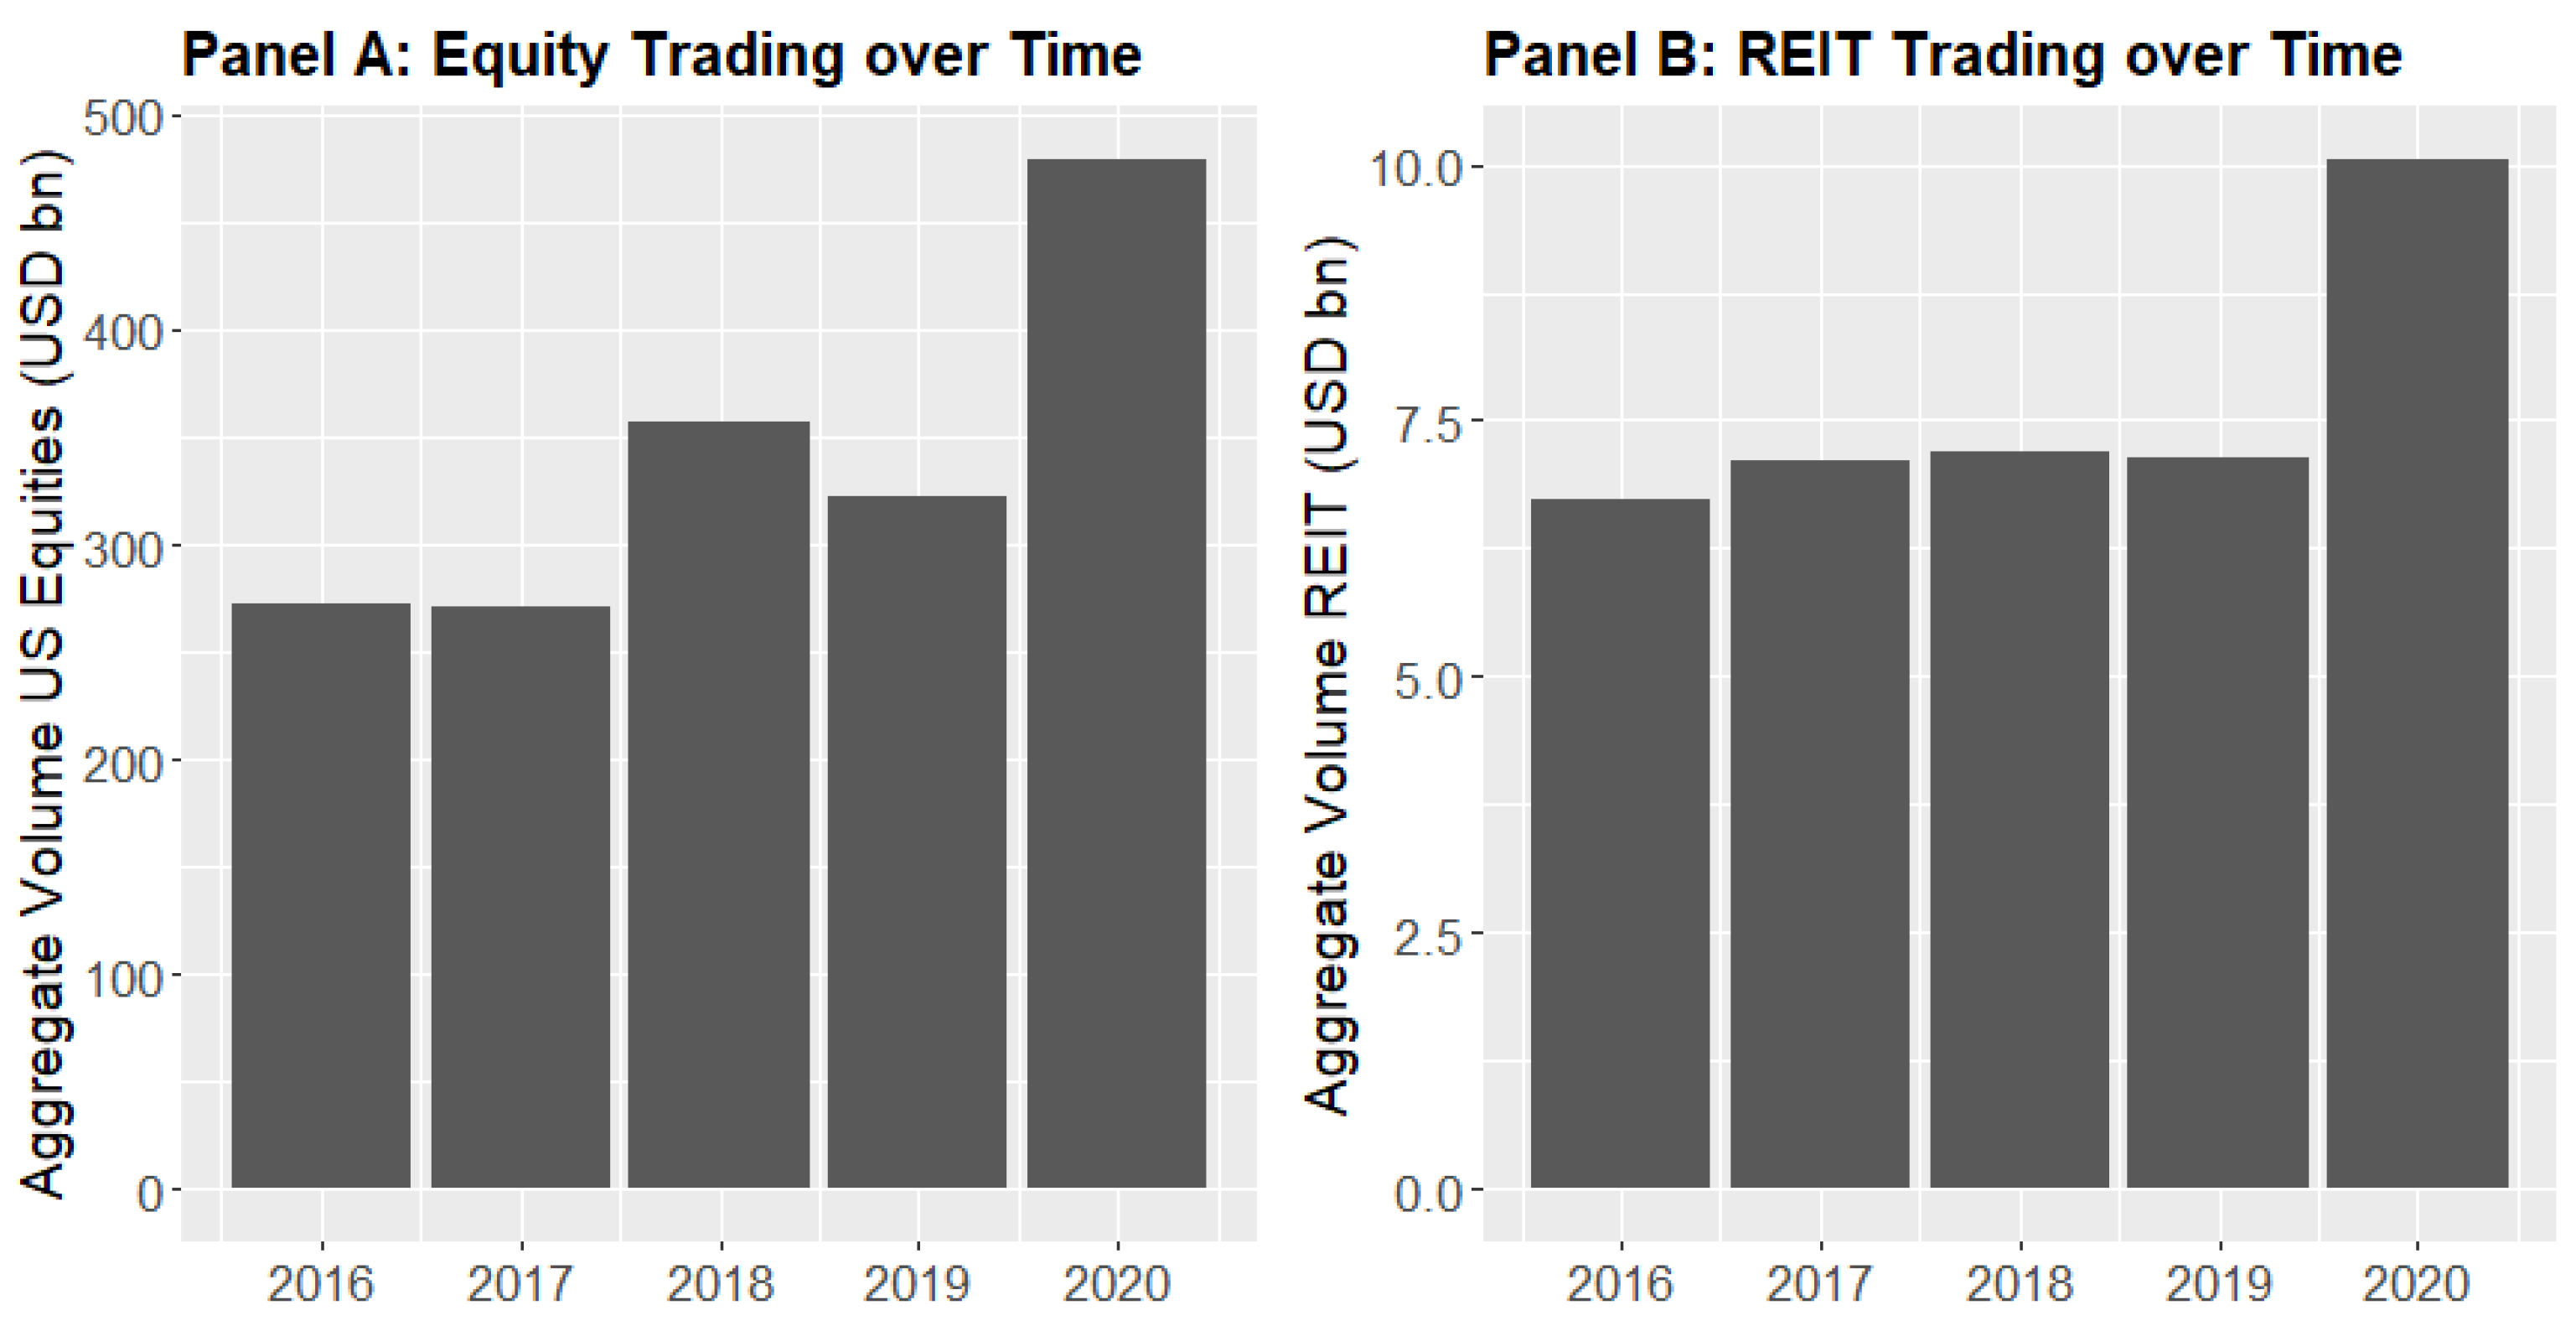
4.1. Descriptive Statistics

Figure 1 plots the aggregate volume of the US equity market as reported by SIFMA together with the trading volume of the REIT stocks in our sample data. The graph shows that the trading activity in the broader equity market is much more volatile than for the REIT stocks. While the trading activity in REIT stocks was stable between 2016 and 2019, the average yearly volume change (absolute) was substantial in the equity market. This is consistent with the hypothesis that trading dynamics in the REIT segment are distinct from the broader equity market. A more stable development of the trading activity is also suggestive of a more important role of liquidity trading for REIT trading, since liquidity trades are evenly distributed over time and are not expected to be clustered around the dissemination of new information. In both cases, trading activity jumped during the year 2020, which indicates that the COVID-19 crisis led to a significant increase in trading volume.
Figure 2 plots the trading activity for the segments Residential, Diversified, and Mortgage REITs between 2002 and 2020. The graph shows that the development of trading activity across the different segments is quite distinct. The trading activity of Mortgage REITs spiked two times between 2010 and 2015, while both Diversified and Residential REITs did not show any abnormal spikes at the time. Similarly, the reaction to the current COVID-19 crisis is much more pronounced for Residential REITs than for Diversified and Mortgage REITs. Using the panel structure of our dataset, we aim to explain both the time series as well as the cross-sectional variations in REIT trading activity.
In Table 1, we show the descriptive statistics of our variables, including the USD trading volume (VOL), as well as the potential explanatory factors.

4.2. Baseline Results

In this section, we relate trading activity to the variables that are a proxy for different trading motives in a fixed effects regression model.2 We therefore estimate the following regression model:
V O L i t = a t + a i + β 1 L M V L i t + β 2 T R E i t + β 3 P C L i t + β 4 B T M i t + β 5 B E T i t + β 6 N A N i t + β 7 L E V i t + β 8 S U P i t + β 9 E V O i t + ε i t .
where at and ai are time and firm fixed effects, respectively. Table 2 contains the results of estimating the above model in different specifications. Specification (1) uses both time and firm fixed effects, specification (2) uses only firm fixed effects, specification (3) uses only time fixed effects, and specification (4) uses pooled OLS to estimate the model. We used double clustered standard errors around firm and time as suggested by Petersen (2009).
The results in Table 2 show that the variables related to rebalancing and liquidity trading can statistically explain variation in trading volume. Most notably, the absolute total return (TRE) is positively related to trading volume (VOL). This relation is statistically significant at the 1% level in all four specifications. The sensitivities decrease with the inclusion of additional fixed effects. However, the economic magnitude of the estimated effect remains sizable. For example, a 1% increase in the absolute total return of a stock leads to a volume increase of USD 8.7 million for the average stock. This corresponds to 14% of the average daily trading volume.
In addition, the market capitalization (LMVL) is positively associated with trading volume. This is consistent with the view that large stocks receive more investor attention and are therefore more frequently traded. The price level (PCL) has a different sign than expected. We hypothesized that brokers advertise low-priced stocks more aggressively. However, if prices increase, the USD trading volume increases mechanically as well. The book-to-market ratio (BTM) is also positively related to trading. The effect was ambiguous in the result of Chordia et al. (2007).
The measures for information-based trading and differences in beliefs contribute less to the explanation of the variation in trading activity. In specification (1), which is the most saturated specification that contains both time and individual fixed effects, none of the proxies related to these trading motives are statistically significant. In specifications (3) and (4), there is a statistically significant relation between the number of analysts that follow a stock and trading activity suggesting that market participants may trade on information. However, it cannot be excluded that this relation is driven by other unobserved firm-level factors. Once they are included (specifications (1) and (2)), the relationship is not statistically significant anymore. In some specifications, earnings volatility and leverage are statistically significant at the 10% level. Earnings surprises and the beta are not statistically significant in any of the considered specifications.
Table 3 maps the trading motives and the applied proxies to the results of Table 2. The first column contains the respective trading motives. The second column contains the applied proxies. The third column briefly explains the intuition behind these proxies (more details in Section 3). The fourth and fifth column contains information about the expected and actual relationship between trading volume and the respective variable. The sixth column elaborates on the differences between REIT stocks and the broader equity market.
Overall, the results confirm that trading in the real estate market seems to be predominantly driven by liquidity trading motives such as portfolio rebalancing and stock visibility. There is only little evidence that information and differences in belief are important motives for REIT trading.

4.3. Trading in Times of Crises

We have seen from Figure 1 that during the COVID-19 pandemic, there was ample trading activity in both US REITs and the broader US equity market. Given the unusually high uncertainty associated with the black swan event COVID-19, we want to analyze whether the relationships between the variables proxying for trading motives and trading volume are changing during the crisis. High uncertainty during the pandemic may lead to an increased value of information acquisition and therefore more information-based trading. Moreover, there might be disagreement (different beliefs) regarding the future development of the real estate sector that could also lead to an exchange of real estate assets.
To investigate this in our regression model, we included interaction terms of the proxies related to information-based trading or differences in beliefs with a great financial crisis dummy (G) or a COVID-19 pandemic dummy (C), respectively. The COVID-19 pandemic dummy took the value of one between February and December 2020 (end of the sample period) and the value of zero otherwise. The great financial crisis dummy was one in the years 2008–2012 and zero otherwise. The coefficients associated with the interaction terms indicate a different relationship between trading activity and the respective trading motive during crisis periods.
Table 4 contains the estimation results. Column 1 shows the coefficients associated with the interaction terms of the proxies for differences in beliefs and information based trading with the COVID-19 dummy (C). Column 2 shows the interaction of these coefficients with the global financial crisis dummy (G). The coefficients can be interpreted as the change in the relationship during the respective special period. Column 3 shows a specification with interactions of the variables for both crises.
During the COVID-19 pandemic, the relationship between the number of analysts (NAN) and trading volume changed significantly. The coefficient estimate of the interaction term indicates that the relationship between the two variables became positive during the pandemic. This is suggestive of an increased importance of information-based trading during the pandemic. However, the picture is different for the global financial crisis period. In the case of the global financial crisis, leverage (LEV) a proxy for difference in beliefs becomes more important while the number of analysts becomes less important. This shows that the two crises are distinct when it comes to the drivers of trading activity. However, there seems to be a tendency towards an increased importance of information-based trading or differences in beliefs in times of crises.

5. Conclusions

While proxies related to rebalancing and liquidity trading as well as differences in opinion and information-based trading are significantly related to trading activity in the broader equity markets, this paper shows that there is only little evidence in favor of trading activity arising from the latter two motives in the US REIT market. Trading activity in the US REIT market seems to be predominantly driven by absolute return changes and differences in market capitalization, variables related to the rebalancing and liquidity trading motives. These findings can be reconciled with the nature of REITs as a transparent asset class with benchmarking opportunities and predictable cash flows. Information acquisition and differences in beliefs become more important during crisis periods. Our results show that the relationship between trading activity and the number of analysts following a REIT strengthened during the COVID-19 pandemic.
The results of this paper are of importance for industry professionals that work in the real estate asset management industry and are engaged in the trading of REIT securities or anyone who interprets and uses REIT data. The results in this paper indicate that trading in real estate markets is less prone to information-based trading. As a result of this, it seems less likely that a potential counterparty would trade with an informational advantage. This observation can rationalize the high liquidity of REIT securities and suggests that they are a prime investment vehicle for the execution of liquidity trades (due to the lower likelihood of facing better informed traders). Different opinions increase trading volume since the trading counterparties disagree. This can create price pressure, and security prices may reverse when the uncertainty around the disagreement resolves, leading to higher volatility. Given that less trading activity in REIT seems to be driven by this motive, volatility may be reduced.

Funding

This research received no external funding.

Institutional Review Board Statement

Not applicable.

Informed Consent Statement

Not applicable.

Data Availability Statement

Proprietary data from Refinitiv. Data can be purchased from this source.

Conflicts of Interest

The author declares no conflict of interest.

Notes

1
The results from Hoesli et al. (2017) show that commonality in liquidity for REITs is distinct from the broader equity markets such as in Chordia et al. (2000). The asset class specific aspects are also highlighted in Richter (2022).
2
To decide whether a fixed effects or random effects model should be used we estimated a Hausman test. The p-value of the test was smaller than 0.01 and therefore indicated the use of a fixed effects model.

References

  1. Akinsomi, Omokolade. 2020. How resilient are REITs to a pandemic? The COVID-19 effect. Journal of Property Investment & Finance 39: 19–24. [Google Scholar]
  2. Ametefe, Frank, Steven Devaney, and Gianluca Marcato. 2016. Liquidity: A review of dimensions, causes, measures, and empirical applications in real estate markets. Journal of Real Estate Literature 24: 1–29. [Google Scholar]
  3. Barclay, Michael J., and Terrence Hendershott. 2003. Price discovery and trading after hours. Review of Financial Studies 16: 1041–73. [Google Scholar]
  4. Benveniste, Lawrence, Dennis R. Capozza, and Paul J. Seguin. 2001. The value of liquidity. Real Estate Economics 29: 633–60. [Google Scholar] [CrossRef]
  5. Bessembinder, Hendrik. 1994. Bid-ask spreads in the interbank foreign exchange markets. Journal of Financial Economics 35: 317–48. [Google Scholar] [CrossRef]
  6. Brennan, Michael J., and Patricia J. Hughes. 1991. Stock prices and the supply of information. The Journal of Finance 46: 1665–91. [Google Scholar] [CrossRef]
  7. Brennan, Michael J., Narasimhan Jegadeesh, and Bhaskaran Swaminathan. 1993. Investment analysis and the adjustment of stock prices to common information. The Review of Financial Studies 6: 799–824. [Google Scholar]
  8. Cajias, Marcelo, Philipp Freudenreich, Anna Freudenreich, and Wolfgang Schäfers. 2020. Liquidity and prices: A cluster analysis of the German residential real estate market. Journal of Business Economics 90: 1021–56. [Google Scholar] [CrossRef]
  9. Calvet, Laurent E., John Y. Campbell, and Paolo Sodini. 2009. Fight or flight? Portfolio rebalancing by individual investors. Quarterly Journal of Economics 124: 301–48. [Google Scholar]
  10. Chordia, Tarun, Avanidhar Subrahmanyam, and V. Ravi Anshuman. 2001a. Trading activity and expected stock returns. Journal of Financial Economics 59: 3–32. [Google Scholar]
  11. Chordia, Tarun, Richard Roll, and Avanidhar Subrahmanyam. 2000. Commonality in liquidity. Journal of Financial Economics 56: 3–28. [Google Scholar] [CrossRef]
  12. Chordia, Tarun, Richard Roll, and Avanidhar Subrahmanyam. 2001b. Market liquidity and trading activity. The Journal of Finance 56: 501–30. [Google Scholar] [CrossRef]
  13. Chordia, Tarun, Sahn-Wook Huh, and Avanidhar Subrahmanyam. 2007. The cross-section of expected trading activity. The Review of Financial Studies 20: 709–40. [Google Scholar] [CrossRef] [Green Version]
  14. Chou, Wen-Hsiu, William G. Hardin, Matthew D. Hill, and G. Wayne Kelly. 2013. Dividends, values and agency costs in REITs. The Journal of Real Estate Finance and Economics 46: 91–114. [Google Scholar] [CrossRef]
  15. Coles, Jeffrey L., and Uri Loewenstein. 1988. Equilibrium pricing and portfolio composition in the presence of uncertain parameters. Journal of Financial Economics 22: 279–303. [Google Scholar] [CrossRef]
  16. Danthine, Jean-Pierre, and Serge Moresi. 1993. Volatility, information and noise trading. European Economic Review 37: 961–82. [Google Scholar] [CrossRef]
  17. Diamond, Douglas W., and Robert E. Verrecchia. 1987. Constraints on short-selling and asset price adjustment to private information. Journal of Financial Economics 18: 277–311. [Google Scholar] [CrossRef]
  18. DiBartolomeo, Jeffrey A., Vladimir A. Gatchev, and David M. Harrison. 2021. The liquidity risk of REITs. Journal of Real Estate Research 43: 47–95. [Google Scholar] [CrossRef]
  19. Fleming, Michael J. 2003. Measuring treasury market liquidity. FRBNY Economic Policy Review 2003: 83–99. [Google Scholar] [CrossRef] [Green Version]
  20. Glosten, Lawrence R., and Paul R. Milgrom. 1985. Bid, ask and transaction prices in a specialist market with heterogeneously informed traders. Journal of Financial Economics 14: 71–100. [Google Scholar] [CrossRef] [Green Version]
  21. Grossman, Sanford J., and Joseph E. Stiglitz. 1980. On the impossibility of informationally efficient markets. The American Economic Review 70: 393–408. [Google Scholar]
  22. Harris, Milton, and Artur Raviv. 1991. The theory of capital structure. The Journal of Finance 46: 297–355. [Google Scholar] [CrossRef]
  23. Hartmann, Philipp. 1999. Trading volumes and transaction costs in the foreign exchange market: Evidence from daily dollar–yen spot data. Journal of Banking & Finance 23: 801–24. [Google Scholar]
  24. Hoesli, Martin, Anjeza Kadilli, and Kustrim Reka. 2017. Commonality in liquidity and real estate securities. The Journal of Real Estate Finance and Economics 55: 65–105. [Google Scholar] [CrossRef] [Green Version]
  25. Jensen, Michael C. 1986. Agency costs of free cash flow, corporate finance, and takeovers. The American Economic Review 76: 323–29. [Google Scholar]
  26. Kandel, Eugene, and Neil D. Pearson. 1995. Differential interpretation of public signals and trade in speculative markets. Journal of Political Economy 103: 831–72. [Google Scholar] [CrossRef]
  27. Kluger, Brian D., and Norman G. Miller. 1990. Measuring residential real estate liquidity. Real Estate Economics 18: 145–59. [Google Scholar] [CrossRef]
  28. Kyle, Albert S. 1985. Continuous auctions and insider trading. Econometrica: Journal of the Econometric Society 53: 1315–35. [Google Scholar] [CrossRef] [Green Version]
  29. Kyriakou, Maria I., Athanasios Koulakiotis, Apostolos Kiohos, and Vassilios Babalos. 2021. Fractional Integration and Volatility Transmission Between Real Estate and Stock Markets: Novel Evidence from a FIGARCH-BEKK Approach. The Journal of Real Estate Finance and Economics. [Google Scholar] [CrossRef]
  30. Lin, Yu Cheng, Chyi Lin Lee, and Graeme Newell. 2019. The significance of residential REITs in Japan as an institutionalised property sector. Journal of Property Investment & Finance 37: 363–79. [Google Scholar]
  31. Mancini, Loriano, Angelo Ranaldo, and Jan Wrampelmeyer. 2013. Liquidity in the foreign exchange market: Measurement, commonality, and risk premiums. Journal of Finance 68: 1805–41. [Google Scholar] [CrossRef] [Green Version]
  32. Marshall, John M. 1974. Private incentives and public information. The American Economic Review 64: 373–90. [Google Scholar]
  33. Marzuki, Muhammad Jufri, and Graeme Newell. 2018. The emergence of Spanish REITs. Journal of Property Investment & Finance 36: 495–508. [Google Scholar]
  34. Merton, Robert C. 1987. A Simple Model of Capital Market Equilibrium with Incomplete Information. Journal of Finance 42: 483–510. [Google Scholar] [CrossRef]
  35. Milgrom, Paul, and Nancy Stokey. 1982. Information, trade and common knowledge. Journal of Economic Theory 26: 17–27. [Google Scholar] [CrossRef] [Green Version]
  36. Nelling, Edward, and Joseph Gyourko. 1998. The predictability of equity REIT returns. Journal of Real Estate Research 16: 251–68. [Google Scholar] [CrossRef]
  37. Newell, Graeme, and Muhammad Jufri Marzuki. 2018. The emergence and performance of German REITs. Journal of Property Investment & Finance 36: 91–103. [Google Scholar]
  38. Newell, Graeme, Alastair Adair, and Thi Kim Nguyen. 2013. The significance and performance of French REITs (SIICs) in a mixed-asset portfolio. Journal of Property Investment & Finance 31: 575–88. [Google Scholar]
  39. Östberg, Per, and Thomas Richter. 2018. The Sovereign Debt Crisis: Rebalancing or Freezes? Swiss Finance Institute Research Paper, No. 17-32. Available online: https://papers.ssrn.com/sol3/papers.cfm?abstract_id=3060504 (accessed on 22 August 2022).
  40. Parker, David. 2014. Property investment decision making by Australian REITs. Journal of Property Investment & Finance 32: 456–73. [Google Scholar]
  41. Petersen, Mitchell A. 2009. Estimating standard errors in finance panel data sets: Comparing approaches. The Review of Financial Studies 22: 435–80. [Google Scholar] [CrossRef] [Green Version]
  42. Richter, Thomas. 2022. Liquidity commonality in sovereign bond markets. International Review of Economics & Finance 78: 501–18. [Google Scholar]
  43. Schacht, Ulrich, and Jens Wimschulte. 2008. German property investment vehicles and the introduction of G-REITs: An analysis. Journal of Property Investment & Finance 26: 232–46. [Google Scholar]
  44. Subrahmanyam, Avanidhar. 1991. A theory of trading in stock index futures. The Review of Financial Studies 4: 17–51. [Google Scholar] [CrossRef]
  45. Van Dijk, Dorinth, Anne Kinsella Thompson, and David Geltner. 2020. Recent Drops in Market Liquidity May Foreshadow Major Drops in US Commerical Real Estate Markets. Available online: https://ssrn.com/abstract=3604606 (accessed on 21 June 2022).
  46. Wang, F. Albert. 1998. Strategic trading, asymmetric information, and heterogeneous prior beliefs. Journal of Financial Markets 1: 321–52. [Google Scholar] [CrossRef]
  47. Womack, Kent L. 1996. Do brokerage analysts’ recommendations have investment value? The Journal of Finance 51: 137–67. [Google Scholar] [CrossRef]
  48. Yat-Hung, Chiang, So Chun-Kei Joinkey, and Tang Bo-Sin. 2008. Time-varying performance of four Asia-Pacific REITs. Journal of Property Investment and Finance 26: 210–31. [Google Scholar] [CrossRef]
Figure 1. Trading patterns of US REITs and US equity market. Panel (A) shows the trading volume in USD billion between 2016 and 2020 in the US equity market as reported by SIFMA. Panel (B) shows the REIT trading activity in our sample in USD billion between 2016 and 2020. A high number indicates high trading activity.
Jrfm 15 00374 g001
Figure 2. Trading patterns for different REIT segments. This figure displays the evolution of the sample’s trading activity in USD 100 million over time for selected REIT segments (Diversified REITs, Mortgage REITs, and Residential REITs). The REIT segments are determined using the GICS (Global Industry Classification System) obtained from Refinitiv.
Jrfm 15 00374 g002
Table 1. Descriptive statistics. The table contains the mean, the median, the standard deviation (SD), the minimum (Min) and the maximum (Max) for the variables in our sample. The statistics are calculated based on the pooled sample (all firms in all time periods). The variables include: the USD trading volume (VOL) in USD 100 million, the log of the market capitalization (LMVL), the total return (TRE), the log price level (PCL), the book-to-market ratio (BTM), the stocks beta (BET), the number of analysts (NAN), leverage (LEV), earnings surprise (SUP), and earnings volatility (EVO).
MeanMedianSDMinMax
Variables for trading activity
VOL0.60.290.92036.1
Variables for rebalancing and liquidity trading
LMVL21.9521.931.1816.5825.48
TRE1.421.011.360.2713.08
PCL3.463.410.820.36.68
BTM0.620.550.340.141.39
Variables for differences in beliefs and information-based trading
BET0.860.810.380.331.67
NAN1.91.950.603.43
LEV0.580.560.1700.89
SUP00.010.27−0.710.58
EVO0.210.110.250.020.99
Table 2. Panel regression results USD volume. The table contains estimated regression coefficients from equation (1) and the associated standard errors in parentheses. The standard errors are double clustered around both time and firms. ***, **, and * denote statistical significance at the 1%, 5%, and 10% levels, respectively. N is the number of observations. The yes and no in the rows labeled with Time Fixed Effects and Firm Fixed Effects indicate whether a certain type of fixed effects was used.
USD Volume (VOL)
(1)(2)(3)(4)
LMVL0.248 ***0.354 ***0.438 ***0.434 ***
(0.059)(0.048)(0.044)(0.044)
TRE0.087 ***0.102 ***0.121 ***0.103 ***
(0.027)(0.02)(0.033)(0.021)
PCL0.417 ***0.332 ***0.196 ***0.195 ***
(0.104)(0.092)(0.051)(0.05)
BTM0.234 **0.297 ***0.245 ***0.280 ***
(0.096)(0.098)(0.072)(0.073)
BET−0.05−0.005−0.108−0.012
(0.059)(0.049)(0.078)(0.053)
NAN−0.0390.0540.103 ***0.117 ***
(0.048)(0.042)(0.039)(0.036)
LEV0.1070.1530.442 *0.435 *
(0.233)(0.246)(0.235)(0.23)
SUP−0.024−0.0180.0230.024
(0.022)(0.026)(0.03)(0.031)
EVO0.0770.137 *0.0450.047
(0.079)(0.079)(0.088)(0.085)
Time Fixed EffectsYesNoYesNo
Firm Fixed EffectsYesYesNoNo
N14,78114,78114,78114,781
Table 3. Trading Motives, Proxies, Predicted relation and rationale. The first column contains the studied trading motives. The second column names the applied proxies for the trading motives. The third column contains the predicted relation between the proxy and volume by theory. The fourth column states the actual relation between the proxy and volume in REIT markets based on the results of specification 1 in Table 2. A + indicates a positive relation, a - indicates a negative relation and is indicates no significant relation. The fifth column explains why the proxy is related to volume in the postulated way by general market microstructure theory. The sixth column explains why the relation for REIT stocks might deviate from the predictions of general market microstructure theory and previous empirical results in equity markets.
Trading MotiveProxyRelation with VolumeExplanationREIT Specialness
PredictionActual
Portfolio Rebalancing
Price changes passively change portfolio allocations leading to a desire to rebalance.
Absolute total return TRE++The higher the price changes the more trading activity (to offset the passive changes in the portfolio allocation).These trading motives are expected to also play an important role for REIT trading
Liquidity Trading-Stock Visibility
Liquidity needs are realized mainly in highly visible stocks.
Price level (log) PCL+/-+High priced stocks have lower transaction costs and are favored by mutual funds and thus experience more trading.
Book-to-market-ratio BTM-+Growth stocks receive more attention and are therefore traded more frequently.
Market value (log) LMVL++Large stocks (high market capitalization) are more visible and thus more frequently traded.
Private Information: Superior information leads to tradeAnalyst Coverage NAN+isThe more Analyst follow a stock the more production of private information happens and the more frequently a stock is tradedREITs are very transparent and therefore the value of private information is low
Beta BET islow information or high estimation uncertainty securities have higher betas.
Differences in beliefs: Difference in beliefs lead to disagreement about prices and thus trade.LEV+isEnhanced risk is associated with more uncertain projects and are thus more likely to be traded by disagreeing investorsREITs have very stable cash flows and transparent benchmarks which limits the disagreement among market participants
SUP+isStocks with higher earnings surprises are more likely to be traded by disagreeing investors
EVO+isStocks with higher earnings volatility are more likely to be traded by disagreeing investors.
Table 4. Regression results: COVID-19 and Great Financial Crisis. Table 4 contains the estimated regression coefficients for the interaction terms that have been added to equation (1) as described in the text. The table only displays the interaction terms. Reading example: The information in the row labeled NAN × C is related to the coefficient of the interaction term of NAN (number of analysts) and C (COVID-19 period dummy) in the regression. The associated standard errors are reported in parentheses. The standard errors are double clustered around both time and firms. ***, **, and * denote significance at the 1%, 5%, and 10% levels, respectively.
USD Volume (VOL)
(1)(2)(3)
BET × C−0.115 −0.122
(0.13) (0.133)
NAN × C0.432 *** 0.395 **
(0.163) (0.16)
LEV × C0.144 0.192
(0.355) (0.352)
SUP × C−0.106 −0.097
(0.097) (0.098)
EVO × C0.146 0.199
(0.141) (0.141)
BET × G −0.032−0.054
(0.15)(0.15)
NAN × G −0.199 ***−0.176 ***
(0.061)(0.059)
LEV × G 0.280 *0.288 *
(0.161)(0.154)
SUP × G 0.0660.048
(0.042)(0.044)
EVO × G 0.1220.154
(0.104)(0.11)
N14,78114,78114,781
Publisher’s Note: MDPI stays neutral with regard to jurisdictional claims in published maps and institutional affiliations.

