
Investigating the Co-Volatility Spillover Effects between Cryptocurrencies and Currencies at Different Natures of Risk Events


Abstract
:1. Introduction
2. Methodology
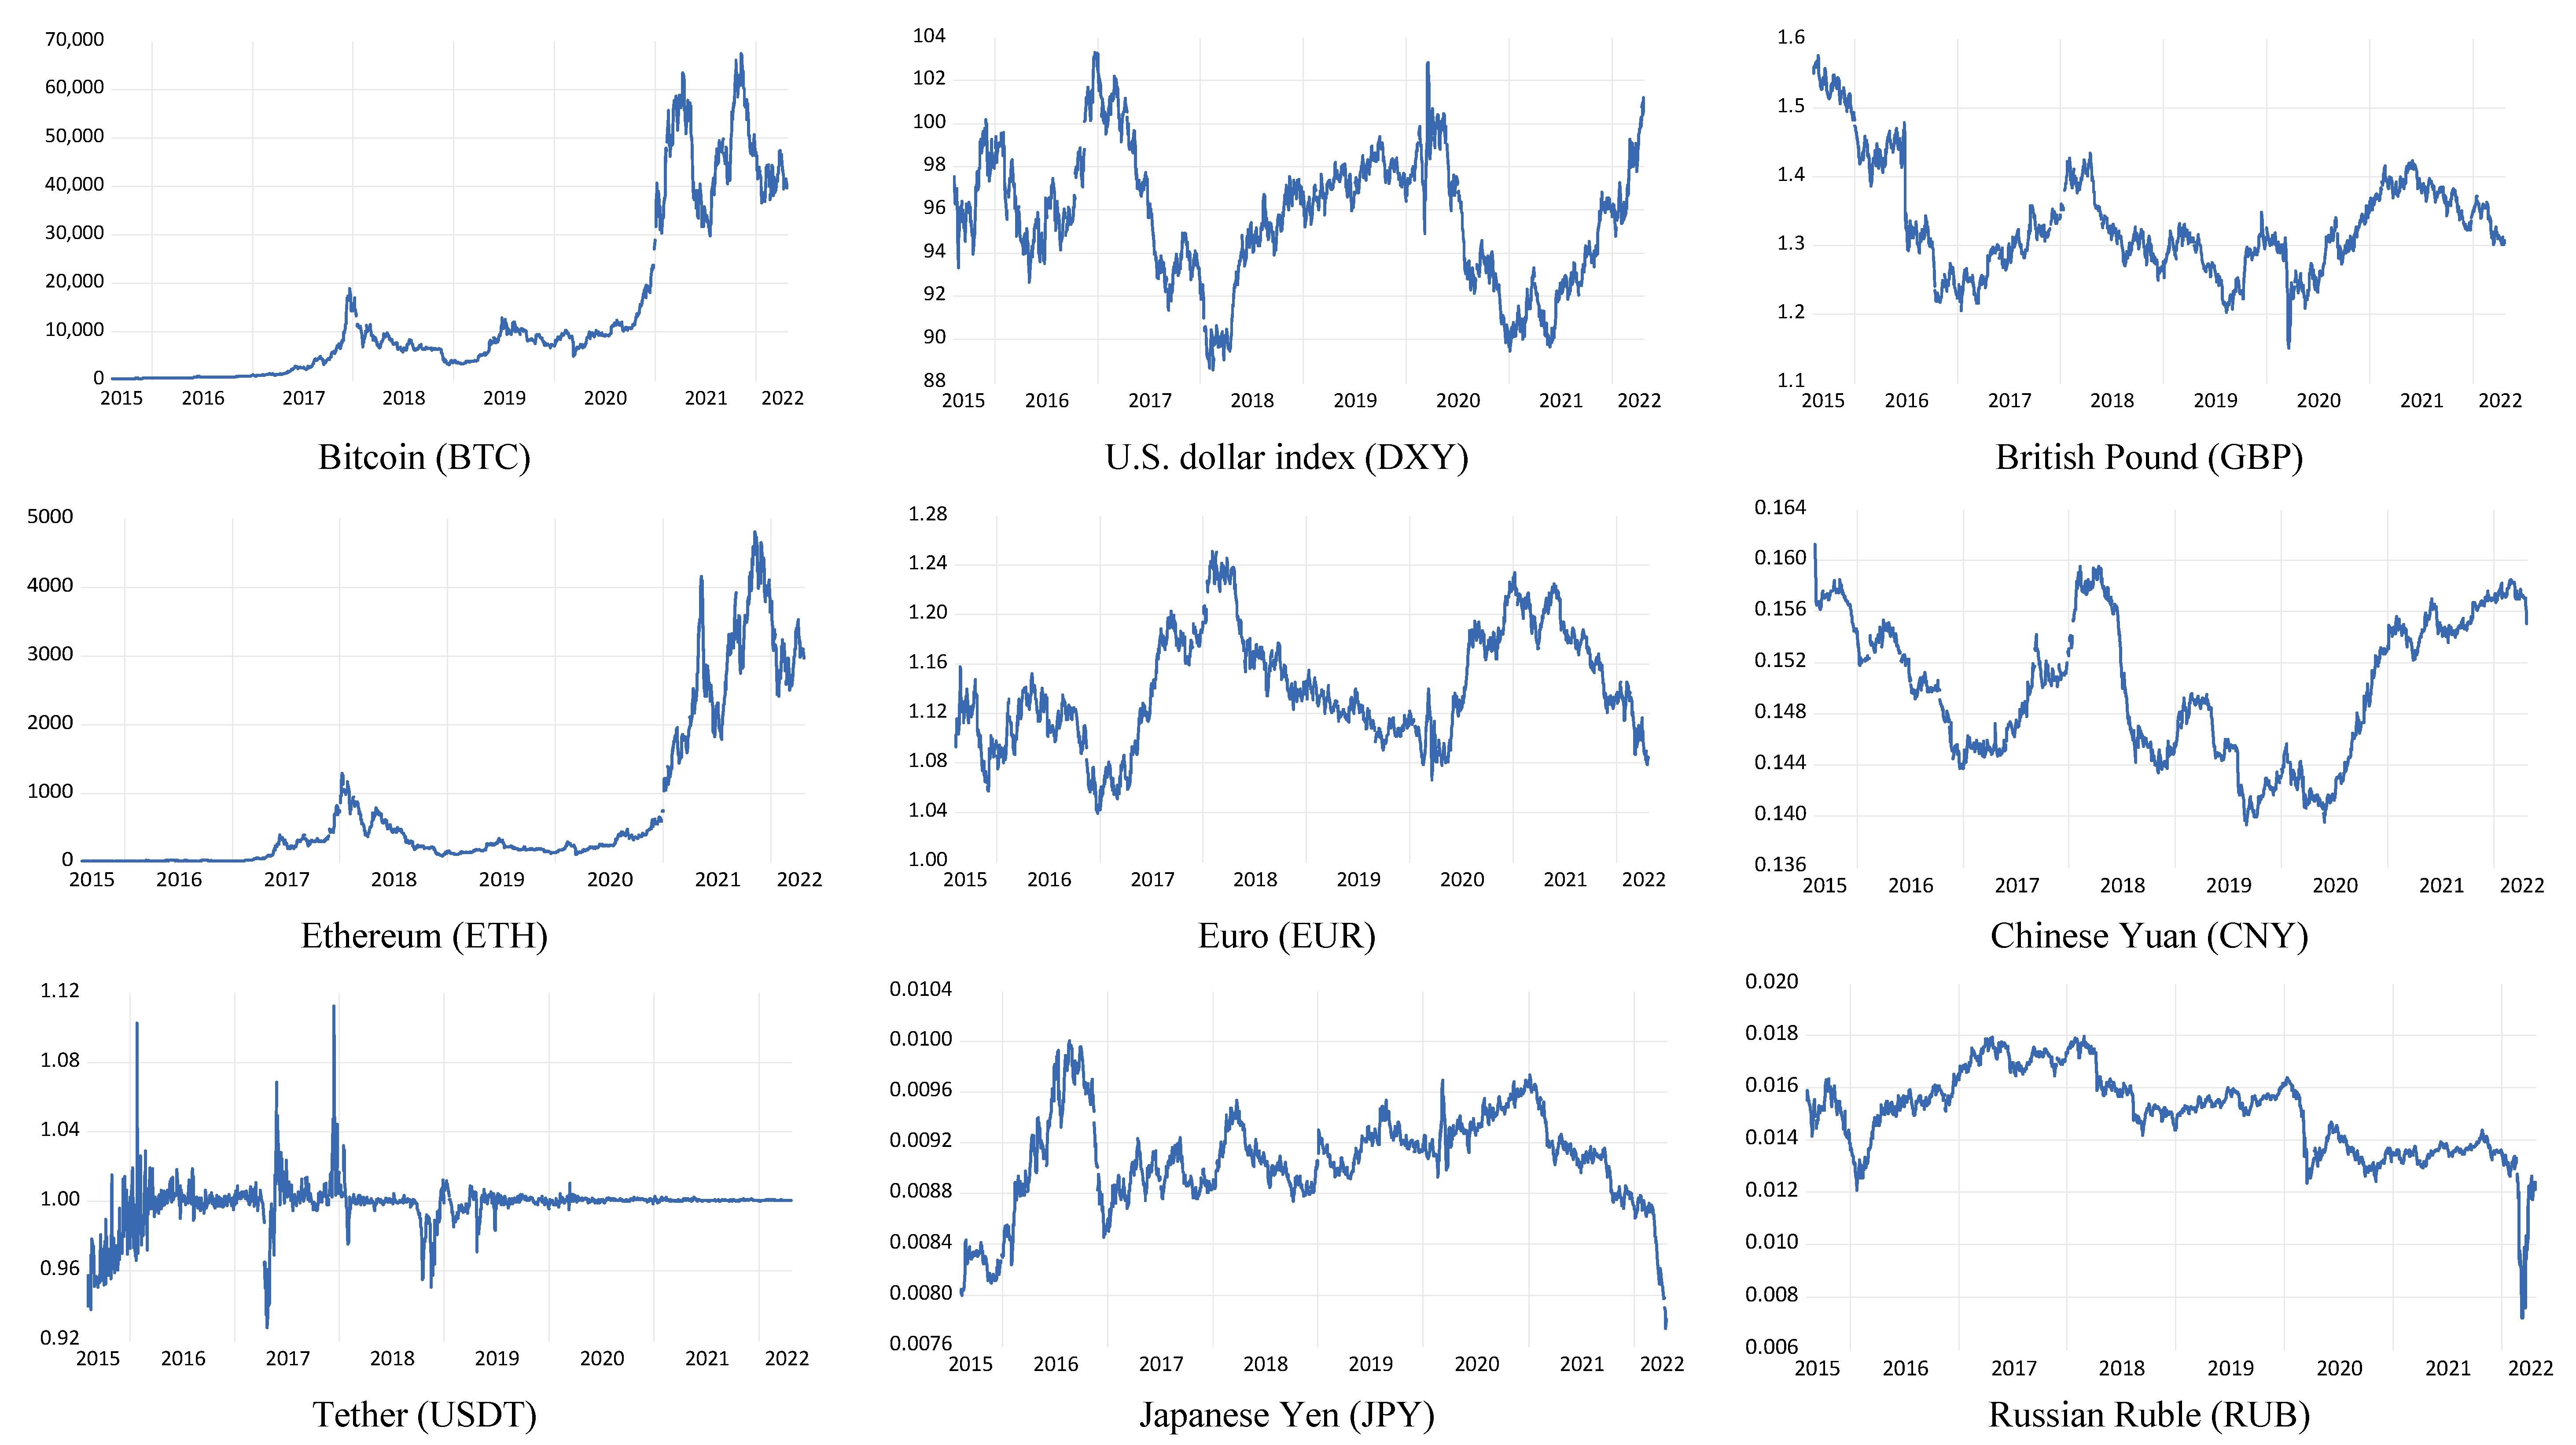
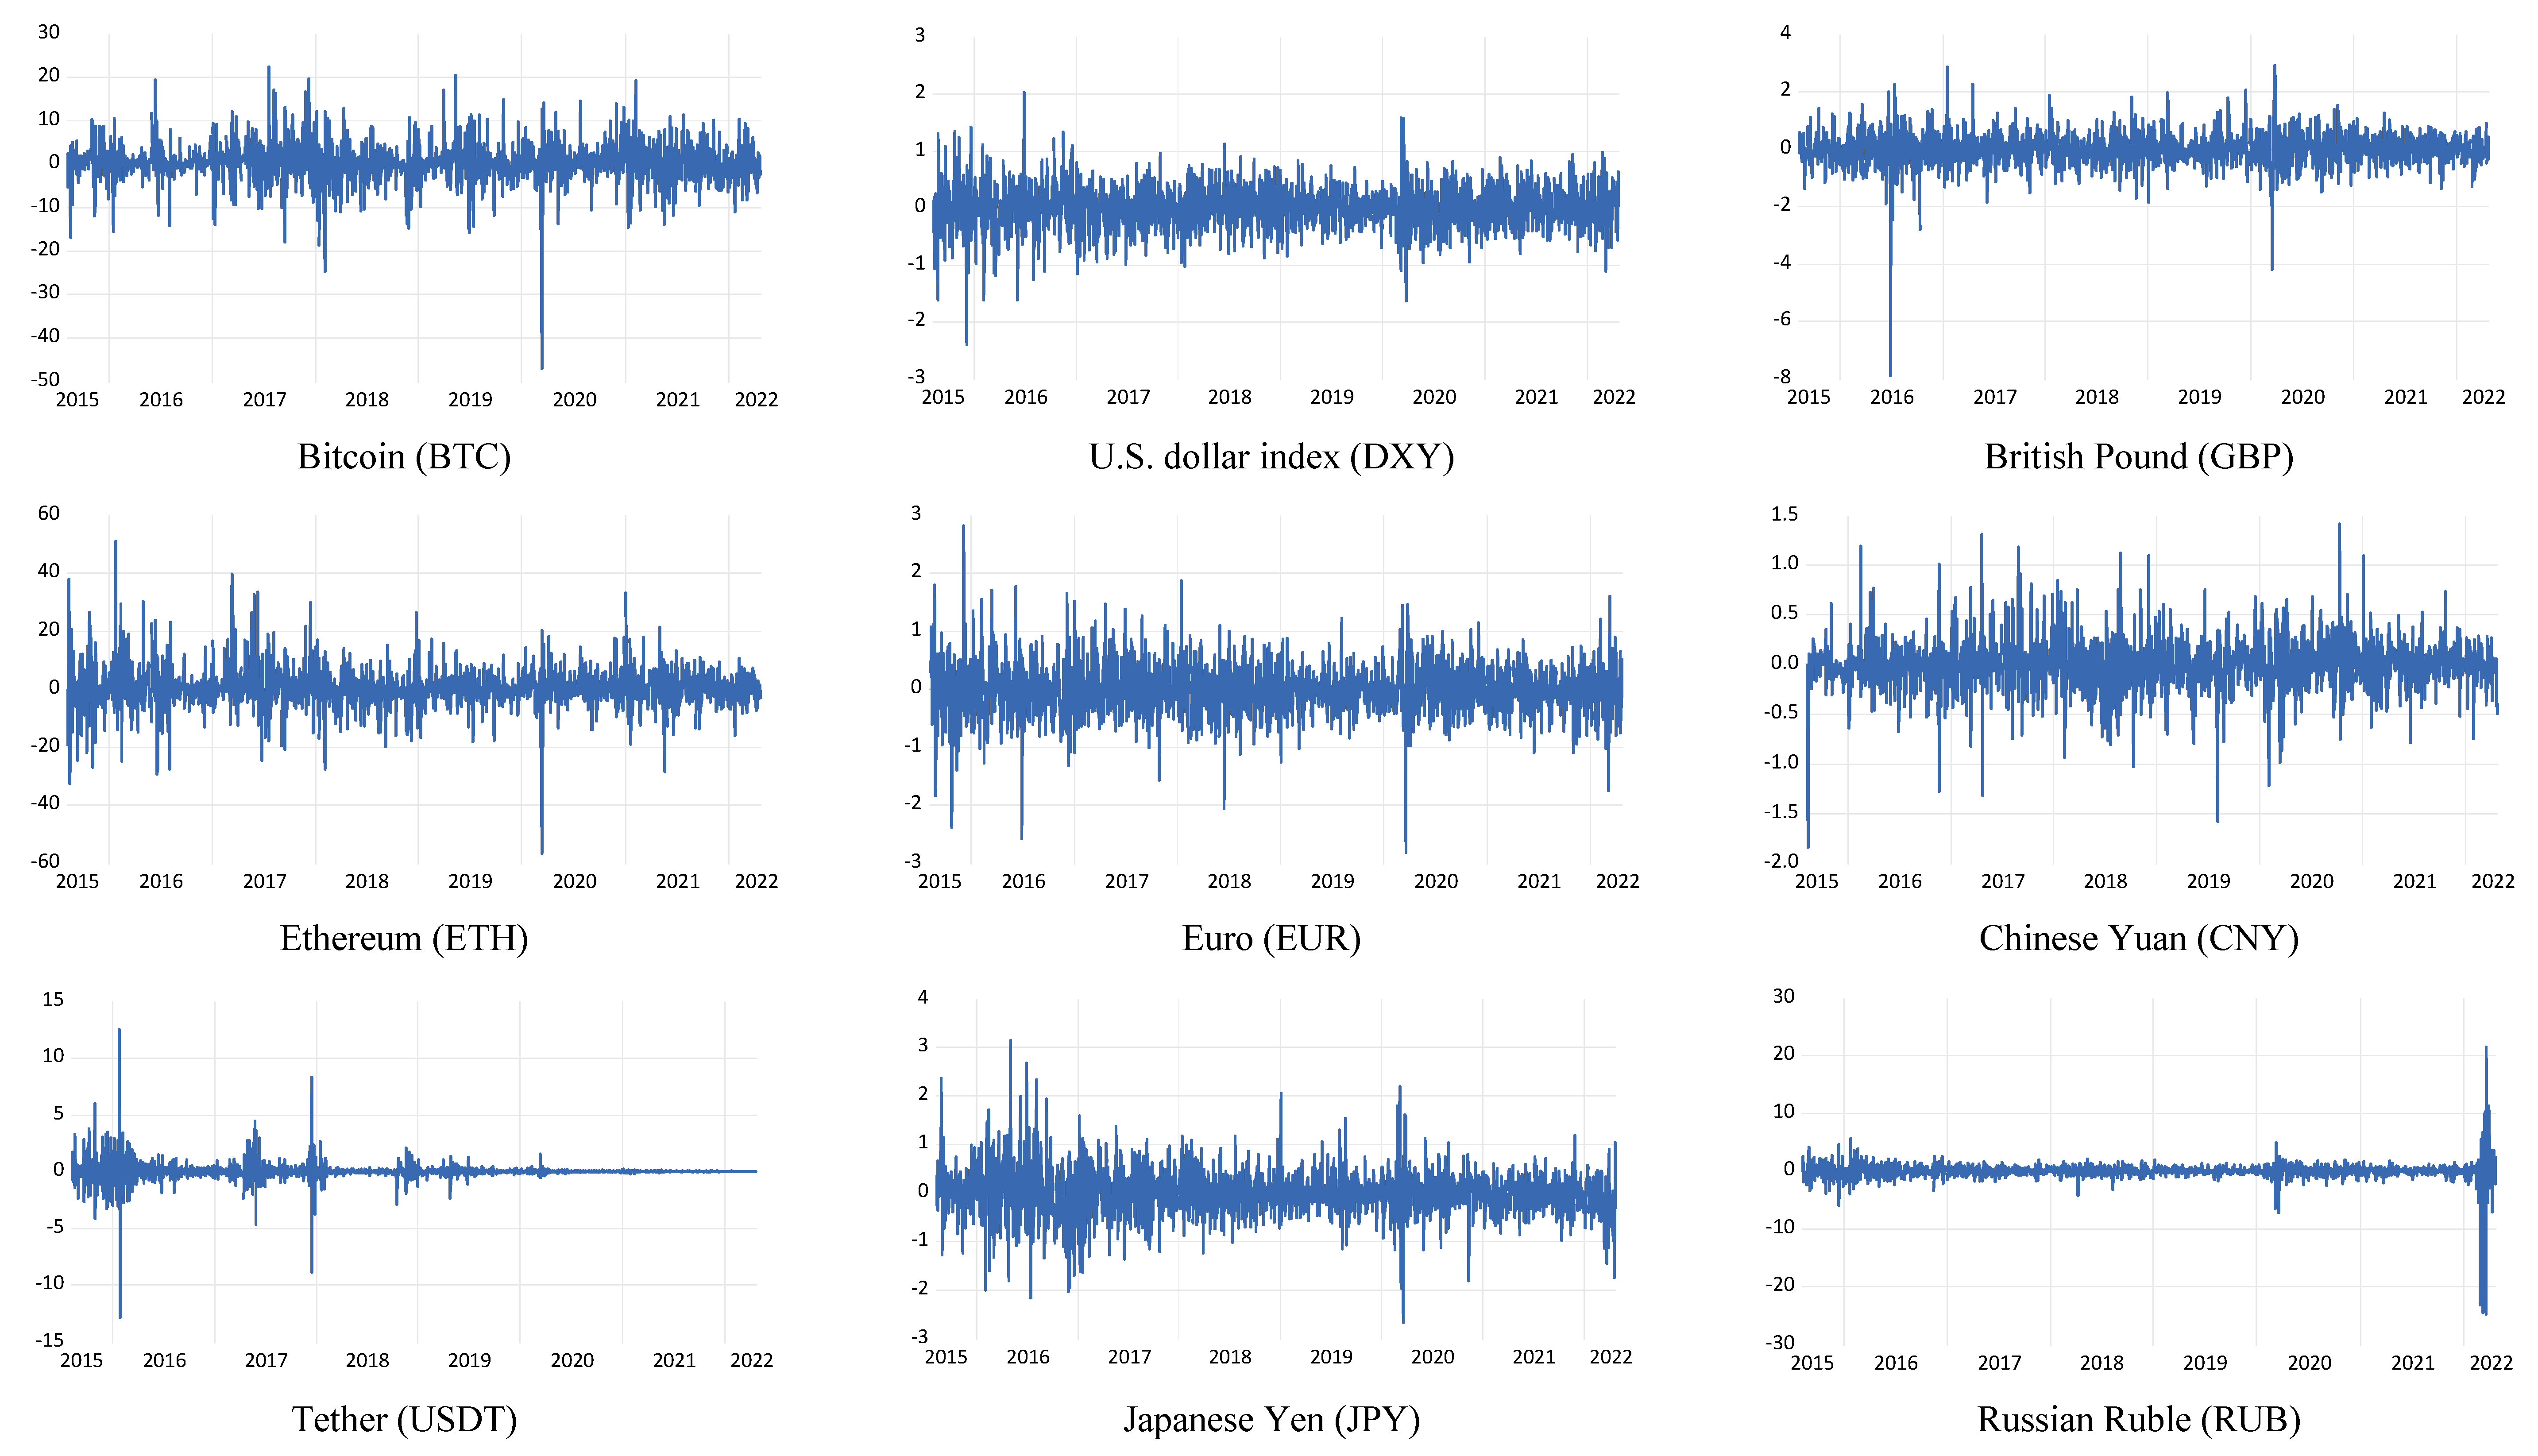
3. Data
4. Empirical Results
- (1)
- Group 1: Whole sample
- (2)
- Group 2: The US–China trade war
- (3)
- Group 3: The COVID-19 pandemic
- (4)
- Group 4: Russian–Ukraine war
5. Conclusions
Funding
Institutional Review Board Statement
Informed Consent Statement
Data Availability Statement
Acknowledgments
Conflicts of Interest
| 1 | The DXY index is a weighted average of the dollar’s value against six major currencies, namely the Euro, Japanese yen, British pound, Canadian dollar, Swedish krona, and Swiss franc. |
| 2 | The ADF, PP, and KPSS refer to the Augmented Dickey–Fuller (ADF) of Dickey and Fuller (1979), Phillips–Perron (PP) of Phillips and Perron (1988), and Kwiatkowski–Phillips–Schmidt–Shin (KPSS) of Kwiatkowski et al. (1992) unit root tests, respectively. |
References
- Baek, Chung, and Matt Elbeck. 2015. Bitcoins as an investment or speculative vehicle? A first look. Applied Economics Letters 22: 30–34. [Google Scholar] [CrossRef]
- Bakry, Walid, Audil Rashid, Somar Al-Mohamad, and Nasser El-Kanj. 2021. Bitcoin and portfolio diversification: A portfolio optimization approach. Journal of Risk and Financial Management 14: 282. [Google Scholar] [CrossRef]
- Bank for International Settlements. 2019. Triennial Central Bank Survey Foreign Exchange Turnover in April 2019. Available online: https://www.bis.org/statistics/rpfx19_fx.pdf/ (accessed on 21 April 2022).
- Baur, Dirk G., and Brian M. Lucey. 2010. Is gold a hedge or a safe haven? An analysis of stocks, bonds and gold. Financial Review 45: 217–29. [Google Scholar] [CrossRef]
- Baur, Dirk G., and Thomas Dimpfl. 2017. Realized Bitcoin Volatility. Available online: https://poseidon01.ssrn.com (accessed on 21 April 2022).
- Baur, Dirk G., and Thomas K. McDermott. 2010. Is gold a safe haven? International evidence. Journal of Banking and Finance 34: 1886–98. [Google Scholar] [CrossRef]
- Baur, Dirk G., Kihoon Hong, and Adrian D. Lee. 2018a. Bitcoin: Medium of exchange or speculative assets? Journal of International Financial Markets, Institutions and Money 54: 177–89. [Google Scholar] [CrossRef]
- Baur, Dirk G., Thomas Dimpfl, and Konstantin Kuck. 2018b. Bitcoin, gold and the US dollar—A replication and extension. Finance Research Letters 25: 103–10. [Google Scholar] [CrossRef]
- Bouri, Elie, Peter Molnár, Georges Azzi, David Roubaud, and Lars I. Hagfors. 2017a. On the hedge and safe haven properties of Bitcoin: Is it really more than a diversifier? Finance Research Letters 20: 192–98. [Google Scholar] [CrossRef]
- Bouri, Elie, Rangan Gupta, Aviral K. Tiwari, and David Roubaud. 2017b. Does Bitcoin hedge global uncertainty? Evidence from wavelet-based quantile-in-quantile regressions. Finance Research Letters 23: 87–95. [Google Scholar] [CrossRef] [Green Version]
- Briere, Marie, Kim Oosterlinck, and Ariane Szafarz. 2015. Virtual currency, tangible return: Portfolio diversification with bitcoin. Journal of Asset Management 16: 365–73. [Google Scholar] [CrossRef]
- Capital.com. 2022. USD forecast 2022: Can the USD Keep Rising? Available online: https://capital.com/usd-forecast (accessed on 21 June 2022).
- Chang, Chia-Lin, Chia-Ping Liu, and Michael McAleer. 2019. Volatility spillovers for spot, futures, and ETF prices in agriculture and energy. Energy Economics 81: 779–92. [Google Scholar] [CrossRef]
- Chang, Chia-Lin, Yiying Li, and Michael McAleer. 2018. Volatility spillovers between energy and agricultural markets: A critical appraisal of theory and practice. Energies 11: 1595. [Google Scholar] [CrossRef] [Green Version]
- Charfeddine, Lanouar, Noureddine Benlagha, and Youcef Maouchi. 2020. Investigating the dynamic relationship between cryptocurrencies and conventional assets: Implications for financial investors. Economic Modelling 85: 198–217. [Google Scholar] [CrossRef]
- CoinMarketCap.com. 2022. Top 100 Crypto Tokens by Market Capitalization. Available online: https://coinmarketcap.com/ (accessed on 21 April 2022).
- Congressional Research Service. 2020. Global Economic Effects of COVID-19. Available online: https://fas.org/sgp/crs/row/R46270.pdf (accessed on 21 April 2022).
- Conlon, Thomas, Shaen Corbet, and Richard J. McGee. 2020. Are cryptocurrencies a safe haven for equity markets? An international perspective from the COVID-19 pandemic. Research in International Business and Finance 54: 101248. [Google Scholar] [CrossRef] [PubMed]
- Corbet, Shaen, Andrew Meegan, Charles Larkin, Brian Lucey, and Larisa Yarovaya. 2018. Exploring the dynamic relationships between cryptocurrencies and other financial assets. Economics Letters 165: 28–34. [Google Scholar] [CrossRef] [Green Version]
- Demir, Ender, Giray Gozgor, Chi Keung Marco Lau, and Samuel A.Vigne. 2018. Does economic policy uncertainty predict the bitcoin returns? An empirical investigation. Finance Research Letters 26: 145–49. [Google Scholar] [CrossRef] [Green Version]
- de Olde, Rutger. 2021. Bitcoin: Safe Haven for Currencies in Times of Economic Uncertainty. Available online: http://essay.utwente.nl/87450/ (accessed on 21 April 2022).
- Dickey, David A., and Wayne A. Fuller. 1979. Distribution of the estimators for autoregressive time series with a unit root. Journal of the American Statistical Association 74: 427–31. [Google Scholar]
- Dyhrberg, Anne Haubo. 2016a. Bitcoin, gold and the dollar—A GARCH volatility analysis. Finance Research Letters 16: 85–92. [Google Scholar] [CrossRef] [Green Version]
- Dyhrberg, Anne Haubo. 2016b. Hedging capabilities of bitcoin. Is it the virtual gold? Finance Research Letters 16: 139–44. [Google Scholar] [CrossRef] [Green Version]
- Engle, Robert F. 1982. Autoregressive conditional heteroscedasticity with estimates of the variance of United Kingdom inflation. Econometrica: Journal of the Econometric Society 50: 987–1007. [Google Scholar] [CrossRef]
- Feng, Wenjun, Yiming Wang, and Zhengjun Zhang. 2018. Can cryptocurrencies be a safe haven: A tail risk perspective analysis. Applied Economics 50: 4745–62. [Google Scholar] [CrossRef]
- Fry, John, and Eng-Tuck Cheah. 2016. Negative bubbles and shocks in cryptocurrency markets. International Review of Financial Analysis 47: 343–52. [Google Scholar] [CrossRef] [Green Version]
- Gil-Alana, Luis Alberiko, Emmanuel Joel Aikins Abakah, and María Fátima Romero Rojo. 2020. Cryptocurrencies and stock market indices. Are they related? Research in International Business and Finance 51: 101063. [Google Scholar] [CrossRef]
- Glaser, Florian, Kai Zimmermann, Martin Haferkorn, Moritz Christian Weber, and Michael Siering. 2014. Bitcoin-asset or currency? revealing users’ hidden intentions. Paper presented at the Twenty Second European Conference on Information Systems (ECIS 2014), Aviv, Israel, June 9–11; pp. 1–14. [Google Scholar]
- Goodell, John W., and Stéphane Goutte. 2020. Diversifying with Cryptocurrencies during COVID-19. Available online: https://poseidon01.ssrn.com/ (accessed on 21 April 2022).
- Guesmi, Khaled, Samir Saadi, Ilyes Abid, and Zied Ftiti. 2019. Portfolio diversification with virtual currency: Evidence from bitcoin. International Review of Financial Analysis 63: 431–37. [Google Scholar] [CrossRef]
- Hasan, Md. Bokhtiar, M. Kabir Hassan, Md. Mamunur Rashid, and Yasser Alhenawi. 2021. Are safe haven assets really safe during the 2008 global financial crisis and COVID-19 pandemic? Global Finance Journal 50: 100668. [Google Scholar] [CrossRef]
- Hsu, Shu-Han, Chwen Sheu, and Jiho Yoon. 2021. Risk spillovers between cryptocurrencies and traditional currencies and gold under different global economic conditions. The North American Journal of Economics and Finance 57: 101443. [Google Scholar] [CrossRef]
- Huynh, Toan Luu Duc, Muhammad Ali Nasir, Xuan Vinh Vo, and Thong Trung Nguyen. 2020. “Small things matter most”: The spillover effects in the cryptocurrency market and gold as a silver bullet. The North American Journal of Economics and Finance 54: 101277. [Google Scholar] [CrossRef]
- Jamal, Aamir, and Mudaser Ahad Bhat. 2022. COVID-19 pandemic and the exchange rate movements: Evidence from six major COVID-19 hot spots. Future Business Journal 8: 17. [Google Scholar] [CrossRef]
- Jeribi, Ahmed, and Mohamed Fakhfekh. 2021. Portfolio management and dependence structure between cryptocurrencies and traditional assets: Evidence from FIEGARCH-EVT-Copula. Journal of Asset Management 22: 224–39. [Google Scholar] [CrossRef]
- Ji, Qiang, Dayong Zhang, and Yuqian Zhao. 2020. Searching for safe-haven assets during the COVID-19 pandemic. International Review of Financial Analysis 71: 101526. [Google Scholar] [CrossRef]
- Joshi, Prashant, Jinghua Wang, and Michael Busler. 2022. A study of the machine learning approach and the MGARCH-BEKK model in volatility transmission. Journal of Risk and Financial Management 15: 116. [Google Scholar] [CrossRef]
- Kajtazi, Anton, and Andrea Moro. 2019. The role of bitcoin in well diversified portfolios: A comparative global study. International Review of Financial Analysis 61: 143–57. [Google Scholar] [CrossRef] [Green Version]
- Klein, Tony, Hien Pham Thu, and Thomas Walther. 2018. Bitcoin is not the new gold–A comparison of volatility, correlation, and portfolio performance. International Review of Financial Analysis 59: 105–16. [Google Scholar] [CrossRef]
- Kliber, Agata, Paweł Marszałek, Ida Musiałkowska, and Katarzyna Świerczyńska. 2019. Bitcoin: Safe haven, hedge or diversifier? Perception of bitcoin in the context of a country’s economic situation—A stochastic volatility approach. Physica A: Statistical Mechanics and Its Applications 524: 246–57. [Google Scholar] [CrossRef]
- Kristoufek, Ladislav. 2015. What are the main drivers of the bitcoin price? Evidence from wavelet coherence analysis. PLoS ONE 10: e0123923. [Google Scholar] [CrossRef]
- Kumaran, Sunitha. 2022. Portfolio diversification with cryptocurrencies–Evidence from Middle Eastern stock markets. Investment Analysts Journal 51: 14–34. [Google Scholar] [CrossRef]
- Kwiatkowski, Denis, Peter C. B. Phillips, Peter Schmidt, and Yongcheol Shin. 1992. Testing the null hypothesis of stationarity against the alternative of a unit root: How sure are we that economic time series have a unit root? Journal of Econometrics 54: 159–78. [Google Scholar] [CrossRef]
- Li, Chuanjian, Zhi-Wei Su, Tanzeela Yaqoob, and Yumna Sajid. 2021. COVID-19 and currency market: A comparative analysis of exchange rate movement in China and USA during pandemic. Economic Research-Ekonomska Istraživanja 35: 2477–92. [Google Scholar] [CrossRef]
- Lyócsa, Štefan, and Tomáš Plíhal. 2022. Russia’s ruble during the onset of the Russian invasion of Ukraine in early 2022: The role of implied volatility and attention. Finance Research Letters 48: 102995. [Google Scholar] [CrossRef]
- Maghyereh, Aktham, and Hussein Abdoh. 2020. Tail dependence between Bitcoin and financial assets: Evidence from a quantile cross-spectral approach. International Review of Financial Analysis 71: 101545. [Google Scholar] [CrossRef]
- Magner, Nicolás, and Nicolás Hardy. 2022. Cryptocurrency forecasting: More evidence of the Meese-Rogoff puzzle. Mathematics 10: 2338. [Google Scholar] [CrossRef]
- Mariana, Christy Dwita, Irwan Adi Ekaputra, and Zaäfri Ananto Husodo. 2021. Are Bitcoin and Ethereum safe-havens for stocks during the COVID-19 pandemic? Finance Research Letters 38: 101798. [Google Scholar] [CrossRef] [PubMed]
- McAleer, Michael. 2019. What they did not tell you about algebraic (non-)existence, mathematical (ir-)regularity and (non-)asymptotic properties of the full BEKK dynamic conditional covariance model. Journal of Risk and Financial Management 12: 61. [Google Scholar] [CrossRef] [Green Version]
- McAleer, McAleer, Felix Chan, Suhejla Hoti, and Offer Lieberman. 2008. Generalized autoregressive conditional correlation. Econometric Theory 24: 1554–83. [Google Scholar] [CrossRef] [Green Version]
- Mikhaylov, Alexey. 2020. Cryptocurrency market analysis from the open innovation perspective. Journal of Open Innovation: Technology, Market, and Complexity 6: 197. [Google Scholar] [CrossRef]
- Naeem, Muhammad Abubakr, Mudassar Hasan, Muhammad Arif, and Syed Jawad Hussain Shahzad. 2020. Can Bitcoin Glitter more than gold for investment styles? SAGE Open 10: 2158244020926508. [Google Scholar] [CrossRef]
- Phillips, Peter C. B., and Pierre Perron. 1988. Testing for a unit root in time series regression. Biometrika 75: 335–46. [Google Scholar] [CrossRef]
- Shahzad, Syed Jawad Hussain, Elie Bouri, David Roubaud, Ladislav Kristoufek, and Brian Lucey. 2019. Is Bitcoin a better safe-haven investment than gold and commodities? International Review of Financial Analysis 63: 322–30. [Google Scholar] [CrossRef]
- Shahzad, Syed Jawad Hussain, Elie Bouri, David Roubaud, and Ladislav Kristoufek. 2020. Safe haven, hedge and diversification for G7 stock markets: Gold versus bitcoin. Economic Modelling 87: 212–24. [Google Scholar] [CrossRef]
- Smales, Lee A. 2019. Bitcoin as a safe haven: Is it even worth considering? Finance Research Letters 30: 385–93. [Google Scholar] [CrossRef]
- Smutny, Zdenek, Zdenek Sulc, and Jan Lansky. 2021. Motivations, barriers and risk-taking when investing in cryptocurrencies. Mathematics 9: 1655. [Google Scholar] [CrossRef]
- Stensås, Anders, Magnus Frostholm Nygaard, Khine Kyaw, and Sirimon Treepongkaruna. 2019. Can Bitcoin be a diversifier, hedge or safe haven tool? Cogent Economics and Finance 7: 1593072. [Google Scholar] [CrossRef]
- Urquhart, Andrew, and Hanxiong Zhang. 2019. Is Bitcoin a hedge or safe haven for currencies? An intraday analysis. International Review of Financial Analysis 63: 49–57. [Google Scholar] [CrossRef]
- Vukovic, Darko, Moinak Maiti, Zoran Grubisic, Elena M. Grigorieva, and Michael Frömmel. 2021. COVID-19 Pandemic: Is the Crypto Market a Safe Haven? The Impact of the First Wave. Sustainability 13: 8578. [Google Scholar] [CrossRef]
- Xu, Yingying, and Donald Lien. 2020. Dynamic exchange rate dependences: The effect of the US-China trade war. Journal of International Financial Markets, Institutions and Money 68: 101238. [Google Scholar] [CrossRef]
- Yermack, David. 2015. Is bitcoin a real currency? An economic appraisal. In Handbook of Digital Currency: Bitcoin, Innovation, Financial Instruments and Big Data. Edited by David Lee Kuo Chuen. New York: Academic Press. [Google Scholar]
- Zeng, Ting, Mengying Yang, and Yifan Shen. 2020. Fancy Bitcoin and conventional financial assets: Measuring market integration based on connectedness networks. Economic Modelling 90: 209–20. [Google Scholar] [CrossRef]

| Mean | 0.294 | 0.463 | 0.004 | 0.002 | −0.001 | −0.002 | −0.010 | −0.002 | −0.013 |
| Max | 22.405 | 51.098 | 12.515 | 2.032 | 2.815 | 3.140 | 2.906 | 1.416 | 21.425 |
| Min | −47.056 | −56.561 | −12.846 | −2.399 | −2.814 | −2.669 | −7.909 | −1.841 | −24.780 |
| SD | 4.646 | 7.371 | 0.856 | 0.403 | 0.467 | 0.517 | 0.600 | 0.264 | 1.643 |
| Skew. | −0.635 | 0.228 | 0.003 | −0.024 | −0.039 | 0.155 | −1.402 | −0.203 | −3.899 |
| Kurt. | 11.940 | 9.606 | 76.040 | 5.065 | 6.136 | 6.488 | 23.161 | 8.447 | 105.935 |
| J-B | 5734.2 *** | 3083.5 *** | 375,212.0 *** | 300.0 *** | 692.1 *** | 862.7 *** | 29,141.1 *** | 2098.4 *** | 749,496.7 *** |
| ARCH (5) | 6.248 *** | 11.459 *** | 45.119 *** | 18.136 *** | 6.446 *** | 21.980 *** | 3.316 *** | 6.003 *** | 70.836 *** |
| ADF | −41.932 *** | −40.376 *** | −21.483 *** | −40.003 *** | −40.669 *** | −40.969 *** | −39.298 *** | −45.419 *** | −11.640 *** |
| PP | −42.050 *** | −40.473 *** | −148.399 *** | −40.211 *** | −40.886 *** | −40.973 *** | −39.324 *** | −45.179 *** | −46.579 *** |
| KPSS | 0.122 | 0.222 | 0.224 | 0.126 | 0.123 | 0.435 | 0.161 | 0.380 | 0.033 |
| 1.000 | |||||||||
| 0.554 *** | 1.000 | ||||||||
| 0.051 * | 0.044 * | 1.000 | |||||||
| −0.037 | −0.042 * | 0.042 * | 1.000 | ||||||
| −0.021 | 0.000 | 0.036 | −0.101 *** | 1.000 | |||||
| −0.027 | 0.018 | 0.025 | −0.039 | 0.419 *** | 1.000 | ||||
| −0.061 ** | −0.033 | −0.010 | −0.067 *** | 0.539 *** | 0.140 *** | 1.000 | |||
| −0.068 *** | −0.044 * | 0.019 | −0.044 * | 0.286 *** | 0.127 *** | 0.258 *** | 1.000 | ||
| 0.026 | 0.018 | −0.011 | −0.072 *** | 0.073 *** | −0.047 * | 0.131 *** | 0.112 *** | 1.000 |
| Bitcoin (BTC) | Ethereum (ETH) | Tether (USDT) | |||
|---|---|---|---|---|---|
| Variables | A | Variables | A | Variables | A |
| 0.213 *** | 0.248 *** | 0.464 *** | |||
| 0.043 *** | 0.040 *** | 0.013 | |||
| 0.481 *** | 0.376 *** | 0.392 *** | |||
| 0.174 *** | 0.172 *** | 0.173 *** | |||
| 0.275 *** | 0.292 *** | 0.143 *** | |||
| 0.160 *** | 0.184 *** | 0.234 *** | |||
| 0.352 *** | 0.347 *** | 0.326 *** | |||
| Variables | Average Return Shocks | Partial Co-Volatility Spillover Effects | |||||
|---|---|---|---|---|---|---|---|
| Group 1: Whole Sample (7 August 2015 to 22 April 2022) | |||||||
| 0.0174 | 0.00016 (0.04226) | 0.00177 (0.47562) | 0.00064 (0.17167) | 0.00102 (0.27234) | 0.00059 (0.15798) | 0.00130 (0.34825) | |
| 0.1146 | 0.00115 (0.07402) | 0.01070 (0.68991) | 0.00491 (0.31637) | 0.00830 (0.53546) | 0.00524 (0.33816) | 0.00987 (0.63652) | |
| 0.0037 | - | 0.00068 (0.14189) | 0.00030 (0.06242) | 0.00025 (0.05168) | 0.00040 (0.08479) | 0.00056 (0.11783) | |
| Group 2: US–China Trade War (22 March 2018 to 15 January 2020) | |||||||
| −0.2480 | −0.00225 (0.03983) | −0.02535 (0.44826) | −0.00915 (0.16179) | −0.01452 (0.25668) | −0.00842 (0.14889) | −0.01856 (0.32822) | |
| −0.5446 | −0.00545 (0.05762) | −0.05084 (0.53707) | −0.02331 (0.24628) | −0.03946 (0.41684) | −0.02492 (0.26324) | −0.04691 (0.49551) | |
| −0.0007 | - | −0.00012 (0.07142) | −0.00005 (0.03142) | −0.00004 (0.02601) | −0.00007 (0.04268) | −0.00010 (0.05931) | |
| Group 3: COVID-19 Pandemic (30 January 2020 to 23 February 2022) | |||||||
| −0.0312 | −0.00028 (0.04436) | −0.00319 (0.49924) | −0.00115 (0.18019) | −0.00183 (0.28587) | −0.00106 (0.16582) | −0.00234 (0.36555) | |
| 0.1501 | 0.00150 (0.06647) | 0.01401 (0.61959) | 0.00643 (0.28412) | 0.01087 (0.48089) | 0.00687 (0.30369) | 0.01293 (0.57164) | |
| 0.0002 | - | 0.00004 (0.01750) | 0.00002 (0.00770) | 0.00002 (0.00637) | 0.00003 (0.01046) | 0.00003 (0.01453) | |
| Group 4: Russian–Ukraine War (24 February 2022 to 22 April 2022) | |||||||
| −0.0883 | −0.00080 (0.03173) | −0.00902 (0.35713) | −0.00326 (0.12890) | −0.00517 (0.20449) | −0.00300 (0.11862) | −0.00661 (0.26149) | |
| 0.0542 | 0.00054 (0.03649) | 0.00506 (0.34010) | 0.00232 (0.15596) | 0.00393 (0.26396) | 0.00248 (0.16670) | 0.00467 (0.31378) | |
| −0.0012 | - | −0.00021 (0.00206) | −0.00009 (0.00091) | −0.00008 (0.00075) | −0.00013 (0.00123) | −0.00018 (0.00171) | |
Publisher’s Note: MDPI stays neutral with regard to jurisdictional claims in published maps and institutional affiliations. |
© 2022 by the author. Licensee MDPI, Basel, Switzerland. This article is an open access article distributed under the terms and conditions of the Creative Commons Attribution (CC BY) license (https://creativecommons.org/licenses/by/4.0/).
Share and Cite
Hsu, S.-H. Investigating the Co-Volatility Spillover Effects between Cryptocurrencies and Currencies at Different Natures of Risk Events. J. Risk Financial Manag. 2022, 15, 372. https://doi.org/10.3390/jrfm15090372
Hsu S-H. Investigating the Co-Volatility Spillover Effects between Cryptocurrencies and Currencies at Different Natures of Risk Events. Journal of Risk and Financial Management. 2022; 15(9):372. https://doi.org/10.3390/jrfm15090372
Chicago/Turabian StyleHsu, Shu-Han. 2022. "Investigating the Co-Volatility Spillover Effects between Cryptocurrencies and Currencies at Different Natures of Risk Events" Journal of Risk and Financial Management 15, no. 9: 372. https://doi.org/10.3390/jrfm15090372
APA StyleHsu, S.-H. (2022). Investigating the Co-Volatility Spillover Effects between Cryptocurrencies and Currencies at Different Natures of Risk Events. Journal of Risk and Financial Management, 15(9), 372. https://doi.org/10.3390/jrfm15090372