Article

The Impacts of the Russia–Ukraine Invasion on Global Markets and Commodities: A Dynamic Connectedness among G7 and BRIC Markets

1
BRAC Business School, BRAC University, Dhaka 1212, Bangladesh
2
College of Business, Al Ain University, Al Ain P.O. Box 64141, United Arab Emirates
3
School of Economics and Finance, Massey University, Auckland 0745, New Zealand
4
Faculty of Management Studies, University of Delhi, Delhi 110007, India
5
Higher Colleges of Technology, Dubai P.O. Box 25026, United Arab Emirates
*
Author to whom correspondence should be addressed.
J. Risk Financial Manag. 2022, 15(8), 352; https://doi.org/10.3390/jrfm15080352
Submission received: 29 June 2022 / Revised: 28 July 2022 / Accepted: 2 August 2022 / Published: 8 August 2022
(This article belongs to the Special Issue Commodity Market Finance)

Abstract

:
The conflict between Russia and Ukraine has been causing knock-on effects worldwide. The supply and price of major commodity markets (oil, gas, platinum, gold, and silver) have been greatly impacted. Due to the ongoing conflict, financial markets across the world have experienced a strong dynamic regarding commodities prices. This effect can be considered the biggest change since the occurrence of the financial crisis in the year 2008, which explicitly influenced the oil and gold markets. This study attempts to investigate the impacts of the Russian invasion crisis on the dynamic connectedness among five commodities and the G7 and BRIC (leading stock) markets. We have applied the time-varying parameter vector autoregressive (TVP-VAR) method, which reflects the way spillovers are shaped by various crises periods, and we found extreme connectedness among all commodities and markets (G7 and BRIC). The findings show that gold and silver (commodities) and the United States, Canada, China, and Brazil (stock markets) are the receivers from the rest of the commodities/market’s transmitters of shocks during this invasion crisis. This research has policy implications that could be beneficial to commodity and stock investors, and these implications could guide them to make many decisions about investment in such tumultuous situations. Policymakers, institutional investors, bankers, and international organizations are the possible beneficiaries of these policy decisions.
JEL Classifications:
G11; G15; H12; J15

1. Introduction

The conflict between Russia and Ukraine has been causing knock-on effects worldwide. The supply and price of major commodity markets (oil, gas, platinum, gold, and silver) have been greatly impacted.1 Due to the ongoing conflict, financial markets across the world have experienced a strong dynamic regarding commodities prices. This effect can be considered the biggest change since after the occurrence of the financial crisis in the year 2008, which explicitly influenced the oil and gold markets.2 Given this effect, the price of both Brent and West Texas Intermediate (WTI) crude oil has climbed to more than USD 100 per barrel on February 24 while facing the Russian and Ukraine conflict. This invasion has equally changed gas prices, which augmented to USD 3.54 per gallon, and gold prices crossed the figure of USD 1900 per ounce (Liadze et al. 2022).
Accordingly, the prices of commodities are strongly connected with the stock market (Naeem et al. 2022). Therefore, an appropriate connectedness among the five major commodity markets and G7, and BRIC (Brazil, Russia, India and China) markets may be beneficial for investors in their decision-making processes during the Russian and Ukraine conflict. To the best of our knowledge, this is the first study to examine the rapport between the G7 and BRIC stock and commodity markets before and during the Russia–Ukraine conflict. Thus, the investigation of connectedness among the major commodities and countries will be beneficial for investors and policymakers regarding right and quick decisions for easy investment during the Russian and Ukraine conflict as well as better outcomes by minimizing financial losses.
However, recent studies have found connectedness between the Russia and Ukraine conflict during the short time frame data on key global economies, such as the United States of America, Canada, the United Kingdom, and the European Union (Liadze et al. 2022; Yousaf et al. 2022; Mbah and Wasum 2022). Studies have found negative impacts on the stock market, commodity price, and energy price (Yousaf et al. 2022; Berninger et al. 2022). For example, Yousaf et al. (2022) investigated the conflict between Russia and Ukraine in the G20 and other selected stock markets using the event study approach. They identified that the day of invasion revealed a strong negative impact of this military action on a majority of the stock markets, especially on the Russian market. Tosun and Eshraghi (2022) investigated the financial market reaction to announcements of companies remaining in Russia during the eventful two weeks following the invasion. They found a higher trading volume and selling pressure on remainders, and it was difficult to make any effective decision during the time of political conflict. In general, the Russia–Ukraine war created a challenging economic impact on other countries and on the global economy. Wang et al. (2022) revealed that the total volatility spillover increased from 35% to 85%, exceeding the level seen during the pandemic. The role of commodities changed in both return and volatility spillover systems. Crude oil became a net transmitter of return spillovers, whereas wheat and soybeans became net receivers of return spillovers. Silver, gold, copper, platinum, aluminium, and sugar became net transmitters of volatility. Geopolitical risk Granger caused the spillover indices. High levels of return and volatility spillovers are associated with high levels of geopolitical risk (Wang et al. 2022). The purpose of the current study is to investigate the impacts of the Russian invasion crisis on the financial markets, in particular to identify the main sources of energy market price changes among G7, BRIC and the five commodity markets. According to the recent work by Balcilar et al. (2021), Papathanasiou et al. (2021), and Zhang et al. (2021), the current approach used consists of the time-varying parameter vector autoregressive (TVP-VAR) coming from Antonakakis et al. (2020), which improves the classic technique of Diebold and Yilmaz (2012). Moreover, this method will answer whether these markets’ spillovers or connections are higher during the Russia–Ukraine war compared to normal times. We have chosen this methodology because it overcomes restrictions of the basic methodology, as it allows for fluctuations over time and thus provides a more robust estimate. Additionally, the gradation of every roll window width is not an obligatory condition, as roll window analysis is not incorporated, which preserves the use of every available information. Due to the short sample of our paper (1 September 2021–23 February 2022) and during 24 February–24 March 2022, this is a good advantage in case of a conflict between Russia and Ukraine. Moreover, G7 economies represent the developed part of the world and have strategic importance in world GDP, development, trade, investments, and supply chain of commodities (as the largest consumer of the world in PPP) (Waheeduzzaman 2011; Wei et al. 2020; Jiang et al. 2020). Conversely, BRIC markets have played a momentous role in world development, trade, investment, and sectoral cooperation since their inception in 2001 (Iqbal 2021). As a result, BRIC countries in light of other emerging economies (China and India) have emerged as two leading importers (largest consumer base in terms of population) and production hubs of the world, whereas Russia is the principal producer and exporter of energy commodities (Huynh et al. 2020; Shahzad et al. 2019). In the last two decades, the BRIC market group has attracted a large segment of capital inflows, where the highest amount of FDI, FII, and strategic cross border investments are being made (Sauvant 2005; Singhania and Saini 2018; Naeem et al. 2022). Correspondingly, in the last 15 years, the pace of development has slowed down in developed countries after the global financial crisis (GFC) and the European debt crisis, while BRIC countries have emerged as an engine of world economic growth (Radulescu et al. 2014; Siddiqui 2016).
The empirical analysis discloses that among the other nations, four major economies including the US, Canada, China, and Brazil are the major receivers of losses among G7 and BRICS countries. Similarly, the analysis displays the fact that gold and silver are the receivers from the rest of the commodities/market’s transmitters of shocks during this invasion crisis. Our empirical findings will be of interest to market participants and policymakers, as they show that among the five commodities, natural gas remains relatively intact through retransfer mechanisms and can thus form a practical diversification element when added to a portfolio. Similarly, the central banks from these economies should proceed carefully regarding the management of these commodities and should reduce any information asymmetric among the stakeholders of commodities to sustain the market functioning.
The suggesting sections concerning this manuscript are organized as observed: Section 2 describes the review of existing and past literature on the concerned area. Section 3 contains the data and methodology of the paper. Section 4 shows results and discussions. Section 5 concludes the study with some policy implications and limitations.

2. Literature Review

In the past, the invasion of Russia on Ukraine was also considered the most crucial and critical geopolitical disaster, and many worldwide leaders have given their opinions on this crisis.
The current analysis deems to pursue the resource dependency theory in the current perspective. This theory has been utilized by previous literature to see the outcomes in politics. For instance, the analysis of Sprout and Sprout (1957) appeared to not only explore the physical resources, e.g., geography and metals, but also to check the effect of invasions on mental factors including thinking capability and other human reactions. Similarly, another analysis by Pfeffer and Salancik (2003) emphasized the relevant role of scarce and crucial resources, while Beitz (1979) corresponded by stressing at resource fairness that may serve as the root of peace. Advancing the discussion, the study of Reuveny and Barbieri (2014) has explored the relevant impact of war on the utilization of natural resources and has asserted the significant impact on minerals. Selznick (1949) examined the connection between political affairs and enterprises and highlighted the role of political affairs even at the international level on multiple firm-level strategies. Each country owns a specific bundle of resources, e.g., climate, location suitability, fertile land, resources having high demand, and excess availability of common natural resources (Davidson 1980). Given to this, the resource dependency theory supplements a composition to deal with key questions: what are the resources that Russia lacks in terms of quality and quantity? This theory further provides the theoretical background regarding energy sources in Ukraine which are lacking by Russia and urges it for invasion. What are the resources that Russia is interested in acquiring or relocating to their own country? What will be the policy implications of the ongoing war on available resources of Russia and the rest of the world? Hence, the theory facilitates the geographic regions in Ukraine that can be marked as the interest in Russia to be acquired.
The geopolitical risk (GPR) has changed the relationship between European, Russian, and global commodities, where European markets and Russian bonds are collectively transmitting the shocks and affecting returns and volatility in the short and long term (Umar et al. 2022a). Geographical positions of the countries and firms to the war location have implications of returns if countries are located within the boundary of 1000 km, in which it has generated greater negative returns in the four-week time from the war (Federle et al. 2022). Further, during this conflict, results are generated by negative dynamic conditional correlations that USD, JPY, silver, Brent, WTI, and natural gas are found to be a safe haven compared to the Russian rouble to the as indicated (Mohamad 2022). Additionally, Umar et al. (2022b) found the changes in the behaviour of returns among various financial assets due to GPR even in the normal market conditions, and it is dependent upon the type of market and market situations. Diverse assets depicted different risk patterns in terms of magnitude and timeframe. Bonds and equities have a war impact in the long term, and cryptos have nullified in the short term, while the Swiss franc, gold, silver, green bonds, and oil are the most shock-fighting assets (Bedowska-Sojka et al. 2022). After the Russian invasion, oil was strongly connected with bitcoin, bonds, gold, US dollar, and stocks. Oil also changed its status from a net receiver to a net transmitter of spillovers (Adekoya et al. 2022)
Researchers focused on the relationship between stock markets and energy markets for taking investment decisions and a better understanding of the price fluctuations between the markets (Lin and Su 2020; Peng et al. 2021). The relationship between the two markets have been changed dramatically during the world financial recession, i.e., the global financial crisis (GFC), the great crash of the stock market (GCS), and the European debt crisis (EDC) (Wen et al. 2019, 2020a; Aromi and Clements 2019). The COVID-19 situation also had a significant effect on the global energy markets. In addition, Bouri et al. (2021b) found that US stock, crude oil and gold spillovers seem to intensify during crisis periods. Sharif et al. (2020) outlined that price of oil had a significant effect on US markets and job security, operations of the business, and amenities of mandatory regions were directly impacted in the period of COVID-19. Moreover, Bouri et al. (2021a) found that the dynamic total connectedness across the five assets (gold, crude oil, world equities, currencies, and bonds) was moderate and quite stable during early COVID. Abuzayed et al. (2021) found that bivariate systemic risk contagion between the global stock market and each individual stock market evolved during the sample period and intensified as COVID-19 spread worldwide. Iqbal et al. (2022) found an intensive extreme spillover among the realized volatility of various energy, metals, and agricultural commodities more intensive during the COVID-19 pandemic. As a result, the investors have changed their investment decisions and strategies in stock and energy markets (Mazur et al. 2020; Wen et al. 2020b).
Wars and other natural disasters always hamper economic growth massively. Recently, the two major global economies of Russia and Ukraine have been in the battle and are busy assaulting each other. Both countries are utilizing their military powers to encounter the enemy. This fight has had huge global economic consequences all across the world, as every country is either directly or indirectly globalized in today’s time. In addition to such losses, it is further estimated that global GDP will reduce by 1% in the year 2023 due to the globalization effect (World Bank 2022). This loss can be estimated as a USD 1 trillion-dollar reduction in the total GDP of the world. Similarly, the conflict between Ukraine and Russia will add almost 2% to 3% to net inflation across the world (World Bank 2022). In parallel, Ukraine and Russia are major providers of merchandise that include wheat, titanium, corn, etc., on the global stage. Thus, the conflict between both countries can give more to economic complexities regarding the supply of such commodities across the world. Due to the special rebate received by suppliers, the value of such merchandise can move beyond the approximations due to the major chunk and contribution of both states in the global merchandises market. Similarly, this war between Russia and Ukraine can hamper the supply of smartphones, aircraft, and other similar products and thus can intensify the price level of such commodities.
Despite the consequences for other nations, this war can lift the inflation rate to 20 percent in Russia during this year. After COVID-19, this war can prove mounting to more inflation in the Western region of the world. It can be expected that economic growth in the UK can reduce from 0.8 to 4.0 percent in the year 2022 and to 0.5 percent in 2023. Currently, the inflation rate in the UK is 7 percent, which can lower to 5.3 percent excluding the effect of the current war (World Bank 2022). However, the February 2022 outlook report exemplifies that this inflation can go by the rate of 2.7 percent and 2.3 percent in 2023 and 2024, respectively (European Central Bank 2022). The ongoing war between Ukraine and Russia has intensified the other economic issues, e.g., the monetary policy uncertainty, hampering business confidence, and damaging of overall consumer demand, which was already at the bottom level due to COVID-19-driven price increases. Referring to such damages, it can be further expected that the Russia–Ukraine conflict can increase economic damages on both sides, such as the disruption of trade flows initiates major shortages in the complex food value chain: production, processing, packaging, storage, transportation, and retail sales. In turn, manufacturing will result in excessive logistical costs and high-risk premiums due to missed delivery deadlines and damaged goods (Van Bergeijk 1995). Meanwhile, studies have investigated the connectedness between the commodity price during the COVID-19 period and have found that commodity prices were adversely affected (Mokni et al. 2021; Umar et al. 2021; Iqbal et al. 2022). Wang et al. (2022) studied geopolitical risk and the systemic risk in the commodity markets under the war in Ukraine. They found that a role of commodity changes in both return and volatility spillover systems. Recent studies have found a negative relationship among the global economy, stock market, energy market, commodity price, and resources due to the Russia and Ukraine war (Liadze et al. 2022; Yousaf et al. 2022; Mbah and Wasum 2022; Berninger et al. 2022; Deng et al. 2022). Similarly, investors have an additional penalty due to the ongoing business corporations from the Russia and Ukraine war (Tosun and Eshraghi 2022). Lastly, the world economy is suffering a lot as a result of war crisis (Mbah and Wasum 2022).

Theoretical Review

Even though the prevailing literature provides a sufficient indication of the relevant impact of the Russia–Ukraine 2014 war on the economy, it is uncommon how this ongoing war will affect the efficiency of the commodity market. The existing situation provides credible descriptions of the ongoing conflict between Russia and Ukraine from the past, but fresh evidence is missing. Specifically, several studies are unable to supplement the theoretical background of such conflicts, and thus, a theoretical explanation is missing in the literature. Thus, the current analysis argues the testable hypotheses that fully encompass the role of energy markets and other energy resources, e.g., crude oil in the Russia–Ukraine war. The scholarly evidence on this interesting phenomenon is missing, and the literature has not ascertained the direct role of this conflict on energy markets in both countries (Van de Graaf and Colgan 2017). Belyi (2016) explained some limitations of resource measurements in his study. However, Stulberg (2017) has argued that energy markets and energy act as a tactical curb for Russia, Ukraine, and the European Union. Lee (2017) reveals that the conflict between Ukraine and Russia was aroused due to the historical conflict of gas. Similarly, extracting some more understanding from the analysis of Colgan (2013), it can be further identified that four fundamental paths are playing a fundamental role in the ongoing Russia–Ukraine war. These resources are internal energy markets owned by Ukraine, existing energy resources in Ukraine, Ukraine’s ability to confront the Russian energy dominion in the EU market, transit routes of Ukraine’s gas, and the dependency of the EU and Ukraine on Russian gas (Colgan 2013).
Moreover, recent studies found a negative impact of the Russia and Ukraine war on the global economy, stock market, energy market, commodity price, and resources (Liadze et al. 2022; Berninger et al. 2022; Deng et al. 2022). Tosun and Eshraghi (2022) found that investors have imposed a significant penalty on the remaining firms following the invasion. The review of Mbah and Wasum (2022) revealed that the global economy has begun to feel the impact of this crisis. Inflation, which is already ravaging most global economies, is steadily rising due to the sharp increase in oil, natural gas, and food price shown within a few days of this crisis. Thus, the world economy is experiencing a negative impact on household consumption, increased uncertainty, unpredictable stock swings, supply chain disruptions, bulging utility bills, decreased investment due to political risks, and economic growth impediments. Yousaf et al. (2022), based on a regional analysis, outlined that the European and Asian regions are significantly and adversely affected by this event. Chatziantoniou et al. (2022), in their research, also proved a strong impact of the 2014 war and other collapses in recent years; more specifically, oil and the Canadian market from G7 are transmitting strong volatility shocks.

3. Data and Methodology

To understand the spillover effects of before (1 September 2021–23 February 2022) and during (24 February–24 March 2022)3 the Russian invasion of Ukraine, we use five major commodity spot prices, namely crude oil (OIL), natural gas (N.GAS), platinum (XPTUSD), silver (XAGUSD), and gold (XAUUSD), and we use the G7 (Canada, France, Germany, Italy, Japan, UK, and US) and BRIC (Brazil, Russia, India, and China) MSCI market indices for the period from 1 September 2021 to 24 March 2022. The chosen countries stand for major advanced and developing economies, affecting global development with their high degrees of commodity needs. Moreover, the data were collected from the Bloomberg database system.
As per Table 1, all the commodities are yielding positive average returns. Except for Canada, all other countries are experiencing a negative average return. Natural gas and crude oil are the most volatile commodities, and Russia has shown the highest volatility followed by the UK and Italy. Here, we may undoubtedly observe the direct impact of the Russian invasion on commodities as well as markets4. Here, in Table 1, other than platinum and natural gas, all other commodities including all the sample markets are having negative skewness, which shows that the tail of the distribution is left-skewed and longer or fatter towards the left. Gold, silver, and platinum are out of commodities, and Brazil, the US, and Japan are nearing the standard value of Kurtosis, i.e., 3, which depicts the mesokurtic shape of returns in this distribution. All returns series are stationary at a 1% significance level as per the unit root test of the ADF test (Dickey and Fuller 1979), and the Philips–Perron test (Phillips and Perron 1988).
Further, from Figure 1, clear spikes are detected at the end of February and March during the invasion time. Here, all the commodities are presenting positive peaks, while gold, platinum, and crude oil have experienced a greater intensity of volatility (Dodd et al. 2022; Costola and Lorusso 2022). Conversely, all the markets exhibit a downfall, i.e., negative volatility has greater impacts than positive shocks supported by many past studies (Dimitriou et al. 2013; Boungou and Yatié 2022; Boubaker et al. 2022).
To examine the return spillovers between the five major commodities, G7 and BRIC markets in a time-varying manner, we utilized the TVP-VAR method of Koop and Korobilis (2014) and integrated it using the connectedness method of Diebold and Yilmaz (2014). This particular system enables the variations to differ in time through a Kalman filter evaluation, which depends on the decay elements. By doing this, the TVP-VAR method eliminates the concern of the frequently randomly selected rolling window size, which might cause quite unpredictable or squashed parameters and a lack of important observations (Antonakakis et al. 2018, 2020; Gabauer and Gupta 2018; Korobilis and Yilmaz 2018). This version also provides unique qualities to acknowledge prospective structural breaks and offers considerable factors to acknowledge the connection amongst the factors.
Based upon the Bayesian information criterion (BIC), an autoregressive parameter vector method with time-varying (TVP-VAR) by Antonakakis et al. (2020) is built on the subsequent formula:
y t = A t Z t 1 + ε t         ε t ~ N ( 0 , Σ t )
v e c   ( A t ) = v e c   ( A t 1 ) + ξ t         ξ t ~ N ( 0 , Ξ t )
where y t , Z t 1 and ε t are the K × 1 dimensional vector, and A t and Σ t are the K × K dimensional matrices. v e c   ( A t ) and ξ t are K 2 × 1 dimensional vectors, whereas Ξ t is a K 2   ×   K 2 dimensional matrix. As the dynamic connectedness approach of Diebold and Yilmaz (2012, 2014) rests on the Generalised Forecast Error Variance Decomposition (GFEVD) of (Koop et al. 1996; Pesaran and Shin 1998), it is required to transform the TVP-VAR to its TVP-VMA representation by the Wold representation theorem:
y t = h = 0   A h , t , ε t i   w h e r e   A 0 = I K .
The H-step ahead GFEVD models the impact a shock in series j has on series i . This can be formulated as follows:
θ i j , t g ( H ) = h = 0 H 1 ( e i A h t Σ t e j ) 2 ( e j Σ t e j ) h = 0 H 1 ( e i A t S t A t e i )
θ ˜ i j , t g ( H ) = θ i j , t g ( H ) k = 1 K θ i j , t g ( H )
where e i is a the K × 1 dimensional zero vector with unity on its i th position. As θ i j , t g ( H ) stands for the unscaled GFEVD ( j = 1 K   ζ i j , t g ( H ) 1 ), Diebold and Yilmaz (2009, 2012, 2014) suggested to normalize it by dividing θ i j , t g ( H ) by the row sums to obtain the scaled GFEVD, θ ˜ i j , t g ( H ) .
The scalable GFEVD is at the core of the connectivity approach and facilitates calculating the total directional connectivity to (from) all indexes from (to) index i . While the total directional connectivity TO describes the effect that index i has on all the others, the total directional connectivity OT describes the impact that all indexes have on index i . These connectivity steps can be calculated by:
C i j , t g ( H ) = j = 1 , i j K θ ˜ j i , t g ( H )
C i j , t g ( H ) = j = 1 , i j K θ ˜ i j , t g ( H )
Computing the difference between the TO and the FROM total directional connectedness results in the net total directional connectedness of series i :
C i , t g ( H ) = C i j , t g   ( H ) C i j , t g   ( H )

4. Results and Discussion

This study was conducted on five commodities, G7, and BRIC countries before and during the Russia–Ukraine war. During the invasion crisis, a drastic rise in the prices of commodities, a dramatic fall in the prices of securities, and a huge setback in trade and cross-border investments, more specifically in G-7 and BRIC economies (Wang et al. 2022; Saâdaoui et al. 2022; Orhan 2022) has occurred. This has led to high volatility around the world, especially from the invasion crisis (February 2022-on going). We used daily prices and yield data for five commodities and twelve markets (most developed and developing economies across the world). The data were collected from the Bloomberg database, by applying the formula: r i , t = l n ( p i , t ) l n ( p i , t 1 ) , daily return was calculated.

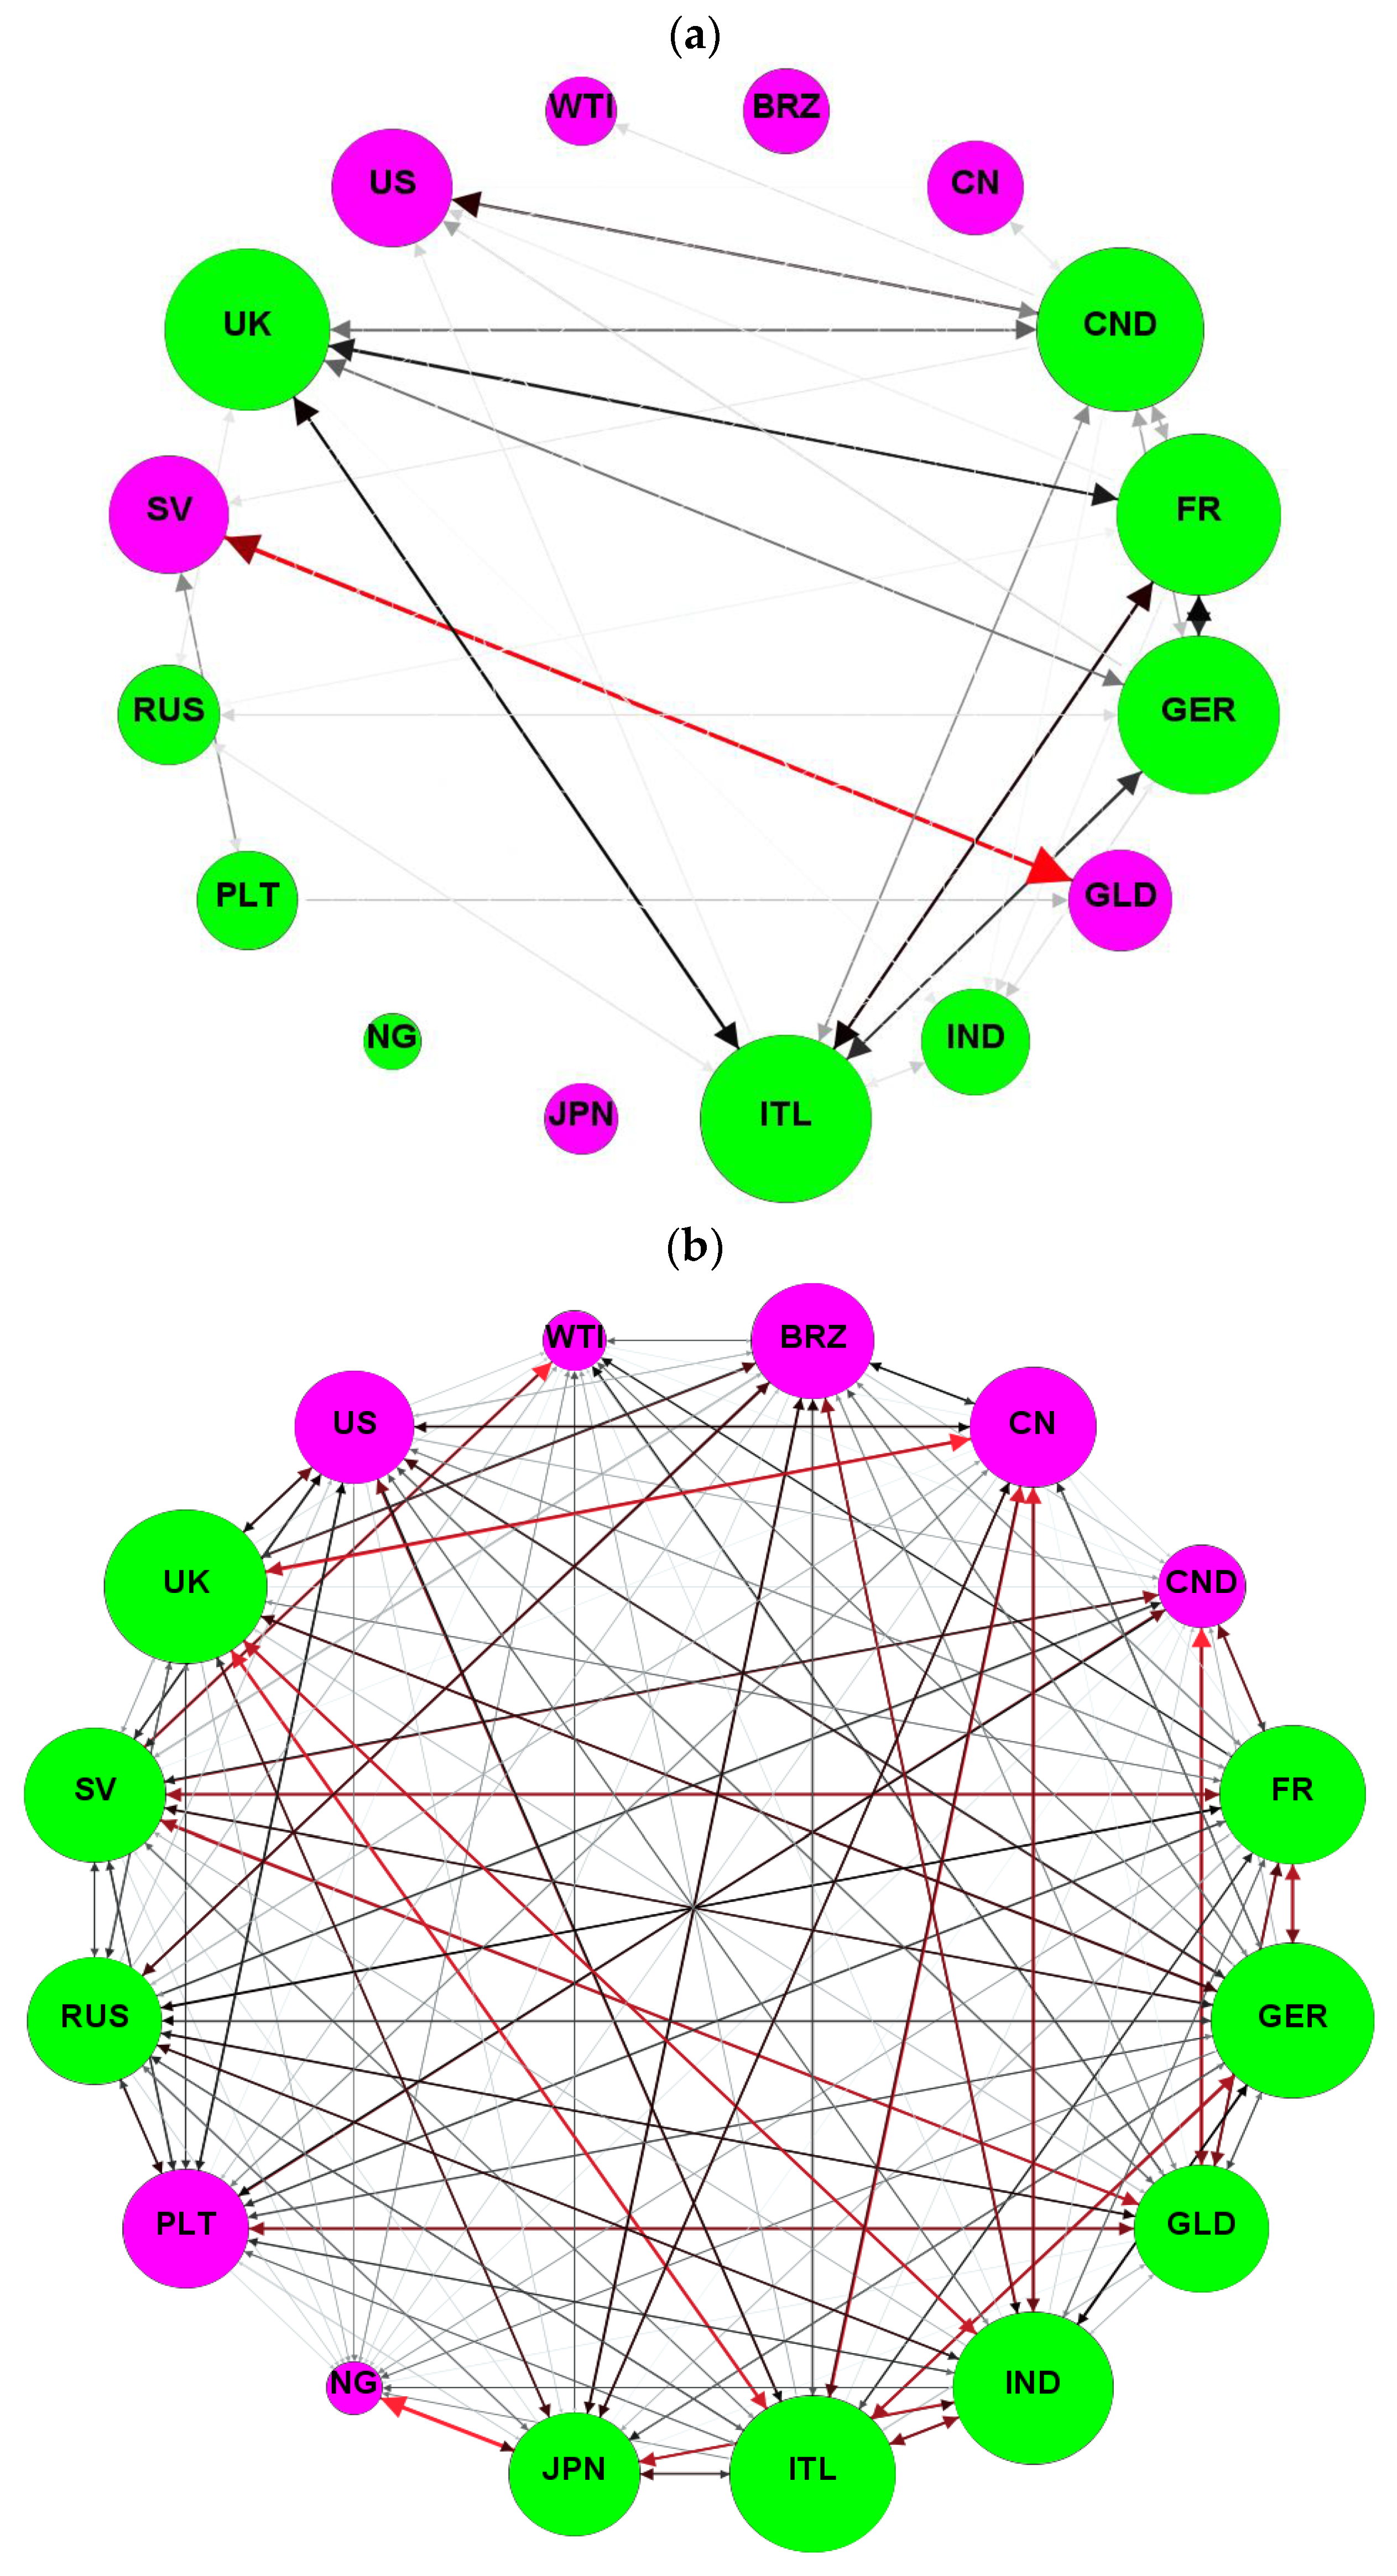
4.1. The Connectedness Network Spillovers

This Russia–Ukraine war has shattered economic activities, trade patterns, market returns and commodities supply chains. We applied the network connectedness of the TVP-VAR method suggested by Koop and Korobilis (2014), which is an advanced version of the traditional Diebold and Yilmaz (2012, 2014) method and estimate for the return spillovers amongst the sample commodities and markets for the period 1 September 2021 to 24 March 2022. Invasion effects can be observed from the results of the invasion on the returns connectedness on commodities and on all sample markets.
From Figure 2a, it can be asserted that prior to the occurrence of the invasion crisis, platinum and natural gas were net recipients of spillovers, and the remaining commodities were net transmitters. It is evident that there is strong connectedness between gold and silver, as both commodities massively influence each other. This description relating to gold and silver has also been stated by (Balli et al. 2019; Naeem et al. 2022; Mbah and Wasum 2022) in their studies. Conversely, the US, China, Japan, and Brazil are the net transmitters with comparatively low intensity, and the rest are recipients. It is quite apparent in the case of capital markets that the UK and other European markets are the most connected markets due to a member of regional economic integration (EU) in the sample countries transmitting the risk/return to each other among European countries. Canada is one of the largest transmitters in the network and is connected to the US, UK, Italy, Germany, and France. The UK is the largest receiver of the spillovers due to major EU countries in the sample data. Before the crisis, Russia, the US, India, China, Japan, and Brazil reflected a lesser connectedness pattern.
Subsequently, an opposite picture is displayed in Figure 2b, where a nest of connections has been presented not only among commodities and capital markets but also within each other, which reflect the consequent effects of the crisis already proven by (Wen et al. 2020a; Bouri et al. 2021a, 2021b; Umar et al. 2022a) in the past, such that commodities were also treated as an alternative investment, more particularly gold and silver. During the invasion crisis, gold and silver are net transmitters, and crude oil, platinum, and natural gas are net recipients. Conversely, most of the capital markets are net transmitters, as they are most affected by the crisis, but only the US, Brazil, China, and Canada are the recipient(s). Conclusively, the ongoing invasion has enormous consequences for sample countries, and it has affected the overall economic positioning of all the sample markets. From the literature, the studies of (Mazur et al. 2020; Bedowska-Sojka et al. 2022; Federle et al. 2022) have also asserted similar effects in the past.
Additionally, a nest is formed among the commodities and markets reflecting high intensity of volatility spillover because risk is being transmitted among them during this GPC. During war, gold and silver among commodities and Japan from markets changed their status from net transmitters to net receivers (Wang et al. 2022). Conversely, natural gas, platinum, and Canada turns net transmitters during the Russian invasion. An interesting observation can be seen that commodities were hardly connected with markets during pre-war time, but huge spillover connectedness is detected during the war (Wen et al. 2020a; Bouri et al. 2021a; Umar et al. 2022a).

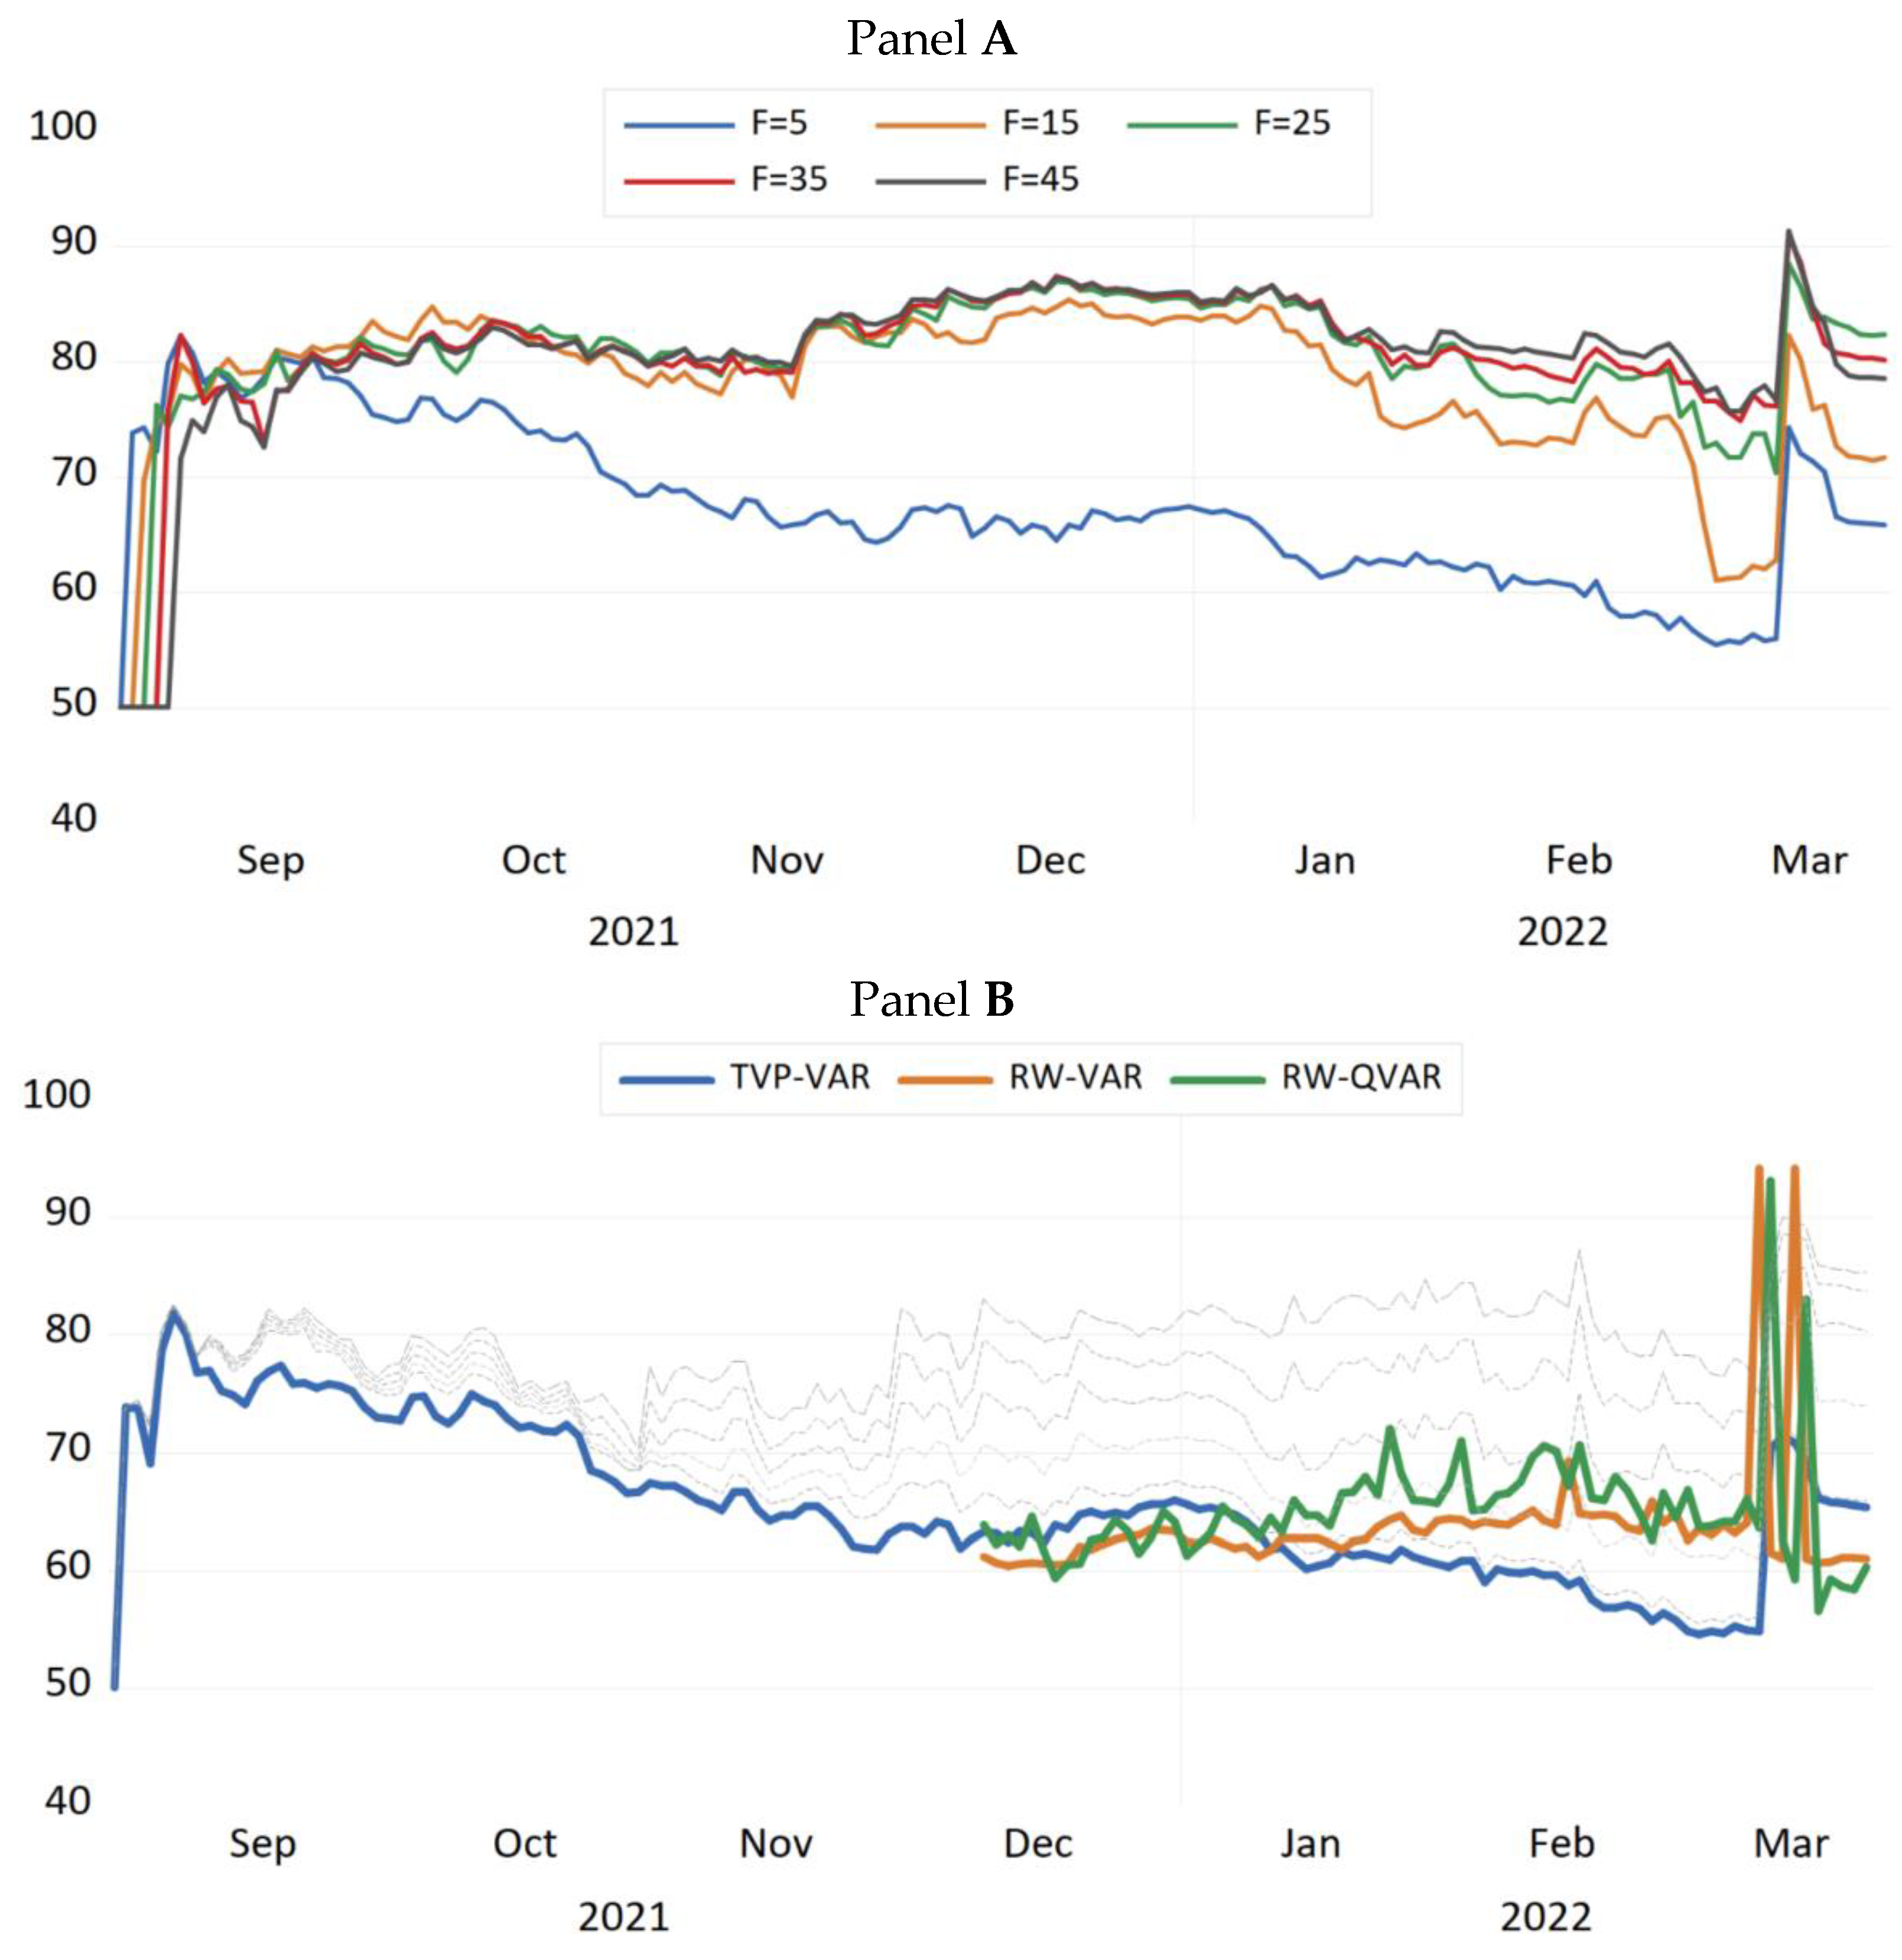
4.2. Averaged Total Returns Spillovers

To clarify the effect of ongoing GPC, we have also presented the total time-varying (averaged total returns) spillovers between the five commodities and all the sample countries. In Figure 3, it is shown that before the start of war, the spread of COVID-19 was settling down. The spillover effect was decreasing from its peak level of 86% during the second wave of COVID-19 in the month of September 2021 to around 57% in the month of January 2022. However, this spillover augmented in February due to the sudden start of border tensions between the two companion counterparts. After this, a strong spike in spillover effect was observed that crossed the level of 65%. However, this increasing level stopped and settled at 60%, as the war force was limited and peace talks between the two countries were opened. This again supports the findings of (Adams et al. 2015), which suggest that return spillover collectively increased among all the commodities and markets during war crises (Boungou and Yatié 2022; Chatziantoniou et al. 2022; Umar et al. 2022b). In the process of such uncertain events, even limited diversification opportunities were available due to a high degree of spillovers among all markets and commodities (Wen et al. 2020a; Jiang et al. 2020; Naeem et al. 2022).

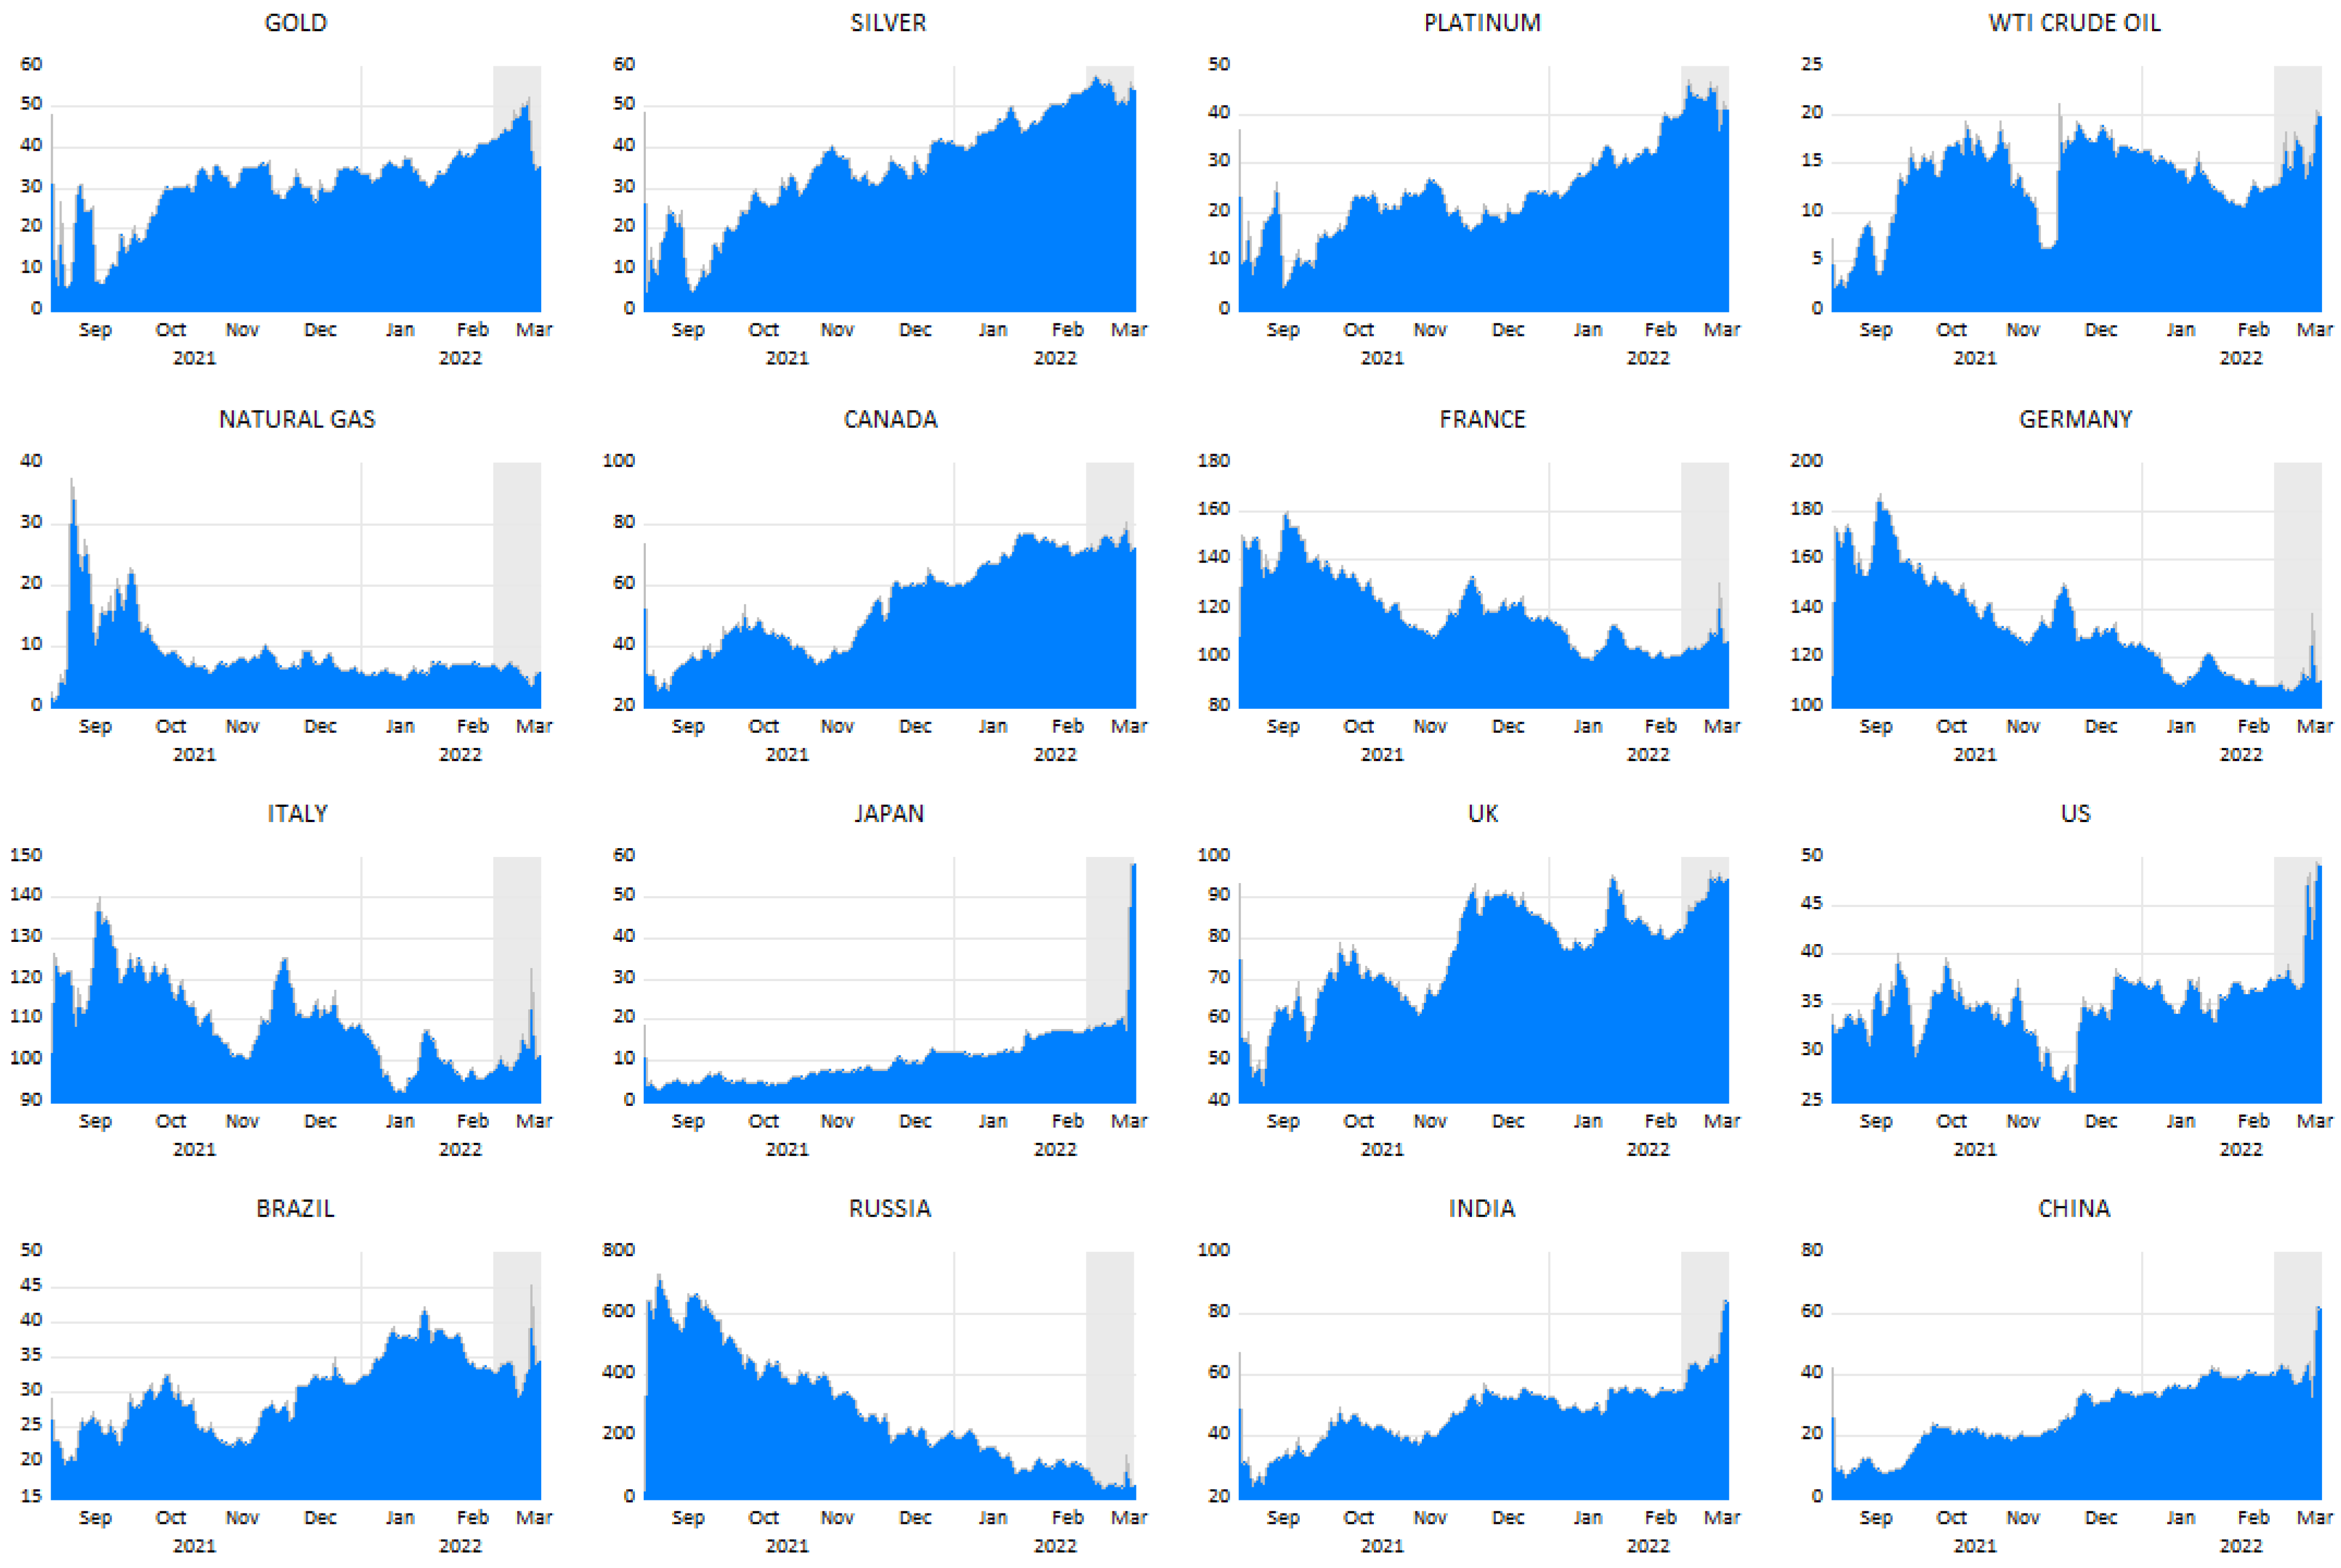
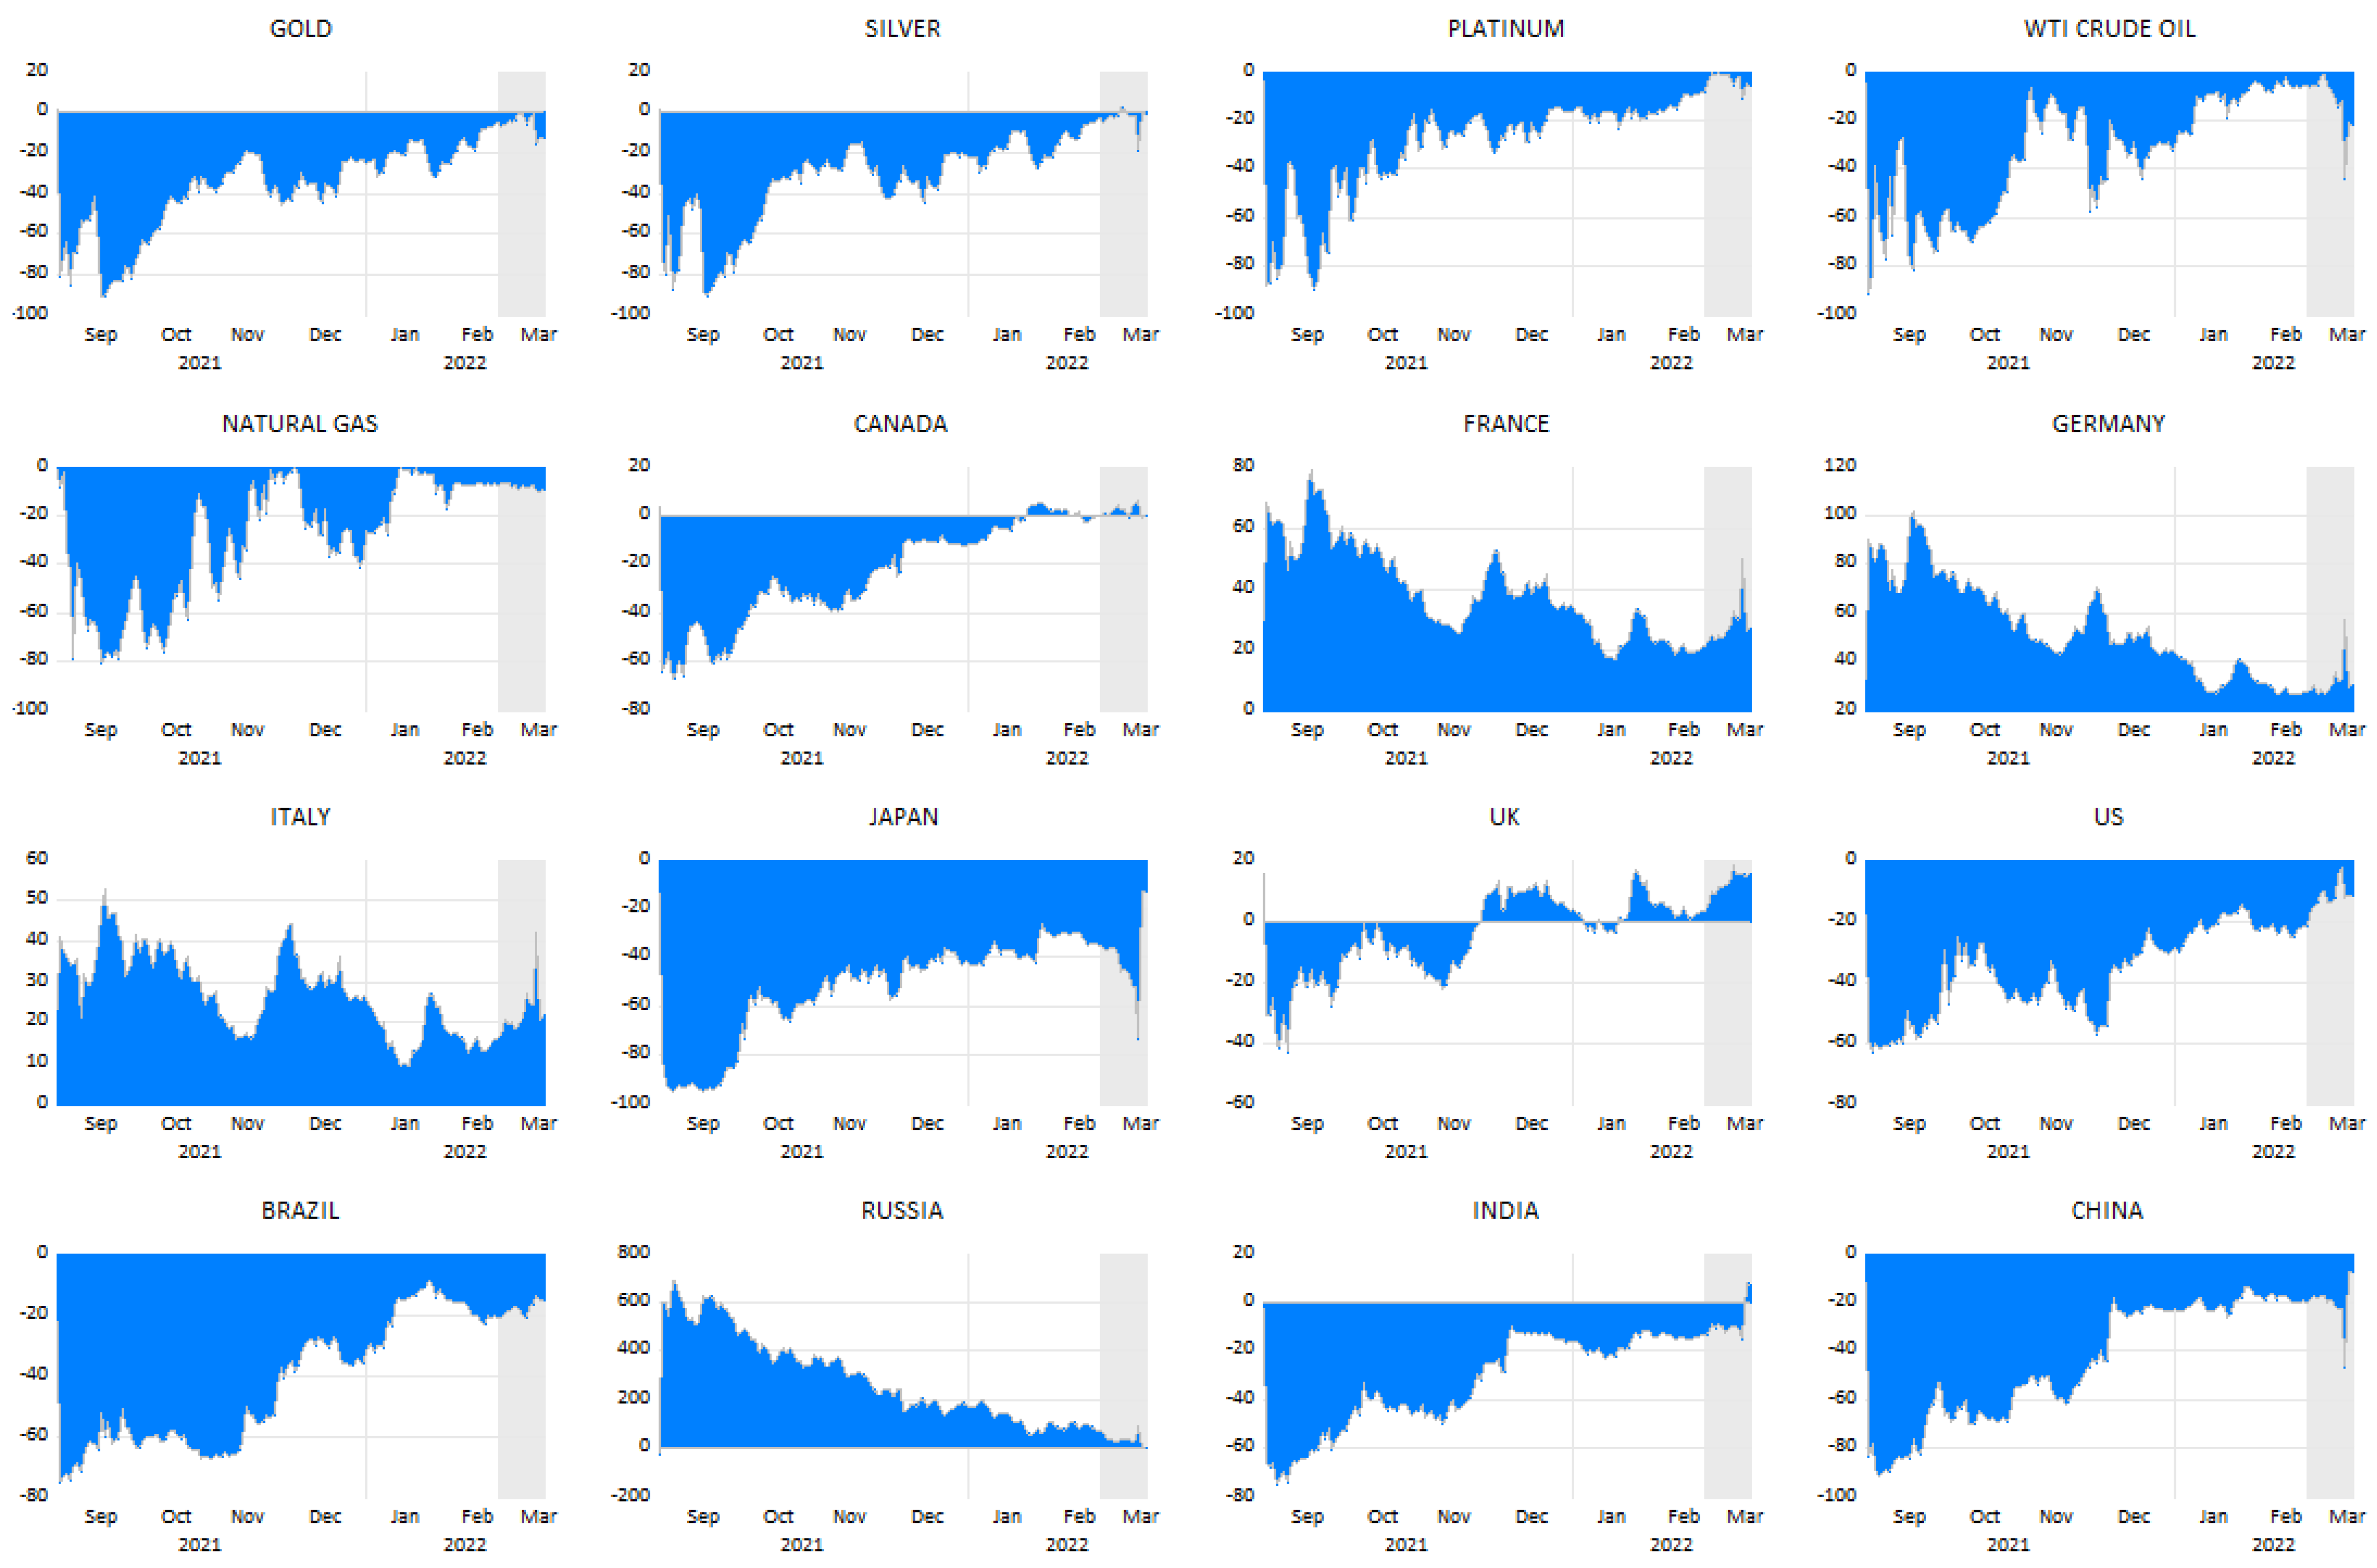
4.3. Net Total, “To”, and “From” Return Spillovers

To better understand the spillovers, more specifically during critical periods, we analysed the time-varying behaviour of interconnectedness between commodities and stock markets. Consequently, we also applied the total return spillovers (TO, FROM, NET) as exhibited in Figure 4, Figure 5 and Figure 6 from all commodities and markets to each commodity and market, respectively. In Figure 4 and Figure 5, total dynamic spillovers to/from each series are displayed and are bidirectional.
Figure 4 shows the spillover transferred to other commodities and markets, where except for natural gas, all other commodities showed a substantial return spillover to other commodities and markets. Platinum, silver, and gold have shown strong spillover variation during the months of February and March even before the invasion started because Russia is one of the largest exporters of these commodities in the world markets 5. Conversely, almost every market has transmitted return spillover to other markets, and some have reflected spillover effects before the war as well, but post-war peaked spikes can be seen in each market. Canada seems to be exceptional, as it shows a continuously rising spillover effect since September 2021 due to a slowdown in the economy, but the spillover was further aggravated during the event (Sher 2020). Another important observation is that G7 (except Canada) markets were largely impacted by this war (Federle et al. 2022; Umar et al. 2022b). The US, India, China, and Japan are the largest transmitters to commodities and other markets of the study. This is proven because the US and Japan are one of the largest economies, while India and China are the principal emerging economies in the world.
From Figure 5, quite a different image is observed, as WTI crude oil is a prominent recipient of return spillover because EU countries are consuming almost 40% crude oil from Russia (Schiffling and Valantasis Kanellos 2022). Next, platinum, gold, silver, and natural gas (less intensity) are also receiving return spillover from other commodities and markets, but gold and natural gas are experiencing comparatively less spillover effects. In the case of capital markets, other than Canada, all other markets show huge spikes of return spillover from other commodities and markets. Importantly, all European countries were experiencing (receiving) spillover effects not only before the war but also during the war, as they have strong trade ties with both warring countries (Jiang et al. 2020; Berninger et al. 2022; Adekoya et al. 2022). Regarding the BRIC countries, Russia, China, and India are the key players in return spillovers from the commodities and capital markets.
Additionally, it is observed from Figure 6 that all the commodities are net recipients of return spillovers throughout the sample period, but the quantum is less in the case of natural gas. Crude oil and gold are the most impacted commodities from this invasion crisis, and it is supported by the outcomes from past studies (Billah et al. 2021; Chatziantoniou et al. 2022). Contrariwise, except for the US, China, Japan, and Brazil, all the remaining countries are net transmitters of return spillovers; here, France, Germany, the UK, Italy, and India show rocket spikes. Similar findings were proven by (Adams et al. 2015; Boungou and Yatié 2022; Yousaf et al. 2022; Chatziantoniou et al. 2022) during the war and pandemic crisis situations. All markets are either net recipients or transmitters post-wartime, but India is the only country that was initially a net transmitter and at the end of March, it turned into a net recipient market. This is because the Indian market recovered from the shock nearly to its pre-war level. It is evidently important for the investors, hedgers, and diversifiers from the world to capitalize on this finding on the line of (Mirzaei et al. 2021; Bedowska-Sojka et al. 2022; Mohamad 2022) for international investment diversification.
In past studies, (Yoon et al. 2019; Mensi et al. 2022) have suggested that crisis situations place more emphasis on spillovers, which is somehow matched with this research outcome, i.e., the commodities are total positive transmitters, and at the same time, net total spillover is negative. Hence, all the commodities are net recipients from other commodities and markets. Conversely, our empirical results clearly proved that from the sample G7 and BRIC markets, the US, China, Japan, and Brazil are the net recipients, and the remaining markets have transmitted their losses to other markets and commodities. Thus, special attention should be given to France, Germany, UK, Italy, and India, who have shown rocket spikes (Zhang et al. 2020; Cepoi 2020; Boungou and Yatié 2022; Yousaf et al. 2022), which has proven to be similar to findings in the research of past crisis situations.

4.4. Robustness Checks

In this particular section, we performed a few robustness analyses. Along with the TVP-VAR-based connectedness outcomes, we provide 50-day rolling-window VAR and quantile VAR (QVAR) results. Various window sizes happened to be utilized; nevertheless, the 50-observation rolling window revealed close correlations with the TVP-VAR results and is also utilized as a benchmark model in Diebold and Yilmaz (2009, 2012). Given that a VAR model could be determined as an equation-by-equation ordinary least squares (OLS) style, it is a provisional mean-based method and thus is vulnerable to outliers. Suppose we choose each formula by a quantile regression (or the slightest absolute deviation (LAD) regression), in such a case, we concentrate on the conditional median-based computation and can thus probably eliminate the outlier sensitivity issue of the VAR model. Although the dynamics of all three models appear quite comparable, a deeper look discloses that the TVP-VAR model readjusts quicker than its other options, as stressed in Antonakakis et al. (2020) and Korobilis and Yilmaz (2018). This is essential for the forecast of the interconnectedness and thus the risk of the analysed system. This time delay is not too problematic if we only want to track the evolution during the crises. Nevertheless, the outlier sensitivity issue of the VAR model causes inaccurate results, which are more apparent in the Russia–Ukraine war regime.
Figure 7 explains two various sensitivity analyses. Panel A shows the variations in the dynamic total connectedness by readjusting the forecast horizon. We observed that after January 2022, the variations in the measurement enhanced significantly. This could be discussed because the network was more consistent during the Russia–Ukraine war, which showed a boost in its efficiency. Additionally, the variations in the dynamics appeared to smooth out until the completion of the period, which might lead to the switch of the sample markets back to standard time.
Lastly, Panel B shows the variant of the dynamic connectedness when we enabled the decay factor of the variance–covariance to presume various values. Thus, the decay factor of the VAR coefficient was kept constant at 0.99 because it was unconvincing that the connection throughout variables transforms from one day to another by more than 1%. We discovered that the dot grey area showing the variant of the dynamic connectedness by determining various TVP-VAR requirements did not consist of the dynamic connectedness of the VAR and QVAR values. This marks the time delay issue of the rolling-window models again. The VAR model acted significantly dissimilar to the other two models after January 2022, while the QVAR and the TVP-VAR model shared comparable co-movements.
Our robustness results are also consistent, where we found that after January 2022, the variations in the measurement enhanced significantly and the network was more consistent during the Russia–Ukraine war, which shows a boost in its efficiency. Furthermore, the variations in the dynamics appeared to smooth out until the completion of the period, which might lead to the switch of the sample markets back to standard time. The decay factor of the VAR coefficient was kept constant at 0.99 because it was unconvincing that the connection throughout the variables transforms from one day to another by more than 1%.

5. Conclusions, Policy Implications, and Limitations of the Study

This research investigated the effects of the Russian invasion crisis on the dynamic connectedness between five commodities, G7, and BRIC (leading stock) markets. This study contributed many dimensions to the literature on the spillovers of returns and volatility among sample commodities and markets during GPC caused by the Russian attack on Ukraine. More specifically, return spillovers and volatility behaviour were dissimilar in neighbouring markets (EU) and non-neighbouring markets. This study found that due to this invasion crisis, a very strong connectedness among all commodities and markets (G7 and BRIC) exists. Furthermore, the findings display that gold and silver are the receivers from the rest of the commodities and all the sample markets, whereas platinum, natural gas, silver, and crude oil are the transmitters of shocks during this invasion crisis. Except for the US, Canada, China, and Brazil (recipient), all other countries are net transmitters, where European countries have shown large intensity. Some recent studies found in the literature have also supported the current conclusions of this study, such as (Zhang et al. 2020; Cepoi 2020; Boungou and Yatié 2022; Wang et al. 2022; Yousaf et al. 2022; Chatziantoniou et al. 2022). These studies unveil the phenomenon regarding high market contagion in phases of financial crises in the wake of a huge gain in connectedness in several commodities and financial markets. Particularly, during such a war crisis, global uncertainty has increased and influenced the time-varying connectedness patterns between the commodities and capital markets.
Furthermore, the time-varying net connectedness results express strong responsiveness behaviours among all commodities and capital markets, more specifically among EU markets. This study has policy implications that could be beneficial to commodities and stock investor decisions about investments and hedging in such tumultuous situations. Policymakers, institutional investors, bankers, and international organizations are the potential users to make policy decisions. Geopolitical risk level and connectedness amongst sample commodities and markets could be the guiding force for policymakers to understand the level of systematic risk, in light of these links between commodities and their effect on financial markets, and they could be utilized to prepare strategies to diminish the effects of return spillovers between commodities and stock markets in such crises.
This study was conducted in during a specific period and concluded in a short time, which carries some limitations and will set the path for future research. Due to the paucity of time and dynamicity of the environment, this study has some limitations. First, from the BRICS combination, this study drops South Africa because BRIC countries are the top GDP contributor countries among these major emerging economies, while the South African economy (market) is the least integrated with the rest of the world in terms of trade, investments, markets, and commodities flow6 (Waheeduzzaman 2011; Wei et al. 2020; Billah et al. 2021). Second, this study also left out Ukraine and Gulf markets which are the main sources of the commodities, more specifically oil and natural gas. Future research can target these research gaps to give a more robust understanding of this geopolitical crisis. Moreover, further studies can be conducted on sectoral indexes for a wide-ranging investigation of the dynamics of sectoral changes and their risk and returns. However, this study was conducted immediately after the start of the war, and the results are showing short-term consequences; future research might be conducted by taking long-term data sets post-war, which will be useful for diversifiers and hedgers post-war.

Author Contributions

All authors contributed equally to this study. All authors have read and agreed to the published version of the manuscript.

Funding

We have received no funding or any other financial support for the conduct of this research.

Institutional Review Board Statement

Not applicable.

Informed Consent Statement

Not applicable.

Data Availability Statement

Data that support the findings of this study is available on request.

Conflicts of Interest

All the authors declare that we have no potential conflict regarding the conduct of research that may interrupt the publication process.

Notes

1
2
3
According to The Guardian website, on 24 February 2022, Russia launched a full-scale invasion of Ukraine: https://www.jw.org/en/library/series/more-topics/russia-invades-ukraine-bible-meaning-hope/ (accessed on 20 June 2022).
4
5
6

References

  1. Abuzayed, Bana, EElie Bouri, Nedal Al-Fayoumi, and Naji Jalkh. 2021. Systemic risk spillover across global and country stock markets during the COVID-19 pandemic. Economic Analysis and Policy 71: 180–97. [Google Scholar] [CrossRef]
  2. Adams, Zeno, Roland Füss, and Felix Schindler. 2015. The sources of risk spillovers among US REITs: Financial characteristics and regional proximity. Real Estate Economics 43: 67–100. [Google Scholar] [CrossRef]
  3. Adekoya, Oluwasegun Babatunde, Johnson Ayobami Oliyide, OlaOluwa Simon Yaya, and Mamdouh Abdulaziz SalehAl-Faryan. 2022. Does oil connect differently with prominent assets during war? Analysis of intra-day data during the Russia-Ukraine saga. Resources Policy 77: 102728. [Google Scholar] [CrossRef]
  4. Antonakakis, Nikolaos, David Gabauer, Rangan Gupta, and Vasilios Plakandaras. 2018. Dynamic connectedness of uncertainty across developed economies: A time-varying approach. Economics Letters 166: 63–75. [Google Scholar] [CrossRef] [Green Version]
  5. Antonakakis, Nikolaos, Ioannis Chatziantoniou, and David Gabauer. 2020. Refined measures of dynamic connectedness based on time-varying parameter vector autoregressions. Journal of Risk and Financial Management 13: 23. [Google Scholar] [CrossRef]
  6. Aromi, Daniel, and Adam Clements. 2019. Spillovers between the oil sector and the S&P500: The impact of information flow about crude oil. Energy Economics 81: 187–96. [Google Scholar]
  7. Balcilar, Mehmet, David Gabauer, and Zaghum Umar. 2021. Crude oil future contracts and commodity markets: New evidence from a TVP-VAR extended joint connectedness approach. Resource Policy 73: 102219. [Google Scholar] [CrossRef]
  8. Balli, Faruk, Muhammad Abubakr Naeem, Syed Jawad Hussain Shahzad, and Anne de Bruin. 2019. Spillover network of commodity uncertainties. Energy Economics 81: 914–27. [Google Scholar] [CrossRef]
  9. Bedowska-Sojka, Barbara, Ender Demir, and Adam Zaremba. 2022. Hedging Geopolitical Risks with Different Asset Classes: A Focus on the Russian Invasion of Ukraine. Finance Research Letters 50: 103192. [Google Scholar] [CrossRef]
  10. Beitz, Charles R. 1979. Political Theory and International Relations. Cambridge: Cambridge University Press, vol. 13. [Google Scholar]
  11. Belyi, Andrei V. 2016. Limitations of resource determinism in international energy studies. Energy Research & Social Science 12: 1–4. [Google Scholar] [CrossRef]
  12. Berninger, Marc, Florian Kiesel, and Sascha Kolaric. 2022. Should I stay or should I go? Stock Market Reactions to Companies’ Decisions in the Wake of the Russia-Ukraine Conflict. April 20. Available online: https://papers.ssrn.com/sol3/papers.cfm?abstract_id=4088159 (accessed on 20 June 2022).
  13. Billah, Mabruk, Sitara Karim, Muhammad Abubakr Naeem, and Samuel Azhgaliyeva Vigne. 2021. Return and volatility spillovers between energy and BRIC markets: Evidence from quantile connectedness. Research in International Business and Finance 62: 101680. [Google Scholar] [CrossRef]
  14. Boubaker, Sabri, John William Goodell, Dharen Kumar Pandey, and Vineeta Kumari. 2022. Heterogeneous impacts of wars on global equity markets: Evidence from the invasion of Ukraine. Finance Research Letters 48: 102934. [Google Scholar] [CrossRef]
  15. Boungou, Whelsy, and Alhonita Yatié. 2022. The impact of the Ukraine–Russia war on world stock market returns. Economics Letters 215: 110516. [Google Scholar] [CrossRef]
  16. Bouri, Elie, Oguzhan Cepni, David Gabauer, and Rangan Gupta. 2021a. Return connectedness across asset classes around the COVID-19 outbreak. International Review of Financial Analysis 73: 101646. [Google Scholar] [CrossRef]
  17. Bouri, Elie, Xiaojie Lei, Naji Jalkh, Yahua Xu, and Hongwei Zhang. 2021b. Spillovers in higher moments and jumps across US stock and strategic commodity markets. Resources Policy 72: 102060. [Google Scholar] [CrossRef]
  18. Cepoi, Cosmin Octavian. 2020. Asymmetric dependence between stock market returns and news during COVID19 financial turmoil. Finance Research Letters 36: 101658. [Google Scholar] [CrossRef]
  19. Chatziantoniou, Ioannis, Christos Floros, and David Gabauer. 2022. Volatility Contagion Between Crude Oil and G7 Stock Markets in the Light of Trade Wars and COVID-19: A TVP-VAR Extended Joint Connectedness Approach. In Applications in Energy Finance. Cham: Palgrave Macmillan, pp. 145–68. [Google Scholar]
  20. Colgan, Jeff D. 2013. Fueling the fire: Pathways from oil to war. International Security 38: 147–80. [Google Scholar] [CrossRef]
  21. Costola, Michele, and Marco Lorusso. 2022. Spillovers among energy commodities and the Russian stock market. Journal of Commodity Markets, 100249. [Google Scholar] [CrossRef]
  22. Davidson, William H. 1980. The location of foreign direct investment activity: Country characteristics and experience effects. Journal of International Business Studies 11: 9–22. [Google Scholar] [CrossRef]
  23. Deng, Ming, Markus Leippold, Akexander F. Wagner, and Qian Wang. 2022. Stock Prices and the Russia-Ukraine War: Sanctions, Energy and ESG(April 2022). CEPR Discussion Paper No. DP17207. Available online: https://ssrn.com/abstract=4121382 (accessed on 20 June 2022).
  24. Dickey, David A., and Wayne A. Fuller. 1979. Distribution of the Estimators for Autoregressive Time Series With a Unit Root. Journal of the American Statistical Association 74: 427. [Google Scholar] [CrossRef]
  25. Diebold, Francis X., and Kamil Yilmaz. 2009. Measuring financial asset return and volatility spillovers, with application to global equity markets. The Economic Journal 119: 158–71. [Google Scholar] [CrossRef] [Green Version]
  26. Diebold, Francis X., and Kamil Yilmaz. 2012. Better to give than to receive: Predictive directional measurement of volatility spillovers. International Journal of Forecasting 28: 57–66. [Google Scholar] [CrossRef] [Green Version]
  27. Diebold, Francis X., and Kamil Yilmaz. 2014. On the network topology of variance decompositions: Measuring the connectedness of financial firms. Journal of Econometrics 182: 119–34. [Google Scholar] [CrossRef] [Green Version]
  28. Dimitriou, Dimitrios, Dimitris Kenourgios, and Theodore Simos. 2013. Global financial crisis and emerging stock market contagion: A multivariate FIAPARCH–DCC approach. International Review of Financial Analysis 30: 46–56. [Google Scholar] [CrossRef]
  29. Dodd, Olga, Adrian Fernandez-Perez, and Simon Sosvilla-Rivero. 2022. Currency and commodity return relationship under extreme geopolitical risks: Evidence from the invasion of Ukraine. Available online: https://papers.ssrn.com/sol3/papers.cfm?abstract_id=4089030 (accessed on 20 June 2022).
  30. European Central Bank. 2022. Economic, Financial and Monetary Developments. Economic Bulletin Issue 2. Available online: https://www.ecb.europa.eu/pub/economic-bullein/html/eb202202.en.html (accessed on 8 April 2022).
  31. Federle, Jonathan, Andre Meier, Gernot J. Müller, and Victor Sehn. 2022. Proximity to War: The stock market response to the Russian invasion of Ukraine. Available online: https://papers.ssrn.com/sol3/papers.cfm?abstract_id=4121360 (accessed on 20 June 2022).
  32. Gabauer, David, and Rangan Gupta. 2018. On the transmission mechanism of country-specific and international economic uncertainty spillovers: Evidence from a TVP-VAR connectedness decomposition approach. Economics Letters 171: 63–71. [Google Scholar] [CrossRef] [Green Version]
  33. Huynh, Toan Luu Duc, Erik Hille, and Muhammad Ali Nasir. 2020. Diversification in the Age of the 4th Industrial Revolution: The Role of Artificial Intelligence, Green Bonds and Cryptocurrencies. Technological Forecasting and Social Change 159: 120188. [Google Scholar] [CrossRef]
  34. Iqbal, Badar Alam. 2021. BRICS as a Driver of Global Economic Growth and Development. Global Journal of Emerging Market Economies 14: 7–8. [Google Scholar] [CrossRef]
  35. Iqbal, Najaf, Elie Bouri, Oksana Grebinevych, and David Roubaud. 2022. Modelling extreme risk spillovers in the commodity markets around crisis periods including COVID19. Annals of Operations Research, 1–30. [Google Scholar] [CrossRef]
  36. Jiang, Yonghong, Gengyu Tian, and Bin Mo. 2020. Spillover and quantile linkage between oil price shocks and stock returns: New evidence from G7 countries. Financial Innovation 6: 1–26. [Google Scholar] [CrossRef]
  37. Koop, Gary, and Dimitris Korobilis. 2014. A new index of financial conditions. European Economic Review 71: 101–16. [Google Scholar] [CrossRef] [Green Version]
  38. Koop, Gary, Mohammad Hashem Pesaran, and Simon M. Potter. 1996. Impulse response analysis in nonlinear multivariate models. Journal of Econometrics 74: 119–47. [Google Scholar] [CrossRef]
  39. Korobilis, Dimitris, and Kamil Yilmaz. 2018. Measuring Dynamic Connectedness with Large Bayesian VAR Models. Available online: https://papers.ssrn.com/sol3/papers.cfm?abstract_id=3099725 (accessed on 20 June 2022).
  40. Lee, Yusin. 2017. Interdependence, issue importance, and the 2009 Russia-Ukraine gas conflict. Energy Policy 102: 199–209. [Google Scholar] [CrossRef]
  41. Liadze, Iana, Corrado Macchiarelli, Paul Mortimer-Lee, and Patricia Sanchez Juanino. 2022. The Economic Costs of the Russia-Ukraine Conflict. Available online: https://www.niesr.ac.uk/wp-content/uploads/2022/03/PP32-Economic-Costs-Russia-Ukraine.pdf (accessed on 2 March 2022).
  42. Lin, Boqiang, and Tong Su. 2020. Mapping the oil price-stock market nexus research: A scientometric review. International Review of Economics and Finance 67: 133–47. [Google Scholar] [CrossRef]
  43. Mazur, Mieszko, Man Dang, and Miguel Vega. 2020. COVID-19 and the march 2020 stock market crash. Evidence from S&P1500. Finance Research Letters 38: 101690. [Google Scholar] [PubMed]
  44. Mbah, Ruth Endam, and Divine Forcha Wasum. 2022. Russian-Ukraine 2022 War: A Review of the Economic Impact of Russian-Ukraine Crisis on the USA, UK, Canada, and Europe. Advances in Social Sciences Research Journal 9: 144–53. [Google Scholar] [CrossRef]
  45. Mensi, Walid, Imran Yousaf, Xuan Vinh Vo, and Sang Hoon Kang. 2022. Asymmetric spillover and network connectedness between gold, BRENT oil and EU subsector markets. Journal of International Financial Markets, Institutions and Money 76: 101487. [Google Scholar] [CrossRef]
  46. Mirzaei, A., M. Saad, and A. Emrouznejad. 2021. Bank Stock Performance During the COVID-19 Crisis: Does Efficiency Explain Why Islamic Banks Fared Relatively Better? Available online: https://link.springer.com/article/10.1007/s10479-022-04600-y (accessed on 20 June 2022).
  47. Mohamad, Azhar. 2022. Safe flight to which haven when Russia invades Ukraine? A 48-hour story. Economics Letters 216: 110558. [Google Scholar] [CrossRef]
  48. Mokni, Khaled, Mohammed Al-Shboul, and Ata Assaf. 2021. Economic policy uncertainty and dynamic spillover among precious metals under market conditions: Does COVID-19 have any effects? Resources Policy 74: 102238. [Google Scholar] [CrossRef]
  49. Naeem, Muhammad Abubakr, Linh Pham, Arunachalam Senthilkumar, and Sitara Karim. 2022. Oil shocks and BRIC markets: Evidence from extreme quantile approach. Energy Economics 108: 105932. [Google Scholar] [CrossRef]
  50. Orhan, Ebru. 2022. The Effects of the Russia-Ukraine War on Global Trade. Journal of International Trade, Logistics and Law 8: 141. [Google Scholar]
  51. Papathanasiou, Spyros, Dimitrios Vasiliou, Anastasios Magoutas, and Drosos Koutsokostas. 2021. Do hedge and merger arbitrage funds actually hedge? A time-varying volatility spillover approach. Finance Research Letters 44: 102088. [Google Scholar] [CrossRef]
  52. Peng, Qing, Fenghua Wen, and Xu Gong. 2021. Time-dependent intrinsic correlation analysis of crude oil and the US dollar based on CEEMDAN. International Journal of Finance and Economics 26: 834–48. [Google Scholar] [CrossRef]
  53. Pesaran, H. Hashem, and Yongcheol Shin. 1998. Generalized impulse response analysis in linear multivariate models. Economics Letters 58: 17–29. [Google Scholar] [CrossRef]
  54. Pfeffer, Jeffrey, and Gerald R. Salancik. 2003. The External Control of Organizations: A Resource Dependence Perspective. Stanford: Stanford University Press. [Google Scholar]
  55. Phillips, Peter, and Pierre Perron. 1988. Testing for a unit root in time series regression. Biometrika 75: 335–46. [Google Scholar] [CrossRef]
  56. Radulescu, Irina Gabriela, Mirela Panaita, and Catalin Voica. 2014. BRICS countries challenge to the world economy new trends. Procedia Economics and Finance 8: 605–13. [Google Scholar] [CrossRef] [Green Version]
  57. Reuveny, Rafael, and Katherine Barbieri. 2014. On the effect of natural resources on interstate war. Progress in Physical Geography 38: 786–806. [Google Scholar] [CrossRef]
  58. Saâdaoui, Foued Saâdaoui, Sami Ben Jabeur, and John W. Goodell. 2022. Causality of geopolitical risk on food prices: Considering the Russo–Ukrainian conflict. Finance Research Letters 49: 103103. [Google Scholar] [CrossRef]
  59. Sauvant, Karl P. 2005. New sources of FDI: The BRICs-outward FDI from Brazil, Russia, India and China. Journal World Investment & Trade 6: 639. [Google Scholar]
  60. Schiffling, S., and N. Valantasis Kanellos. 2022. Five Essential Commodities That Will Be Hit by War in Ukraine. The Conversation. Available online: https://researchonline.ljmu.ac.uk/id/eprint/16422/1/Five%20essential%20commodities%20that%20will%20be%20hit%20by%20war%20in%20Ukraine.pdf (accessed on 20 June 2022).
  61. Selznick, Philip. 1949. TVA and the Grass Roots: A Study of Politics and Organization. Berkley: University of California Press, vol. 3. [Google Scholar]
  62. Sharif, Arshian, Chaker Aloui, and Yarovaya Larisa. 2020. COVID-19 pandemic, oil prices, stock market, geopolitical risk and policy uncertainty nexus in the US economy: Fresh evidence from the wavelet-based approach. International Review of Financial Analysis 70: 101496. [Google Scholar] [CrossRef]
  63. Shahzad, Syed Jawad Hussain, Elie Bouri, David Roubaud, Ladislav Kristoufek, and Brian Lucey. 2019. Is Bitcoin a better safe-haven investment than gold and commodities? International Review of Financial Analysis 63: 322–30. [Google Scholar] [CrossRef]
  64. Sher, Leo. 2020. The impact of the COVID-19 pandemic on suicide rates. QJM: An International Journal of Medicine 113: 707–12. [Google Scholar] [CrossRef] [PubMed]
  65. Siddiqui, Kalim. 2016. Will the growth of the BRICs cause a shift in the global balance of economic power in the 21st century? International Journal of Political Economy 45: 315–38. [Google Scholar] [CrossRef]
  66. Singhania, Monika, and Neha Saini. 2018. Determinants of FPI in developed and developing countries. Global Business Review 19: 187–213. [Google Scholar] [CrossRef]
  67. Sprout, Harold, and Margaret Sprout. 1957. Environmental factors in the study of international politics. Journal of Conflict Resolution 1: 309–28. [Google Scholar] [CrossRef]
  68. Stulberg, Adam N. 2017. Natural gas and the Russia-Ukraine crisis: Strategic restraint and the emerging Europe-Eurasia gas network. Energy Research & Social Science 24: 71–85. [Google Scholar] [CrossRef]
  69. Tosun, Onur Kemal, and Arman Eshraghi. 2022. Corporate decisions in times of war: Evidence from the Russia-Ukraine Conflict. Finance Research Letters 48: 102920. [Google Scholar] [CrossRef]
  70. Umar, Zaghum, Mariya Gubareva, and Tamara Teplova. 2021. The impact of Covid-19 on commodity markets volatility: Analyzing time-frequency relations between commodity prices and coronavirus panic levels. Resources Policy 73: 102164. [Google Scholar] [CrossRef]
  71. Umar, Zaghum, Ahmed Bossman, Sun-Yong Choi, and Tamara Teplova. 2022a. Does geopolitical risk matter for global asset returns? Evidence from quantile-on-quantile regression. Finance Research Letters 48: 102991. [Google Scholar] [CrossRef]
  72. Umar, Zaghum, Onur Polat, Sun-Yong Choi, and Tamara Teplova. 2022b. The impact of the Russia-Ukraine conflict on the connectedness of financial markets. Finance Research Letters 48: 102976. [Google Scholar] [CrossRef]
  73. Van Bergeijk, Peter. 1995. The impact of economic sanctions in the 1990s. The World Economy 18: 443–55. [Google Scholar] [CrossRef]
  74. Van de Graaf, Thijs, and Jeff D. Colgan. 2017. Russian gas games or well-oiled conflict? Energy security and the 2014 Ukraine crisis. Energy Research & Social Science 24: 59–64. [Google Scholar] [CrossRef] [Green Version]
  75. Waheeduzzaman, A. N. M. 2011. Competitiveness and convergence in G7 and emerging markets. Competitiveness Review: An International Business Journal 21: 110–28. [Google Scholar] [CrossRef]
  76. Wang, Yihan, Elie Bouri, Zeeshan Fareed, and Yuhui Dai. 2022. Geopolitical risk and the systemic risk in the commodity markets under the war in Ukraine. Finance Research Letters 49: 103066. [Google Scholar] [CrossRef]
  77. Wei, Hua, Syed Kumail Abbas Rizvi, Ferhana Ahmad, and Yuchen Zhang. 2020. Resource cursed or resource blessed? The role of investment and energy prices in G7 countries. Resources Policy 67: 101663. [Google Scholar] [CrossRef]
  78. Wen, Fenghua, Longhao Xu, Guangda Ouyang, and Gang Kou. 2019. Retail investor attention and stock price crash risk: Evidence from China. International Review of Financial Analysis 65: 101376. [Google Scholar] [CrossRef]
  79. Wen, Fenghua, Yujie Yuan, and Wei-Xing Zhou. 2020a. Cross-shareholding networks and stock price synchronicity: Evidence from China. International Journal of Finance & Economics 26: 914–48. [Google Scholar]
  80. Wen, Fenghua, Cui Li, Han Sha, and Liuguo Shao. 2020b. How does economic policy uncertainty affect corporate risk-taking? Evidence from China. Finance Research Letters 41: 101840. [Google Scholar] [CrossRef]
  81. World Bank. 2022. Global Growth to Slow through 2023, Adding to Risk of ‘Hard Landing’ in Developing Economies. Report. Available online: https://www.worldbank.org/en/news/press-release/2022/01/11/global-recovery-economics-debt-commodity-inequality (accessed on 20 June 2022).
  82. Yoon, Seong-Min, Md Al Mamun, Gazi Salah Uddin, and Sang Hoon Kang. 2019. Network connectedness and net spillover between financial and commodity markets. The North American Journal of Economics and Finance 48: 801–18. [Google Scholar] [CrossRef]
  83. Yousaf, Imran, Ritesh Patel, and Larisa Yarovaya. 2022. The Reaction of G20+ Stock Markets to the Russia-Ukraine Conflict ‘Black-Swan’ Event: Evidence from Event Study Approach. March 29. Available online: https://ssrn.com/abstract=4069555 (accessed on 20 June 2022).
  84. Zhang, Dayong, Min Hu, and Qiang Ji. 2020. Financial markets under the global pandemic of COVID-19. Finance Research Letters 36: 101528. [Google Scholar] [CrossRef]
  85. Zhang, Hua, Jinyu Chen, and Liuguo Shao. 2021. Dynamic spillovers between energy and stock markets and their implications in the context of COVID-19. International Review of Financial Analysis 77: 101828. [Google Scholar] [CrossRef]
Figure 1. Evolution of five commodities, G7, and BRIC indices from 9 January 2021 to 15 March 2022.
Jrfm 15 00352 g001
Figure 2. Network connectedness spillovers between the five commodities, G7, and BRIC markets. Additionally, within the network, the size of the node indicates the magnitude of the contribution of every index to the connectivity of the system, while the colour indicates the origin of the connectivity. The size of the node indicates the level of overflow, and the colour determines whether the market is a net sender (green) or a recipient (pink) of spillover. The finite directional layout algorithm determines the position of the vertices, with the number of vectors determining the route of the vertices. The width of the arrow indicates the strength of the multiple gradients, and the colour determines the direction of the gradient from the strongest (red) to the weakest (black). Note: The outcomes are constructed on a first-order TVP-VAR model with a first-order delay length and a 20-level generalized forecast error variance within the estimates. (a) Pre-Russian invasion of Ukraine. (b) During Russian invasion of Ukraine.
Jrfm 15 00352 g002
Figure 3. Total time-varying spillovers between five commodities, G7, and BRIC indices. Note: See Figure 2.
Jrfm 15 00352 g003
Figure 4. Total return spillovers “TO” others. Note: See Figure 2.
Jrfm 15 00352 g004
Figure 5. Total return spillovers “FROM” others. Note: See Figure 2.
Jrfm 15 00352 g005
Figure 6. Net total return spillovers between Five commodities, G7, and BRIC markets. Note: See Figure 2.
Jrfm 15 00352 g006
Figure 7. Sensitivity analyses. Note: Panel (A): different forecast horizons are used [5, 15, 25, 35, 45]. Panel (B): κ1 = [0.95,0.96, 0.97, 0.98, 0.99] and κ2 = 0.99. Panel (A): Forecast Horizon Sensitivity Analysis. Panel (B): Decay Factor Sensitivity Analysis.
Jrfm 15 00352 g007
Table 1. Summary statistics of daily returns of five commodities, G7, and BRIC markets.
Commodities and Stock MarketsMeanStd. Dev.SkewnessKurtosisJBADFPP
Gold0.0010.008−0.4773.7288.34 ***−26.01 ***−25.58 ***
Silver0.0010.016−0.3953.8067.38 ***−17.34 ***−17.40 ***
Platinum0.0010.0170.3233.6855.13 ***−16.04 ***−16.06 ***
WTI Crude Oil0.0040.023−0.6858.375178.17 ***−19.66 ***−19.72 ***
Natural Gas0.0010.0580.5595.96057.96 ***−16.76 ***−16.93 ***
Canada0.0010.010−0.2914.0187.97 ***−23.75 ***−24.80 ***
France−0.0010.014−0.9876.57396.50 ***−17.83 ***−18.98 ***
Germany−0.0020.015−0.6187.370119.45 ***−19.66 ***−18.76 ***
Italy−0.0020.024−2.52132.5645209.36 ***−25.55 ***−24.57 ***
Japan−0.0010.011−0.3253.3263061.89 ***−13.04 ***−13.03 ***
UK−0.0020.024−5.77058.84318,832.04 ***−15.27 ***−16.18 ***
US−0.0010.011−0.2583.1681703.51 ***−11.49 ***−11.46 ***
Brazil−0.0010.017−0.3083.1732369.90 ***−12.32 ***−12.35 ***
Russia−0.0090.065−3.91828.7924208.21 ***−18.93 ***−18.65 ***
India−0.0010.016−2.90220.2001908.44 ***−11.29 ***−11.29 ***
China−0.0020.019−1.62914.153781.84 ***−15.21 ***−15.22 ***
Note: The above table illustrates the descriptive statistics for five commodities, G7 and BRIC markets (gold, silver, platinum, WTI Crude Oil, natural gas, Canada, France, Germany, Italy, Japan, UK, US, Brazil, Russia, India, and China). The period was selected daily from 1 September 2021 to 15 March 2022. Moreover, Std. Dev., JB, ADF, and PP represent standard deviations, Jarque-Bera, Augmented Dickey and Fuller, and Phillip and Perron, respectively, with superiors signifying *** p < 0.01.
Publisher’s Note: MDPI stays neutral with regard to jurisdictional claims in published maps and institutional affiliations.

