Article

Global Top E-Commerce Companies: Transparency Analysis Based on Annual Reports

1
Faculty of Law and Administrative Sciences, Stefan cel Mare University, Universitatii 13, 720229 Suceava, Romania
2
Academy of Economic Studies of Moldova, 61 Mitropolit Gavriil Banulescu-Bodoni, 2005 Chisinau, Moldova
3
Faculty of Economics and Business Administration, Alexandru Ioan Cuza University of Iasi, 11 Carol I, 700506 Iaşi, Romania
*
Author to whom correspondence should be addressed.
J. Risk Financial Manag. 2022, 15(7), 313; https://doi.org/10.3390/jrfm15070313
Submission received: 10 June 2022 / Revised: 7 July 2022 / Accepted: 13 July 2022 / Published: 17 July 2022
(This article belongs to the Special Issue Advances in Corporate Governance, Accounting and Financial Management)

Abstract

:
This paper analyzes the transparency of reporting in e-commerce companies, which has a high impact on decision making. Stakeholders make sure that companies are as transparent as possible in their actions, and the information disclosed in annual reports is very credible. In this context, the highly asked for information refers to the structure of corporate governance, the activity of committees set by the board of directors, managerial strategies, human resource and sustainability policies, risks, financial reporting, financial and non-financial performance, etc. To test and validate the results of our research, we identified the 31 most efficient global e-commerce companies. For this purpose, 31 annual corporate reports were analyzed for 2019 and 2020 by extracting several independent variables: corporate governance, human resource policies, sustainable development, performance, risks and financial reporting. The results of the analysis were validated by using SmartPLS (v. 3.3.3) software.

1. Introduction

Information has been viewed lately as a resource or value required in decision making by internal (employees, management, unions) and external stakeholders (shareholders, investors, suppliers, local community, etc.). Considering the importance and value of information, it is evident that it should be transparent and objective to become credible for the stakeholders. Additionally, transparent, objective and conclusive information included in company reports could be seen as an element of marketing, which could create a good impression about a company in society. This is the reason why it is essential that the information disclosed by companies in different reports (financial, social responsibility, environmental) should be transparent, irrespective of its nature.
Since the more transparency there is, the better, we need to investigate whether high transparency should be expected from companies. So, transparency is needed for company operations, whether in terms of its strategy, leadership or corporate governance (Janning et al. 2020). By reviewing the literature in the field on organizational transparency, we found that Schnackenberg and Tomlinson (2016) had shown that a useful definition of the concept should be broad, theoretical and also quite specific to become informative for the managerial practice. The authors argued that most definitions of transparency in this context require a disclosure of information about data, forecasting, prices, offers, decisions and reports on assets. They also stress the salience of the quality of information as a perceived feature of transparency, and socially, higher transparency could develop corporate coherence as a standard, being beneficial as a regulator of social behavior. Transparency is often erroneously replaced by such terms as disclosure or reporting, affecting its meaning (Baraibar-Diez et al. 2015).
The degree of company transparency cannot be directly measured but could be perceived through the degree of corporate social responsibility (CSR) disclosure by the stakeholders (López-Arceiz et al. 2017).
The study of these issues began with the analysis of the transparency notion from both the perspective of researchers and that of the regulatory framework. The authors used the main categories of information found in the annual reports referring to: corporate governance, managerial strategies, human resources, financial and non-financial resources, financial reporting. Additionally, the theoretical grounding was validated using the information provided by the e-commerce companies in their reports.

2. Literature Review

Transparency is needed in the disclosure of both financial and non-financial information. So, both non-financial and financial information is relevant for any company’s decision making. In 1994, The American Institute of Chartered Public Accountants set up a financial reporting committee (The Jenkins Committee) that recommended the use of non-financial information. Additionally, the European Union issued a directive on the disclosure of non-financial information and diversity that became effective in 2017. The Directive’s goal is to lay the foundation of a new corporate reporting model that supplements financial transparency with environmental and social information needed to understand the company’s development, performance and standing, as well as the impact of its activities on society (Bold 2017). In line with this Directive, the information on non-financial performance comprises environmental, social and human rights issues, employee-related problems, issues related to fight against corruption and bribery, supply chains and diversity (only for companies listed on the stock exchange).
Stakeholders’ need for transparency has been increasing, corporate governance failing to understand or meet such needs adequately. In this sense, corporate governance should try to meet the transparency requirements, considering that having an understanding of any company’s governance structure is useful when the quality of information is assessed, also being used as a guideline for stakeholders enabling them to have more specific expectations regarding future performance (Bhat et al. 2006). Corporate governance is a set of “rules of the game” by means of which companies are managed internally and supervised by the board of directors so as to protect the interests of all stakeholders (Feleagă et al. 2011).
Corporate governance is defined as a set of relationships developed between the company management, in the broader sense, and all its stakeholders, its principles aiming to help decision makers assess and develop legal regulatory and institutional framework for corporate governance with the purpose of supporting economic efficiency, sustainable growth and financial stability (OECD 2004). So, the principles of corporate governance are a set of guidelines, a set of good practice rules for company operations and their relationships with third parties. Therefore, corporate governance framework should ensure a timely and accurate disclosure of all key company-related information, including its financial situation, performance, property and management (OECD 2015).
Since its appearance, researchers have studied and provided in-depth analysis of several aspects of corporate governance. These researchers analyzed:
In their reporting process, companies should submit a huge volume of information referring both to corporate governance and other company operations, such as: managerial strategies, financial situations, human resources, sustainable development and organizational performance.
A strategy is a clearly formulated action undertaken by managers to reach one or several organizational goals. Accordingly, strategic management comprises the activities of identifying and describing strategies that managers could use to achieve higher performance and competitive advantage for their companies. By reviewing the literature, we found that several authors have been interested in researching the implementation of strategic management in companies (Pearce and Robinson 2011; Furrer et al. 2008; Ansoff et al. 2019). Other authors looked into the process of strategy implementation, including the factors and barriers influencing it (Kaplan and Norton 2006; Helfat and Martin 2015; Radomska 2014). Additionally, there have been studies researching the involvement of the board of directors in the process of company strategy implementation (Fiegener 2005; Ruigrok et al. 2006; Brauer and Schmidt 2008). The ”involvement” of the board of directors in strategy implementation was studied in terms of its influence (Ford 1988; Li and Yang 2019), frequency of its interactions (Sapienza and Gupta 1994), effort and usefulness (Rosenstein et al. 1993; Park et al. 2018).
Financial reports are also another area of annual reporting found in the research. Under IFRS 1, the financial statements shall present fairly the entity’s financial position, financial performance and cash flows. Fair presentation requires accurate representation of the effects of transactions, other events and conditions, in accordance with the definitions and recognition criteria for assets, liabilities, income and expense set out in the framework. It is assumed that the application of IFRSs, with additional information presented when necessary, results in financial statements that present a true and fair view (IFRS 2001). Needles and Powers (2007) state that financial statements connected with ownership transactions present the financial position from the view of capital maintenance, going concern, efficiency, liquidity, and they are very important for stakeholders, such as business partners, investors, etc. Additionally, users of financial statements consider corporate reputation as important in assessing the quality of financial statements (Francis et al. 2008).
A number of previous studies have been conducted related to the quality of financial statement disclosures (Chiu and Wang 2015; Scaltrito 2015; Easley 2010; Valaskova et al. 2021). Studies of the information disclosure influence on company results provided final, reasoned conclusions, and to date, there has been no consensus reached about the factors determining a voluntary disclosure (Prince and Dwivedi 2013).
The annual reports also include information on human resources. Human resources reporting comprises the main and specific information on company’s employees, providing a general overview on the activities of human resources and their performance. The human resources reporting system is an integral part of any annual report, as the employees are seen as the most active part of a company. In fact, a well-structured and operational HR system is used as a support in employment, training, performance management, management of employee information and HR event organization. Consequently, the concern of researchers about the content of human resource reporting is not surprising.
The information on human resources is important both for investors and employees of corporations, as well as for the society overall (Choi and Mueller 1992). The authors argue that investors are interested in having access to human resources information, as they want to be sure that the labor force is efficiently managed and used, and their investment will be able to generate good profit. Similarly, employees and other stakeholders want to make sure that the company’s human assets are developed, which leads to a higher level of employment security and payment. Society is interested in human resources information, as it expects companies to develop the employment opportunities for the growing workforce, especially for women and minorities.
Several studies investigate various aspects of human resources in annual reports. For instance, Subba and Zeghal (1997) used content analysis as a research method to investigate 120 annual reports of companies in the USA, Canada, Great Britain, Germany, Japan and South Korea, which were produced between 1993 and 1994. The authors investigated the training, the added value, the fairness, the relations among the employees and the rewards. Birca (2018) analyzed the disclosure of information regarding human resources in the annual reports of 40 biggest companies listed on the Paris Stock Exchange. The study included the human resource sections in the annual reports. The first section comprised the information regarding the rights of employees (the employee code of ethics, compliance with employee human rights, support for diversity, cultural and gender diversity, people with special needs). The second section included the information referring to the organization of work and health of employees (permanent and temporary workers, full and part-time workers, organization of work, well-being of employees, employee health and security). The third section generally included information referring to social commitment (training, talent management, career development, employee compensation, employee rewards and appreciation).
From the accounting perspective, we operate with the notion of human capital, its measurement having proved to be quite a challenge for many researchers (McCracken et al. 2018). A human capital refers to a set of factors related to individuals and to a collective labor force of a company (Abeysekera and Guthrie 2004). Some authors argued that lack of internationally recognized accounting standards for the disclosure of human capital has undermined the credibility of corporate accounting reports (Khan and Khan 2010).
More recently, the importance of human resource reporting has been outlined in a study on responsible innovation (Scherer and Voegtlin 2020). The authors state that the big challenges the humanity has been facing comprise poverty, inequality, famine, conflicts, climate change, deforestation, the pandemic affecting the progress of sustainable development. These issues could be approached only through fundamental changes in behavior and in the way the production and business processes occur, in general (Scherer and Voegtlin 2020). Moreover, Grove et al. (2021) recommended to boards of directors that the annual reports comprising human resources should be produced, considering the UN’s sustainable development objectives of leading companies toward a sustainable future.
The next element of corporate reporting refers to sustainable development. Companies use various terms for their sustainable development activities: “sustainability”, “corporate responsibility”, “sustainable development”, “corporate social responsibility”. Corporate sustainability was defined as meeting the needs of the company’s direct or indirect stakeholders without compromising the company’s capacity to meet the future needs of stakeholders (Dyllick and Hockerts 2002). As companies do not operate in isolation but interact with the stakeholders, sustainable development issues have become one of their major concerns.
On the other hand, Herzig and Schaltegger (2006) argue that through sustainable development reporting, companies aim to reach their specific objectives and gain benefits related to the legitimization of corporate operations where products and services have an impact on the environment and society, growth of corporate reputation and value of work, competitive advantage acquisition, signaling the superior competitiveness by reporting sustainability as a proxy indicator of general performance; growth of transparency and liability within a company; setting and supporting the employee motivation, as well as the internal processes of information and control. A company reporting on its sustainable development comprises a wide range of information that should be organized in a specific way.
In this context, Siew (2015) analyzed the framework, the standards, the indices and the assessments needed to disclose and report information. Considering the diversity of issues that are not part of sustainable development, the researchers analyzed its various aspects, such as the environmental management (Onkila 2009), the regulation of the environment (Céspedes-Lorente et al. 2004), the environmental protection (King 2007), the concern of stakeholders over sustainable development (Bradford et al. 2017), the effects of pressure of stakeholders on the transparency of sustainability reports (Manetti and Toccafondi 2012; Fernandez-Feijoo et al. 2014), client relations as the principal stakeholder influencing the company’s sustainable development. The study of Theyel and Hofmann (2012) showed that sustainable development practices adopted by most of the studied companies were influenced mainly by clients, employees and suppliers.
Barkemeyer et al. (2014) analyzed the statements of executive directors in sustainability and corporate financial reports and found that “sustainability reporting failed to reach maturity over the studied period [2001–2010], and the rhetoric used in the CEO Statement of sustainability reports is more in line with management impression than commitment to sustainability.” Furthermore, Nielsen and Thomsen (2007) suggest that corporate sustainability is based on the personal values of managers.
While some authors studied the impact of sustainability corporate reporting on company performance, finding that it was positive and significant (Burhan and Rahmanti 2012; Tracy et al. 2010; Jones et al. 2007), others investigated its impact on financial performance (Oncioiu Holban et al. 2010; McWilliams and Siegel 2000; Hategan et al. 2018).
Financial performance itself is a behavior that is broadly presented in the process of corporate reporting. There have been several in-depth studies on this topic (Van Horne and Wachowicz 2005; Lasher 2014; Brigham and Daves 2007; Arnold and Lewis 2019). Financial performance is expressed by a multitude of indices used by corporations. While some authors studied conventional indices, describing such financial performance indicators as income growth, earnings before interest and taxes EBIT (Fernandes et al. 2006), gross and net operational profit (Edwards 2016; Beuren et al. 2008), liquidity and profitability indices (Beuren et al. 2008; Eljelly 2004; Goldmann 2016), others analyzed the correlation between financial performance and corporate social responsibility (McWilliams and Siegel 2000; Cochran and Wood 1984; Aras et al. 2010), corporate environment (Moneva and Ortas 2010), environmental performance (Nakao et al. 2006; Iwata and Okada 2011; Alexopoulos et al. 2018), environmental disclosures (Stanwick and Stanwick 2000; Qiu et al. 2016), environmental policies (Elsayed and Paton 2009; De Burgos-Jiménez et al. 2013).
Non-financial performance could also be found in corporate annual reporting. In this context, reference is made to the non-financial performance indices and measures undertaken by companies for their improvement. In the European Union, the Directive 2014/95/EU on non-financial information set the goal of increasing the coherence and comparability of non-financial information and the need for a concise and standardized index (EU 2014). Authors studied non-financial performance by analyzing the use of non-financial performance indicators in reporting (Goram et al. 2011; Raucci et al. 2020), the non-financial performance measures adopted by companies (Abdel-Maksoud et al. 2005; Fullerton and Wempe 2009), the non-financial performance measures and the future value of a company (Gan et al. 2020), the relationship between the disclosure of non-financial performance measures and corporate financial performance (Omran et al. 2020).
Consequently, annual reports are among the main tools used by researchers in examining any company’s transparency, as well as a tool used by companies to present their main performance over a specific reporting period. The theoretical framework presented above will be verified by the research methodology employed.

3. Methods

The earlier discussed company transparency is tested and validated, considering the nature of information found in the annual reports. The selected sample comprises the most profitable global companies, and its final size is the result of some stages. Initially, the following top international rankings were consulted: 10 World’s Biggest E-commerce Companies, Ecommerce Stocks List Euronext EU 2021, Top eCommerce Platforms online. Further, the annual reports of the entities included in these top rankings were uploaded from their website. In the qualitative data analysis process, the sample kept the entities whose reports complied with the following conditions: can be directly downloaded from the company’s website; 2019 and 2020 reports are available; contain complete information, specific to an annual report, in order to be sufficiently comparable (Table A1, Appendix A).
The empirical analysis of transparency of e-commerce companies was studied in terms of the quality of information included in the annual reports referring to corporate governance, human resources development policies, sustainable development, performance, risks and financial reporting. For this purpose, four research hypotheses were formulated:
-
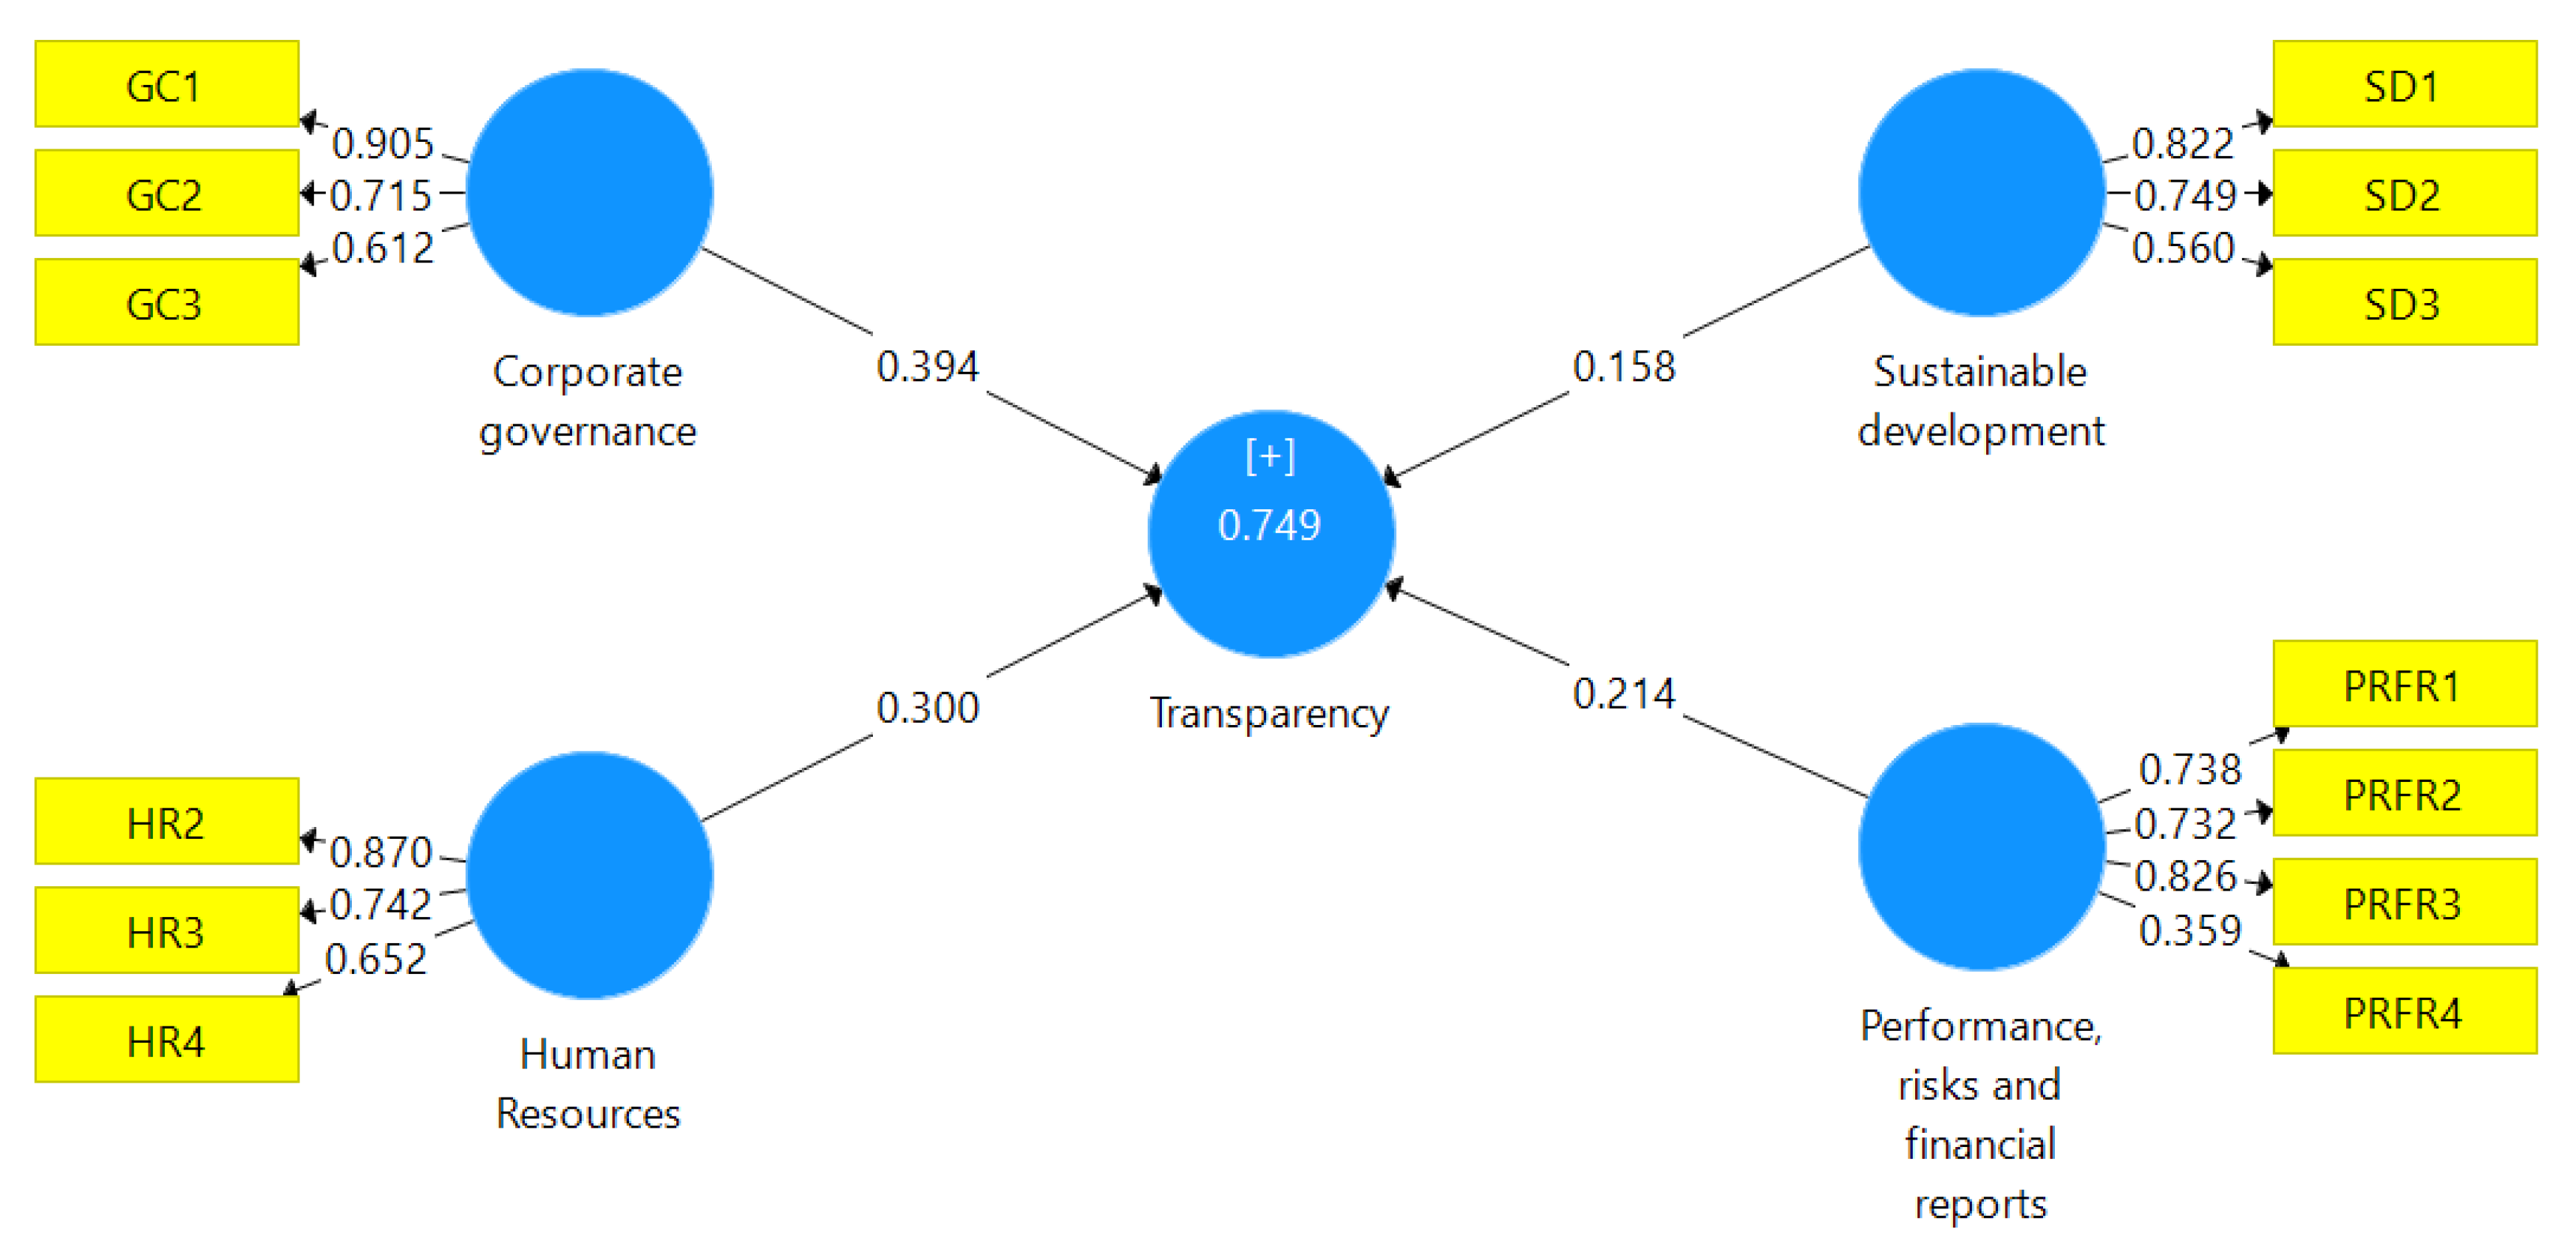
H1: the structure of corporate governance has a significant influence on company transparency;
-
H2: the content of human resource policies has a positive impact on the level of company transparency;
-
H3: there is a direct proportional ratio between the degree of company transparency and sustainable development policies;
-
H4: the accounting and risk management policies, as well as the system of performance appraisal, have a significant impact on company transparency in its decision-making process.
Testing and validation of the research hypotheses was conducted using the categories mentioned in Table 1, and the relationships between the constructs are shown in Figure 1.
We applied structural equation modeling based on partial least-square for testing the relationship between the constructs. The SEM method implies the design of two models: first, the measurement model that consists of the observable (measurement) variables that are linked to latent variables (constructs); second, the structural model that assesses the correlation and the influence of the relationship among the latent variables. The constructs should be reflected by reliable and valid indicators. The structural model computes the path coefficients that assess the correlation between the constructs (Hair et al. 2013, 2014). The SmartPLS (v. 3.3.3) software (Ringle et al. 2015) was used for data treatment.
The constructs (listed using Roman numerals) that define company transparency and the observable variables (listed using Arabic numerals) corresponding to each construct are shown in Table 1.

4. Results

The values of the convergent reliability and validity indicators show a high degree of consistency of the items (Table 2).
The measurement model is valid and reliable, as indicated by these results: Cronbach’s alpha > 0.6, AVE—average variance extracted > 0.5 and CR—composite reliability > 0.7.
Three out of four path coefficients are significant (Table 3). Thus, there are significant relationships between the constructs of transparency of e-commerce companies considered in this study.
The results of this study on transparency and reporting of e-commerce companies confirm that three out of four research hypotheses are validated.
H1. 
The structure of corporate governance has a significant influence on company transparency. The path coefficient “CG Transparency” equal to 0.394 shows that corporate governance is explained by corporate governance structure, management strategies and advisory committees of the Board of Directors. It can be noticed that the structure of corporate governance has a positive effect on Transparency. Thus, the first hypothesis of the study is supported by data.
H2. 
The content of human resource policies has a positive impact on the level of company transparency. The path coefficient “HR Transparency” equal to 0.300 shows that human resources have an impact on Transparency of e-commerce companies. Therefore, the results show a strong support for the second hypothesis. There is a positive and significant effect of Human Resources on Transparency.
H3. 
There is a direct proportional ratio between the degree of company transparency and sustainable development policies. The path coefficient SD Transparency equal to 0.158 shows a weak impact of sustainable development policies on Transparency of e-commerce companies. Therefore, the third research hypothesis is not validated.
H4. 
The accounting and risk management policies, as well as the system of performance appraisal, have a significant impact on company transparency in its decision-making process. The path coefficient “PFS Transparency” with a value of 0.214 shows that performance and financial situation have a positive effect on Transparency. Consequently, the fourth hypothesis of our study is validated.
Figure 1 shows the coefficients of the structural equation model using PLS analysis.
The values of the path coefficients presented both in Table 3 and Figure 1 are higher than 0.1 (Lohmöller 1989). We can conclude that the transparency of e-commerce companies has multiple determinants that act with various intensity.

5. Discussion

The analysis of factors influencing the transparency of e-commerce companies demonstrates both theoretically and practically its importance in the decision-making process. Its complexity is determined by the influence of several factors. The coefficient of 0.749 in Figure 1 indicates that in addition to corporate governance, human resources, risk management and performance and accounting appraisal policies, several other factors have an influence on transparency, which were not included in the econometric model.
H1. Corporate governance (CG). Statistically, H1 hypothesis validation also requires testing the intensity of dependence between the dependent variable and the three specific items (CG1, CG2, CG3) seen as independent variables. The study results show that the structure of corporate governance is the factor with the most significant influence on transparency. All analyzed annual reports contained information referring to the structure of the management team, although an organizational chart was included only in 52% and 48% of the annual reports in 2019 and 2020, respectively. A high number of reports underline sustainable development goals and change of priorities through a transfer from shareholders to stakeholders. So, the first factor (CG1—0.905), the corporate governance structure, has the highest share with a significant influence on company transparency.
Managerial strategies (CG2—0.715) are another element of corporate governance with a significant influence on company transparency. A significant number of companies, 42% (2020), promote the development of long-term sustainable strategies by also including factors of macroeconomic nature. For instance, Prosus focuses on the creation of sustainable value by building and investing in high-growth businesses, while Rakuten concentrates on strategies aimed at contributing to society through empowerment (growing with our employees, providing sustainable platforms, addressing global challenges).
The second factor of corporate governance (CG3) refers to Board Committees attached to the board of directors. Their structure and name vary from one company to another. Therefore, 39% of companies in 2019 and 58 % in 2020 had a complex structure of the Audit Committee, Finance and Investment Policy Committee, Nomination and Remuneration Committee, Nominating and Corporate Governance Committee, Sustainability Committee, Compensation Policies under the Companies Law, Risk committee, etc. A simpler structure of committees involves two levels, for example, the Supervisory Board and the Management Board. However, there is a category of companies, which did not include information on committees, namely, 42% in 2019 and 35% in 2020.
H2. Human Resources (HR). Human resource policies also have a significant influence on company transparency, considering their coefficient of 0.3 (Figure 1). Although the number of employees (HR1) was not included in the econometric model, we want to show that it is not a variable that directly influences the size of benefits of e-commerce companies. Thus, the most profitable companies in 2020 could be ranked by the number of employees, as follows:
  • 40–250 (Xplora Tech AS, Delticom, Smartphoto Group)—10%;
  • 250–5000 (Alumex PLC, Cnova, Rakuten, Wix)—13%;
  • 5000–50,000 (Shopify, Pinduoduo, Prosus, Ebay, Zalando, Smurfit Kappa Gp, Otto Group)—23%;
  • 50,000–500,000 (Meituan, Best buy, Apple, Alibaba Group Holding Limited, Costco, Jingdon, Target, Kroger)—26%;
  • 500,000–2,200,000 (BigCommerce, Amazon, Walmart)—10%.
As can be noted, the number of employees varies significantly from one company to another. So, the lowest and the highest number of the five categories reflects the real number of employees: 40—Xplora Tech AS and Walmart—2,200,000. The other categories were established considering real data, and we may observe that the most common number of employees, 48%, ranges between 5000 and 500,000. There is also a category of companies, 18%, which did not include information on the number of employees, or such data were not included in the annual reports on the website for the year 2020.
Reward policies (HR2—0.870), innovations and initiatives (HR3—0.742) and professional experience of top managers (HR4—0.652) are the main variables characterizing the strategies of e-commerce companies in managing human resources. Data in Figure 1 help us observe the significant influence of personnel reward policies on company transparency. In this context, 32% of companies included detailed information on the salaries of top management in 2020 and 23% regarding their professional experience. All companies included in the study stressed the promotion of innovation, only 19% of them promoting active policies of talent development.
H3. Sustainable development (SD). Sustainable development (SD—0.158) is the third factor of the econometric model, although the results in Figure 1 support its insignificant influence on the information comprised in the annual reports of e-commerce companies. Business overview (SD1—0.822) is the variable with the most significant influence, only 45% of companies focusing on sustainable development. Thus, the most frequent categories out of business categories or e-commerce were the following: B2B, B2C, C2C, C2M.
H4. Performance, risk and financial reports (PRFR). The fourth research hypothesis (H4) refers to the influence of performance, risk and financial reports on the transparency of annual reports. In general, the hypothesis was validated due to the coefficient of 0.214 (Figure 1), but it would be difficult to say which of the variables had a more significant influence, as the quantitative information shows similar values. Financial performance (PRFR1—0.738) shows three categories of features. The first category amounts to 13% in 2020, comprising only absolute indicators, taken directly from financial reports. The second category has a more significant share of (42%) and includes both absolute and relative indicators. E-commerce companies most prefer the following indicators: EPS (earnings per share) and EBITDA (earnings before interests, taxes, depreciation and amortization). The third category amounts to 36%, comprising relative and absolute indicators, calculated using not only the information from financial reports but also using data viewed as non-IFRS or non-GAAP indicators.
Considering the latest trends on the world market, this variable should also include non-financial performance, the study results actually showing that out of the 31 studied companies, only Zalando included information on non-financial performance.
Risk management policies (PRFR2—0.732) is a variable with a significant influence on transparency, although their content varying from one company to another. All the analyzed reports comprised information regarding the eventual risks faced by companies, such as market risk, credit risk, liquidity risk, equity investment risk, foreign exchange risk, legal and regulatory risk, compliance risk, information system risk, human resources risk, crisis management and reputation risk, etc. Various types of risks show the diversity of organizational cultures in companies included in the sample, 29% of these combining risk management policies with an opportunity management system according to the Enterprise Risk Management Standard (COSO). The second factor influencing the diversified structure of risks is the fact that out of the 29 analyzed reports, 13 were registered at the Securities and Exchange Commission. The third factor refers to the diversity of the stock exchanges on which the analyzed companied are listed: New York Stock Exchange, Nasdaq Stock Market LLC, Euronext Amsterdam, Stock Exchange of Hong Kong Limited, Shenzhen Stock Exchange, India on Bombay Stock Exchange, Calcutta Stock Exchange, Frankfurt Stock Exchange.
Financial reports and taxation (PRFR3—0.826) refer to the third variable with a highly significant share in the econometric model for testing the H4 hypothesis. All analyzed companies included financial reports in their annual report except for BigCommerce. The difficulty in studying its influence comes from the diversity of the regulatory framework that was used for producing the financial reports: US GAAP (Generally Accepted Accounting Principles), IFRS (International Financial Reporting Standards), Accounting Standards for Business Enterprises (Ministry of Finance of the People′s Republic of China), Indian Accounting Standards, Norwegian Accounting Standard Board. In other words, the diversity of the regulatory framework supports the impossibility of comparing the information comprised in the financial reports of companies included in the study.
Now, IFAC (2021) recommends for accountants to also include in their reports the information regarding climate change, although the common IFRS set of standards has not been modified. In this context, The Framework-convention of the United Nations on climate change (UN 2016) requires prudence in reporting by promoting policies maintaining an average global temperature under 2 °C over the pre-industrial levels and continuing the efforts to limit the temperature to 1.5 °C.
So, it could be noted that 29% of the companies included information regarding company policies referring to global warming, although companies are encouraged to include such information in line with the expectations of the stakeholders in the explanatory note of the financial reports or in the non-financial part.

6. Conclusions

The analysis of transparency of the most profitable global e-commerce companies shows the existence of a set of problems as well as opportunities that should be used to grow their performance. The theoretical perspective presents the wide range of diverse opinions from one author to another, having been validated practically by the analysis of information comprised in annual reports.
The quality of financial and non-financial information could be verified by a multitude of short-term instruments, the strategic long-term vision aiming to consolidate the relations with all stakeholders, and not only with the shareholders, and to promote corporate social responsibility policies.
The relations between corporate governance and transparency are not exclusively those presented by the econometric model. The reciprocal interdependence was demonstrated by qualitative along with quantitative variables, being highly important in research. From this perspective, the degree of transparency of a company grows with the promotion of sustainable strategies and active involvement of top management in company activities in terms of leadership.
There are the same reciprocal interdependencies between human resource policies and transparency, becoming sustainable as companies start focusing more on innovation and promotion of talents. Another key factor in this sense refers to the quality of information provided on the company website regarding the professional experience and activity of top management and the size of their rewards.
Although pertaining to the technical side of the decision-making process, risk management, accounting and performance appraisal policies contribute to the qualitative development of transparency when these move closer to the economic reality and to the company’s internal and external environment.
We acknowledge that our research is subject to some limitations. Our study is based on annual reports information. Future research could consider other sources for investigating the entities’ transparency. This study focuses only on e-commerce companies. Therefore, a potential extension of this research could be a comparative analysis of transparency among companies from different industries. Subject to these limitations, we argue that our findings have important implications for businesses, managers, investors and policymakers.

Author Contributions

Conceptualization, I.B., A.B. (Alic Bîrcă), A.B. (Aliona Bîrcă) and C.B.S.; methodology, I.B., A.B. (Alic Bîrcă), A.B. (Aliona Bîrcă) and C.B.S.; software, I.B., A.B. (Alic Bîrcă), A.B. (Aliona Bîrcă) and C.B.S.; validation, I.B., A.B. (Alic Bîrcă), A.B. (Aliona Bîrcă) and C.B.S.; formal analysis, I.B., A.B. (Alic Bîrcă), A.B. (Aliona Bîrcă) and C.B.S.; investigation, I.B., A.B. (Alic Bîrcă), A.B. (Aliona Bîrcă) and C.B.S.; resources, I.B., A.B. (Alic Bîrcă), A.B. (Aliona Bîrcă) and C.B.S.; data curation, I.B., A.B. (Alic Bîrcă), A.B. (Aliona Bîrcă) and C.B.S.; writing—original draft preparation, I.B., A.B. (Alic Bîrcă), A.B. (Aliona Bîrcă) and C.B.S.; writing—review and editing, I.B., A.B. (Alic Bîrcă), A.B. (Aliona Bîrcă) and C.B.S.; visualization, I.B., A.B. (Alic Bîrcă), A.B. (Aliona Bîrcă) and C.B.S.; supervision, I.B., A.B. (Alic Bîrcă), A.B. (Aliona Bîrcă) and C.B.S. All authors have read and agreed to the published version of the manuscript.

Funding

This work was supported by a grant of the Romanian Ministry of Education and Research, CNCS-UEFISCDI, project number PN-III-P1-1.1-TE-2019-1642, within PNCDI III.

Institutional Review Board Statement

Not applicable.

Informed Consent Statement

Not applicable.

Acknowledgments

We are grateful to the anonymous reviewers for their valuable comments.

Conflicts of Interest

The authors declare no conflict of interest.

Appendix A

Table A1. List of companies used in the analysis of transparency.
No.E-Commerce Company Name
1.Alibaba Gr. Holding Ltd.
2.Alumex PLC
3.Amazon
4.Apple
5.Best buy
6.BigCommerce
7.Costco
8.Cnova
9.Delticom
10.Ebay
11.Home Depot
12.Jingdon
13.Just Eat Takeaway
14.Kroger
15.Meituan
16.Otto Group
17.Pinduoduo
18.Prosus
19.Rakuten
20.Showroomprive
21.Shopify
22.Smartphoto Group
23.Smurfit Kappa Gp
24.Suning
25.Target
26.Walmart
27.Wayfair
28.Weebly
29.WIX
30.Xplora
31.Zalando
Source: Processed by authors.

References

  1. Abdel-Maksoud, Ahmed, David Dugdale, and Robert G. Luther. 2005. Non-financial performance measurement in manufacturing companies. The British Accounting Review 37: 261–97. [Google Scholar] [CrossRef]
  2. Abeysekera, Indra, and James Guthrie. 2004. Human capital reporting in a developing nation. The British Accounting Review 36: 251–68. [Google Scholar] [CrossRef] [Green Version]
  3. Alexopoulos, Ilias, Kostas Kounetas, and Dimitris Tzelepis. 2018. Environmental and Financial Performance. Is there a win-win or a win-loss situation? Evidence from the Greek manufacturing. Journal of Cleaner Production 197: 1275–83. [Google Scholar] [CrossRef] [Green Version]
  4. Allegrini, Marco, and Giulio Greco. 2011. Corporate boards, audit committees and voluntary disclosure: Evidence from Italian Listed Companies. Journal of Management & Governance 17: 187–216. [Google Scholar]
  5. Ansoff, H. Igor, Daniel Kipley, Alfred O. Lewis, Roxanne Stevens, and Rick Ansoff. 2019. Implanting Strategic Management, 3rd ed. New York: Springer. [Google Scholar]
  6. Aras, Güler, Aslı Aybars, and Ozlem Kutl. 2010. Managing corporate performance: Investigating the relationship between corporate social responsibility and financial performance in emerging markets. International Journal of Productivity and Performance Management 59: 229–54. [Google Scholar] [CrossRef]
  7. Arnold, Glen, and Deborah Lewis. 2019. Corporate Financial Management, 6th ed. London: Pearson Education Limited. [Google Scholar]
  8. Arora, Punit, and Ravi Dharwadkar. 2011. Corporate Governance and Corporate Social Responsibility (CSR): The Moderating Roles of Attainment Discrepancy and Organization Slack. Corporate Governance: An International Review 19: 136–52. [Google Scholar] [CrossRef]
  9. Baraibar-Diez, Elisa, María D. Odriozola, and José Luis Fernández Sánchez. 2015. Transparency through European corporate governance codes. International Journal of Disclosure and Governance 13: 244–61. [Google Scholar] [CrossRef]
  10. Barkemeyer, Ralf, Breeda Comyns, Frank Figge, and Giulio Napolitano. 2014. CEO statements in sustainability reports: Substantive information or background noise? Accounting Forum 38: 241–57. [Google Scholar] [CrossRef]
  11. Bauer, Rob, Nadja Guenster, and Rogér Otten. 2004. Otten Empirical evidence on corporate governance in Europe: The effect on stock returns, firm value and performance. Journal of Asset Management 5: 91–104. [Google Scholar] [CrossRef] [Green Version]
  12. Bauwhede, Heidi Vander, and Marleen Willekens. 2008. Disclosure on Corporate Governance in the European Union. Corporate Governance: An International Review 16: 101–15. [Google Scholar] [CrossRef]
  13. Beuren, Ilse Maria, Nelson Hein, and Roberto Carlos Klann. 2008. Impact of the IFRS and US-GAAP on economic-financial indicators. Managerial Auditing Journal 23: 632–49. [Google Scholar] [CrossRef]
  14. Bhat, Gauri, Ole-Kristian Hope, and Tony Kang. 2006. Does corporate governance transparency affect the accuracy of analyst forecasts? Accounting and Finance 46: 715–32. [Google Scholar] [CrossRef]
  15. Birca, Alic. 2018. Organizations involvement in the sustainable development of human resources. Annals of the ‘Constantin Brancusi’ University of Targu Jiu. Economy Series. pp. 14–24. Available online: https://econpapers.repec.org/article/cbujrnlec/y_3a2018_3av_3aspecial_3ap_3a14-24.htm (accessed on 1 July 2022).
  16. Bold, Frank. 2017. Compliance and Reporting under the EU Non-Financial Reporting Directive: Requirements and Opportunities. Brussels and Brno: Frank Bold Society. [Google Scholar]
  17. Bradford, Marianne, Julia B. Earp, D. Scott Showalter, and Paul F. Williams. 2017. Corporate Sustainability Reporting and Stakeholder Concerns: Is There a Disconnect? Accounting Horizons 31: 83–102. [Google Scholar] [CrossRef]
  18. Brauer, Matthias, and Sascha Schmidt. 2008. Defining the strategic role of boards and measuring boards’ effectiveness in strategy implementation. Corporate Governance 8: 649–60. [Google Scholar] [CrossRef]
  19. Brennan, Niamh. 2006. Boards of directors and firm performance: Is there an expectations gap? Corporate Governance: An International Review 14: 577–93. [Google Scholar] [CrossRef]
  20. Brigham, Eugene F., and Phillip R. Daves. 2007. Intermediate Financial Management, 9th ed. Belmont: Thomson Higher Education. [Google Scholar]
  21. Burhan, Annisa Hayatun N., and Wiwin Rahmanti. 2012. The impact of sustainable reporting on company’s performance. Journal of Economics Business and Accountancy Ventura 15: 257–72. [Google Scholar] [CrossRef]
  22. Céspedes-Lorente, José, Jerónimo Burgos-Jiménez, and María José Álvarez Gil. 2004. Stakeholders’ environmental influence. An empirical analysis in the Spanish hotel industry. Scandinavian Journal of Management 19: 333–58. [Google Scholar] [CrossRef] [Green Version]
  23. Chiu, Tzu-Kuan, and Yi-Hsin Wang. 2015. Determinants of social disclosure quality in Taiwan: An application of Stakeholder Theory. Journal of Business Ethics 129: 379–98. [Google Scholar] [CrossRef]
  24. Choi, Frederick D. S., and Gerhard G. Mueller. 1992. International Accounting, 2nd ed. Englewood Cliffs: Prentice-Hall, 610p. [Google Scholar]
  25. Christopher, Joe. 2010. Corporate governance—A multi-theoretical approach to recognizing the wider influencing forces impacting on organizations. Critical Perspectives on Accounting 21: 683–95. [Google Scholar] [CrossRef]
  26. Cochran, Philip L., and Robert A. Wood. 1984. Corporate Social Responsibility and Financial Performance. The Academy of Management Journal 27: 42–56. [Google Scholar]
  27. Cucari, Nicola, Salvatore Esposito de Falco, and Beatrice Orlando. 2017. Diversity of Board of Directors and Environmental Social Governance: Evidence from Italian Listed Companies. Corporate Social Responsibility and Environmental Management 25: 250–66. [Google Scholar] [CrossRef]
  28. De Burgos-Jiménez, Jerónimo, Diego Alfonso Vazquez-Brust, J. A. Plaza-Úbeda, and Jeroen Dijkshoorn. 2013. Environmental protection and financial performance: An empirical analysis in Wales. International Journal of Operations & Production Management 33: 981–1018. [Google Scholar]
  29. Dyllick, Thomas, and Kai Hockerts. 2002. Beyond the business case for corporate sustainability. Business Strategy and the Environment 11: 130–41. [Google Scholar] [CrossRef]
  30. Easley, David. 2010. Financial statement and investment decision. International Journal of Business and Commerce 3: 58–69. [Google Scholar]
  31. Edwards, James B. 2016. Modern Gross Profit Analysis. The Journal of Corporate Accounting and Finance 27: 45–55. [Google Scholar] [CrossRef]
  32. Eljelly, Abuzar M. A. 2004. Liquidity-profitability tradeoff: An empirical investigation in an emerging market. International Journal of Commerce and Management 14: 48–61. [Google Scholar] [CrossRef]
  33. Elsayed, Khaled, and David Paton. 2009. The impact of financial performance on evironmental policy: Does firm life cycle matter? Business Strategy and the Environment 18: 397–413. [Google Scholar] [CrossRef]
  34. Erhardt, Niclas L., James D. Werbel, and Charles B. Shrader. 2003. Board of Director Diversity and Firm Financial Performance. Corporate Governance 11: 102–11. [Google Scholar] [CrossRef] [Green Version]
  35. EU/European Union. 2014. Directive 2014/95/EU of the European Parliament and of the Council of 22 October 2014 Amending Directive 2013/34/EU as Regards Disclosure of Non-Financial and Diversity Information by Certain Large Undertakings and Groups. Text with EEA relevance, L 330. Bruxelles: European Union. [Google Scholar]
  36. Feleagă, Niculae, Liliana Feleagă, Voicu Dan Dragomir, and Adrian Doru Bigioi. 2011. Guvernanţa corporativă în economiile emergente: Cazul României. Economie teoretică şi aplicată 18: 3–15. [Google Scholar]
  37. Fernandes, Kiran Jude, Vinesh Raja, and Andrew Whalley. 2006. Lessons from implementing the balanced scorecard in a small and medium size manufacturing organization. Technovation 26: 623–34. [Google Scholar] [CrossRef]
  38. Fernandez-Feijoo, Belen, Silvia Romero, and Silvia Ruiz. 2014. Effect of stakeholders’ pressure on transparency of sustainability reports within the GRI framework. Journal of Business Ethics 122: 53–63. [Google Scholar] [CrossRef]
  39. Fiegener, Mark K. 2005. Determinants of board participation in the strategic decisions of small corporations. Entrepreneurship Theory and Practice 29: 627–50. [Google Scholar] [CrossRef]
  40. Ford, Roger H. 1988. Outside directors and the privately-owned firm: Are they necessary? Entrepreneurship Theory and Practice 13: 49–57. [Google Scholar] [CrossRef]
  41. Francis, Jennifer, Allen H. Huang, Shivaram Rajgopal, and Amy Y. Zang. 2008. CEO Reputation and Earnings Quality. Contemporary Accounting Research 25: 109–47. [Google Scholar] [CrossRef]
  42. Fullerton, Rosemary R., and William F. Wempe. 2009. Lean manufacturing, non-financial performance measures, and financial performance. International Journal of Operations & Production Management 29: 214–40. [Google Scholar]
  43. Furrer, Olivier, Howard Thomas, and Anna Goussevskaia. 2008. The structure and evolution of the strategic management field: A content analysis of 26 years of strategic management research. International Journal of Management Reviews 10: 1–23. [Google Scholar] [CrossRef]
  44. Gan, Huiqi, Myung S. Park, and Sang Hyun Suh. 2020. Non-financial performance measures, CEO compensation, and firms’ future value. Journal of Business Research 110: 213–27. [Google Scholar] [CrossRef]
  45. Goldmann, Katarzyna. 2016. Financial Liquidity and Profitability Management in Practice of Polish Business. In Financial Environment and Business Development. Eurasian Studies in Business and Economics. Cham: Springer, pp. 103–12. [Google Scholar] [CrossRef]
  46. Goram, Paul J., Theodore Mock, and Gary S. Monroe. 2011. Financial analysts’ evaluation oh enhanced disclosure of non-financial performance indicators. The British Accounting Review 43: 87–101. [Google Scholar]
  47. Grove, Hugh, Maclyn Clouse, and Tracy Xu. 2021. Human resource reporting: Implications for corporate governance. Corporate Governance and Organizational Behavior Review 5: 26–36. [Google Scholar] [CrossRef]
  48. Hair, Joseph F., G. Tomas M. Hult, Christian M. Ringle, and Marko Sarstedt. 2013. Editorial—Partial Least Squares Structural Equation Modeling: Rigorous Applications, Better Results and Higher Acceptance. Long Range Planning 46: 1–12. Available online: https://ssrn.com/abstract=2233795 (accessed on 27 May 2022). [CrossRef]
  49. Hair, Joseph F., G. Tomas M. Hult, Christian M. Ringle, and Marko Sarstedt. 2014. A Primer on Partial Least Squares Structural Equation Modelling (PLS-SEM). Thousand Oaks: Sage Publications. [Google Scholar]
  50. Hategan, Camelia-Daniela, Nicoleta Sirghi, Ruxandra-Ioana Curea-Pitorac, and Vasile-Petru Hategan. 2018. Doing well or doing good: The relationship between corporate social responsibility and profit in Romanian companies. Sustainability 10: 1041. [Google Scholar] [CrossRef] [Green Version]
  51. Helfat, Constance E., and Jeffrey A. Martin. 2015. Dynamic Managerial Capabilities: Review and Assessment of Managerial Impact on Strategic Change. Journal of Management 41: 1281–312. [Google Scholar] [CrossRef]
  52. Herzig, Christian, and Stefan Schaltegger. 2006. Corporate Sustainability Reporting. An Overview. In Sustainability Accounting and Reporting. Edited by Stefan Schaltegger, Martin Bennett and Roger Burritt. Dordrecht: Springer, ISBN 978-1-4020-4079-5/978-1-4020-4974-3. [Google Scholar]
  53. IFAC/International Federation of Accountants. 2021. COP26 Key Takeaways for Business and Accountants. Available online: https://www.ifac.org/knowledge-gateway/contributing-global-economy/discussion/climate-summit-spotlights-business-and-accountants (accessed on 7 June 2022).
  54. IFRS/International Financial Reporting Standards. 2001. The #1 Website for Global Accounting News. Available online: https://www.iasplus.com/en/standards/ifrs/ifrs1 (accessed on 5 June 2022).
  55. Iwata, Hiroki, and Keisuke Okada. 2011. How does environmental performance affect financial performance? Evidence from Japanese manufacturing firms. Ecological Economics 70: 1691–700. [Google Scholar] [CrossRef] [Green Version]
  56. Janning, Finn, Wafa Khlif, and Coral Ingley. 2020. The Illusion of Transparency in Corporate Governance. Cham: Springer Nature Switzerland AG, ISBN 978-3-030-35779-5. [Google Scholar] [CrossRef]
  57. Jones, Stewart, Geoff Frost, Janice Loftus, and Sandra Lee Van der Laan. 2007. An empirical examination of the market returns and financial performance of entities engaged in sustainability reporting. Australian Accounting Review 17: 78–87. [Google Scholar] [CrossRef]
  58. Kaplan, Robert S., and David P. Norton. 2006. How to implement a new strategy without disrupting your organization. Harvard Business Review 84: 100–9. [Google Scholar] [CrossRef]
  59. Khan, Md Habib-Uz-Zaman, and Rashidozzaman Khan. 2010. Human capital disclosure practices of top Bangladeshi companies. Journal of Human Resource Costing & Accounting 14: 329–49. [Google Scholar]
  60. King, Andrew. 2007. Cooperation between corporations and environmental groups: A transaction cost perspective. The Academy of Management Review 32: 889–900. [Google Scholar] [CrossRef] [Green Version]
  61. Klein, April. 2002. Audit committee, board of director characteristics, and earnings management. Journal of Accounting and Economics 33: 375–400. [Google Scholar] [CrossRef] [Green Version]
  62. Kolev, Kalin, David B. Wangrow, Vincent L. Barker, and Donald J. Schepker. 2019. Board Committees in Corporate Governance: A Cross-Disciplinary Review and Agenda for the Future. Journal of Management Studies 56: 1138–93. [Google Scholar] [CrossRef]
  63. Lasher, William R. 2014. Practical Financial Management, 8th ed. Boston: CENGAGE Learning. [Google Scholar]
  64. Li, Mengge, and Jinxin Yang. 2019. Effects of CEO duality and tenure on innovation. Journal of Strategy and Management 12: 536–52. [Google Scholar] [CrossRef]
  65. Lohmöller, Jan-Bernd. 1989. Latent Variable Path Modelling with Partial Least Squares. Heidelberg: Physica-Verlag. [Google Scholar]
  66. López-Arceiz, Francisco José, Ana José Bellostas-Pérezgrueso, José Mariano Moneva-Abadía, and María Pilar Rivera-Torres. 2017. The role of corporate governance and transparency in the generation of financial performance in socially responsible companies. Spanish Journal of Finance and Accounting/Revista Española de Financiación y Contabilidad 47: 44–80. [Google Scholar] [CrossRef]
  67. Manetti, Giacomo, and Simone Toccafondi. 2012. The role of stakeholders in sustainability reporting assurance. Journal of Business Ethics 107: 363–77. [Google Scholar] [CrossRef]
  68. McCracken, Martin, Ronan McIvor, Raymond Treacy, and Tony Wall. 2018. A study of human capital reporting in the United Kingdom. Accounting Forum 42: 130–41. [Google Scholar] [CrossRef]
  69. McWilliams, Abagail, and Donald Siegel. 2000. Corporate social responsibility and financial performance: Correlation or misspecification? Strategic Management Journal 21: 603–9. [Google Scholar] [CrossRef]
  70. Moneva, Jose M., and Eduardo Ortas. 2010. Corporate environmental and financial performance: A multivariate approach. Industrial Management & Data Systems 110: 193–210. [Google Scholar]
  71. Naciti, Valeria, Fabrizio Cesaroni, and Luisa Pulejo. 2022. Corporate governance and sustainability: A review of the existing literature. Journal of Management and Governance 26: 55–74. [Google Scholar] [CrossRef]
  72. Nakao, Yuriko, Akihiro Amano, Kanichiro Matsumura, Kiminori Genba, and Makiko Nakano. 2006. Relationship between environmental performance and financial performance: An empirical analysis of japanese corporations. Business Strategies and the Environment 16: 106–18. [Google Scholar] [CrossRef]
  73. Needles, Belverd E., and Marian Powers. 2007. Financial Accounting, 9th ed. Boston: Houghton Mifflin Harcourt. [Google Scholar]
  74. Nielsen, Anne Ellerup, and Christa Thomsen. 2007. Reporting CSR: What and how to say it? Corporate Communications: An International Journal 12: 25–40. [Google Scholar] [CrossRef]
  75. OECD/Organisation for Economic Co-operation and Development. 2004. Principles of Corporate Governance. Paris: OECD Publications Service. [Google Scholar]
  76. OECD/Organisation for Economic Co-operation and Development. 2015. G20/OECD Principles of Corporate Governance. Paris: OECD Publishing. [Google Scholar]
  77. Omran, Mohamed A., Ashraf Khallaf, Kimberly C. Gleason, and Tahat Yasean Tahat. 2020. Non-financial performance measures disclosure, quality strategy, and organizational financial performance: A mediating model. Total Quality Management & Business Excellence 2: 652–75. [Google Scholar]
  78. Oncioiu Holban, Ionica, Anca-Gabriela Petrescu, Florentina-Raluca Bîlcan, Marius Petrescu, and Delia-Mioara Popescu. 2010. Corporate Sustainability Reporting and Financial Performance. Sustainability 12: 4297. [Google Scholar] [CrossRef]
  79. Onkila, Tiina Johanna. 2009. Corporate argumentation for acceptability: Reflections of environmental values and stakeholder relations in corporate environmental statements. Journal of Business Ethics 87: 285–98. [Google Scholar] [CrossRef]
  80. Park, Jong-Hun, Changsu Kim, Young Kyun Chang, Dong-Hyun Lee, and Yun-Dal Sung. 2018. CEO hubris and firm performance: Exploring the moderating roles of CEO power and board vigilance. Journal of Business Ethics 147: 919–33. [Google Scholar] [CrossRef]
  81. Pearce, John A., and Richard B. Robinson. 2011. Strategic Management: Formulation, Implementation & Control, 12th ed. New York: Mcgraw Hill Higher Education, 992p. [Google Scholar]
  82. Prince, John Ben, and Neeraj Dwivedi. 2013. A third dimension to understanding voluntary disclosures. Journal of Business Strategy 34: 48–54. [Google Scholar] [CrossRef]
  83. Pucheta-Martínez, María Consuelo, and Isabel Gallego-Álvarez. 2019. An international approach of the relationship between board attributes and the discclosure of corporate social responsability issues. Corporate Social Responsability and Environmental Management 26: 612–27. [Google Scholar] [CrossRef]
  84. Qiu, Yan, Amama Shaukat, and Rajesh Tharyan. 2016. Environmental and social disclosures: Link with corporate financial performance. The British Accounting Review 48: 102–16. [Google Scholar] [CrossRef] [Green Version]
  85. Radomska, Joanna. 2014. Operational risk associated with the strategy implementation. Management 18: 31–43. [Google Scholar] [CrossRef] [Green Version]
  86. Raucci, Domenico Raucci, Lara Tarquinio, Daniela Rupo, and Salvatore Loprevite. 2020. Non-Financial Performance Indicators: The Power of Measures to Operationalize the Law. In Sustainability and Law. Edited by Volker Mauerhofer, Daniela Rupo and Lara Tarquinio. Cham: Springer, pp. 275–91. [Google Scholar]
  87. Renders, Annelies, Ann Gaeremynck, and Piet Sercu. 2010. Corporate-governance ratings and company performance: A cross-European study. Corporate Governance: An International Review 18: 87–106. [Google Scholar] [CrossRef] [Green Version]
  88. Ringle, Christian M., Sven Wende, and Jan-Michael Becker. 2015. Smart PLS 3. Smart PLS GmbH Boenningstedt. Available online: http://www.smartpls.com (accessed on 6 June 2022).
  89. Rosenstein, Joseph, Albert V. Bruno, William D. Bygrave, and Natalie T. Taylor. 1993. The CEO, venture capitalists, and the board. Journal of Business Venturing 8: 99–113. [Google Scholar] [CrossRef]
  90. Roychowdhury, Sugata, Nemit Shroff, and Rodrigo S. Verdi. 2019. The Effects of Financial Reporting and Disclosure on Corporate Investment: A Review. Journal of Accounting and Economics 68: 101246. [Google Scholar] [CrossRef]
  91. Ruigrok, Winfried, Simon I. Peck, and Hansueli Keller. 2006. Board characteristics and involvement in strategic decision-making: Evidence from Swiss companies. Journal of Management Studies 43: 1201–26. [Google Scholar] [CrossRef]
  92. Sapienza, Harry J., and Anil K. Gupta. 1994. Impact of agency risks and task uncertainty on venture capitalist–CEO interactions. Academy of Management Journal 37: 1618–32. [Google Scholar]
  93. Scaltrito, Davide. 2015. Assessing Disclosure Quality: A Methodological Issue. Journal of Modern Accounting and Auditing 11: 466–75. [Google Scholar] [CrossRef] [Green Version]
  94. Scherer, Andreas Georg, and Christian Voegtlin. 2020. Corporate governance for responsible innovation: Approaches to corporate governance and their implications for sustainable development. Academy of Management Perspectives 34: 182–208. [Google Scholar] [CrossRef]
  95. Schnackenberg, Andrew K., and Edward C. Tomlinson. 2016. Organizational Transparency a New Perspective on Managing Trust in Organization-Stakeholder Relationships. Journal of Management 42: 1784–810. [Google Scholar] [CrossRef]
  96. Siew, Renard Y. J. 2015. A review of corporate sustainability reporting tools (SRTs). Journal of Environmental Management 164: 180–95. [Google Scholar] [CrossRef]
  97. Simpson, Justine, and John R. Taylor. 2013. Corporate Governance, Ethics and CSR, 1st ed. London: Kogan Page, 297p, ISBN 978-0749463854. [Google Scholar]
  98. Stanwick, Sarah D., and Peter A. Stanwick. 2000. The relationship between environmental disclosures and financial performance: An empirical study of US firms. Corporate Social Responsibility and Environmental Management 7: 155–64. [Google Scholar] [CrossRef]
  99. Subba, Rao A. V., and Daniel Zeghal. 1997. Human resource Information Disclosure in Annual reports: An international Comparison. Journal of Human Resource Costing and Accounting 2: 53–73. [Google Scholar] [CrossRef]
  100. Theyel, Gregory, and Kay Hofmann. 2012. Stakeholder relations and sustainability practices of U.S. small and medium-sized manufacturers. Management Research Review 35: 1110–33. [Google Scholar] [CrossRef]
  101. Tiron Tudor, Adriana. 2006. Disclosure and Transparency of Romanian Listed Companies. SSRN Electronic Journal. Available online: https://papers.ssrn.com/sol3/papers.cfm?abstract_id=920580 (accessed on 9 June 2022).
  102. Tracy, Artiach, Darren Lee, David Nelson, and Julie Walker. 2010. The determinants of corporate sustainability performance. Accounting and Finance 50: 31–51. [Google Scholar]
  103. UN/United Nations. 2016. Framework Convention on Climate Change. Official Journal of the European Union L 282/4. Available online: https://eur-lex.europa.eu/legal-content/EN/TXT/PDF/?uri=CELEX:22016A1019(01)&from=EN (accessed on 10 June 2022).
  104. Valaskova, Katarina, Tomas Kliestik, and Dominika Gajdosikova. 2021. Distinctive determinants of financial indebtedness: Evidence from Slovak and Czech enterprises. Equilibrium. Quarterly Journal of Economics and Economic Policy 16: 639–59. [Google Scholar] [CrossRef]
  105. Van Horne, James C., and John M. Wachowicz Jr. 2005. Fundamentals of Financial Management, 12th ed. London: Pearson Education Limited. [Google Scholar]
Figure 1. Structural model. Source: Authors’ calculation with SmartPLS (v. 3.3.3) software.
Jrfm 15 00313 g001
Table 1. The list of variables in the study (latent and observables variables).
No.
Line
The Symbol
of Main Categories
List of Independent Variables
I.CGCorporate governance
1.1.CG1Corporate governance structure
1.2.CG2Managerial strategies
1.3.CG3Advising committees of the Board of Directors
II.HRHuman Resources
2.1.HR1Number of employees
2.2.HR2Company’s personnel reward policy
2.3.HR3Innovations and initiatives
2.4.HR4Professional experience of top managers
III.SDSustainable development
3.1.SD1Business overview
3.2.SD2Key events
3.3.SD3Research and Development
IV.PRFRPerformance, risks and financial reports
4.1.PRFR1Financial performance
4.2.PRFR2Risk management
4.3.PRFR3Financial reports
Source: Processed by authors.
Table 2. Convergent reliability and validity indicators.
No.
Line
ConstructCronbach’s
Alpha
rho_AComposite
Reliability
Average Variance
Extracted (AVE)
1.CG0.6200.7020.7940.568
2.HR0.6350.6850.8020.578
3.PRFR0.6040.6700.7700.526
4.SD0.6180.5400.7580.517
Source: Authors’ calculation with SmartPLS (v. 3.3.3) software.
Table 3. Testing the significance of path coefficients.
No.
Line
RelationshipPath CoefficientT Statisticsp ValuesValidation
of the Hypothesis
1.CG Transparency0.3944.5210.000Yes
2.HR Transparency0.3002.8000.005Yes
3.PFS Transparency0.2142.4140.016Yes
4.SD Transparency0.1581.6910.091No
Source: Authors’ calculation with SmartPLS (v. 3.3.3) software.
Publisher’s Note: MDPI stays neutral with regard to jurisdictional claims in published maps and institutional affiliations.

