1. Introduction
Our future economic response to disasters is affected by our perceived level of success in similar previous events. With the increasing frequency of disasters at both local and global levels, our understanding of how the economic response supports recovery deserves increased attention. The devastating effects of disasters often lead to long-term consequences, especially when infrastructure and human capital, built up over several years, risk instant loss (
Shabnam 2014). The cost of replacing damaged infrastructure during such an event could cost millions and last several years. Disasters are often followed by investment stimulus to support the economy and replace that which was lost. It is especially evident after events that affect the built environment as a result of natural disasters (
Attary et al. 2020;
Dunford and Li 2011;
Kalinowski 2015) and more recently due to economic shocks, such as the Global Financial Crises (
Khatiwada 2009;
Saha and von Weizsäcker 2009) and pandemics such as COVID-19 (
DeWit et al. 2020;
Fargher and Hallegatte 2020;
Hochrainer-Stigler 2021). The main purpose of a stimulus package is to stimulate economic activity for recovery. The outcome of such a stimulus could result in immediate or long-term changes in economic conditions for the affected area.
Several studies (
Wu and Guo 2021;
Atsalakis et al. 2021;
Guo et al. 2015) have assessed the relationship between economic growth and natural disasters with mixed results. These studies often use the Emergency Events Database (EM-DAT) which provides comprehensive disaster information from around the world, together with geographically disaggregated gross domestic product (GDP) data. Although this has proved successful in assessing the relationship between economic growth and disasters, the studies mainly focus on the aggregate health of the economy. This means the current literature lacks an understanding of how the economic transition occurs during recovery. It is widely accepted to use GDP to measure economic performance when comparing the pre-and post-disaster economic health of the affected region. However, this approach unintentionally includes the value of the injection stimulus in the analysis. In other words, the value of the stimulus could affect the scale and relationship between economic growth and disasters. As a consequence, it remains unknown how the economy is transitioning throughout the recovery period.
The contribution of this study is to address this gap within the literature by assessing the performance of the underlying economy during recovery by eliminating the investment injection that often follows disasters in populated areas. Utilising the historical association between geographic economic activity and its usual demand-driven building activity, allows for identifying the value of stimulus injection for supporting the recovery. Quantifying the economy-wide benefit (which is a result of the stimulus), by using Input–Output (IO) modelling, reveals the performance of the underlying economy and its transition through the post-disaster period. This quantifies the economy-wide value of the recovery stimulus that is often part of the GDP value when assessing the economic growth and disaster nexus.
This research further provides an opportunity to observe the long-term response of the economy after a major earthquake. Within Keynesian economics, it is expected that the economy will adjust over time to a position where supply and demand are in equilibrium, known as the long-period equilibrium (
Sebastiani 1992;
de-Juan 2005). In Canterbury’s case, the earthquake disturbed the current economic environment through a shock to the economy. Consequently, an investment stimulus is expected to adjust the market dynamics away from the equilibrium. Over time, the Canterbury economy could likely revert to this long-period equilibrium position where the market drives demand and supply again.
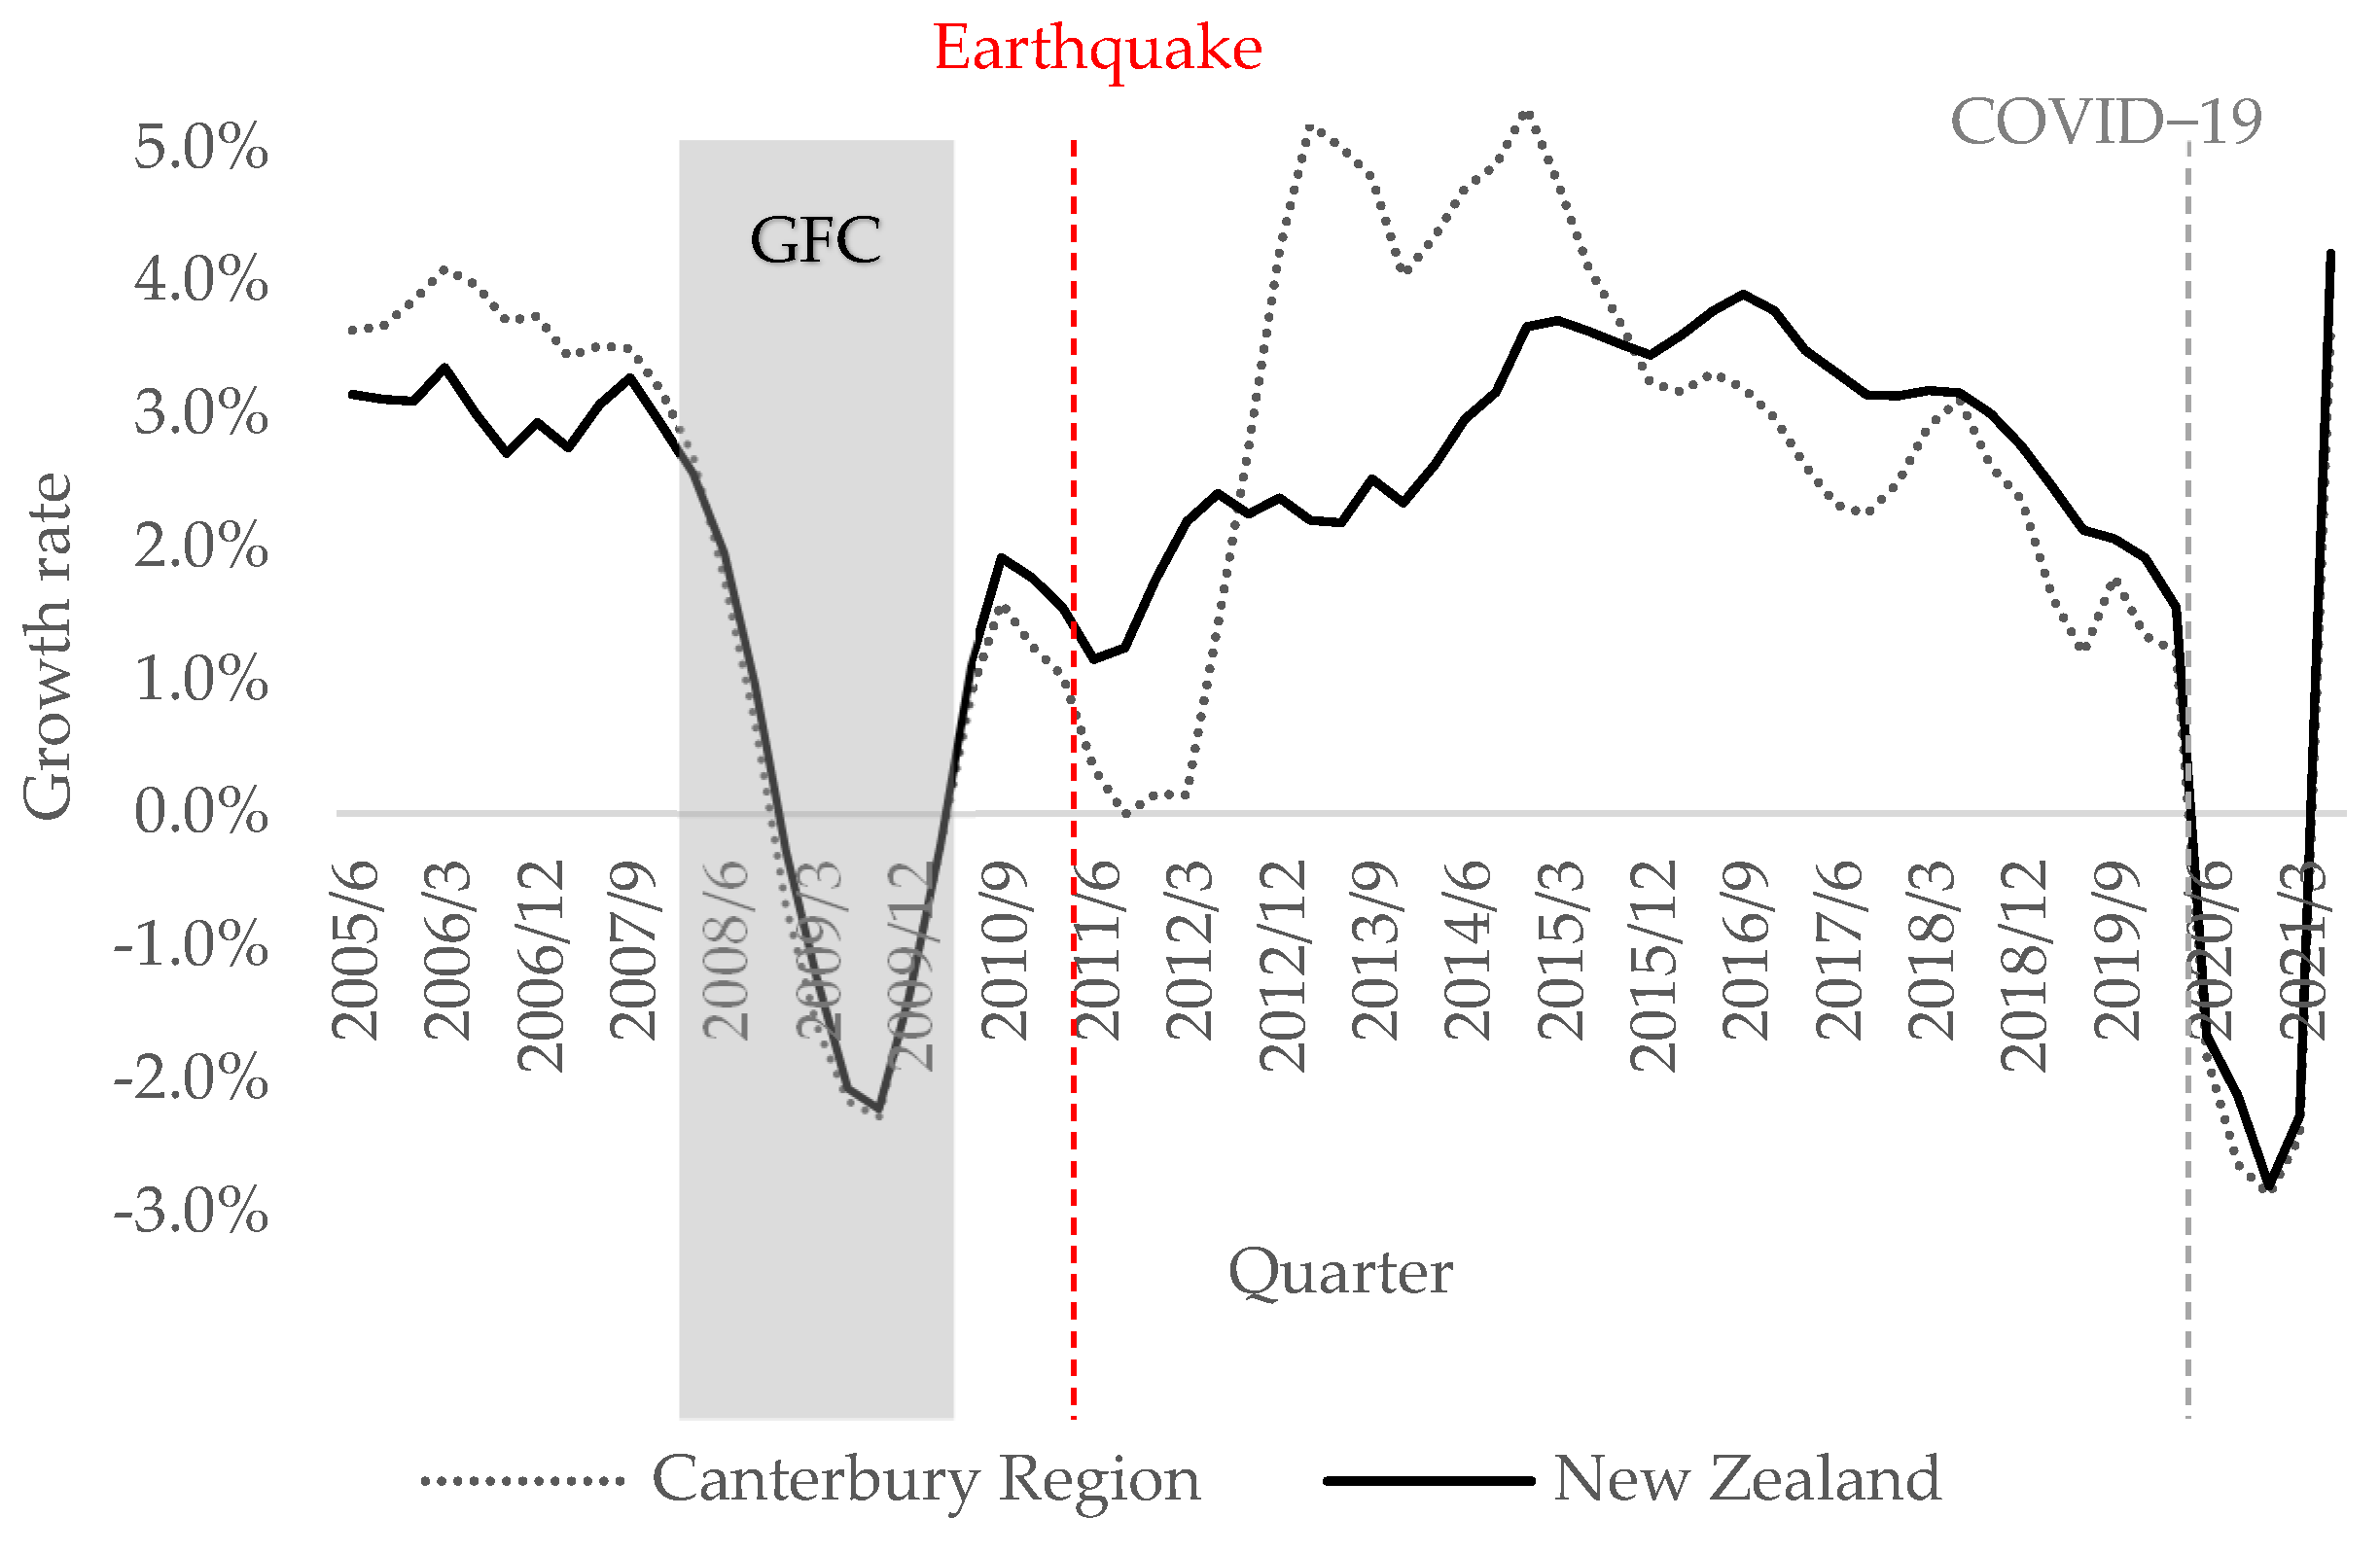
The Canterbury region in New Zealand has benefitted from a similar investment stimulus after the 2010/11 earthquakes, and 2021 marks ten years after the earthquakes. The government stimulus has more or less come to an end. Growth in the economy had started to pull back to national levels at the start of 2016, and it is likely a result of declining construction activity (see
Figure 1). In these instances, it remains unclear when normal, demand-driven building activity would return and what this level is. Consequently, there continues to be uncertainty about the performance of the underlying economy. Local government agencies seem to have similar uncertainties in understanding business-as-usual economic performance (
Fieger and Dyason 2019, p. 4;
Hayward 2019).
Since the earthquakes, much of the research has focused on specific industry trends and how they have performed, compared to other areas similarly affected by natural disasters (
Parker and Steenkamp 2012).
Potter et al. (
2015) looked at the changes and damages to the local environment and how social activities and perceptions were affected by the earthquake, while
Prayag et al. (
2019) explored the effect of the earthquake on tourists’ expenditure. As the frequency and severity of crises and disasters is increasing (
de Ruiter et al. 2020;
Runkle et al. 2018;
Ladds et al. 2017), the economy’s response during the recovery on a sub-national level deserves attention.
The following section reviews the literature on economic growth and disasters. An overview of the Canterbury earthquakes follows in
Section 3.
Section 4 outlines the research methodology and is followed by the results and a discussion. The paper concludes with implications of suggestions for local and regional economic recovery assessment.
2. Review of Literature
The nexus between economic growth and natural disasters continues to receive attention as the frequency of these events increases. Most studies evaluate the impact on a country level, while similar studies on a sub-national level are few; however, recently, more researchers have studied the sub-national impacts on the economy (see
Boustan et al. 2020;
Panwar and Sen 2020;
Fischer 2021). The literature reveals mixed results related to the nexus between economic growth and disasters, which points to the complexities related to assessing the economics of disasters as it varies in type (
Atsalakis et al. 2021), duration (
González et al. 2021) and scale (
Shabnam 2014).
On a country level, the focus tends to be on the relationship between disaster damage and economic development measured through changes to the gross domestic product (GDP). A study by
Albala-Bertrand (
1993) with a strong focus on earthquakes found that the causal relationship between economic growth and disasters is mostly positive in the short term. However, the complexities in assessing the causal relationship are evident in
Atsalakis et al. (
2021), who evaluated the importance of the assessment period.
Atsalakis et al. (
2021) found that changing the dates and the period under assessment affects the result. The results reveal how a quarter on quarter (QQ) approach and extension of the analysis over an extended period after the disaster positively affect economic growth.
In contrast,
Wu and Guo (
2021) empirically analysed provincial data in China to determine the relationship between disasters and economic growth and found that geological disasters, of which earthquakes are part, do not show a significant relationship to economic growth. Their results reveal that China places an increased emphasis on physical infrastructure. As a result, disasters that impact the infrastructure often occur near coastal areas where ocean, land and atmosphere interactions are more intense and meteorological in nature (
Guo et al. 2015). However, their result does not discount the importance of repair and rebuilding resulting from a geological disaster, especially one that takes place within a densely populated city.
The majority of studies assessing this nexus use official economic values from GDP and GDP per capita estimates (
Shabnam 2014). These values include the investment stimulus supporting the economy and its recovery, which could over-emphasise the speed of economic recovery from the event.
Studies looking at the impact of disasters on the sub-national level are gaining momentum. A recent sub-national study by
Fischer (
2021) revealed how regional economies within a country benefit due to spill-over effects from disasters. The study results reveal short-term benefits for the affected economy that spill over to the neighbouring economy, driven by increased employment in construction, especially in the event of earthquakes.
Panwar and Sen (
2020) assessed the effect of flooding on sub-regional economies. Their results show that flooding has negative growth effects on GDP in the long term. The recovery period lasted up to six years following the floods. see
Boustan et al. (
2020) compared a series of economic indicators before and after disasters on a county level in the USA. Their results find long-term negative effects on house prices and out-migration from the affected areas; however, these impacts seem modest at best. Meanwhile, a study by
Farzanegan et al. (
2021) of Iranian provinces found similar adverse effects on house prices as a result of droughts.
Results from the literature suggest that the disaster type could lead to different impact outcomes in the economy.
Klomp (
2016) found that geological disasters result in more damage per event, while atmospheric disasters are more frequent, which reduces the time between disasters and leads to a longer recovery. Applying the approach from
Klomp (
2016) to a sub-regional assessment in Argentina,
González et al. (
2021) found that atmospheric disasters create significant negative effects on growth only within the first year of occurrence.
The results from the literature reveal that studies at a sub-national level are expanding but remain limited. The results further suggest that more research is needed on a sub-national level. This research aims to extend the literature on disaster economics at a sub-national level.
Meanwhile, economic literature focusing on construction provides ample studies that indicate how construction activity has a positive impact on the economy (
Markstein 2017;
Gundes 2011;
Miles 2009;
Wylie 1996;
Strassmann 1970;
Turin 1969). The correlation between residential investment and GDP has also been established empirically (
Monnet and Wolf 2017;
Coulson and Kim 2000;
Green 1997). Although it is positive, growth rates do not equate to a linear relationship between building activity and economic activity (
Osei et al. 2017).
Strassmann (
1970) found that a high growing construction sector supports overall economic growth. Further research by
Lopes et al. (
2002) supported the latter finding and identified a 4% construction value added to GDP as associated with steady economic growth. In other words, construction share of economic activity near 4% is required to support economic growth. Within the Canterbury economy, the construction sector’s contribution increased from 5.2% before the earthquake to 7.8% during the rebuild. Recently, this value has decreased; however, it remains above the 5% mark.
Furthermore, the relationship between construction investment and economic growth within the United States was examined by
Ahmadi and Shahandashti (
2017). Their results indicate that construction activity represents a leading indicator for economic activity in 50% of states. This result is not similar for all regions; however, it does generate economic growth. More importantly, their results show that the economic structure of a regional economy is an important aspect to consider. While construction does present a good indicator of economic activity in some economies, it does not apply to all economies.
Ahmadi and Shahandashti (
2017) confirmed the mixed result found within the existing literature on causality between construction activity and GDP growth. Some studies found causality runs from economic activity to construction (
Ramachandra et al. 2013), while others reveal the opposite (
Khan 2008). These results imply that any analysis assessing the relationship between construction and economic activity requires a regional analysis of the relationship between these variables, as it seems to be sensitive to the economic structure of the economy. This research paper will incorporate this approach for Canterbury. The increasing occurrence of natural disasters in populated areas emphasises our need to understand the economy’s transition during the recovery phase.
3. Canterbury Earthquake
Rebuilding the thriving Canterbury economy after the 2010–2011 earthquakes in the South Island of New Zealand was a priority for a region that contributed 12.3% of the national economy, the third-largest regional economy in the country (
StatsNZ 2021a,
2021b). The consequence of the damaging 22 February 2011 earthquakes was a total closure of the central business district (CBD) of Christchurch for up to two years (
Ministry for Culture and Heritage 2019). In addition to the widespread damage of the CBD, approximately 167 000 properties, or three-quarters of the housing stock in Canterbury, were damaged (
Wood et al. 2016, p. 3). The total replacement value associated with the earthquakes was estimated at NZD 40 billion (2015 values) and includes the cost of replacing residential, commercial and infrastructure goods (
Wood et al. 2016, p. 3).
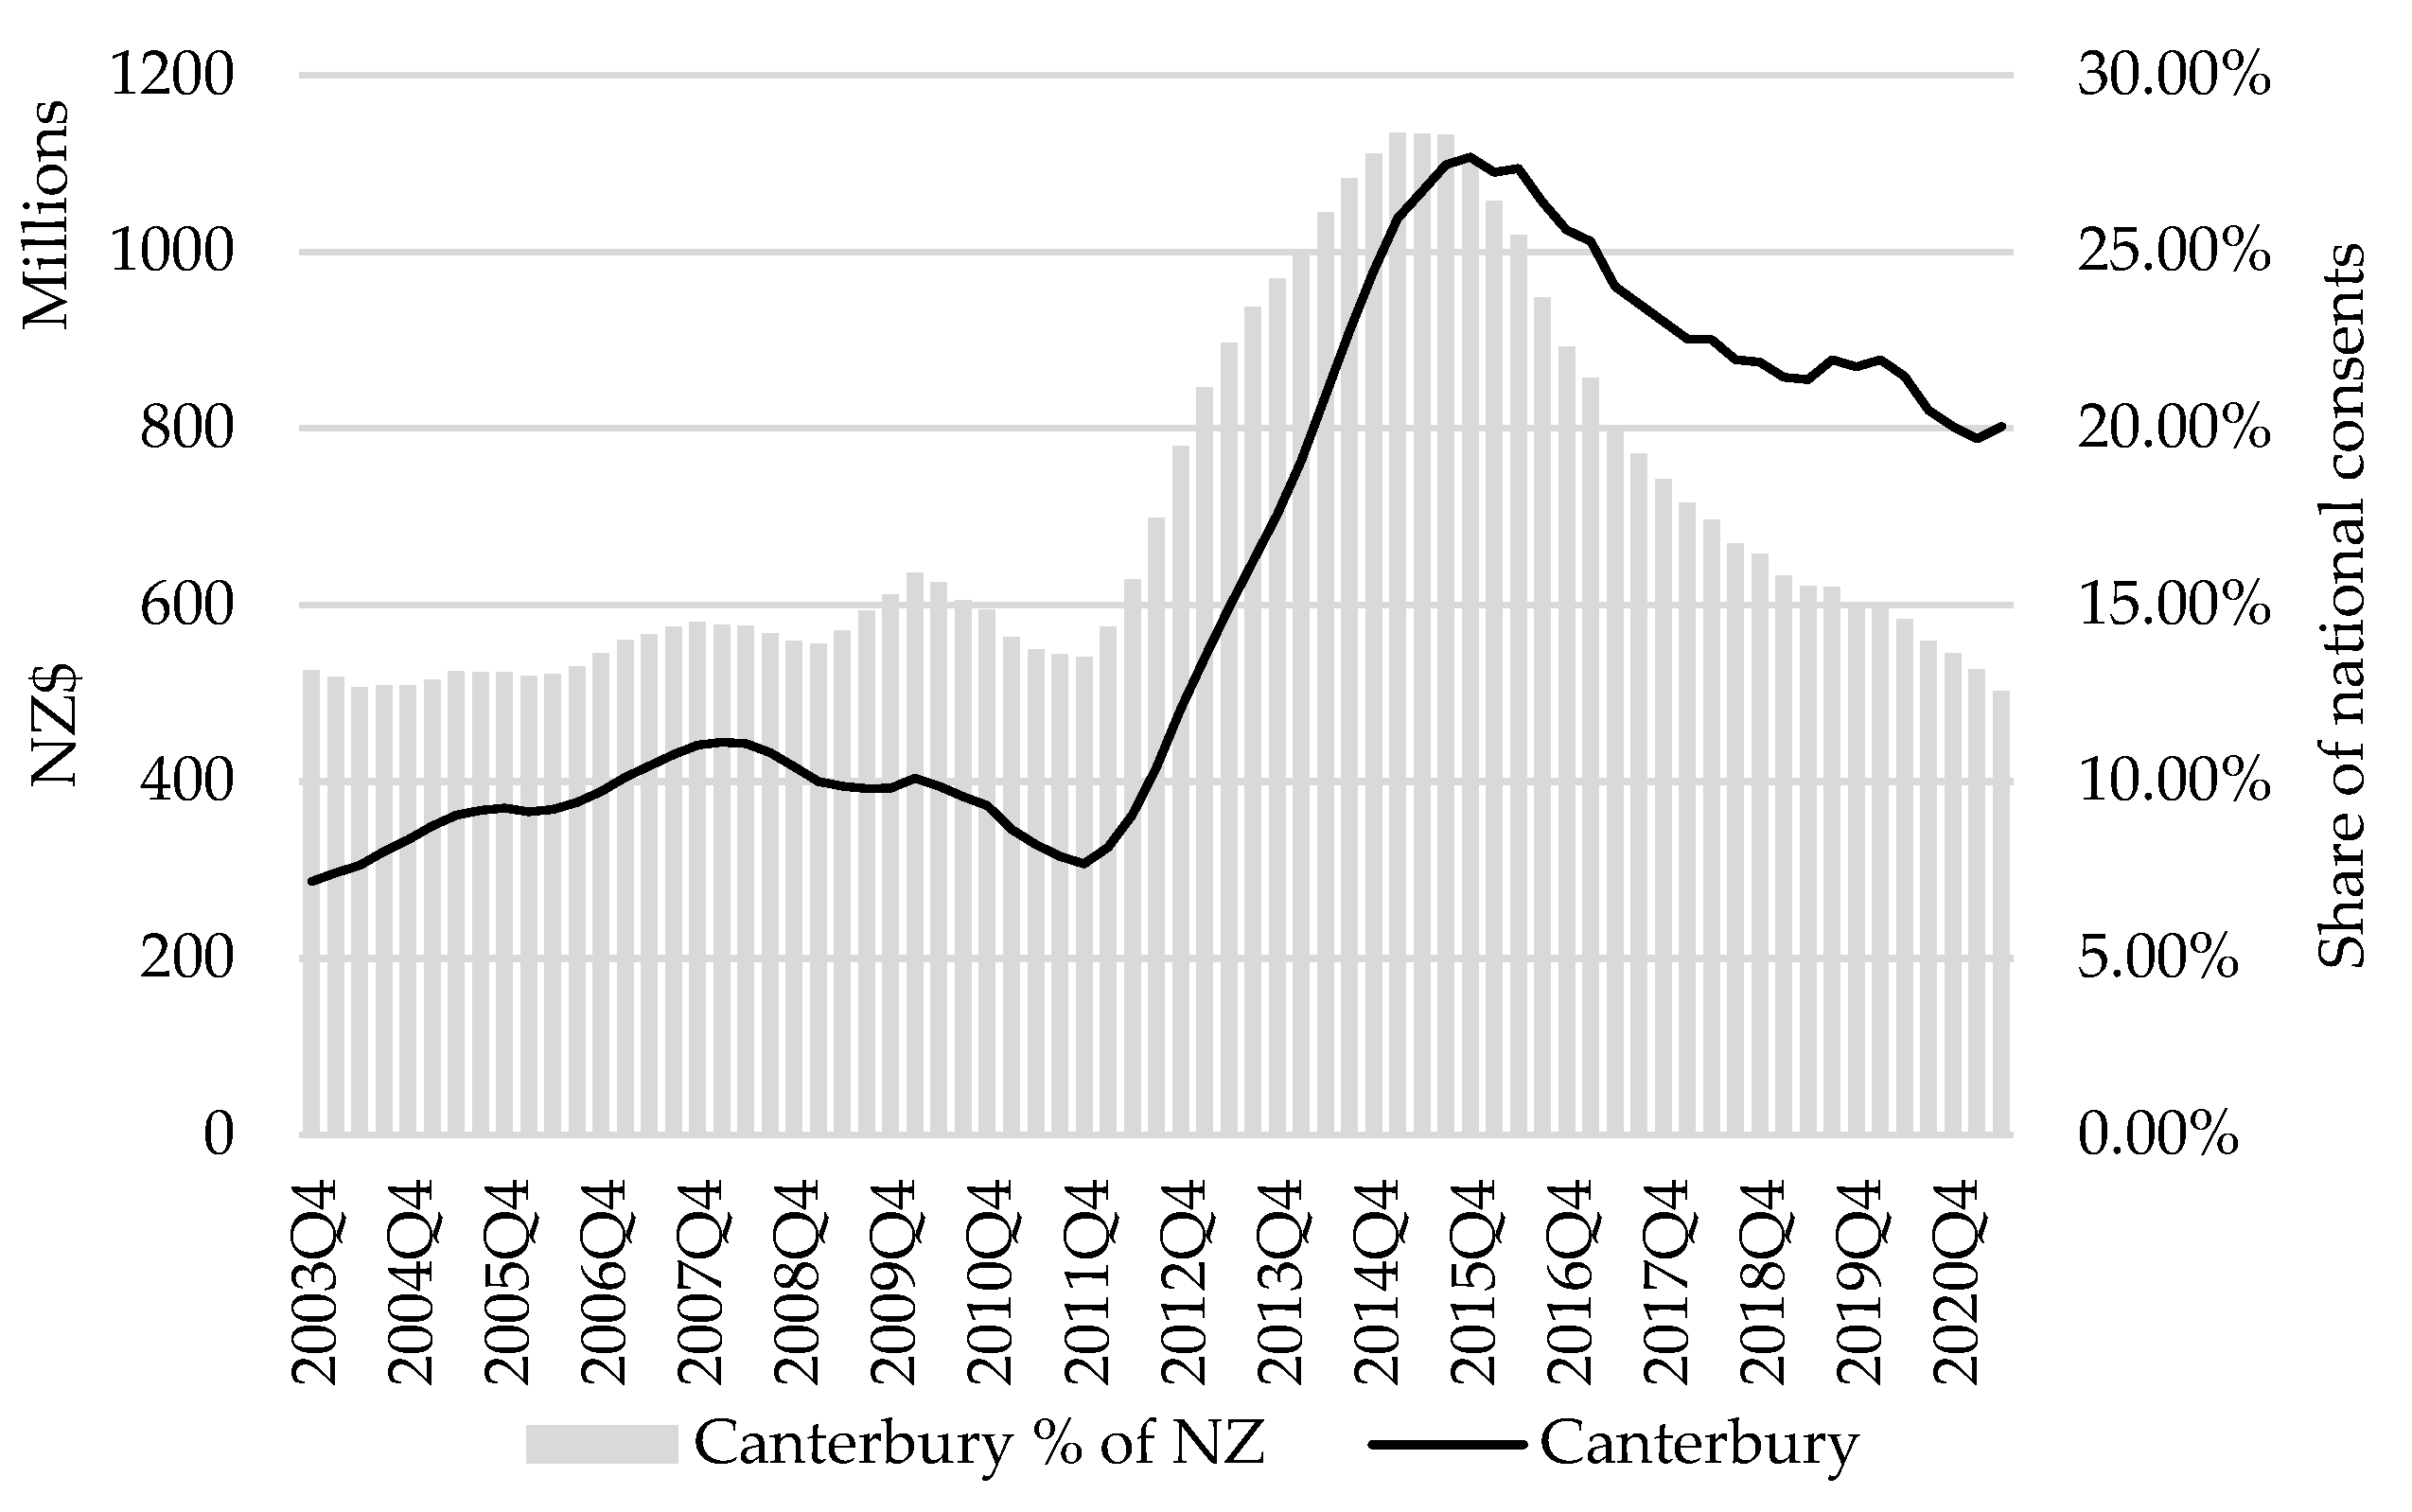
By the end of 2011 and the beginning of 2012, the value of building consents within Canterbury started to rise sharply in response to the recovery work (see
Figure 2). The regional share of building consents, illustrated as the shaded bar in
Figure 2, increased to 28% of the national share in 2015. In the following years, this share slowly declined but remained above the historical share of national consents.
Parker and Steenkamp (
2012) indicated that the period immediately after the earthquake was followed by lower business confidence, lower electronic card transactions, decreasing retail sales, lower capacity in accommodation and a decrease in guest nights. In contrast, investment intentions, employment opportunities, new job vacancies and earnings increased almost immediately (
Parker and Steenkamp 2012). This trade-off between loss and gain in economic activity resulted in limited aggregate losses on the regional economy during the 2012 reporting period since business activity rebounded rapidly (
Parker and Steenkamp 2012, p. 24). The Canterbury economy continued to expand even after the earthquakes, which supports
Albala-Bertrand’s (
1993) research that natural disasters in advanced economies tend not to reduce output, but support growth through the replacement of capital (
Horwich 2000, p. 524).
In normal conditions, construction responds to demand for additional space while, during the rebuild, the construction response is driven by the necessity to replace lost and damaged stock. Approximately 70 000 homes, or 42% of the total 167 000 homes damaged, were repaired without building consent (
Boot 2016), a value not captured in the building consent data in this paper. Nearly all structural and building work requires building consent, while some exemptions may apply for low-risk or minor work, and the definition of minor is at the discretion of the Council (
CCC 2019). After the earthquakes, many properties required repair work where minor damage occurred but did not require consent. With this limitation of the data in mind, building consents continue to provide the best available indication of increased levels of building activity associated with rebuilding the economy after the earthquakes.
4. Methodology
This research paper utilises regression and IO models to assess the performance of the underlying economy. The regional GDP data is sourced from the Statistics New Zealand Infoshare tool, while employment data is from Statistics New Zealand’s Linked Employer–Employee Dataset (
StatsNZ 2021a,
2021b). The dataset integrates existing longitudinal employer and employee data from monthly administrative data for individuals drawn from the Inland Revenue’s taxation system and business data from Statistics NZ’s Business Frame (BF).
Firstly, the association between building activity and economic activity is derived from the pre-and post-earthquake periods for the regional and national economies. This allows for the identification of the demand-driven level of building activity as it relates to the value of economic activity. The result reveals a distinct change in the association before and after the earthquakes. In both cases, the association remains positive, an observation with consensus in the existing literature (see
Markstein 2017;
Gundes 2011;
Miles 2009;
Wylie 1996;
Strassmann 1970;
Turin 1969). The long-term validity of this relationship is tested through various association scenarios. This approach identifies the demand-driven building activity for each scenario (see Equation (1)).
where Db
1n is the value of demand-driven building activity for scenario 1 at time n. (W
n/R
n)
1 represents the association between building activity and economic size for period n, while c is the geographical value for the economy in the corresponding period (n). The difference between the estimated value for demand-driven building activity and the actual value of building activity, as captured by building consent values for the corresponding period, represents the investment stimulus. In other words, it represents the deviation from the long-term average and the injection of government and insurance funds to support the recovery and rebuilding of the built environment.
Applying the building activity and GDP association for various scenarios enables the identification of demand-driven building activity. The difference between the estimated value of demand-driven building activity and the value of the actual building is incorporated into an IO model to assess the performance of the underlying economy.
Secondly, the underlying economic value is calculated by applying an IO model that quantifies the economy-wide benefit of the investment above the demand-driven activity level. The construction sector is one of the most dynamic sectors, is highly visible and has strong linkages with other industries (
Pheng and Hou 2019). The economy-wide benefit is separated from the current official regional economic data by using an IO model to account for the linkages with other industries. The IO tables describe sales and purchase relationships within an economy by applying the flows of final and intermediate goods and services according to industry outputs (
OECD 2021). IO models are frequently used to assess the effect on the economy from building-related investments (
Hallegatte et al. 2011;
Pietroforte and Gregori 2003;
Gundes 2011). The advantage of the IO model is that it can be used to estimate the effect of changes within the economy resulting from economic stimulus activity (
Van Wyk et al. 2015;
Dyason et al. 2019) or changing consumer behaviour (
Dyason et al. 2021). It is a matrix that provides a framework of the economy, showing interdependencies within the regional economy for a particular year (
Round 2003, pp. 12–14). Economists use it to demonstrate the economy’s structure and calculate the economy-wide effect of investments or shocks (
Polo and Valle 2012, p. 227). Using the IO matrix, the technical coefficient and output multipliers are derived.
The structure of an IO model makes provision for the purchase of intermediate inputs on the one end and the supply of intermediate and final outputs on the other.
“As a result e total output of activity 1 (X
1) is, therefore, the sum of the intermediate outputs, plus the final demand/output of sector 1 (F
1) (
Van Wyk et al. 2015):
where A
ij = x
ij/X
j is the technical coefficients defined as the quantity of intermediate inputs required by a particular sector from another sector to supply a one-dollar unit of output. To extend the application across all industries, Equation (1) can be re-written in matrix format as:
where F is a vector of final demand, I is an n × n identity matrix, A is the technical coefficient matrix, and X is a vector of production. To determine the impact of a shock to final demand (F) on output or production (in this case, changes in consumer spending and displacement), the Leontief inverse is applied, that is:”
The IO model framework makes it possible to quantify the economy-wide impact of a shock on the economy. This framework can also be extended and applied at different levels of an economy, for example, by estimating the economy-wide benefit from additional investment in the built environment.
Utilising the IO model ensures that the economy-wide impact (i.e., direct, indirect and induced) of the stimulus value associated with higher building activity is removed. The gross value added (GVA) and employment values are subsequently removed from the official regional data for each period, revealing the value of the underlying economy. In other words,
where GVA
eu represents the value of the underlying economy, Dbn1 (X)
n represents the economy-wide injection from the stimulus activity and [GDP-t]
n represents the current official value of economic activity
less taxes (t).
The underlying value represents the difference in the value of building activity for a period (n) less the estimated value of the demand-driven building activity. Employment is calculated similarly to the economic activity mentioned above.
Within the model, the value of building activity is quantified annually with prices not adjusted for inflation. This allows for comparisons across different periods since the transactions within the IO model are based on nominal values. The 2013 and 2017 Canterbury IO structures are applied for the analysis. The IO model is done separately for each year from 2012 to 2020.
5. Results
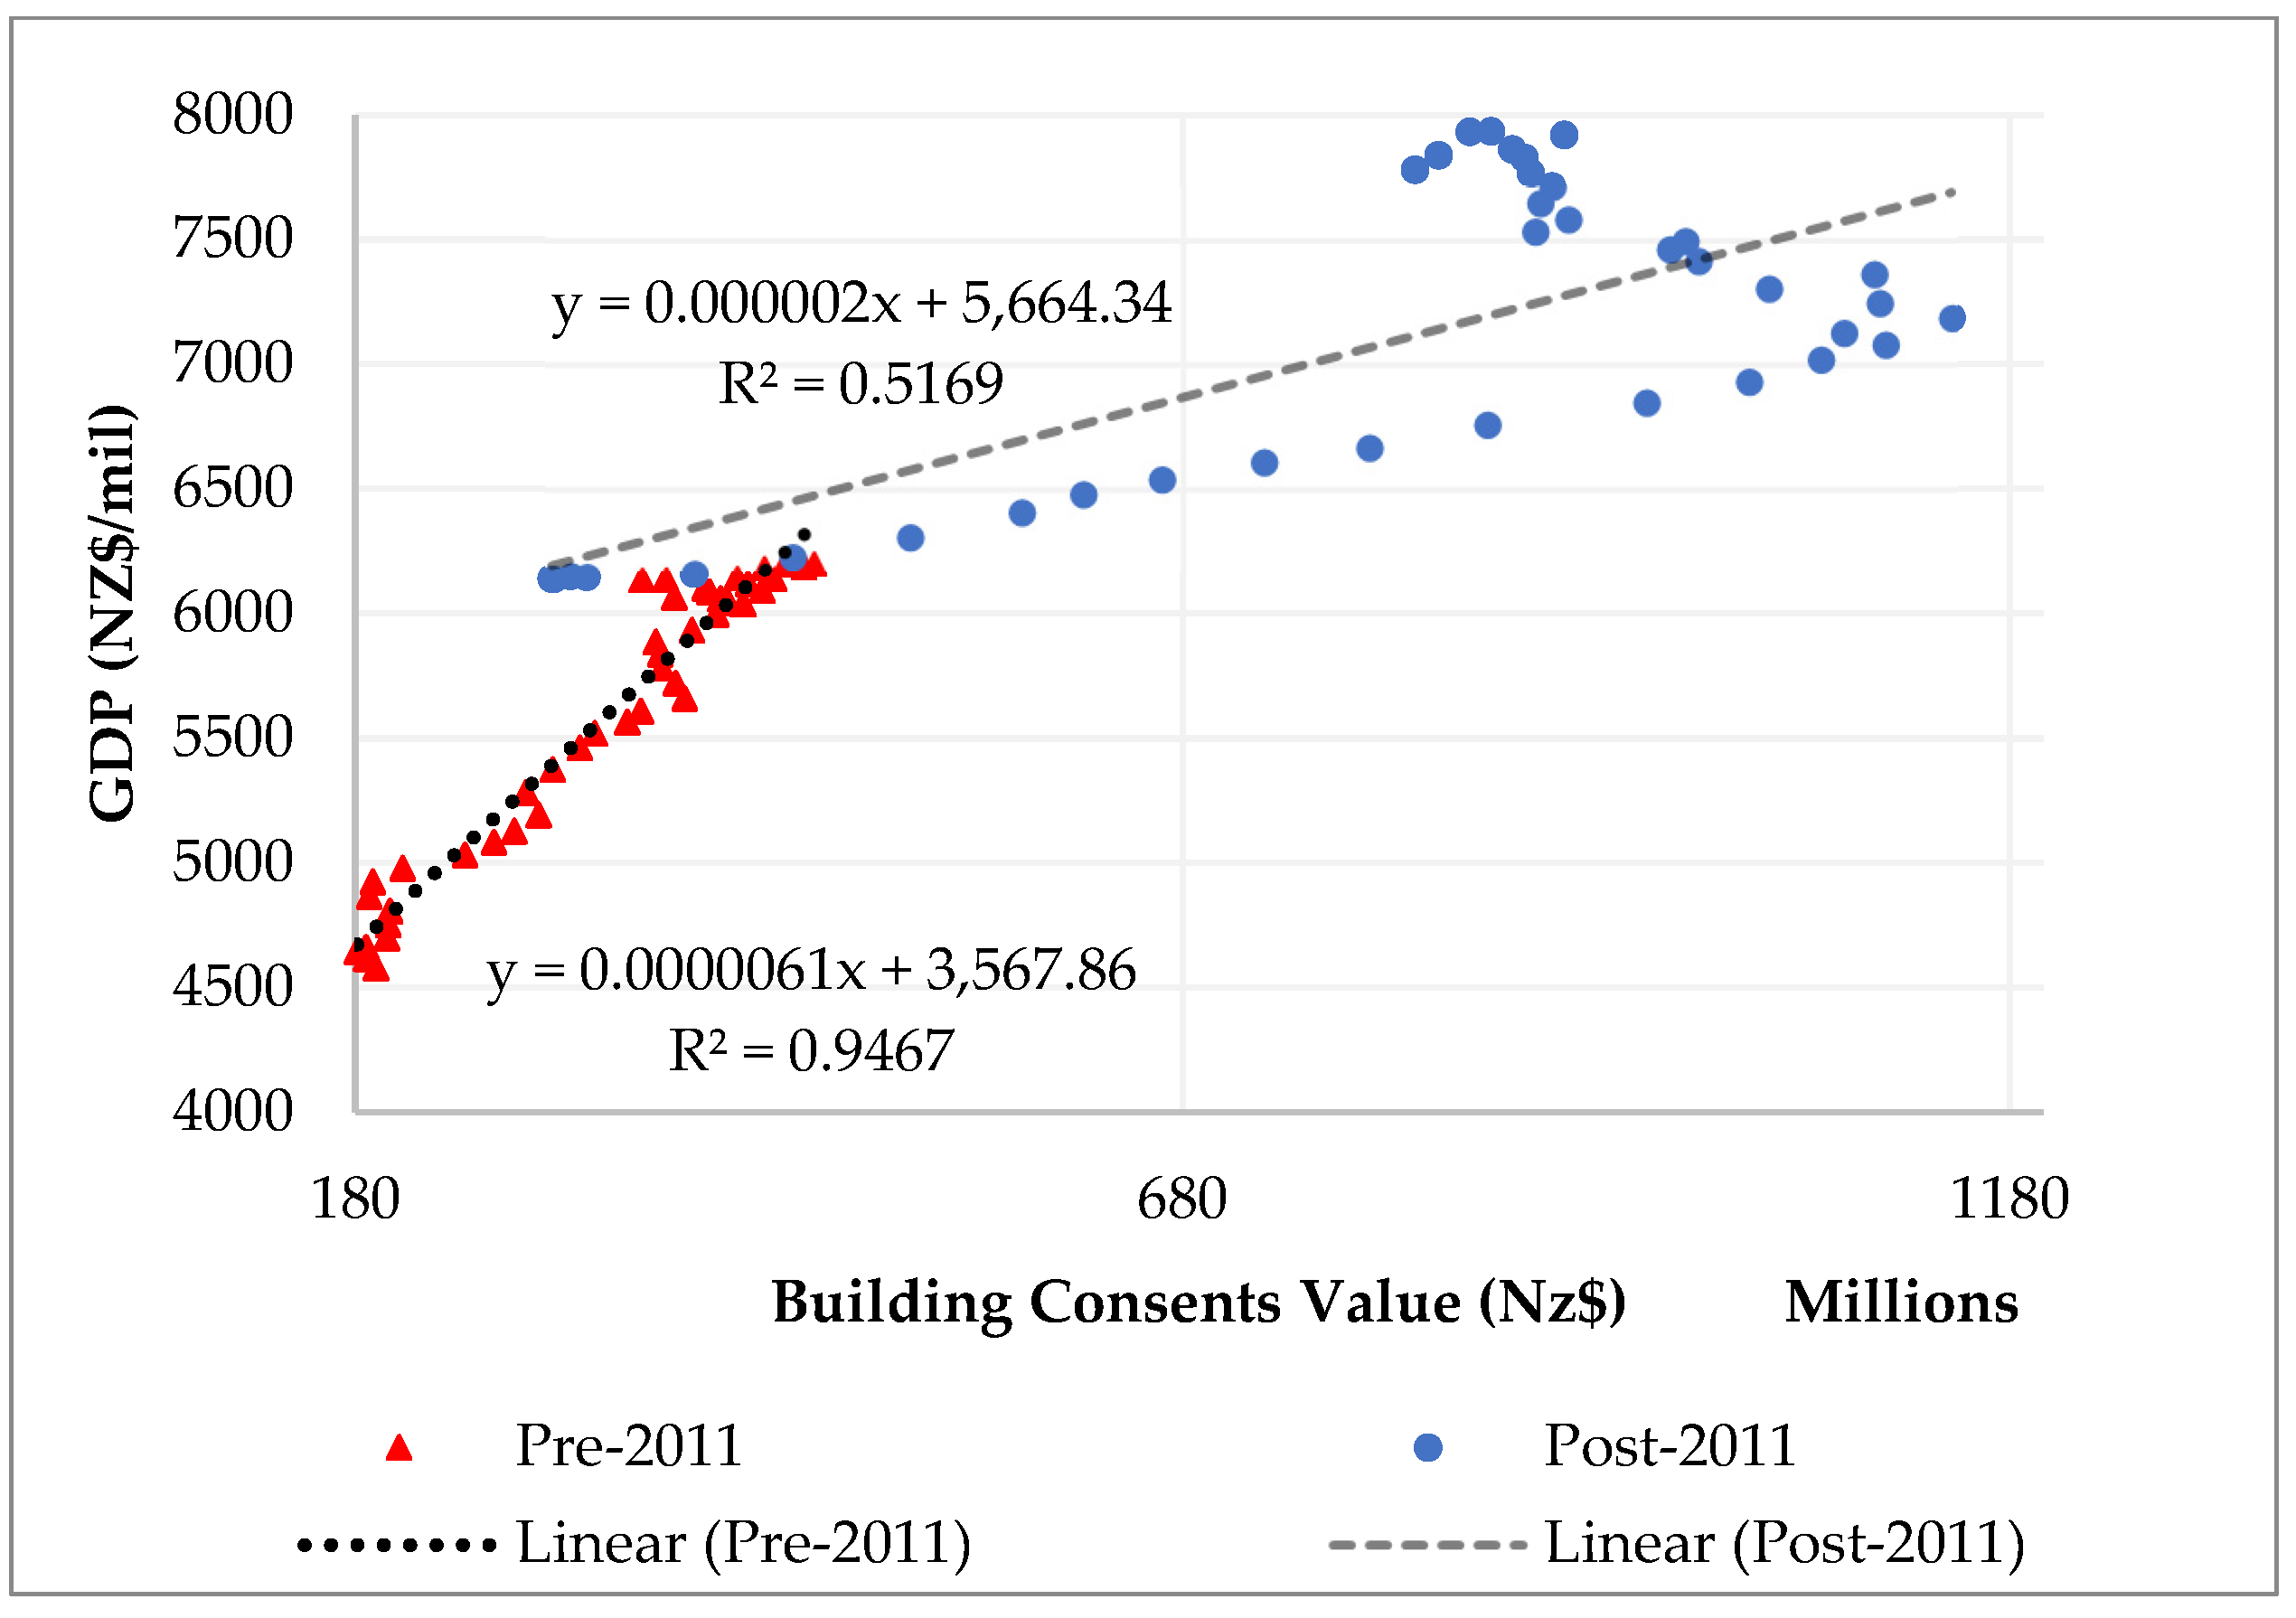
Understanding how the economy responds during the recovery period is often hidden under large investments that are meant to drive recovery. In comparison, the period that follows has lower investment and low growth. This does not necessarily highlight the true state of the economy. The recovery period after the Canterbury earthquake resulted in significant building investment, which changed the normal level of building activity and inflated it above what it was during the period pre-2011. This change in building activity in relation to the size of the economy is calculated with linear regression and illustrated in
Figure 3. A closer inspection of this relationship reveals a change at the time of the 2011 earthquake. This change outlines two periods with distinct differences in results reflecting a pre- and post-2011 association. The pre-2011 period reveals a positive association between GDP and the value of building consent with low variance and a high R
2. This association changed significantly after 2011, when the same analysis revealed a larger variance and lower R
2.
Drawing on this association, the demand-driven level of building activity expected to occur if the earthquake had not taken place is estimated.
Various scenarios are presented based on different associations between building activity and economic activity. Due to uncertainty and possible localisation economics, various options are empirically examined and compared for completeness. Option one applies the pre-earthquake association between economic activity and building activity for Canterbury up to 2021. Option two applies the post-earthquake association, while option three postulates the association between building activity and economic activity mirrors the trends in the national economy throughout the entire period. The counterfactual level of building activity is assumed to reflect the broader national building and economic activity where (Wn/Rn) for Canterbury is similar to the national economy. This scenario assumes that demand-driven building activity would converge with national trends over the long-term. This is observable when the actual value of building activity equals Option 3.
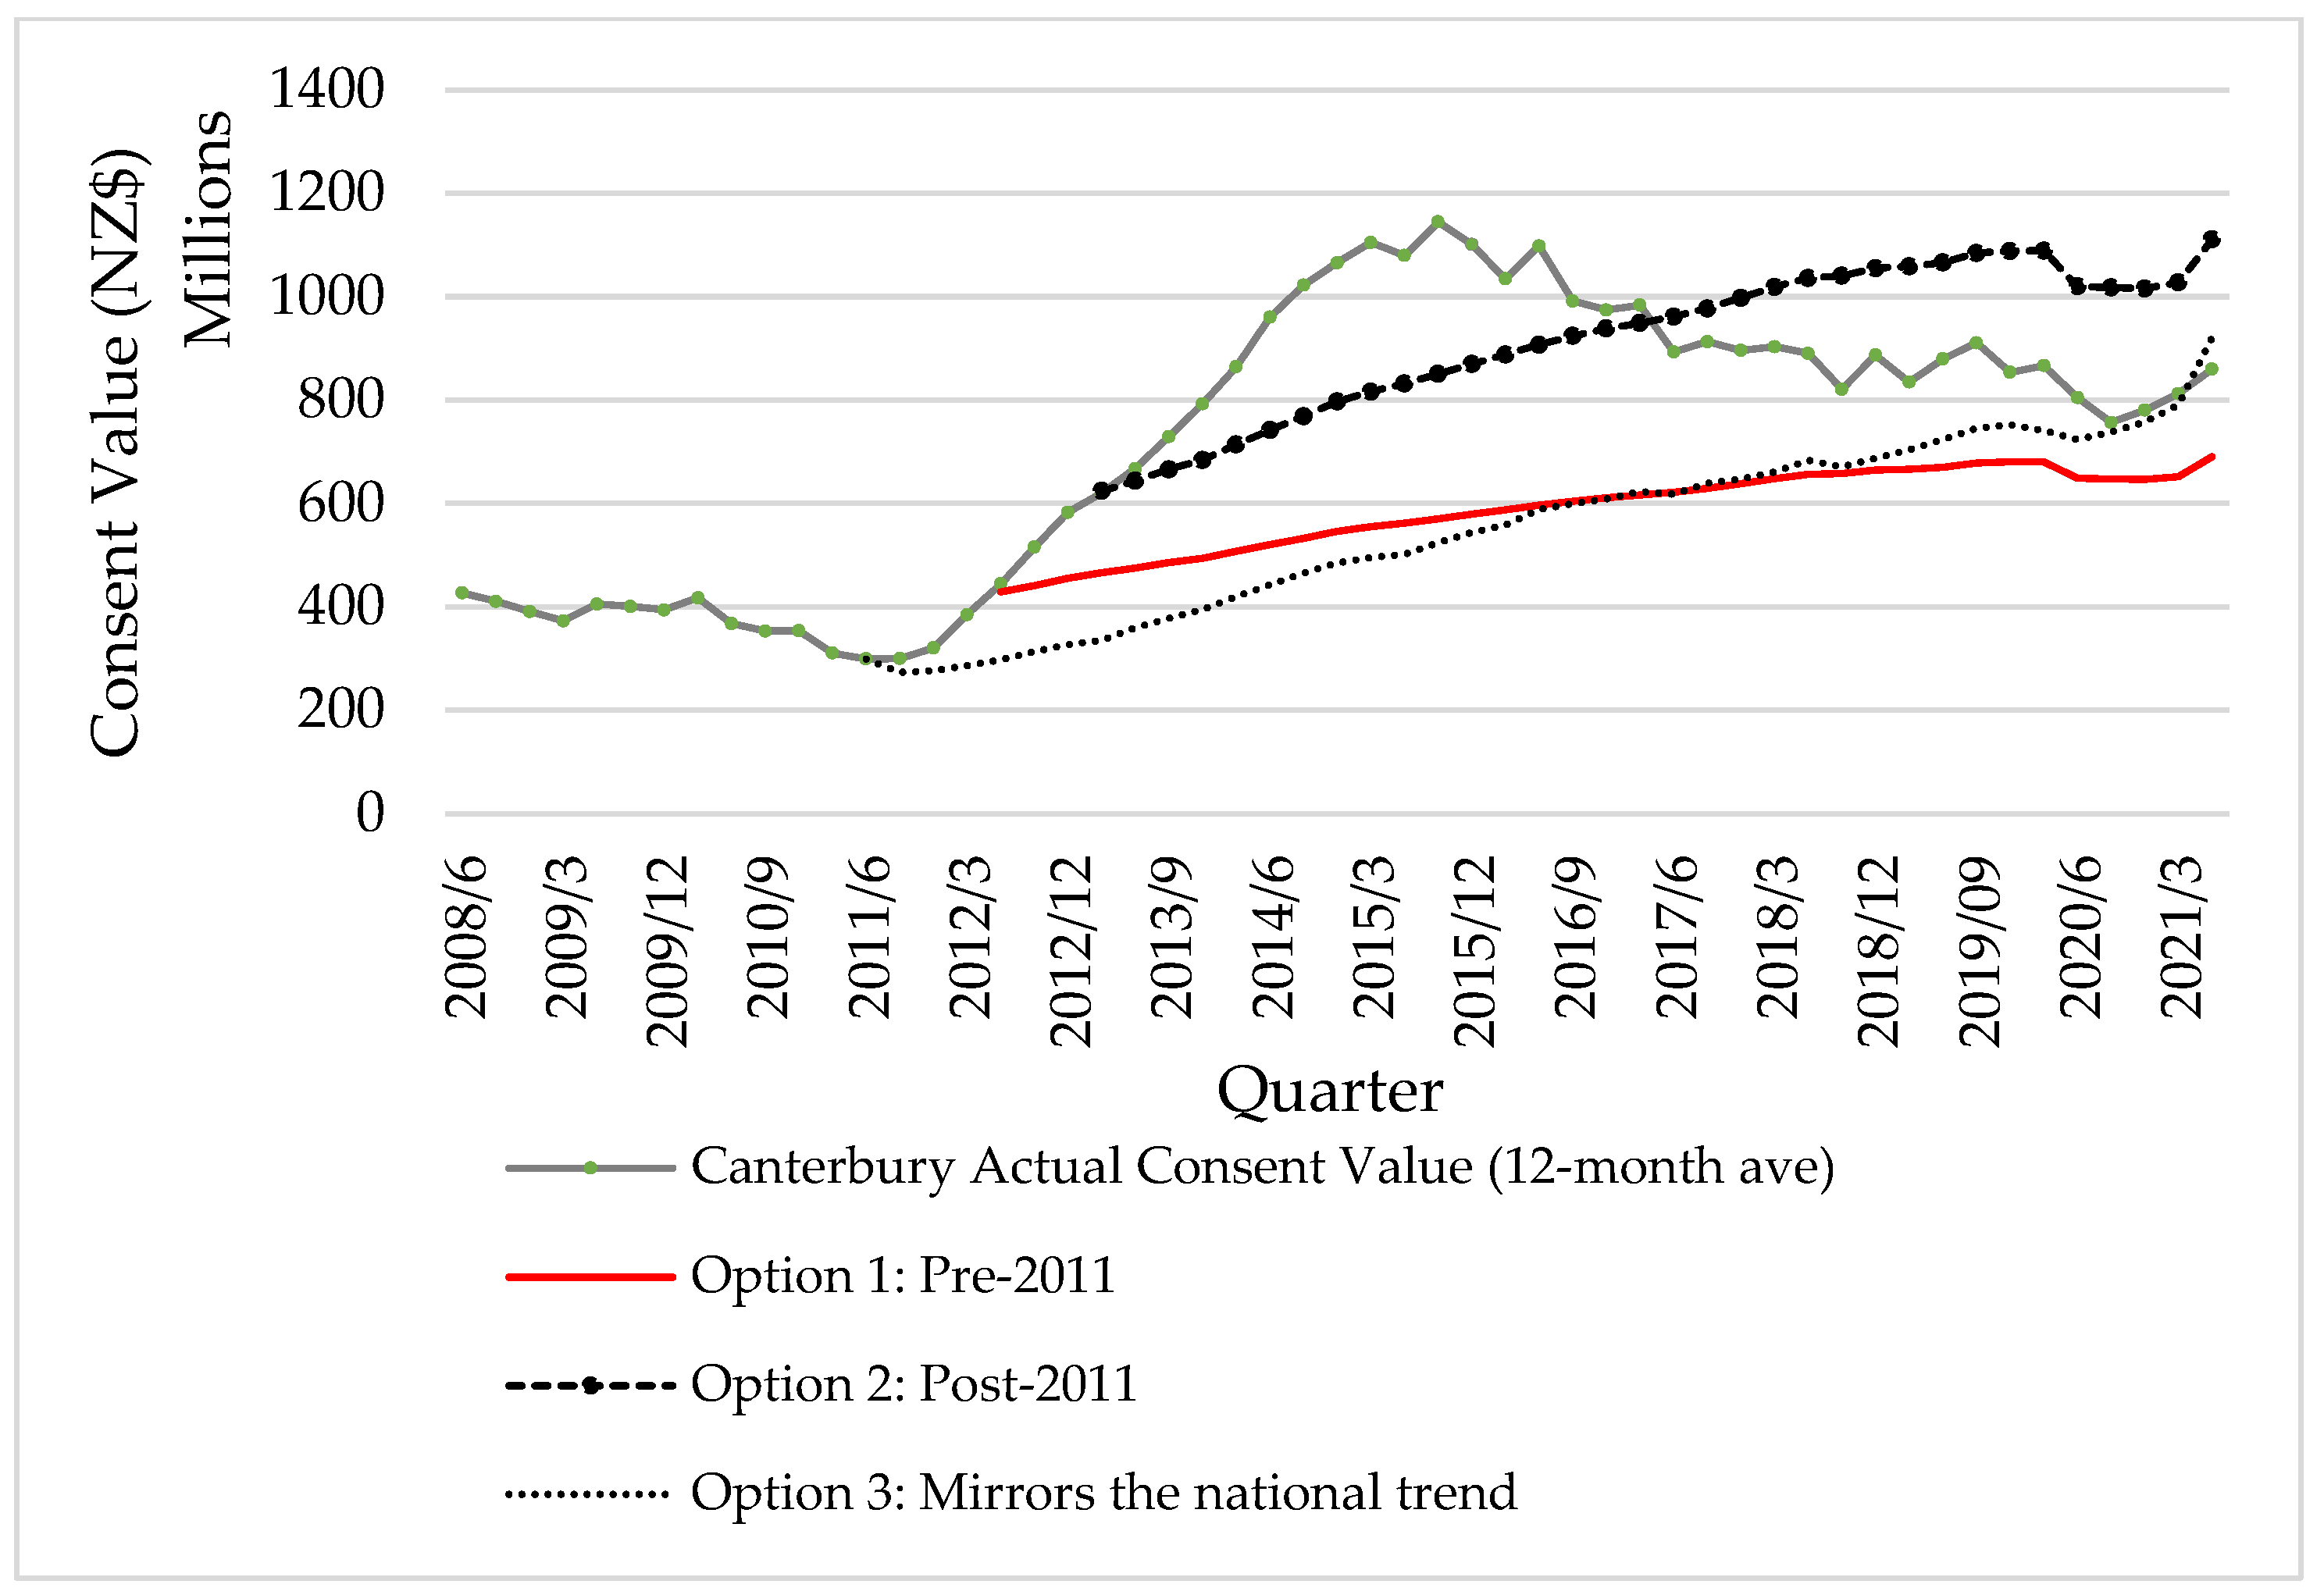
Figure 4 illustrates three scenarios of demand-driven building activity as a 12-month moving average. The results from the options are compared to the actual consent value for Canterbury When the values converge, a return to demand-driven activity is reached—an indication that the investment stimulus from the earthquake has come to an end.
The estimated demand-driven level of building activity for Option 1 remains below the actual consent value throughout the period of assessment. The gap between Option 1 and the actual building value emphasises the value of the rebuild and the scale of the stimulus investment and how it pushed building activity far above the norm. A gradual increase in demand-driven building activity is evident. However, this gap slowly declines from 2018, and although convergence has not yet taken place, the gap has been reduced. The results for Option 1 suggest that long-period equilibrium is not yet achieved.
Option 2 estimates a long-term continuation of high construction activity remaining above the results from Option 1. During this period, the value of building activity remains significantly higher than before the earthquake (see
Figure 4) and continues its rise. Option 2′s building activity ultimately reaches cross-over with actual building activity in 2017, suggesting that this option and association do not represent the value of demand-driven building activity.
Finally, Option 3 implies that the Canterbury economy experienced building activity similar to what transpired in the national economy from 2011 onwards. The results reveal a slightly more extended recovery period after the GFC and into 2011; however, the value of building activity soon increased and continued to grow up until early 2020, when COVID-19 and lockdowns affected the market. This result suggests that the large-scale stimulus had subsided towards the end of 2020, as this option converges with actual building activity. This option supports the expectation that coupling of the actual building activity and the demand-driven activity will occur, evident from the middle of 2020 in
Figure 4. As a result, the level of building activity prevalent in the market was now driven by normal building activity.
The results suggest that either one of Option 1 or 3 reflects the likely demand-driven level of building activity, with both currently very close to the actual level of building consent in the region. The results imply that the rebuild stimulus had subsided nearly 10 years after the earthquake as the demand-driven level of building activity is the sole driver of actual building activity.
In order to assess the growth performance of the underlying economy through the IO model, building activity above the demand-driven level requires removal.
The difference between the actual building activity and the estimated demand-driven building activity represents the value of the underlying economy. The performance of the underlying economy is assessed through the IO model, with both Options 1 and 3 evaluated for completeness.
Table 1 illustrates the difference between the values for the two options compared to the actual annual consent values.
The results from the IO model are summarised in
Table 2, with results up to 2021. The results reveal the economy-wide effect of building activity above the demand-driven level. The IO model reveals the economic value as a gross value added (GVA)—essentially GDP
less taxes.
Removing the employment and GVA results in
Table 2 from official GDP and employment data for the region for the corresponding year reveals the value of the underlying economy without the stimulus injection.
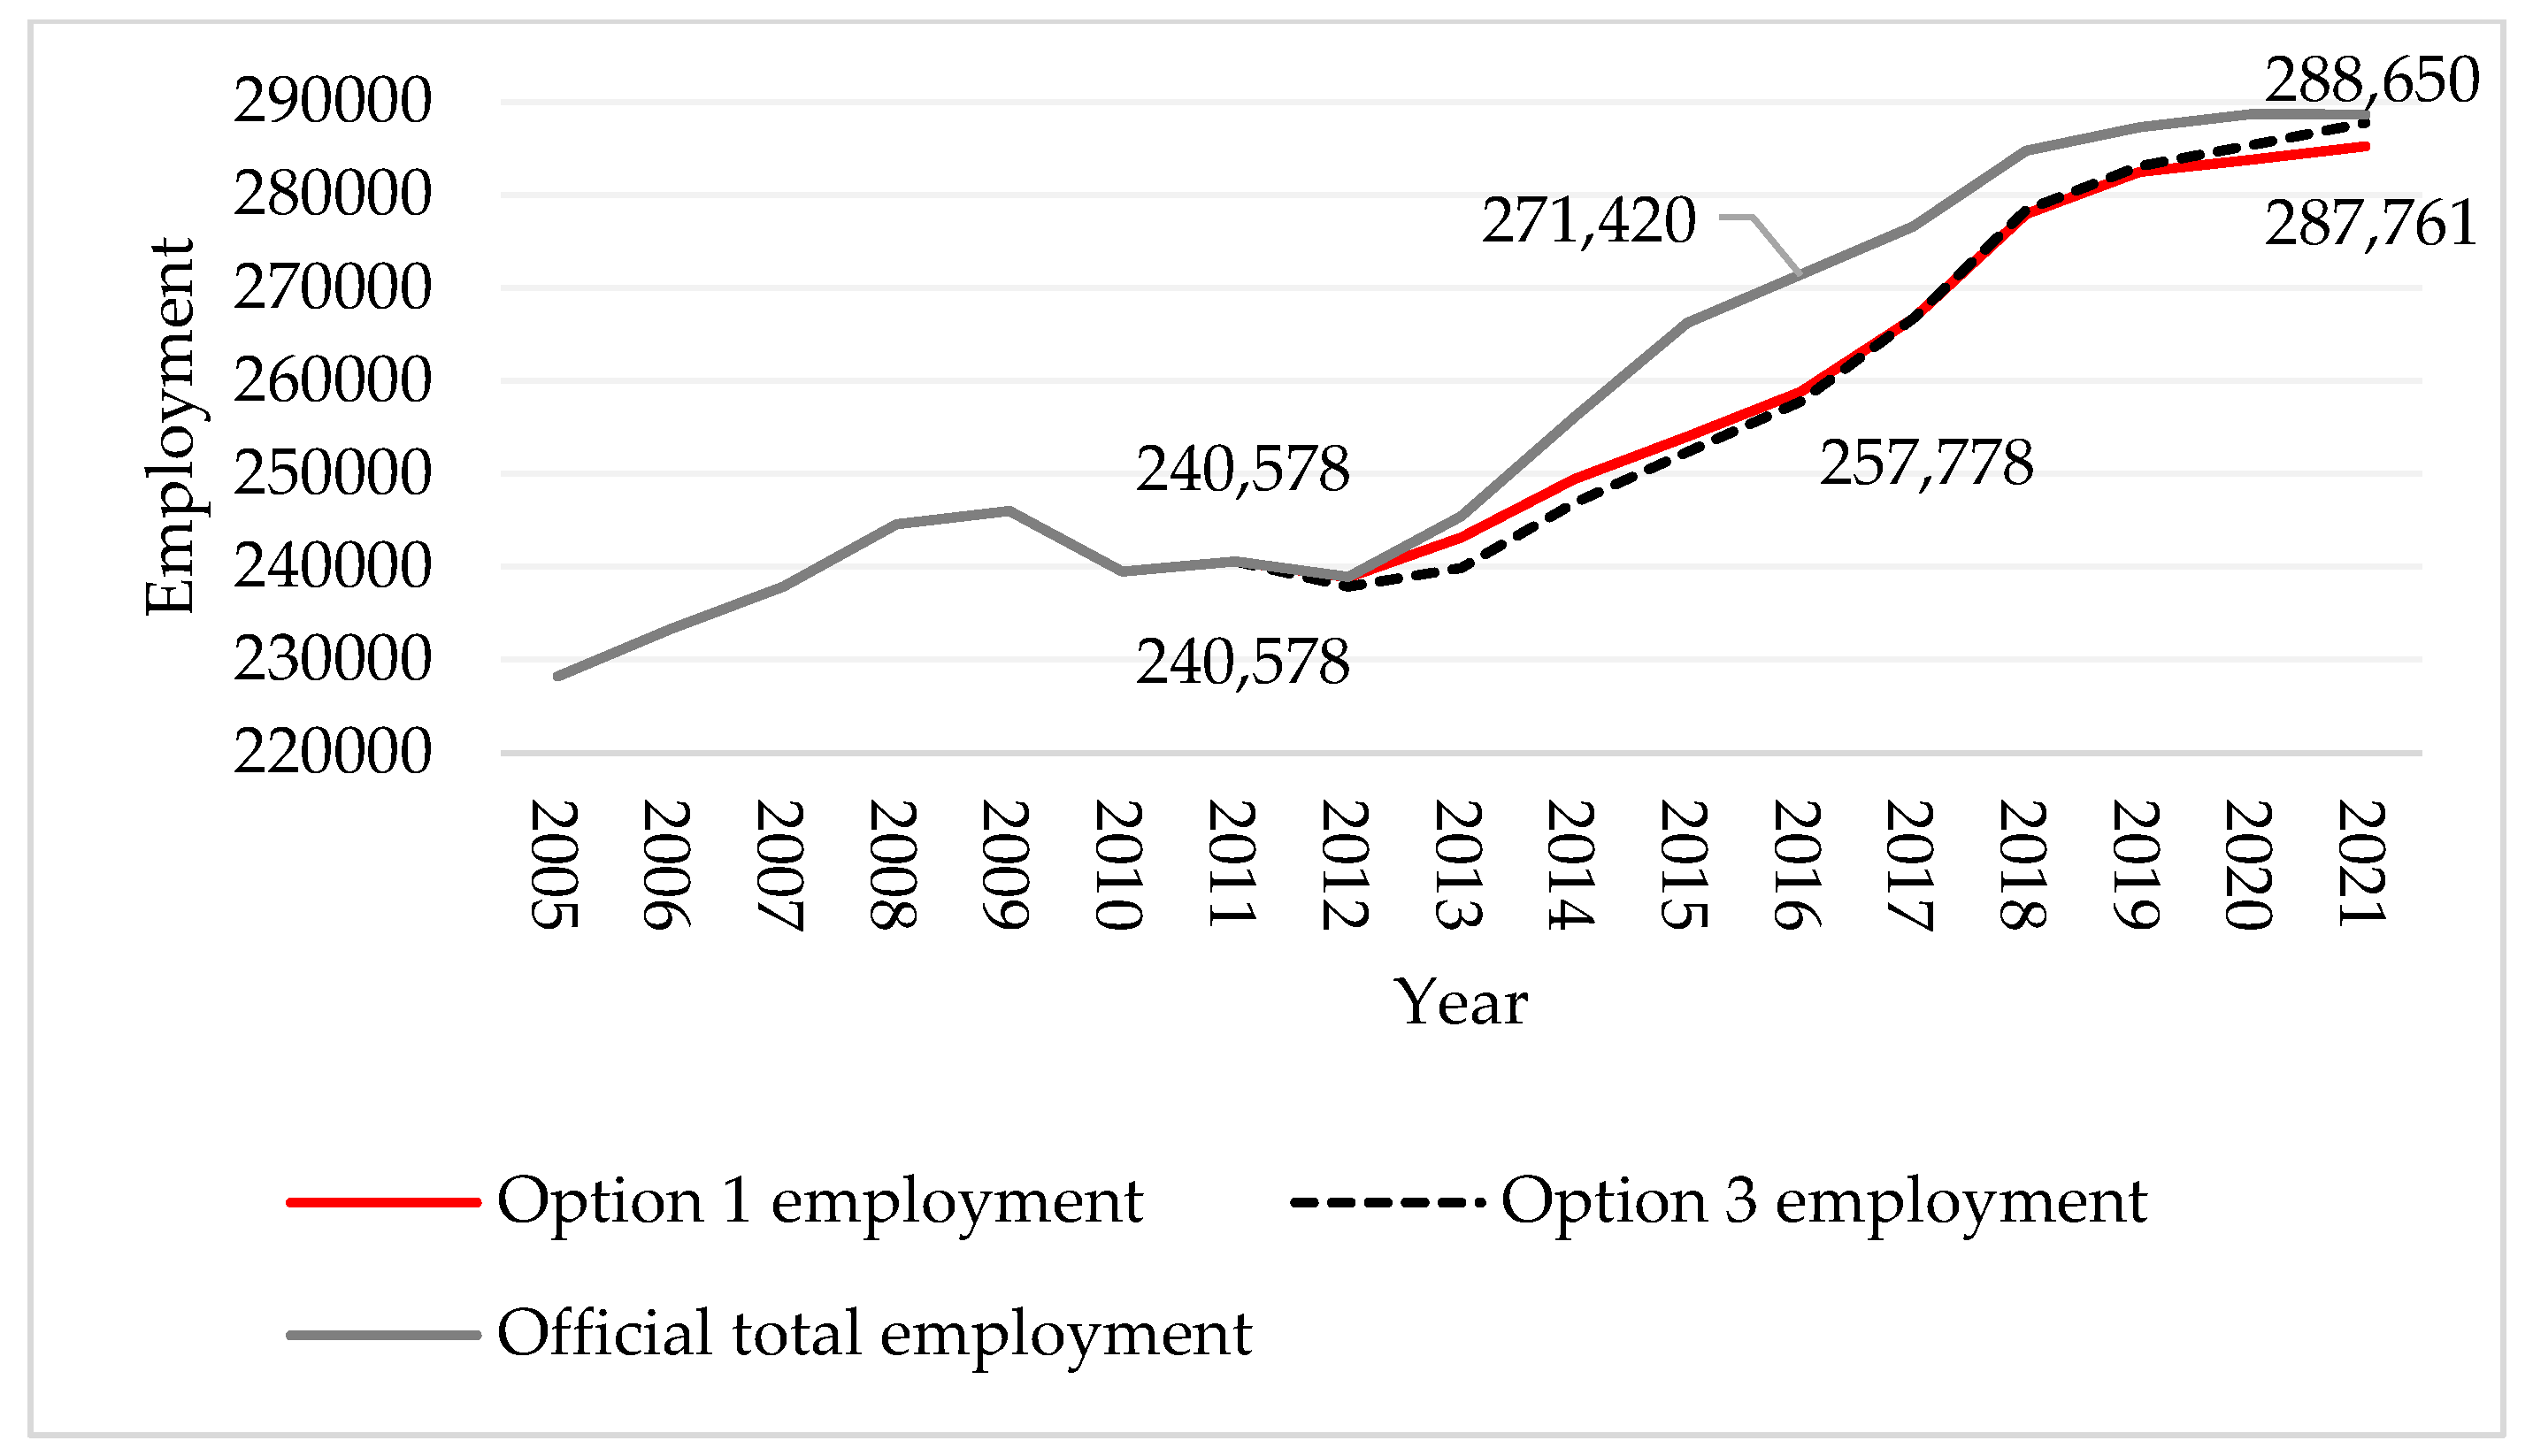
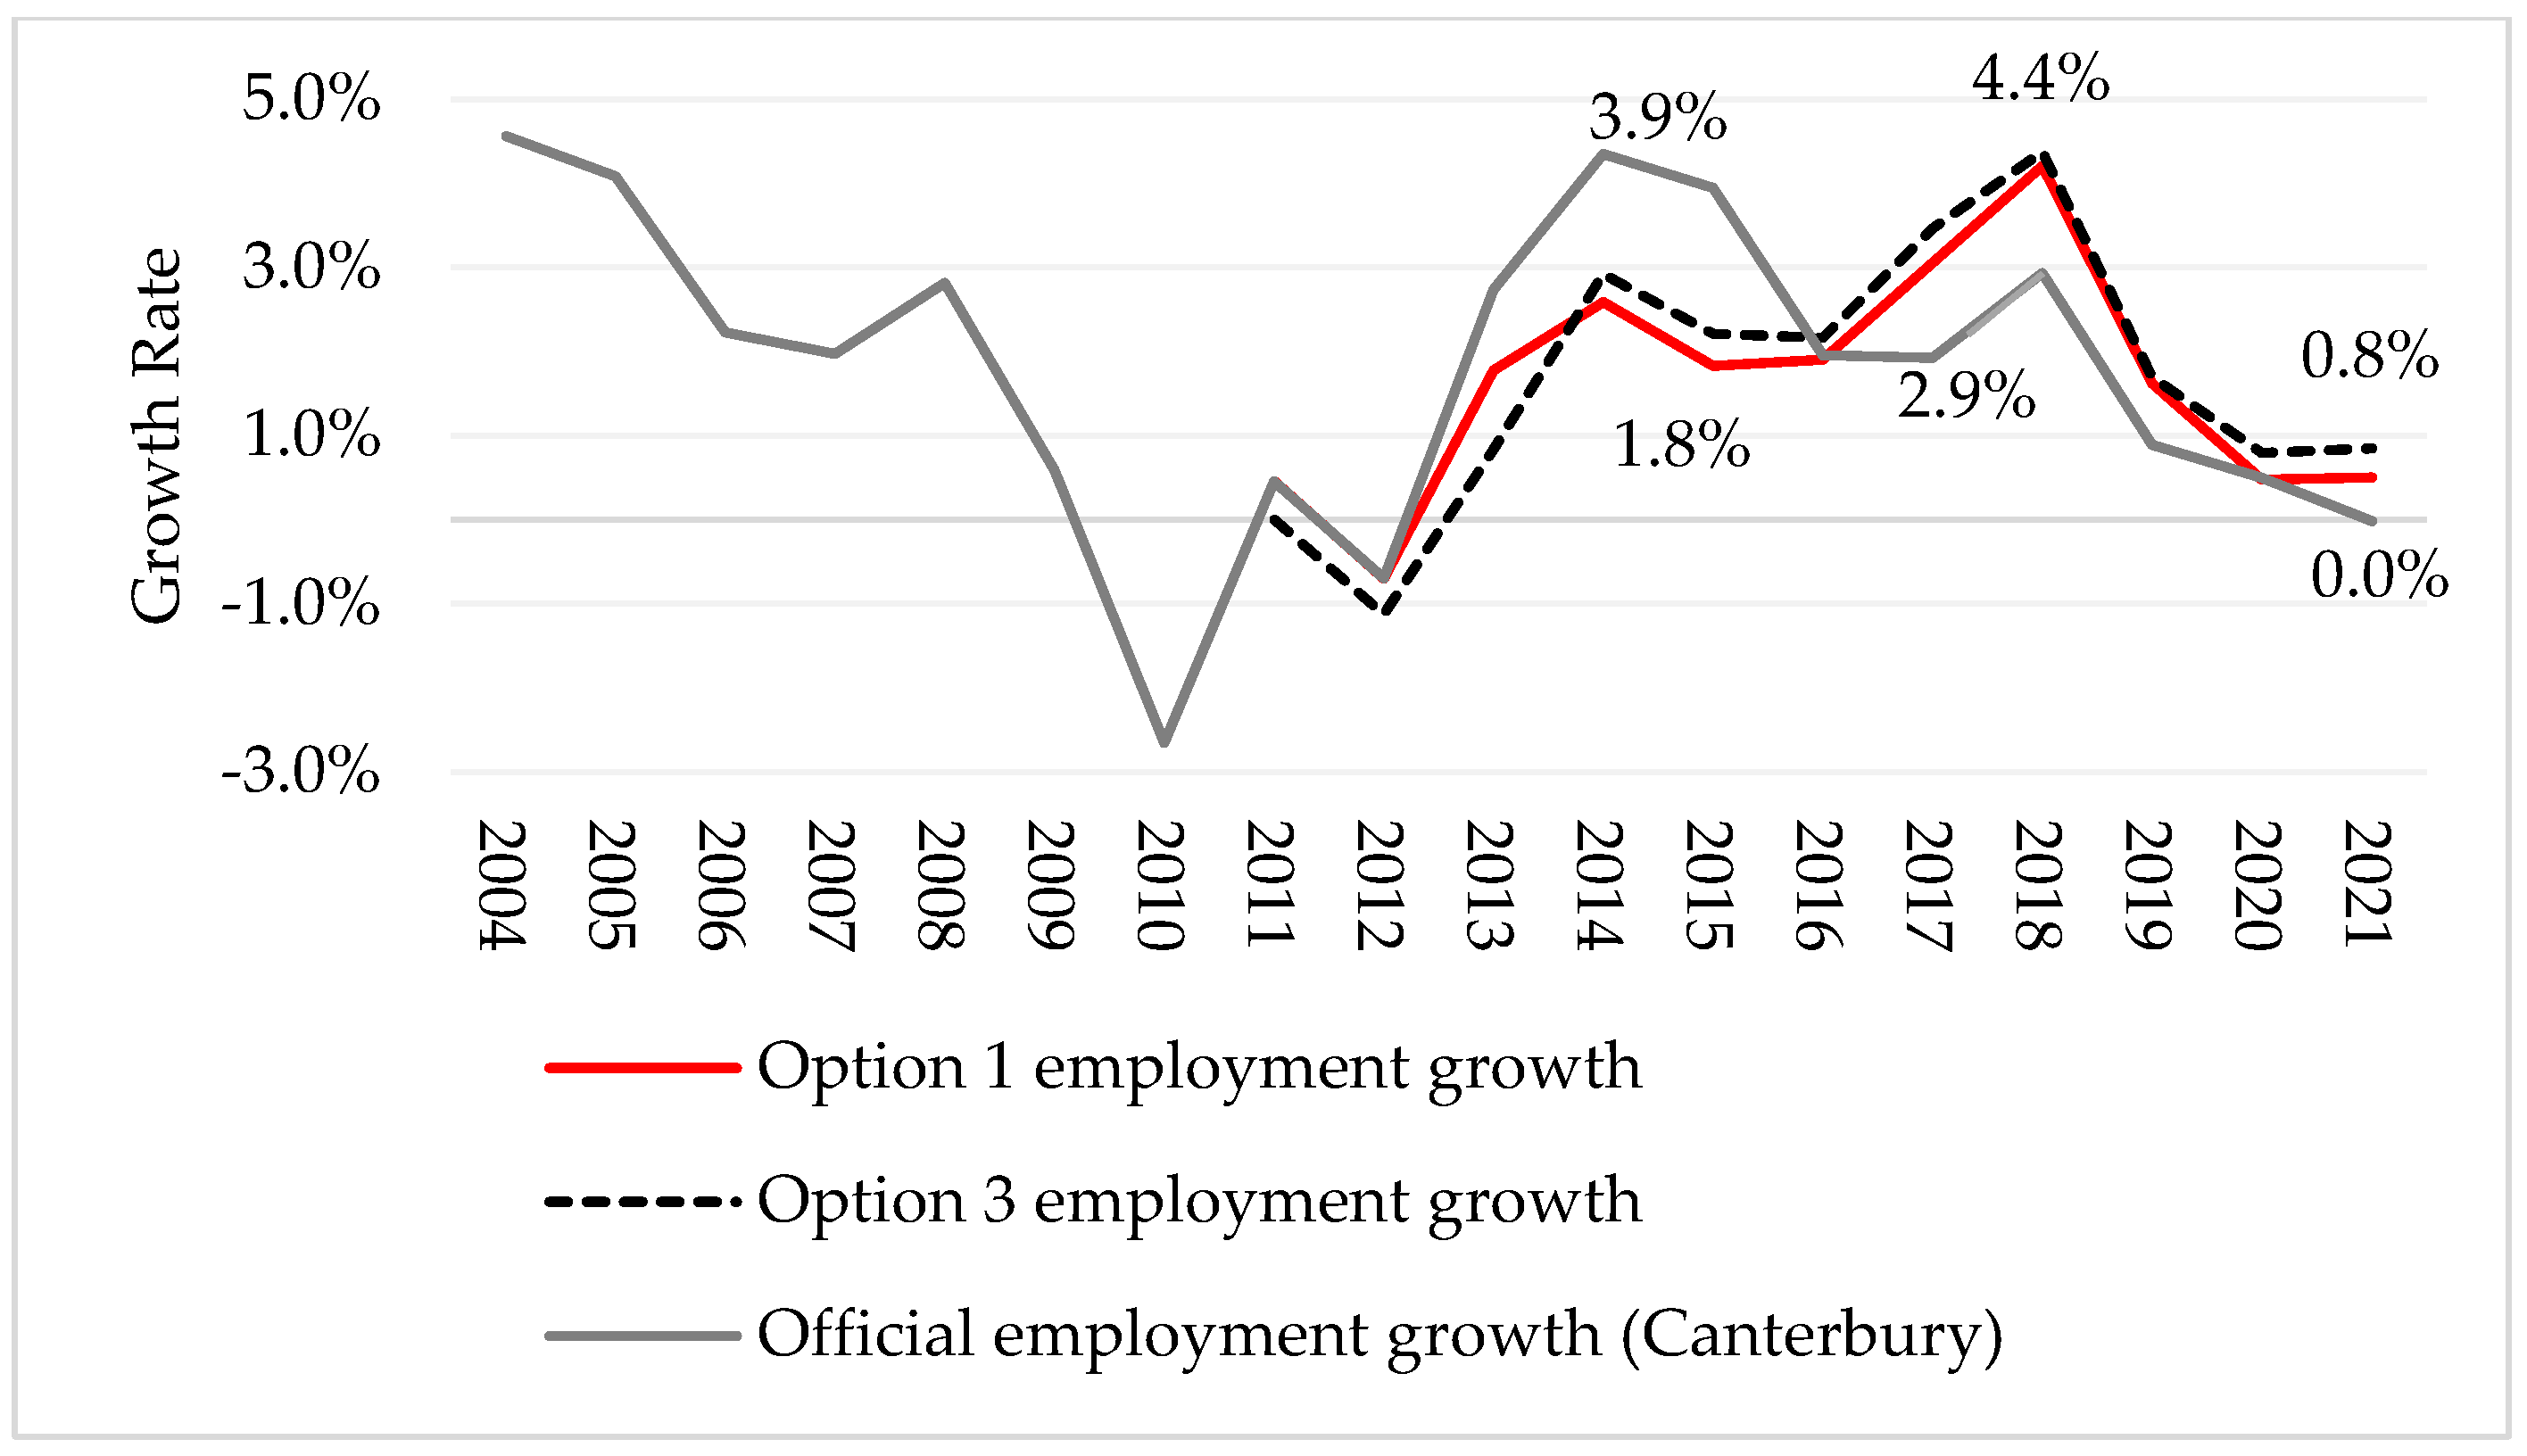
Figure 5 and
Figure 6 compare the actual level of employment per year from 2005 to 2021 with the employment estimate of the underlying economy.
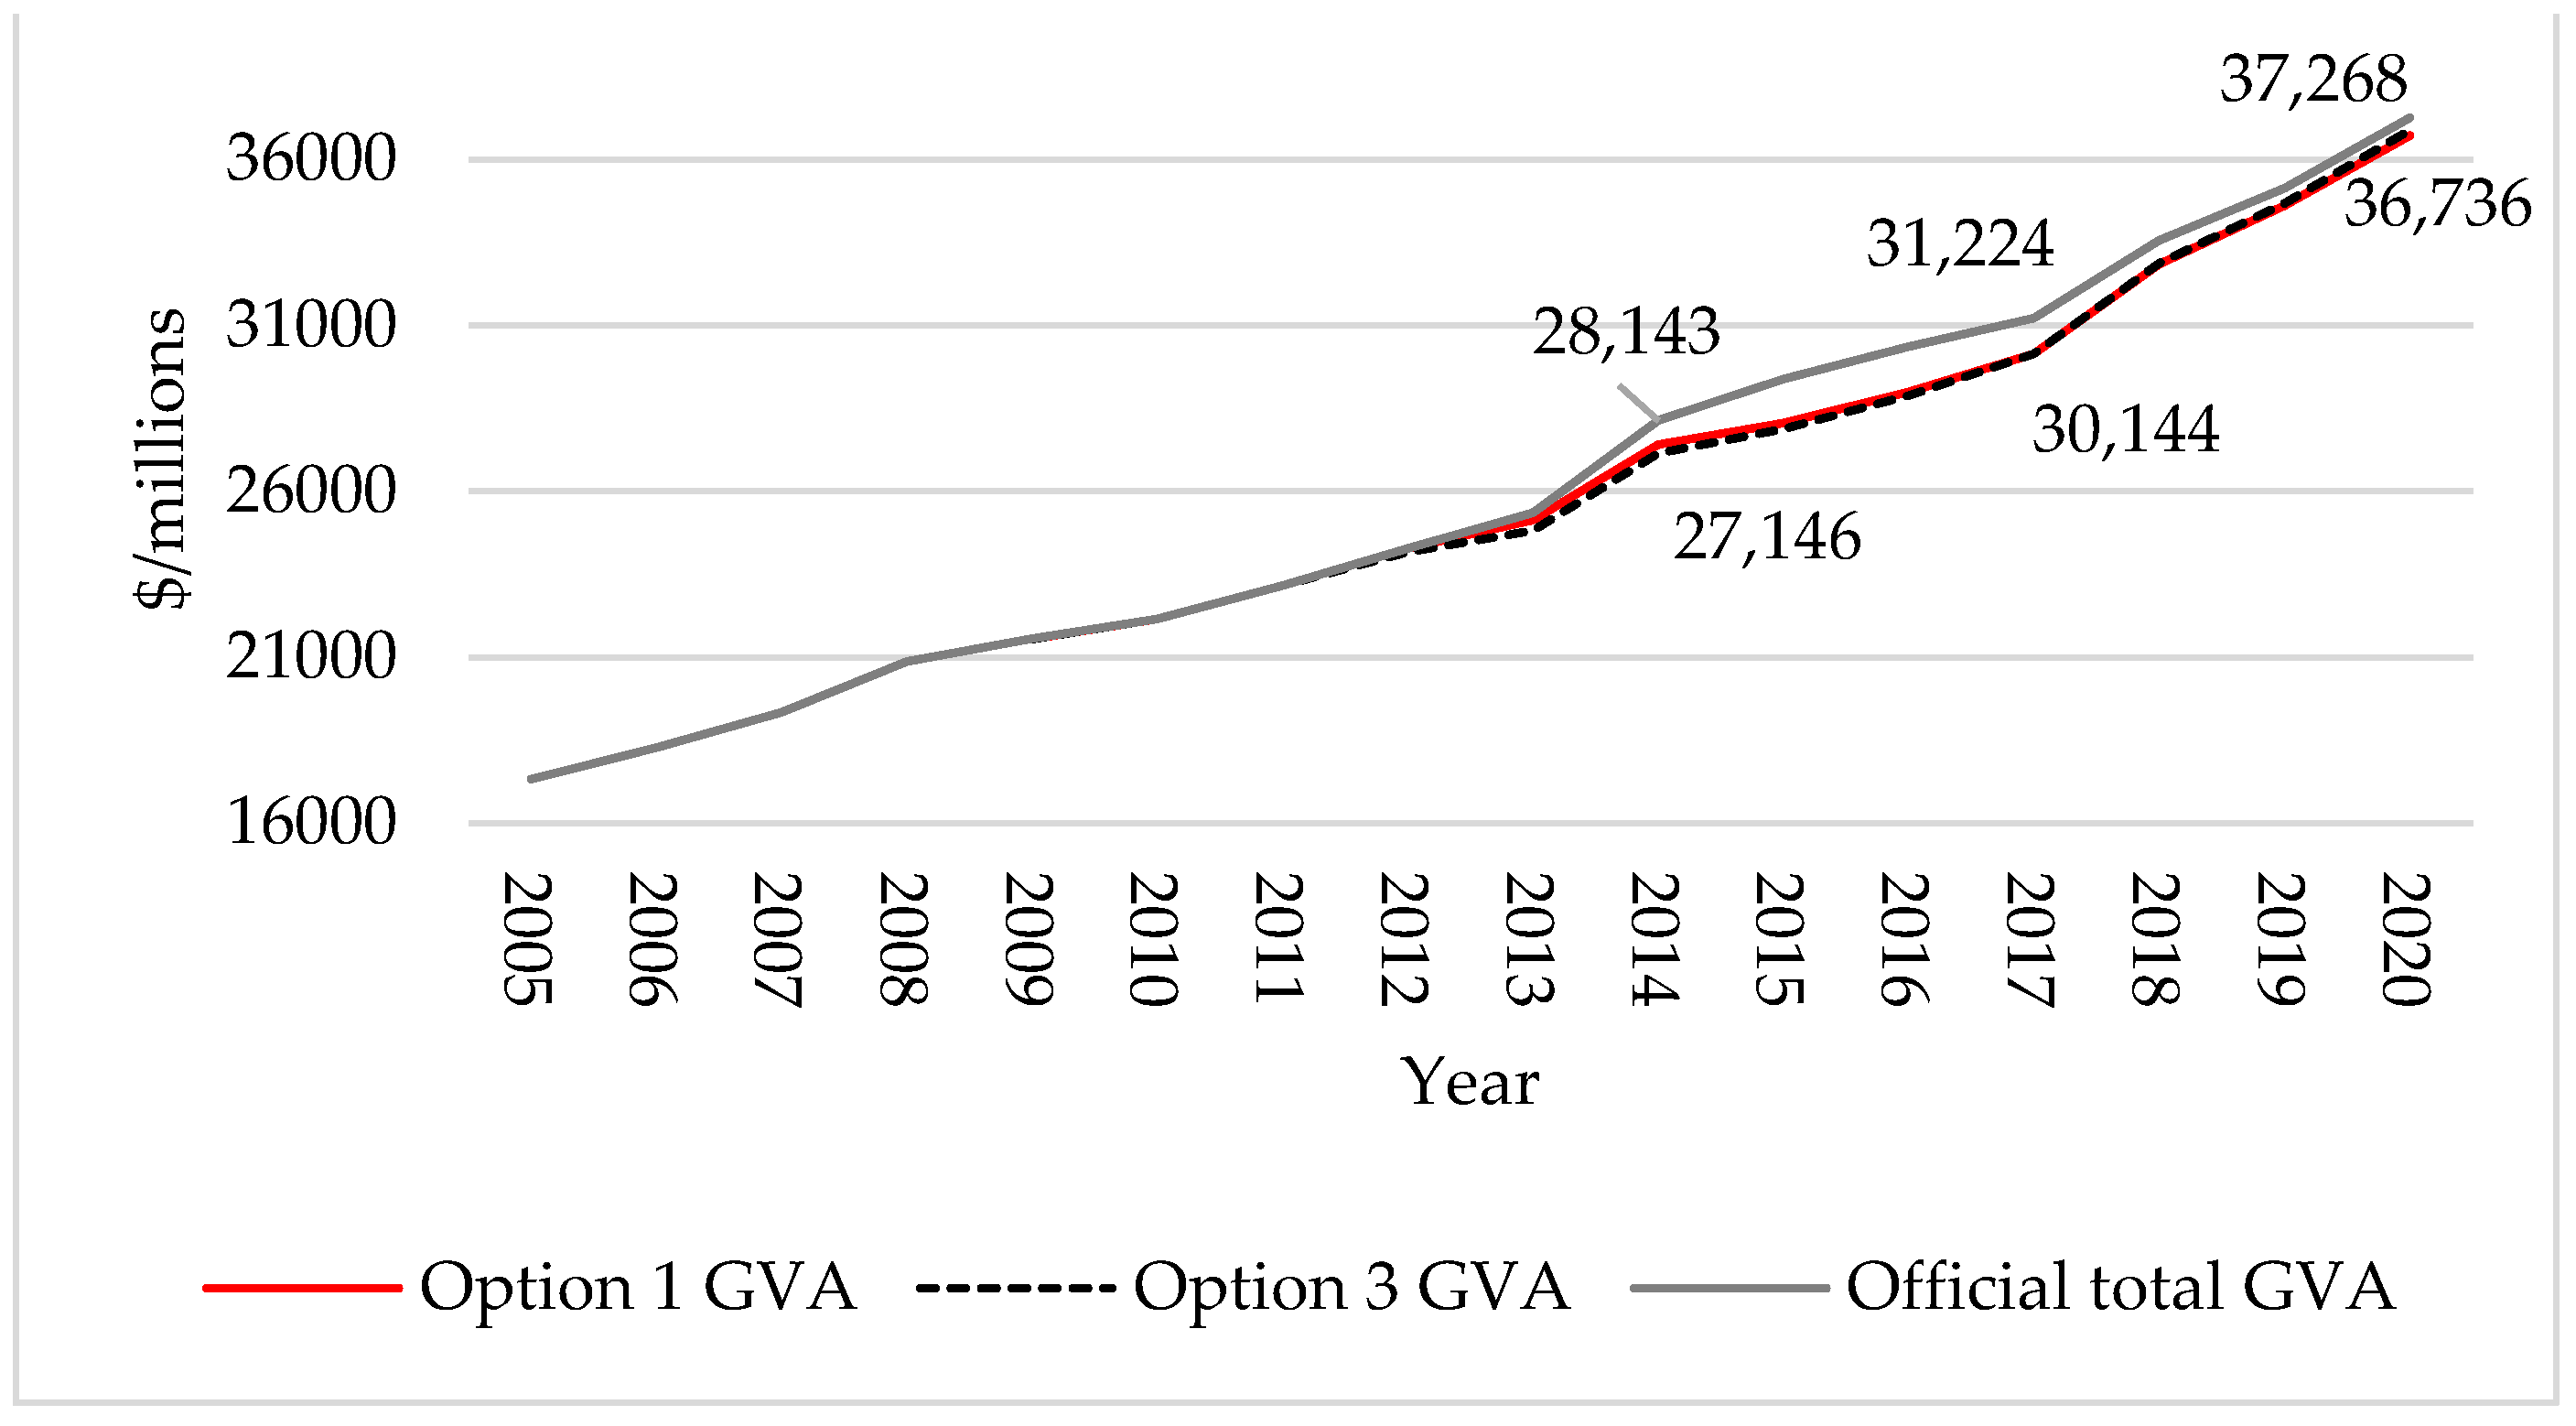
Figure 7 and
Figure 8 show similar results on the value of economic activity (GVA) between 2005 and 2020.
6. Discussion
The results reveal that the performance of the underlying economy follows a similar trend for both options, although Option 3 has a larger negative impact initially in 2013. The overall observation remains similar to the official GVA and employment where the negative impact of the disaster is more noticeable on employment than on GVA. In other words, the earthquakes have led to an initial reduction in employment, while the value of economic activity, although lower than before, remained positive.
A strong rebound in the economy is evident between 2013 and 2014, with official employment and GVA data revealing above-average growth rates. The response in the underlying economy reveals a similar rebound in GVA; however, employment growth suggested a rather modest growth compared to historical growth trends. This changed in 2016/2017 when the growth in employment and GVA of the underlying economy gained momentum and crossed over the official data revealing how the recovery has shifted from its reliance on rebuilding stimulus to the underlying economy as the driver of employment and economic activity for the regional economy.
Prior to 2016/2017, growth in the underlying economy lagged behind the headline economy, primarily due to the elevated levels of activity from the stimulus. However, as the official data suggest declining economic activity and lower demand for labour, it merely reflects the reduction from the lower stimulus and does not reflect a declining and struggling economy, instead the opposite. The stimulus initially adds a 1.5% to 2% performance buffer to the underlying economy for the first three years at which point the growth and momentum transition. The cross-over reveals a transition from a stimulus-driven economy to a demand-driven economy five years after the earthquakes. The duration up until a cross-over is observed is expected to look different for other disasters, depending on the type and scale. Ten years after the 2011 Canterbury earthquakes, economic and employment growth for the underlying economy continues to outperform official economic data and reveals a strong and growing economy.
The increasing rate and scale of recent disasters suggests that governments should be prepared to respond through economic intervention. The success of these interventions, which are often referred to as large-scale stimulus investments or packages, tends to be evaluated over time through official employment and economic (GVA) data (see
Bakkensen and Barragey 2016). However, this data does not give a full account of economic transitions and performance during the recovery. Assessing the performance of the underlying economy, in other words the economy driven by market demand, reveals a better indicator for policymakers to base decisions on.
Local and regional governments rely on official economic data in their decision making and often drive development through economic development agencies. By only utilising the official economic and employment data, they could undervalue the transition that was and is being made by the economy as it moves from the large-scale stimulus to reflecting the normal demand-driven level of activity. Planning, through strategies and policies, would miss the underlying strength that the economy has developed over time, and by assessing the value and performance of the underlying economy it would be able to respond better and support economic initiatives in the economy. The results in Canterbury suggest that responding to the disaster with large stimulus packages supported the economy and jobs in the short term by repairing and rebuilding the infrastructure that was lost. However, the underlying economy’s performance provides encouragement and shows resilience even as official economic indicators suggest otherwise.
There are limitations to the study, particularly regarding the application of the IO model, which assumes that the economic relationship between supply and demand remains constant within the model. The application of the IO models assumes a constant proportionality of inputs throughout the economy. To overcome the static nature of the model, two IO models were used in the analysis, dated 2013 and 2017, to account for possible changes in proportionality during this time. It is expected that unexplained changes will remain in the model. A further limitation relates to the demand-driven scenarios that assume a stable relationship between economic and building activity over the assessment period. Although this eliminates the dynamic relationship between the variables, the historical data suggest that this relationship has remained stable prior to the earthquake and could potentially reach similar stability in the long period.
7. Conclusions
The increasing rate and scale of recent disasters suggests that governments should be prepared to respond through economic intervention. The success of these interventions tends to be evaluated with official employment and economic data, and in doing so, risks underestimating the economy’s transition. Assessing the underlying performance of an economy affected by a disaster through applied methodology remains novel and expands the literature on disasters and economic growth on a sub-national level.
Ten years after the 2011 earthquake, investment levels have dissipated while economic and employment growth nears zero, suggesting that the economy is past its best period. Assessing the level of building activity considered as normal, demand-driven activity, and removing the additional investment value and economic activity as a result of the rebuild stimulus enabled an evaluation of the performance of the underlying economy.
The results reveal that the investment stimulus provides an initial 1.5% to 2% buffer from the underlying economy before the growth rates cross over. After this point, the underlying economy grows at rates above the official economic indicators.
Five years after the earthquake, the economy transitioned from a stimulus-driven economy to a demand-driven economy. By 2021, the level of building activity in the region signified a return to market-driven levels for the first time.
Canterbury’s underlying economy has gained momentum with employment growing at rates above the actual observed rates of the region. As rebuild-related construction activity decreases, the economy looks to the underlying economy for growth. The results suggest that the regional economy is nearing the Keynesian long-period, where the aggregate level of supply and demand matches. Contrary to the overall economic indicators in employment and economic activity, the Canterbury economy is strong and continuing to expand as the large-scale stimulus winds down. Finally, lower levels of investment in the built environment do not suggest a recessionary environment, but rather reveal how the regional economy has been able to transition after a disaster. Local and regional governments should look beyond official data when assessing the performance of their economies, especially in the current environment where disasters and pandemics seem to be prevalent.
Assessing the performance of the underlying economy through the IO approach allows for further study on an industry level. Future research related to this approach would allow for an in-depth assessment of the performance of industries during the recovery of the regional economy.


